Convergent Evolution in Tooth Morphology of Filter Feeding Lamniform Sharks
|
|
|
- Job White
- 5 years ago
- Views:
Transcription

1 Wright State University CORE Scholar Browse all Theses and Dissertations Theses and Dissertations 2016 Convergent Evolution in Tooth Morphology of Filter Feeding Lamniform Sharks Michaela Grace Mitchell Wright State University Follow this and additional works at: Part of the Earth Sciences Commons, and the Environmental Sciences Commons Repository Citation Mitchell, Michaela Grace, "Convergent Evolution in Tooth Morphology of Filter Feeding Lamniform Sharks" (2016). Browse all Theses and Dissertations This Thesis is brought to you for free and open access by the Theses and Dissertations at CORE Scholar. It has been accepted for inclusion in Browse all Theses and Dissertations by an authorized administrator of CORE Scholar. For more information, please contact
2 CONVERGENT EVOLUTION IN TOOTH MORPHOLOGY OF FILTER FEEDING LAMNIFORM SHARKS A thesis submitted in partial fulfillment of the requirements for the degree of Master of Science By MICHAELA GRACE MITCHELL B.S., Northern Kentucky University, Wright State University
3 WRIGHT STATE UNIVERSITY GRADUATE SCHOOL November 4, 2016 I HEREBY RECOMMEND THAT THE THESIS PREPARED UNDER MY SUPERVISION BY Michaela Grace Mitchell ENTITLED Convergent Evolution in Tooth Morphology of Filter Feeding Lamniform Sharks BE ACCEPTED IN PARTIAL FULFILLMENT OF THE REQUIREMENTS FOR THE DEGREE OF Master of Science. Charles N. Ciampaglio, Ph.D. Thesis Director Committee on Final Examination David F. Dominic, Ph.D. Chair, Department of Earth & Environmental Sciences Charles N. Ciampaglio, Ph.D. Stephen J. Jacquemin, Ph.D. Stacey A. Hundley, Ph.D. David A. Schmidt, Ph.D. Robert E. W. Fyffe, Ph.D. Vice President for Research and Dean of the Graduate School
4 ABSTRACT Mitchell, Michaela Grace. M.S. Department of Earth and Environmental Sciences, Wright State University, Convergent Evolution in Tooth Morphology of Filter Feeding Lamniform Sharks. The basking shark (Cetorhinus maximus) and megamouth shark (Megachasma pelagios) are two species of filter feeding sharks, both belonging to the order Lamniformes. There are two conflicting hypotheses regarding the origins of filter feeding in lamniform sharks; that there is a single origin of filter feeding within Lamniformes, or conversely, the filter feeding adaptations have been developed independently due to different ancestral conditions. Evidence obtained from several studies strongly supports the latter hypothesis. Because evidence suggests that C. maximus and M. pelagios have developed their filter feeding adaptations independently, we expect to see convergent evolution taking place within these two lineages. Geometric morphometric analyses were performed on fossil and Recent teeth of megamouth and basking sharks to determine if there is commonality among tooth shape. The results of the analyses support independently derived filter feeding morphologies and convergent evolution within these two lineages. iii
5 TABLE OF CONTENTS Page I. INTRODUCTION 1 Environmental Factors.4 Objectives 4 Rationale. 5 II. BACKGROUND 7 Conflicting Hypotheses..7 Phenetic and Cladistic Studies...8 Molecular Studies 13 III. MATERIALS AND METHODS.15 Description of Specimens...15 Analysis..16 IV. RESULTS 19 Fossil and Recent Megachasma Analysis...19 Fossil and Recent Cetorhinus Analysis...20 Combined Cetorhinus and Megachasma Analysis 21 V. DISCUSSION...25 VI. CONCLUSION...29 Study Concerns.31 APPENDIX A...65 APPENDIX B...70 iv
6 TABLE OF CONTENTS (Continued) Page BIBLIOGRAPHY..73 REFERENCES..75 v
7 LIST OF FIGURES Figure Page 1. Diagram of elasmobranch phylogeny Alternative phylogenetic hypotheses for the relationships among species in Lamniformes Cladogram of Maisey s phylogenetic hypothesis that Megachasma and Cetorhinus are a monophyletic group within Cetorhinidae Megamouth and basking sharks Chondrocrania of megamouth and basking sharks Teeth of megamouth and basking sharks Gill rakers of megamouth and basking sharks Consensus tree showing phylogenetic relationships of lamniform species based on 42 morphological characters Minimum length tree showing phylogenetic relationships of lamniform species based on cytochrome b gene sequences New hypothesis for phylogenetic relationships among lamniform sharks based on cytochrome b gene and NADH-2 gene sequences Eleven landmark points used in morphometric analysis Scatterplot of individual tooth placement for fossil and Recent Megachasma teeth along RWA1 and RWA Scatterplot of individual tooth placement for fossil and Recent Megachasma teeth along RWA1 and RWA Scatterplot of individual tooth placement for fossil and Recent Megachasma teeth along RWA1 and RWA Scatterplot of individual tooth placement for fossil and Recent Cetorhinus teeth along RWA1 and RWA2..46 vi
8 LIST OF FIGURES (Continued) Figure Page 16. Scatterplot of individual tooth placement for fossil and Recent Cetorhinus teeth along RWA1 and RWA Scatterplot of individual tooth placement for fossil and Recent Cetorhinus teeth along RWA1 and RWA Scatterplot of individual tooth placement for fossil and Recent Cetorhinus and Megachasma teeth along RWA1 and RWA Scatterplot of individual tooth placement for fossil and Recent Cetorhinus and Megachasma teeth along RWA1 and RWA Scatterplot of individual tooth placement for fossil and Recent Cetorhinus and Megachasma teeth along RWA1 and RWA Mean tooth shapes from one-way ANOVAs on individual relative warp axes 52 vii
9 LIST OF TABLES Table Page 1. List of species, DNA identification number, collection locality, and collector's name for all samples for which cytochrome b gene sequences were determined List of species, specimen IDs, collection localities, ages, and sources of fossil teeth used in morphometric analyses List of specimens, collection localities, jaw positions, tooth positions, sexes, and sources for Recent Megachasma teeth used in morphometric analyses List of specimens, collection localities, jaw positions, tooth positions, sexes, and sources for Recent Cetorhinus teeth used in morphometric analyses MANOVA results for megamouth shark MANOVA results for basking shark ANOVA results for individual relative warp axes..64 viii
10 ACKNOWLEDGMENTS I would like to thank Wright State University for the departmental funding they have provided, without which this thesis would not have been possible. I am very grateful to my adviser, Dr. Charles Ciampaglio, and committee members, Dr. Stephen Jacquemin, Dr. Stacey Hundley, and Dr. David Schmidt, for their guidance and moral support throughout this project. I would also like to thank Dr. Gordon Hubbell for personally taking photographs from his own collection that were crucial to this thesis. I thank the late Ed Ramirez, who was my best friend, for his constant support of all my endeavors, without which I would not be where I am today. Lastly, I thank my family and friends who have supported me throughout my academic career. ix
11 I. INTRODUCTION Elasmobranchii is a subclass of cartilaginous fish within the class Chondrichthyes. Elasmobranchii consists of sharks, rays, and skates (Figure 1). Of approximately 1,100 species of extant elasmobranchs, only 13 (1.2%) are filter feeders. These filter feeders include the basking shark (Cetorhinus maximus), the megamouth shark (Megachasma pelagios), the whale shark (Rhincodon typus), the manta ray (genus Manta), and nine species of devil ray (genus Mobula). This thesis will focus on the megamouth shark and the basking shark, both belonging to the order Lamniformes. Fossil evidence suggests that elasmobranchs have been primarily predatory from the Devonian Period of the Middle Paleozoic (about 425 million years ago) to the present (Brett & Walker, 2002). The published fossil record suggests that most extant genera of lamniform sharks have late Middle to Late Cretaceous origins (Cappetta, 1987; Ward & Wiest, 1990; Kemp, 1991; Siverson, 1992, 1995; Purdy, 1993; Case, 1994; Martin & Naylor, 1997). The first records of undisputed basking sharks come from the Middle Eocene of Antarctica (Cione & Reguero, 1998; Welton, 2013), and the Eocene of Oregon (Welton 2013). While the earliest substantiated megachasmid record (Megachasma sp.) is from the Early Miocene-Early Pliocene deposits of North Carolina (Purdy et al., 2001; Shimada, 2007), the earliest megachasmid fossils were considered to most likely be from the Middle Eocene (Naylor et al., 1997; Shimada, 2007). However, the megachasmid lineage can now be traced back to the Middle Cenomanian: Late Cretaceous based on material collected from the basal Greenhorn Formation in southeastern Colorado 1
12 (Shimada, 2007). The discovery of this megachasmid (Megachasma comanchensis) marks not only the geologically oldest megachasmid; it also marks the oldest putative filter feeding elasmobranch in the fossil record (Shimada, 2007). Because the oldest megachasmid and cetorhinid fossils are from Middle Eocene deposits, the discovery of a megachasmid in the Middle Cenomanian: Late Cretaceous (ca. 95 ma) extends the fossil record of Megachasmidae (Early Miocene = ca. 20 ma) by 75 million years and that of Cetorhinidae (Middle Eocene = ca. 60 ma) by 35 million years (Shimada, 2007), indicating that, like most extant genera of lamniform sharks, both lineages likely have Late Cretaceous origins and have possibly been living among their predatory counterparts for 95 million years. It is possible these two elasmobranch lineages needed the least morphological modification to make the shift from predation to filter feeding. Lamniform sharks such as the megamouth and basking sharks are characterized by short snouts, long gill slits, and large size (Compagno, 1990). It is possible that these characteristics were an important factor in the dietary shift within these two lineages. Filter feeding adaptations have several drawbacks. Prevailing currents and turbulence are key factors in the distribution of planktonic organisms, making food supply thinly distributed, so significant swimming efficiency is required to find adequate food supply (Tweddle et al., 2005). However, plankton can be moved by advection from upstream and by diffusion from the euphotic zone to where they are available at the benthos (Tweddle et al., 2005). This transport is crucial to supplying the benthos with 2
13 food, so it is possible that competition for planktonic prey at the benthos played a role in the shift from predation to filter feeding (Wolff et al., 1975; Fréchette & Bourget, 1985; Fréchette et al., 1989; Ackerman, 1999; Tweddle et al., 2005). There are also many benefits to filter feeding adaptations. Specialization reduces feeding competition (Martin, 2007). Large size allows increased swimming efficiency, retention of metabolic body heat, which allows for function in cold water, increased energy storage capacity, and increased foraging range (Goldspink, 1977; Kozlowsky, 2000; Martin, 2007) allowing for long distance travel between food patches of worthwhile richness (Martin, 2007). Elasmobranchs commonly change their diet with size because of changes in cranial morphology throughout ontogeny (Dean et al., 2007; Lowry et al., 2007; Espinoza et al., 2015) or for changes in metabolic requirements (Lowe et al., 1996; Kim et al., 2012; Espinoza et al., 2015). Elasmobranchs also segregate spatially by sex, size, and depth during different times of the year, which can lead to seasonal dietary changes (Springer, 1967; Mollet & Cailliet, 2002; Clarke et al., 2014; Espinoza et al., 2015). Physiological and behavioral compensations for changes in the food environment are important factors for a full understanding of filter feeding (Bayne, 1993), so it is possible that seasonal dietary changes played a role in the shift from predation to filter feeding, and that these filter feeding adaptations became fixed within these two lineages under reduced competition. 3
14 ENVIRONMENTAL FACTORS During the Middle and Late Cretaceous, India and Africa rifted away from Gondwanaland, while South America, Antarctica, and Australia remained connected (McLoughlin, 2001). The Pacific Ocean diminished while the Atlantic and Southern Indian Oceans widened (McLoughlin, 2001). The change in size of older seas and the creation of new seas led to a drastic reorganization of deep ocean circulation that accompanied the Late Cretaceous mass extinction event (MacLeod & Huber, 1996). Stable-isotope records indicate that bottom waters in Late Cretaceous oceans in the Southern Hemisphere became cooler and less saline at the same time as wide biotic changes (MacLeod & Huber, 1996). The Cretaceous Extinction caused a 70% to 80% decrease in marine biodiversity at the species level and a 50% decrease at the genus level (Jablonski & Raup, 1995). Benthic foraminifera and radiolaria survived the Cretaceous Extinction with only minor taxonomic changes and 50-90% of planktonic diatoms also survived (MacLeod et al., 1997). Ten species of calcareous nanoplankton survived the Cretaceous Extinction and 30 new species appeared in the Early Tertiary (MacLeod et al., 1997). It is possible that the survival and success of benthic and planktonic organisms played an important role in sustaining the dietary shift from predatory to filter feeding. OBJECTIVES The objectives of this thesis are two-fold. The first is to gain further insight into whether the megamouth and basking sharks evolved their filter feeding adaptations from a single origin or independently from separate origins. Evidence from several 4
15 morphological and molecular studies supports the hypothesis that the megamouth and basking sharks developed their filter feeding adaptations due to different ancestral conditions. We intend to use geometric morphometric analyses of the teeth of each species in conjunction with information from these previous studies to gain further insight into the origins of filter feeding in lamniform sharks. The second objective of this thesis is to determine if there is a common tooth shape to which the megamouth and basking sharks are converging due to their similar filter feeding adaptations. Because evidence supports the hypothesis that the megamouth and basking sharks developed their filter feeding adaptations independently, we hypothesize that convergent evolution is taking place within these two species of lamniform sharks. Geometric morphometric analyses of megamouth and basking shark teeth will also be used to answer this question. RATIONALE The basking and megamouth sharks are very rare, so information regarding their evolutionary trajectories is limited. The origins or their filter feeding adaptations have been the subject of debate for almost 30 years. While there are several morphological and molecular studies that provide insight into the phylogenetic history and origins of filter feeding in lamniform sharks, geometric morphometric techniques have not yet been employed to further answer questions regarding how they developed their filter feeding adaptations, nor has the question of whether the species are converging to a similar tooth shape due to their filter feeding adaptations been addressed. Geometric morphometric 5
16 analyses allow us to analyze the teeth of the megamouth and basking sharks in multiple dimensions and possibly provide more insight into the major similarities and differences between the teeth. This will provide more information about how filter feeding adaptations were developed within the order Lamniformes and whether convergent evolution is taking place within these two species. This new information will be very useful for gaining insight into how these two species have been evolutionarily modified for a filter feeding way of life. 6
17 II. BACKGROUND CONFLICTING HYPOTHESES The basking shark is the only member of the family Cetorhinidae. A formal description naming the genus and species (Cetorhinus maximus) was proposed by Gunnerus (1765). The megamouth shark was discovered in 1976 off the coast of Oahu, Hawaii and is the most recently discovered species of filter feeding elasmobranch. A formal description naming the genus and species (Megachasma pelagios) was proposed by Taylor et al. (1983). Megachasma was included within Lamniformes in its own family, Megachasmidae, based on several observable morphological differences from all other lamniforms (Maisey, 1985). Until the discovery of the megamouth shark, the basking shark was the only filter feeding shark in the order Lamniformes. The discovery of the megamouth shark has led to two conflicting hypotheses regarding the origins of filter feeding in lamniform sharks. Initially, lamniform sharks were grouped together based on phenetics and cladistics (similarities in morphological and other observable traits). Maisey (1985) hypothesized that the megamouth and basking sharks are sister taxa and are both members of the family Cetorhinidae (Figure 2B). If this hypothesis is true, this implies that there is a single origin of filter feeding within Lamniformes (Martin & Naylor, 1997). Conversely, Compagno (1990) hypothesized that the filter feeding adaptations have been developed independently within the two lineages due to different ancestral conditions (Figure 2A). In addition to phenetic and cladistic studies, DNA sequencing studies have been 7
18 performed on lamniform sharks to determine if any genetic evidence supports or refutes either of these hypotheses. The results of these studies provide more evidence that the basking and megamouth sharks developed their filter feeding adaptations independently. PHENETIC AND CLADISTIC STUDIES It has been speculated that Megachasma is the primitive sister group of all other lamniform sharks based on two possibly primitive characteristics: the absence of morphologically differentiated anterior, lateral, and posterior teeth characteristic of all other lamniforms, and the presence of a low, rounded articular process (an orbital process) on the dorsal component of the mandibular arch (Maisey, 1985). Maisey refuted the idea that the teeth and dental morphology of Megachasma are primitive for lamniforms by stating that such a hypothesis is refuted by outgroup comparison with other living shark species (Maisey, 1985). He also argued that orbital processes are too abundant within the fossil record to be considered a primitive arrangement. Maisey suggested that there is a comparable morphological pattern in the dentition of Megachasma and two other filter feeding taxa: Cetorhinus (basking shark) and Rhincodon (whale shark). More specifically, he noted the mandibular suspension and dental array of Cetorhinus very closely resembles that of Megachasma. The similarities in their jaw suspensions and dental arrays were the basis for his hypothesis that Cetorhinus and Megachasma form a monophyletic group of filter feeding elasmobranchs; one in which the two genera may be placed within the family Cetorhinidae (Figure 3). 8
19 In refutation of Maisey s hypothesis, Compagno (1990) stated that phenetic and cladisitic analyses reject the hypothesis that Megachasma and Cetorhinus are sister taxa. He also stated that Megachasma is not the primitive sister group of all lamniforms (Compagno, 1990). Compagno stated that even if Maisey was correct in assuming Megachasma and Cetorhinus are sister groups, their morphological differences disqualify them from being members of the same family. He noted specific differences in the trunk (Figure 4), lateral trunk denticles, head, jaws, nasal capsules, fins, muscles, skin, intestinal valves, and chondrocranial shape (Figure 5) to support his argument that the two species are morphologically too dissimilar to belong to the same family. The trunk of Megachasma is cylindrical but not highly fusiform (Figure 4A) while the trunk of Cetorhinus is cylindrical and fusiform (Compagno, 1990) (Figure 4B). The lateral trunk denticles of Megachasma are small and flat with smooth skin texture, and there are wavy grooves of skin on its fin webs, whereas the lateral trunk denticles of Cetorhinus are large with rough skin texture (Compagno, 1990). There are no wavy grooves of skin on its fin webs, but there are longitudinal grooves of skin on its body (Compagno, 1990). Megachasma has a large, broad, blunt, and long head; the length of the head is greater than the abdomen between the pectoral and pelvic bases (Compagno, 1990). Conversely, Cetorhinus has a narrow, conical, pointed, and relatively short head with a length shorter than the abdomen between the pectoral and pelvic bases (Compagno, 1990). The jaws of Megachasma are long, thick, and stout and are about 1.8 times the length of the cranium while the jaws of Cetorhinus are slender and thin and slightly less than the length of the 9
20 cranium (Compagno, 1990). The nasal capsules of Megachasma are wedge-shaped and situated mostly lateral to suborbital shelves while the nasal capsules of Cetorhinus are subspherical and situated anterior to suborbital shelves (Compagno, 1990). Megachasma has soft skin, flexible and soft fins, and flabby muscles; Cetorhinus has firm skin, stiff fins, and powerful muscles (Compano, 1990). Megachasma has a ring intestinal valve with 24 turns and Cetorhinus has a ring intestinal valve of turns (Compagno, 1990). The chondrocranium of Megachasma is very low and flat (Figure 5A-C) while the chondrocranium of Cetorhinus is high and arched (Compagno, 1990) (Figure 5D-F). Compagno also emphasized that detailed analysis of tooth morphology shows important differences. Megachasma has teeth with large functional crowns and sharp cusps (Figure 6A-C) similar to the teeth of primitive, non-filter feeding lamniforms, whereas the crowns of Cetorhinus teeth are reduced, wedge-shaped, and blunt-tipped (Compagno, 1990) (Figure 6M-O). He also emphasized distinct differences in their filter feeding mechanisms. The gill rakers of Megachasma are slender and papillose (fingerlike) with dermal denticles and a spongy cartilaginous core (Figure 7A) and are arranged irregularly in tight clusters along its gill openings, whereas the gill rakers of Cetorhinus are hair-like (Figure 7B-C) and arranged evenly along its gill openings (Compagno, 1990). Additionally, Megachasma almost certainly never sheds its gill rakers, unlike Cetorhinus, who periodically sheds its gill rakers (Compagno, 1990). Compagno stated that it is unlikely that the two different filtration setups could be derived from each other or from a common ancestor, but could be derived from two different types of non- 10
21 filtering ancestors. He maintained that this is sufficient evidence to also reject the hypothesis that Megachasma and Cetorhinus are sister groups, as well as the idea that there is a single origin of filter feeding within Lamniformes (Compagno, 1990). Shimada (2005) conducted a phylogenetic analysis of 15 extant lamniform species using the genus Scyliorhinus (Carcharhiniformes: Scyliorhinidae) as an outgroup for comparison. Mostly skeletonized jaws from the specimens were used, and the study was based on 42 morphological characters; 37 binary and 5 multistate (Shimada, 2005) (Appendix A). The polarity of character states was determined by outgroup comparison and all character states were recorded as unordered (Shimada, 2005). Recent studies have suggested that Carcharhiniformes is a sister group to Lamniformes, and Scyliorhinidae is one of the closest relatives to the lamniforms, which is why Scyliorhinus was selected as the outgroup for comparison for this study (Shimada, 2005). Parsimony analysis with a heuristic search was undertaken using the computer program Hennig86 (version 1.5, J.S. Farris, Port Jefferson Station, New York, 1988, unpublished) (Shimada, 2005). A strict consensus tree was constructed for the phylogeny of Lamniformes using the computer program CLADOS (version 1.1, K.C. Nixon, Cornell University, Ithaca, New York, 1992, unpublished) (Shimada, 2005) (Figure 8). According to this analysis, Cetorhinus is sister to the lamnid species, which supports Compagno s (1990) hypothesis that Cetorhinus and Megachasma are not sister taxa and that filter feeding adaptations were acquired independently in both species. Relationships among other members of the taxa 11
22 remained unclear, so the sister taxa of Megachasma could not be confirmed (Shimada, 2005). While cladisitic and phenetic studies can be useful in determining phylogenetic relationships among elasmobranchs, there are many drawbacks to this approach. Lamniform sharks are commonly represented in the fossil record, but their cartilaginous skeletons mineralize poorly and they are generally only represented by isolated teeth. The poor preservation of skeletal material and lack of fossil evidence is an even more serious setback when focusing on species such as the megamouth and basking sharks, which tend to be very rare in the fossil record. Also, there is much room for interpretation when determining what morphological features to compare when trying to determine phylogenetic relationships, which is seen in Maisey s (1985) and Compagno s (1990) studies, where each author utilized a different set of morphological criteria on which to base their studies. In his study, Maisey (1985) noted that the definition of an orbital protrusion may be loosely interpreted to describe features found in many extant elasmobranch species. It is very difficult to propose a standard for morphological comparison, especially when fossil evidence is rare. As more fossil evidence becomes available it becomes easier to compare morphological features between species, but even then there are conflicting opinions on the morphological criteria for establishing phylogenetic relationships. Lack of fossil evidence and conflicting opinions of phylogenetic criteria are why phenetic and cladisitic studies often lead to conflicting hypotheses and inconclusive results. 12
23 MOLECULAR STUDIES Martin and Naylor (1997) conducted a phylogenetic analysis of lamniform sharks by analyzing cytochrome b gene sequences for representatives of all genera of lamniform sharks, including Megachasma and Cetorhinus. Cytochrome b was chosen because its sequence variability makes it most useful for comparing species within the same genus or family (Martin & Naylor, 1997). DNA was extracted from unspecified preserved tissue of 25 individuals, representing all but two of 16 species of lamniform sharks (Carcharias noronhai and Odontaspis tricuspidatus were not included), and three outgroup species (Galeocerdo cuvier, Heterodontus franscii, and Urolophus concentricus) (Martin & Naylor, 1997) (Table 1). For each of the 25 individuals, complete (or nearly complete) sequences of the cytochrome b gene were sequenced (Martin & Naylor, 1997). An alignment of phylogenetically informative sites for the lamniform species surveyed is provided in Appendix B. Based on the generated sequences, a minimum length phylogenetic tree for Lamniformes was produced (Figure 9). The results supported the hypothesis that Megachasma and Cetorhinus are not sister taxa and do not belong to the same family, which in turn supported the hypothesis that filter feeding developed independently for the megamouth and basking sharks (Martin & Naylor, 1997). In a similar study, Naylor et al. (1997) repeated the cytochrome b gene sequencing experiment, using unspecified tissue samples from the same 14 lamniform species used in the previous study (Table 1). However, in addition to using the cytochrome b gene, they also used the dihydronicotinamide adenine dinucleotide 13
24 (NADH-2) gene for each specimen. The NADH-2 gene was chosen because its sequencing variability is similar to that of the cytochrome b gene, so the NADH-2 sequence serves as a good basis for comparison with the cytochrome b sequence (Naylor et al., 1997). Additionally, the NADH-2 gene reflects a diminished level of constraint relative to the cytochrome b gene because NADH-2 registers more changes in the sequence than cytochrome b (Naylor et al., 1997). Sequences for both genes were constructed. Using the additional molecular data, a new phylogenetic tree was developed (Figure 10). Although this tree presented a new hypothesis about the overall phylogenetic relationship of lamniform species, it confirmed the hypothesis that Megachasma and Cetorhinus are not sister taxa and are not part of the same family, indicating independent origins of filter feeding for the two species (Naylor et al., 1997). There are many advantages to using DNA sequence data for phylogenetic analyses; specifically, a large amount of discrete and potentially informative characters can be obtained, which helps when there is a lack of morphological features available for comparison. However, it is difficult to extract hierarchal information from molecular data, which makes developing a phylogenetic analysis rather difficult. Site saturation is also a problem, which is when DNA character states become reversed due to multiple substitutions at a site, making it difficult to extract phylogenetic information from patterns in the molecular data, which can lead to inconclusive results (Martin & Naylor, 1997). Additionally, molecular data must be obtainable and is usually not possible to extract from fossil remains. 14
25 III. MATERIALS AND METHODS DESCRIPTION OF SPECIMENS Seventy-three Cetorhinus teeth (24 fossil and 49 Recent) and 72 Megachasma teeth (49 fossil and 23 Recent) photographed in labial view were collected from several publications and private collections (Tables 2, 3, and 4). Twelve Recent Megachasma teeth were from an adult female specimen, eight teeth from an adult male specimen, and three teeth from an immature male specimen. Twenty-six Recent Cetorhinus teeth were from an adult male specimen and 23 teeth from an immature female specimen. Late Miocene through Pleistocene basking sharks from Europe and California are typically referred to the Recent species, C. maximus, or just identified as Cetorhinus sp. (Welton, 2013). Therefore, the fossil specimens used in the analyses are referred to as C. maximus (Table 2). Due to the rarity of megamouth specimens, teeth described as Megachasma sp. but not specifically described as M. pelagios were used in the analyses. These are the specimens from the Kattendijk Formation of Belgium, the Temblor Formation of California, the Yorktown and Pungo River Formations of North Carolina, the Bahía Inglesa Formation of Chile, and Copiapó, Chile (Table 2). The Belgian specimens fit well between the Early Miocene specimens from the Temblor Formation of California and those of the extant M. pelagios (De Schutter, 2009). Specimens collected from Belgium are morphologically very similar to teeth of M. pelagios figured in Herman et al. (1993) and Yabumoto et al. (1997) (De Schutter, 2009), making them appropriate for these analyses. However, specimens identified as M. pelagios have been collected 15
26 from the Yorktown and Bahía Inglesa Formations (De Schutter, 2009), so the specimens described as Megachasma sp. collected from these formations are likely to be M. pelagios as well. The Bahía Inglesa Formation is located in the Caldera Basin of Chile, which stretches along the coastal plain of Caldera to the mouth of the Copiapó River (Le Roux et al., 2016), so the Megachasma specimens collected near Copiapó are also likely to be M. pelagios. The Megachasma specimen collected from the Pungo River Formation is strikingly similar to the specimens collected from the Yorktown Formation, except that it is much smaller. However, size was not a factor in these analyses, so the specimen from the Pungo River Formation was appropriate for these analyses due to its morphological similarity to the probable M. pelagios specimens of the Yorktown Formation. ANALYSIS Geometric morphometrics is a quantitative analysis of morphological shape that uses landmarks instead of measurements, which allows individual specimens to be compared to a common shape configuration in multiple dimensions. Geometric morphometric techniques were used to digitize individual complete Megachasma and Cetorhinus teeth and roots from the left jaw position using a series of 11 fixed and repeatable landmarks (Figure 11) along with a determined scale for each photograph, independent of size (Procrustes analysis), in the software tpsdig (Rohlf 2016, life.bio.sunysb.edu/morph/). Procrustes analysis is used to analyze shape and reduces the effects of scaling, rotation, and translation, which do not alter shape (Kendall, 1977). 16
27 Non-shape information is removed from the coordinates through translation of the shapes to the same position, scaling the shapes to unit baseline length, and rotating the shapes to the same orientation (Bookstein, 1991). Relative warp analysis (RWA) was used to ordinate tooth shapes of all individuals in the software tpsrelw (Rohlf 2016, life.bio.sunysb.edu/morph/) and to compare overall tooth shape between the two species. Relative warp analysis is used to analyze shape variation among individuals by comparing the relative position of corresponding landmarks in a sample in reference to the Procrustes shape configuration (Zelditch et al., 2004). Three separate geometric morphometric analyses were performed: a comparison of fossil and Recent Megachasma teeth, a comparison of fossil and Recent Cetorhinus teeth, and an overall comparison of fossil and Recent teeth for both species combined. Resulting multivariate axes were interpreted using percent variation explained and compared by species. Axes that accounted for 5% or more of the morphological variation were considered significant. For the first two analyses, a series of multivariate analyses of variance (MANOVA) with a Wilks statistic were used to test the first four RWA axes for monognathic heterodonty using tooth position as an independent variable, diagnathic heterodonty using jaw position (upper or lower) as an independent variable, gynandric heterodonty using sex as an independent variable, and morphological differences between fossil and Recent teeth using age (fossil or Recent) as an independent variable. Each RWA axis was treated as a dependent variable. Each independent variable had to be tested separately due to incomplete data. A series of two-sample t-tests analyzed the 17
28 significant variables on each RWA axis. For the third analysis, one-way analyses of variance (ANOVA) and corresponding Tukey tests (95% CI) were used on each RWA axis to test for morphological differences in fossil and Recent teeth of both species. 18
29 IV. RESULTS FOSSIL AND RECENT MEGACHASMA ANALYSIS Relative warp analysis produced four significant axes that explained 85% of the morphological variation in fossil and Recent Megachasma teeth (Figures 12, 13, and 14). Tooth spline deformation grids show morphological shapes of the teeth on each axis extreme (Figures 12, 13, and 14). The negative extreme of RWA1 shows a wide root that is proportionate to a wide crown with pronounced curvature, whereas the positive extreme shows a wide root with a slender crown with less pronounced curvature (Figure 12). The positive extreme of RWA1 shows the most slender crown in the analysis (Figure 12). The negative extreme of RWA2 shows both the smallest root and crown in the analysis, with the crown showing almost no curvature, and the positive extreme shows the most robust root in the analysis as well as a wide crown with very pronounced curvature (Figure 12). The negative extreme of RWA3 shows a wide root with a more slender crown that shows slight curvature, whereas the positive extreme shows a wide root and a robust crown with pronounced curvature (Figure 13). The negative extreme of RWA4 shows a wide root that is proportional to a wide crown that shows the most curvature in the analysis, while the positive extreme shows a wide root that is proportional to a crown that shows almost no curvature (Figure 14). The MANOVAs showed significant differences in the morphologies of fossil and Recent teeth and also tested significant for monognathic and gynandric heterdonty (Table 5). A Pearson correlation test showed significant directionality for monognathic 19
30 heterodonty on RWA2 (p = 0.016); posterior teeth had more positive values (Figure 12). Two-sample t-tests showed significant differences between RWA1, RWA2, RWA3, and RWA4 and tooth position [t(11) = -4.29, p = 0.001]. There were also significant differences between fossil and Recent teeth and RWA1 [t(87) = , p < 0.001], RWA2 [t(78) = , p < 0.001], RWA3 [t(73) = , p < 0.001], and RWA4 [t(72) = , p < 0.001]. Two different series of two-sample t-tests were performed on each RWA axis for sex. The first series included the three immature male teeth. The twosample t-tests showed significant differences in sex and RWA1 [t(23) = , p < 0.001], RWA2 [t(22) = , p < 0.001], RWA3 [t(22) = , p < 0.001], and RWA4 [t(22) = , p < 0.001]. The second series of two-sample t-tests did not include the three immature male teeth. There were significant differences in sex and RWA1 [t(20) = , p < 0.001], RWA2 [t(19) = , p < 0.001], RWA3 [t(19) = , p < 0.001], and RWA4 [t(19) = , p < 0.001]. FOSSIL AND RECENT CETORHINUS ANALYSIS Relative warp analysis produced four significant axes that explained 80% of the morphological variation in fossil and Recent Cetorhinus teeth (Figures 15, 16, and 17). The negative extreme of RWA1 shows the most slender root in the analysis with a proportionally slender crown that shows no curvature and the positive extreme shows the most robust root in the analysis with a wide crown that shows the most pronounced curvature in the analysis (Figure 15). The negative extreme of RWA2 shows a slender root and a proportionately slender crown with pronounced curvature while the positive 20
31 extreme shows a robust root with the widest crown in the analysis showing no curvature (Figure 15). The negative extreme of RWA3 shows a slender root with a proportionately slender crown that shows little curvature and the positive extreme shows a wide root and a wide crown that shows little curvature (Figure 16). The negative extreme of RWA4 shows a moderately wide root and a wide crown that shows little curvature, whereas the positive extreme shows a moderately wide root and a moderately wide crown that shows almost no curvature (Figure 17). The MANOVAs showed significant differences in the morphologies of fossil and Recent teeth and also tested significant for gynandric heterodonty (Table 6). However, gynandric heterodonty cannot be accounted for because we are comparing adult male and immature female basking sharks, so ontogenetic heterodonty may be the reason for the morphological differences. A series of two-sample t-tests showed significant differences between fossil and Recent teeth and RWA1 [t(83) = , p < 0.001], RWA2 [t(75) = , p < 0.001], RWA3 [t(74) = , p < 0.001], and RWA4 [t(73) = , p < 0.001]. COMBINED CETORHINUS AND MEGACHASMA ANALYSIS In this analysis, fossil and Recent Megachasma teeth were combined with fossil and Recent Cetorhinus teeth for a total of 145 specimens. Relative warp analysis produced four significant axes that explained 82% of the morphological variation in fossil and Recent Megachasma and Cetorhinus teeth (Figures 18, 19, and 20). The negative extreme of RWA1 shows a Megachasma tooth shape that has the most robust root and 21
32 the most slender crown in the analysis (Figure 18). The crown shows little curvature (Figure 18). The positive extreme of RWA1 shows a Cetorhinus tooth shape with a moderately slender root and a wide crown that shows very little curvature (Figure 18). The negative extreme of RWA2 shows a Megachasma tooth shape with a wide root and a wide crown that shows pronounced curvature and the positive extreme shows a Cetorhinus tooth shape with a slender root and a very slender crown that shows no curvature (Figure 18). The negative extreme of RWA3 shows a Cetorhinus tooth shape with a wide root and a moderately wide crown that shows pronounced curvature while the positive extreme shows a Megachasma tooth shape with a wide root and a wide crown that shows no curvature (Figure 19). The negative extreme of RWA4 shows a Cetorhinus tooth shape with a wide root and robust crown that shows pronounced curvature while the positive extreme shows a Megachasma tooth shape with a moderately wide root and a moderately slender crown that shows almost no curvature (Figure 20). The one-way ANOVAs and Tukey tests showed significant morphological differences between categories (Cetorhinus fossil, Cetorhinus Recent, Megachasma fossil, and Megachasma Recent) on all four RWA axes (Figure 21, Table 7). On RWA1, all four categories were significantly different (Figure 21, Table 7). Cetorhinus Recent had the highest mean (M = , SD = ), followed by Cetorhinus fossil (M = , SD = ), Megachasma fossil (M = , SD = ), and Megachasma Recent, which had the most negative mean (M = , SD = ). Mean tooth shapes on RWA1 showed a widening of the root and a diminishing of the 22
33 crown for both megamouth and basking shark as mean values went from positive to negative, with all mean tooth shapes showing slight curvature (Figure 21). On RWA2, Megachasma Recent had the most positive mean (M = , SD = ) followed by Cetorhinus Recent (M = , SD = ), Megachasma fossil (M = , SD = ), and Cetorhinus fossil, which had the most negative mean (M = , SD = ). There was no significant difference between mean Megachasma Recent and mean Cetorhinus Recent tooth shapes (Figure 21, Table 7). There was a significant difference between mean Cetorhinus fossil and mean Megachasma fossil tooth shapes, and mean fossil tooth shapes of both species were significantly different from the mean Recent tooth shapes of each species (Figure 21, Table 7). The mean tooth shape of Megachasma Recent and Cetorhinus Recent show a slender root and crown with little curvature (Figure 21). As mean values on RWA2 become more negative, the mean tooth shapes of Megachasma fossil and Cetorhinus fossil show an increasing widening of both roots and crowns, with crowns showing more pronounced curvature (Figure 21). On RWA3, Megachasma fossil had most positive mean, (M = , SD = ), followed by Megachasma Recent (M = , SD = ), Cetorhinus Recent (M = , SD = ), and Cetorhinus fossil, which had the most negative mean (M = , SD = ). There was no significant difference between mean Megachasma fossil and mean Megachasma Recent tooth shapes and there was also no significant difference between mean Megachasma Recent and mean 23
34 Cetorhinus Recent tooth shapes (Figure 21, Table 7). There were significant differences between mean Megachasma fossil, mean Cetorhinus Recent, and mean Cetorhinus fossil tooth shapes (Figure 21, Table 7). The mean tooth shape of Megachasma fossil shows a moderately wide root and a wide crown that shows little curvature (Figure 21). As mean values on RWA3 become more negative, the mean Cetorhinus Recent and Cetorhinus fossil tooth shapes show little change in root width with a slight diminishing and more pronounced curvature of the crown (Figure 21). On RWA4, Megachasma fossil had the most positive mean (M = , SD = ), followed by Cetorhinus Recent (M = , SD = ), Cetorhinus fossil (M = , SD = ), and Megachasma Recent, which had the most negative mean (M = , SD = ). There was no significant difference in mean Megachasma fossil, Cetorhinus fossil, and Cetorhinus Recent tooth shapes (Figure 21, Table 7). There was also no significant difference in mean Cetorhinus fossil, Cetorhinus Recent, and Megachasma Recent tooth shapes (Figure 21, Table 7). There was a significant difference between mean Megachasma fossil and Megachasma Recent tooth shapes (Figure 21, Table 7). The mean Megachasma fossil tooth shape shows a moderately robust root with a moderately wide crown that shows slight curvature (Figure 21). As mean values on RWA4 become more negative the mean Megachasma Recent tooth shape shows a slightly more robust root and wider crown with slight curvature (Figure 21). 24
35 V. DISCUSSION The variation in tooth shape shown in these analyses provides more evidence that filter feeding adaptations evolved independently in the basking and megamouth sharks. Overall, Megachasma showed wider root widths than Cetorhinus. In the fossil and Recent Megachasma analysis, there was more variation in the Recent teeth than in the fossil teeth. The male Recent teeth overlapped with the fossil teeth and both generally showed moderately robust to robust roots with proportionally wide crowns. The exception was the negative extreme of RWA2, which showed a slender root and crown. The Recent female teeth showed wide roots and slender crowns on all significant RWA axes. There was much less variation in the fossil and Recent Cetorhinus analysis. On all significant RWA axes, the fossil teeth had noticeably more robust roots and crowns while the Recent teeth had much more slender roots and crowns, and there was very little overlap between fossil and Recent teeth. While both analyses showed a significant difference between the mean shapes of fossil and Recent teeth, the variation and overlap of the fossil and Recent Megachasma teeth suggests that the general tooth shape has not changed as significantly over time as the Cetorhinus teeth. This could mean that there is less selective pressure on Cetorhinus for the use of its teeth than for Megachasma, which may indicate that Cetorhinus is the more primitive of the two species and acquired its filter feeding adaptations before Megachasma. Also, the megamouth shark tested significant for monognathic heterodonty, while the basking shark did not. While this 25
36 study could not verify gynandric heterodonty in the basking shark, Welton (2013) states that the basking shark shows no gynandric heterodonty. The megamouth shark does show gynandric heterodonty, which is possibly a result of food partitioning to reduce competition for food sources a behavior that has been observed in other elasmobranch species (Sommerville et al., 2011). The lack of heterodonty in the basking shark versus the present heterodonty in the megamouth shark also suggests that the basking shark is the more primitive of the two species and that they acquired their filter feeding adaptations from separate origins. Although both the megamouth and basking sharks have strictly planktonic diets, the basking shark inhabits the pelagic zone where plankton flourishes, while the megamouth shark inhabits the mesopelagic zone where plankton is more scarce. Thus, it is possible that the megamouth shark relies on its teeth to secure food to a greater degree than the basking shark. The combined Cetorhinus and Megachasma analysis shows evidence for both convergent and divergent evolution. Relative warp analysis is a multi-dimensional analysis of tooth shape, so it is possible to see both convergence and divergence on different axes. On RWA1, there was a significant difference between all four categories. Recent Megachasma had the most negative mean and Recent Cetorhinus had the most positive mean. This suggests divergent evolution between the two species. The mean tooth shapes on RWA1 show that over time, the basking shark s root has become smaller while the crown remained similar in size to that of the fossil basking shark teeth, and the megamouth shark s root has become wider and the crown has become more slender. 26
37 On RWA2, there was a significant difference between the mean Megachasma fossil and Cetorhinus fossil tooth shapes, but there was no significant difference in the mean Recent Megachasma and Recent Cetorhinus tooth shapes, which suggests convergent evolution between the two species. The mean tooth shapes on RWA1 show that both fossil megamouth and basking shark teeth had wide roots and crowns and have converged to a tooth shape that shows the development of a much smaller root and a more slender crown over time. On RWA3, there were no significant differences between the mean fossil tooth shape for the megamouth shark and the mean Recent tooth shapes for the megamouth and basking sharks, which suggests convergent evolution between the two species. There were significant differences between the mean fossil tooth shapes for the megamouth and basking shark and the mean Recent tooth shape for the basking shark. The mean tooth shapes on RWA3 show that over time, the mean fossil tooth shape for the megamouth shark has not changed, with both fossil and Recent tooth shapes showing nearly identical shaped roots and crowns. However, over time, the mean fossil basking shark tooth shape has changed with the crown becoming wider and the root remaining nearly the same shape as the Recent basking shark, Recent megamouth shark, and fossil megamouth teeth. On RWA4, there was no significant difference between the fossil and Recent Cetorhinus mean tooth shape, which shows the mean shape of the basking shark teeth did not change. There was only a significant difference between the mean fossil and Recent 27
38 tooth shapes for the megamouth shark. Over time, the root of the megamouth shark teeth has stayed about the same size, but the size of the crown has increased. Despite the change in the mean tooth shape of the megamouth shark, neither its mean fossil nor its mean Recent tooth shape was significantly different from the mean fossil or Recent tooth shape of the basking shark, which suggests convergent evolution between the two species. 28
39 VI. CONCLUSION The origins of filter feeding in lamniform sharks have been the subject of debate since the discovery of the megamouth shark in Maisey (1985) hypothesized that there is a single origin of filter feeding within Lamniformes. Conversely, Compagno (1990) hypothesized that the filter feeding adaptations have been developed independently within the two lineages due to different ancestral conditions. Morphological phylogenetics were the basis of both studies. Shimada s (2005) morphological study supported Compagno s hypothesis. In addition to morphological studies, DNA sequencing studies of the cytochrome b gene (Martin and Naylor, 1997) and the NADH-2 gene (Naylor et al., 1997) have been performed on lamniform sharks and the results of these studies also supported Compagno s hypothesis that filter feeding adaptations developed independently within the megamouth and basking sharks. Because evidence shows that the megamouth and basking sharks acquired their filter feeding adaptations independently from separate origins, we hypothesized that convergent evolution is taking place within these two species. To test this hypothesis, geometric morphometric Procrustes analyses of fossil and Recent megamouth and basking shark teeth were used to determine if there is a similar tooth shape shared by the two species. The results of the first two analyses support the hypothesis that the megamouth and basking sharks acquired their filter feeding adaptations independently. The shape of the megamouth shark teeth show wider roots and crowns in both fossil and Recent teeth, 29
40 whereas the Recent teeth of the basking shark have become much smaller in both the root and crown compared to the fossil teeth. The megamouth shark shows monognathic and gynandric heterodonty, whereas the basking shark does not. Both the drastic reduction of the root and crown and the lack of heterodonty in the basking shark teeth could mean that there is less selective pressure for the use of its teeth than for the megamouth shark, possibly making it the more primitive of the two species, which, if true, would make it likely that the basking shark acquired its filter feeding adaptations before the megamouth shark. The results of the combined analysis support the hypothesis that convergent evolution is taking place within the two species. Although RWA1 shows evidence of divergence, RWA2, RWA3, and RWA4 show evidence of convergent evolution. The most pronounced evidence of convergent evolution is on RWA2, showing that over time both the crowns and roots of the megamouth and basking sharks have become much smaller. Procrustes relative warp analysis is a multi-dimensional assessment of shape, so it is possible to see both convergence and divergence on different parts of the teeth. It is possible that exaptation played a role in the development of filter feeding adaptations within the megamouth and basking sharks. Lamniform sharks are large with short snouts and long gill slits and it is likely that these sharks needed little modification to transition from predation to filter feeding. It is also likely that the Post-Cretaceous explosion of diversity that resulted in the radiation of planktonic prey and the creation of new habitats and feeding niches played an important role in the transition from a 30
41 predatory to a filter feeding lifestyle within these two species of lamniform sharks. For these two filter feeding species to persist alongside their predatory counterparts for the past 95 million years shows the benefits of filter feeding clearly outweigh the drawbacks. STUDY CONCERNS Due to the rarity of these species and the subsequent lack of specimens, specific data regarding tooth and jaw position was not complete, especially for the megamouth shark. Because of missing data, each independent variable had to be tested separately and we were unable to test for interactions in the MANOVAs. Small sample sizes are also a concern. Due to the need for the teeth to be photographed in the same view and position (labial view, left jaw position allowed for the most specimens) we were only able to obtain 24 fossil teeth for C. maximus and 23 Recent teeth for M. pelagios. However, with the data available, the results of this study, while preliminary, further support Compagno s hypothesis that filter feeding adaptations in the megamouth and basking sharks were acquired independently from separate origins, as well as the hypothesis that convergent evolution is taking place within these two species of lamniform sharks. 31
42 Figure 1: Diagram of elasmobranch phylogeny. Filter feeding taxa are highlighted in bold and the lamniform sharks are highlighted in red. Adapted from Douady et al. (2003). 32
43 Figure 2: Alternative phylogenetic hypotheses for the relationships among species in Lamniformes. A, Compagno s hypothesis is illustrated; B, Maisey s hypothesis is illustrated. Open rectangles represent origination of filter feeding. Adapted from Martin & Naylor (1997). 33
44 Figure 3: Cladogram of Maisey s phylogenetic hypothesis that Megachasma and Cetorhinus are a monophyletic group within Cetorhinidae. Characters defining nodes as follows: A, lamniform characters given by Compagno (1973, 1977); B, plesodic pectoral radials; C, median rostral cartilage in part dorsal to lateral rostral bars; simplified tooth cusp and root morphology, loss of dental differentiation, increase in number of tooth rows; enlarged gill rakers extending to margins of gill openings, covered by modified oropharyngeal scales; D, plesodic dorsal radials. Adapted from Maisey (1985). 34
; B, basking shark, Cetorhinus")
45 Figure 4: Megamouth and basking sharks. A, megamouth shark, Megachasma pelagios (adult male); B, basking shark, Cetorhinus maximus (adult male). Adapted from Compagno (1990). 35
; D-F, Cetorhinus maximus (adult male); in dorsal (A, D), ventral (B, E),")
46 Figure 5: Chondrocrania of megamouth and basking sharks. A-C, Megachasma pelagios (adult male); D-F, Cetorhinus maximus (adult male); in dorsal (A, D), ventral (B, E), and lateral (C, F) views. Adapted from Compagno (1990). 36
47 Figure 6: Teeth of megamouth and basking sharks. A-D, Megachasma pelagios, tooth in A, labial; B, lingual; C, lateral; and D, basal views; M-O, Cetorhinus maximus, tooth in M, labial; N, basal; and O, lateral views. Adapted from Compagno (1990). 37
. B, Cetorhinus maximus gill rakers; C, Cetorhinus maximus gill raker in lateral view.")
48 A B C Figure 7: Gill rakers of megamouth and basking sharks. A, Megachasma pelagios gill raker completely covered by overlapping denticles. The raker core is hyaline cartilage. Adapted from Paig-Tran & Summers (2014). B, Cetorhinus maximus gill rakers; C, Cetorhinus maximus gill raker in lateral view. Gill rakers are long and keratinous with no cartilaginous core (Paig-Tran & Summers, 2014). Adapted from Cappetta (2012). 38
49 Figure 8: Consensus tree showing phylogenetic relationships of lamniform species based on 42 morphological characters. M. pelagios and C. maximus are highlighted in red. Adapted from Shimada (2005). 39
50 Figure 9: Minimum length tree showing phylogenetic relationships of lamniform species based on cytochrome b gene sequences. Megachasma and Cetorhinus are highlighted in red. Adapted from Martin & Naylor (1997). 40
51 Figure 10: New hypothesis for phylogenetic relationships among lamniform sharks based on cytochrome b gene and NADH-2 gene sequences. M. pelagios and C. maximus are highlighted in red. Adapted from Naylor et al. (1997). 41

52 Figure 11: Eleven landmark points used in morphometric analyses. 1, tip of mesial lobe; 2, outer mesial edge; 3, mesial junction point of crown and root; 4, half the distance between points 3 and 5 on mesial edge; 5, tip of the crown; 6, half the distance between points 5 and 7 on distal edge; 7, distal junction point of crown and root; 8, outer distal edge; 9, tip of distal lobe; 10, center of the outer edge of the root; 11, center of the inner edge of the root. Photograph of tooth from Cappetta (2012). 42

53 Figure 12: Scatterplot of individual tooth placement for fossil and Recent Megachasma teeth along RWA1 and RWA2. Percent variation for each axis is explained in parentheses. Polygons show overlap between fossil and Recent teeth. Green squares represent Recent male teeth and yellow squares represent Recent female teeth. Monognathic heterodonty is represented on RWA2 with an arrow, showing that posterior teeth have more positive values. Thin spline deformation grids represent tooth shapes on negative and positive extremes for each axis. 43
54 Figure 13: Scatterplot of individual tooth placement for fossil and Recent Megachasma teeth along RWA1 and RWA3. Percent variation for each axis is explained in parentheses. Polygons show overlap between fossil and Recent teeth. Green squares represent Recent male teeth and yellow squares represent Recent female teeth. Thin spline deformation grids represent tooth shapes on negative and positive extremes for each axis. 44
 Figure 14: Scatterplot of individual tooth placement for fossil and Recent Megachasma teeth along RWA1 and RWA4. Percent variation for each axis is explained in parentheses.")
55 RWA4 (5%) Fossil Recent RWA1 (51%) Figure 14: Scatterplot of individual tooth placement for fossil and Recent Megachasma teeth along RWA1 and RWA4. Percent variation for each axis is explained in parentheses. Polygons show overlap between fossil and Recent teeth. Green squares represent Recent male teeth and yellow squares represent Recent female teeth. Thin spline deformation grids represent tooth shapes on negative and positive extremes for each axis. 45

56 Figure 15: Scatterplot of individual tooth placement for fossil and Recent Cetorhinus teeth along RWA1 and RWA2. Percent variation for each axis is explained in parentheses. Polygons show overlap between fossil and Recent teeth. Thin spline deformation grids represent tooth shapes on negative and positive extremes for each axis. 46

57 Figure 16: Scatterplot of individual tooth placement for fossil and Recent Cetorhinus teeth along RWA1 and RWA3. Percent variation for each axis is explained in parentheses. Polygons are used to show overlap between fossil and Recent teeth. Thin spline deformation grids represent tooth shapes on negative and positive extremes for each axis. 47

58 Figure 17: Scatterplot of individual tooth placement for fossil and Recent Cetorhinus teeth along RWA1 and RWA4. Percent variation for each axis is explained in parentheses. Polygons are used to show overlap between fossil and Recent teeth. Thin spline deformation grids represent tooth shapes on negative and positive extremes for each axis. 48
59 Figure 18: Scatterplot of individual tooth placement for fossil and Recent Cetorhinus and Megachasma teeth along RWA1 and RWA2. Percent variation for each axis is explained in parentheses. Polygons are used to show overlap between species and fossil and Recent teeth. Thin spline deformation grids represent tooth shapes on negative and positive extremes for each axis. 49
60 Figure 19: Scatterplot of individual tooth placement for fossil and Recent Cetorhinus and Megachasma teeth along RWA1 and RWA3. Percent variation for each axis is explained in parentheses. Polygons are used to show overlap between species and fossil and Recent teeth. Thin spline deformation grids represent tooth shapes on negative and positive extremes for each axis. 50
61 Figure 20: Scatterplot of individual tooth placement for fossil and Recent Cetorhinus and Megachasma teeth along RWA1 and RWA4. Percent variation for each axis is explained in parentheses. Polygons are used to show overlap between species and fossil and Recent teeth. Thin spline deformation grids represent tooth shapes on negative and positive extremes for each axis. 51
 RWA1 MR(A),")
 MR(AB)")


, Megachasma")

.")


62 CR(A) CF(B) MF(C) MR(D) RWA1 MR(A), CR(A) MF(B) CF(C) RWA2 MF(A) MR(AB) CR(B) CF(C) RWA3 Figure 21: Mean tooth shapes from one-way ANOVAs on individual relative warp axes. Categories are: Megachasma fossil (MF), Megachasma Recent (MR), Cetorhinus fossil (CF), and Cetorhinus Recent (CR). Mean tooth shapes are shown from most positive to most negative means. Categories that do not share a letter are significantly different. 52

, Cetorhinus fossil (CF), and Cetorhinus Recent (CR).")

63 MF(A) CR(AB), CF(AB) MR(B) RWA4 Figure 21 (Continued): Mean tooth shapes from one-way ANOVAs on individual relative warp axes. Categories are: Megachasma fossil (MF), Megachasma Recent (MR), Cetorhinus fossil (CF), and Cetorhinus Recent (CR). Mean tooth shapes are shown from most positive to most negative means. Categories that do not share a letter are significantly different. 53
64 Table 1: List of species, DNA identification number, collection locality, and collector's name for all samples for which cytochrome b gene sequences were determined. Adapted from (Martin & Naylor, 1997). Species ID Locality Collector Alopius pelagicus AlsuBJ133 Baja California, Mexico J. Caira A. pelagicus AlpeTai81 Taiwan Chen A. vulpinus Alvu429 Long Island, NY, USA G. Naylor A. vulpinus AlvuMM13 Japan M. Miya A. superciliosus Alsu622 Florida, USA G. Naylor A. superciliosus AlsuTai Taiwan Chen Carcharodon carcharias CacaNA East Coast, USA G. Naylor C. carcharias CacaCA1 Farallon Is., CA, USA K. Goldman Cetorhinus maximus 1058 Plymouth, UK D. Sims C. maximus CemaJS1 Tasmania, Australia J. Stevens Carcharias taurus 627 Georgia, USA G. Naylor C. taurus CataSA1 South Africa G. Cliff Isurus oxyrinchus 412 G. Naylor I. paucus 614 Florida Keyes, USA D. de Maria Lamna ditropis LadiMM12 Japan M. Miya L. nasus 633 Gulf of Maine G. Naylor Mitsukurina owstoni 1057 Australia G. Naylor M. owstoni MiowMM1 Japan M. Miya Megachasma pelagios Mepe1 Japan K. Yano/M. Miya Odontaspis ferox Odfe J. Castro Pseudocarcharias kamoharai Pska Taiwan S. Young 54
65 Table 1 (Continued): List of species, DNA identification number, collection locality, and collector's name for all samples for which cytochrome b gene sequences were determined. Adapted from (Martin & Naylor, 1997). Species ID Locality Collector Outgroups Galeocerdo cuvier Gacu553 Hawaii, USA G. Naylor Heterodontus franscii Hefr California, USA A. Martin Urolophus concentricus Urco Baja California, Mexico A. Martin 55
66 Table 2: List of species, specimen IDs, collection localities, ages, and sources of fossil teeth used in morphometric analyses. Species Specimen Locality Age Source Megachasma sp. Plate 2B Kattendijk Fm. Early Pliocene De Schutter (2009) Megachasma sp. Plate 3B Kattendijk Fm. Early Pliocene De Schutter (2009) Megachasma sp. Plate 4B Kattendijk Fm. Early Pliocene De Schutter (2009) Megachasma sp. Plate 5B Kattendijk Fm. Early Pliocene De Schutter (2009) Megachasma sp. Plate 6B Kattendijk Fm. Early Pliocene De Schutter (2009) Megachasma sp. Plate 7B Kattendijk Fm. Early Pliocene De Schutter (2009) Megachasma sp. Plate 8B Temblor Fm. Early Miocene De Schutter (2009) Megachasma sp. Plate 8H Temblor Fm. Early Miocene De Schutter (2009) Megachasma sp. Plate 9B Temblor Fm. Early Miocene De Schutter (2009) Megachasma sp. Plate 9H Temblor Fm. Early Miocene De Schutter (2009) M. pelagios Plate 10B Bahía Inglesa Fm. Mid-Late Miocoene De Schutter (2009) M. pelagios Plate 10H Bahía Inglesa Fm. Mid-Late Miocoene De Schutter (2009) M. pelagios Plate 10N Yorktown Fm. Early Pliocene De Schutter (2009) M. pelagios Plate 10R Yorktown Fm. Early Pliocene De Schutter (2009) Megachasma sp. USNM Pungo River Fm. Pliocene Ray & Bohaska (2001) Megachasma sp. USNM ?Yorktown Fm. Pliocene Ray & Bohaska (2001) 56
67 Table 2 (Continued): List of species, specimen IDs, collection localities, ages, and sources of fossil teeth used in morphometric analyses. Species Specimen Locality Age Source Megachasma sp. UM CDR 1 Bahía Inglesa Fm. Late Miocene Cappetta (2012) Megachasma sp. UM CDR 2 Bahía Inglesa Fm. Late Miocene Cappetta (2012) Megachasma sp.* Copiapó, Chile Miocene Gordon Hubbell C. maximus UM REC 15 Kallo, Belgium Early Pliocene Cappetta (2012) C. maximus* Sharktooth Hill Bone Bed Miocene Gordon Hubbell C. maximus** Sharktooth Hill Bone Bed Miocene Marco Gulotta C. maximus*** Sharktooth Hill Bone Bed Miocene Black River Fossils *Gordon Hubbell provided 31 Megachasma sp. teeth and 19 C. maximus teeth from his own collection. **Three C. maximus were provided by Marco Gulotta from his own collection. ***Two C. maximus teeth were provided by Black River Fossils ( 57
68 Table 3: List of specimens, collection localities, jaw positions, tooth positions, sexes, and sources for Recent megamouth teeth used in morphometric analyses. Specimen Locality Jaw Position Tooth Position Sex Source Fig. 3A Hakata Bay, JP Upper 1 Adult Female Yabumoto et al. (1997) Fig. 3B Hakata Bay, JP Upper 5 Adult Female Yabumoto et al. (1997) Fig. 3C Hakata Bay, JP Upper 10 Adult Female Yabumoto et al. (1997) Fig. 3D Hakata Bay, JP Upper 15 Adult Female Yabumoto et al. (1997) Fig. 3E Hakata Bay, JP Upper 21 Adult Female Yabumoto et al. (1997) Fig. 3F Hakata Bay, JP Upper 35 Adult Female Yabumoto et al. (1997) Fig. 5A Hakata Bay, JP Lower 1 Adult Female Yabumoto et al. (1997) Fig. 5B Hakata Bay, JP Lower 5 Adult Female Yabumoto et al. (1997) Fig. 5C Hakata Bay, JP Lower 10 Adult Female Yabumoto et al. (1997) Fig. 5D Hakata Bay, JP Lower 15 Adult Female Yabumoto et al. (1997) Fig. 5E Hakata Bay, JP Lower 21 Adult Female Yabumoto et al. (1997) Fig. 5F Hakata Bay, JP Lower 35 Adult Female Yabumoto et al. (1997) Plate 45a Santa Catalina Island, MX Lower Adult Male Herman et al. (1993) Plate 45a Santa Catalina Island, MX Upper Adult Male Herman et al. (1993) Plate 45l Santa Catalina Island, MX Lower Adult Male Herman et al. (1993) 58
69 Table 3 (Continued): List of specimens, collection localities, jaw positions, tooth positions, sexes, and sources for Recent megamouth teeth used in morphometric analyses. Specimen Locality Jaw Position Tooth Position Sex Source Plate 45l Santa Catalina Island, MX Upper Adult Male Herman et al. (1993) Plate 45p Santa Catalina Island, MX Upper Adult Male Herman et al. (1993) Plate 47p Santa Catalina Island, MX Lower Adult Male Herman et al. (1993) Fig. 2A Oahu, HI Lower Adult Male Compagno (1990) Plate 11B Pulau Weh, Indonesia Immature Male De Schutter (2009) Plate 11F Pulau Weh, Indonesia Immature Male De Schutter (2009) Plate 11J Pulau Weh, Indonesia Immature Male De Schutter (2009) Plate 11N California, USA Adult Male De Schutter (2009) 59
70 Table 4: List of specimens, jaw positions, and tooth positions for Recent Cetorhinus teeth used in morphometric analyses. All LACM specimens are from an adult male collected off Morro Bay, CA. All LACM specimens are from an immature female collected off Oceano Beach, CA. Welton (2013) is the source of all specimens selected from tooth rows (R). Row 1 is closest to the jaw symphysis and the highest row number is closest to the distal end of the jaw (Welton, 2013). Specimen Jaw Position Tooth Position Specimen Jaw Position Tooth Position LACM Upper R1 LACM Upper R6 LACM Upper R7 LACM Upper R12 LACM Upper R17 LACM Upper R30 LACM Upper R27 LACM Upper R47 LACM Upper R34 LACM Upper R61 LACM Upper R49 LACM Upper R84 LACM Upper R57 LACM Upper R101 LACM Upper R67 LACM Upper R110 LACM Upper R77 LACM Upper R130 LACM Upper R87 LACM Upper R140 LACM Upper R97 LACM Upper R153 LACM Upper R107 LACM Lower R1 60
71 Table 4 (Continued): List of specimens, jaw positions, and tooth positions for Recent Cetorhinus teeth used in morphometric analyses. All LACM specimens are from an adult male collected off Morro Bay, CA. All LACM specimens are from an immature female collected off Oceano Beach, CA. Welton (2013) is the source of all specimens selected from tooth rows (R). Row 1 is closest to the jaw symphysis and the highest row number is closest to the distal end of the jaw (Welton, 2013). Specimen Jaw Position Tooth Position Specimen Jaw Position Tooth Position LACM Upper R118 LACM Lower R4 LACM Lower R1 LACM Lower R11 LACM Lower R14 LACM Lower R30 61
72 Table 5: MANOVA results for megamouth shark. Effect Wilks λ F d.f. P Tooth position , Jaw (upper, lower) , Sex , 38 <0.001 Sex* , Age , 67 <0.001 *Test did not include the three immature male teeth. 62
73 Table 6: MANOVA results for basking shark. Effect Wilks λ F d.f. P Tooth position , Jaw (upper, lower) , Sex* , 44 <0.001 Age , 68 <0.001 * Gynandric heterodonty cannot be verified because we are comparing adult male and immature female basking sharks. 63
74 Table 7: ANOVA results for individual relative warp axes with category consisting of Cetorhinus fossil (CF), Cetorhinus recent (CR), Megachasma fossil (MF), and Megachasma recent (MR). Categories that do not share a letter in the Tukey intervals are significantly different. Source SS d.f. MS F P Tukey RWA1 Category <0.001 Error Total RWA2 Category <0.001 Error Total RWA3 Category <0.001 Error Total RWA4 Category <0.001 Error Total CR(A), CF(B), MF(C), MR(D) MR(A), CR(A), MF(B), CF(C) MF(A), MR(AB), CR(B), CF(C) MF(A), CR(AB), CF(B), MR(B) 64
75 APPENDIX A CHARACTERS USED IN SHIMADA S (2005) CLADISTICS ANALYSIS Characters used in the cladistic analysis. Literature sources for extant forms: Characters 5 24, 26 27, and 34, based on data or illustrations in Compagno (1988, 1990); Characters 8, 11, 14, and 15, inferred for Odontaspis noronhai from (Sadowsky et al., 1984, figure 3). Characters 36 41, based on illustrations in Compagno (1984); additional information and sources are noted with each character description (Shimada, 2005). 1. Dental bullae: [0] absent, [1] present (Shimada, 2002a). 2. Orbital process (Compagno, 1990) of palatoquadrate: [0] present, [1] absent (the orbital process is assumed to be fused with the upper dental bulla in Pseudocarcharias kamoharai (Compagno, 1990). 3. Mesial process of palatoquadrate: [0] absent, [1] present (character for Clade 11b of Compagno, 1990). 4. Notch on dorsal side of palatoquadrate immediately lateral to upper dental bulla: [0] absent or shallow, [1] deep. 5. Rostral node of cranium: [0] absent, [1] present without vertical fenestra, [2] present with vertical fenestra. 6. Rostral appendices of cranium: [0] absent, [1] present. 7. Medial rostral cartilage of cranium: [0] narrow, [1] broad. 65
76 8. Rostral length anterior to nasal capsule compared to total cranial length: [0] short (proportion < 0.20), [1] long (proportion 0.20). 9. Separation between base of lateral rostral cartilages and nasal capsules: [0] absent, [1] present (character for Clade 12b of Compagno, 1990). 10. Lateral rostral cartilages form part of anterior fontanelle of cranium: [0] no, [1] yes. 11. Length of nasal capsules compared to cranial length behind rostrum: [0] long (proportion 0.30), [1] short (proportion < 0.30). 12. Ventral level of nasal capsules: [0] elevated above, or approximately equal to, level of basal plate, [1] depressed below level of basal plate. 13. Interruption of subethmoid fossa between right and left nasal capsules: [0] absent, [1] present. 14. Cranial width at pre-orbital processes compared to that at nasal capsules: [0] equal or narrower, [1] much wider. 15. Cranial width at postorbital processes compared to that at pre-orbital processes: [0] approximately equal or narrower, [1] much wider. 16. Orbital diameter compared to cranial length behind nasal capsules: [0] large (proportion 0.55), [1] small (proportion < 0.55). 17. Dorsal extent of cranial roof: [0] approximately equal level to dorsal edge of orbit [1] arched far above dorsal edge of orbit (inferred for Odontaspis noronhai from Humphreys et al., 1989, figure 1). 66
77 18. Cranial height (excluding rostral cartilages and nasal capsules) compared to cranial length behind nasal capsules: [0] low (proportion < 0.60) [1] moderate (proportion ), [2] high (proportion > 0.70). 19. Cranial width at pre-orbital processes compared to cranial length behind level of preorbital processes: [0] approximately equal or greater ( short cranial roof ), [1] much lesser ( long cranial roof ). 20. Overall outline of posterior edge of cranium when viewed dorsoventrally: [0] convex, [1] straight. 21. Prominent lateral wing (including ectethmoid processes of Compagno, 1990) of suborbital shelf of cranium: [0] absent, [1] present (modified from Character 12 of Shirai, 1996). 22. Stapedial foramina of cranium: [0] small, [1] medium, [2] large. 23. Secondary calcification of vertebrae with endochordal radii radiating from notochordal sheath: [0] absent, [1] present (modified from Character 76 of Shirai, 1996). 24. Total vertebral count: [0] 200, [1] > 200 (additional data from Springer and Garrick, 1964; Compagno, 1988, 1990; Last and Stevens, 1994). 25. Nictitating lower eyelid (modified from Character 43 of Shirai, 1996): [0] present, [1] absent (additional data from Humphreys et al., 1989). 26. Labial furrows: [0] present, [1] absent (additional data from Maul, 1955; Last and Stevens, 1994). 67
78 27. Intestinal valve type: [0] spiral, [1] ring (see Compagno, 1988, 1990; Carvalho, 1996; Shirai, 1996). 28. Number of turns of valvular intestine: [0] 32, [1] > 32 (modified from character for Clade 7b of Compagno, 1990). 29. Nuchal groove on each side of head above gills: [0] absent, [1] present (character for Clade 9b of Compagno, 1990). 30. Pre-caudal pit at origin of upper caudal lobe: [0] absent, [1] present (character for Clade 2b of Compagno, 1990; see also Character 103 of Shirai, 1996). 31. Pre-caudal keel: [0] absent, [1] present (modified from Character 104 of Shirai, 1996; additional data from Compagno, 1990). 32. Secondary caudal keel: [0] absent, [1] present (character for Clade 12b of Compagno, 1990). 33. Pectoral fin origin: [0] under, or anterior to, fourth gill opening, [1] behind fourth gill opening (data based on Compagno, 1984, 1990). 34. Pectoral fin radials: [0] aplesodic, [1] plesodic (Character 66 of Shirai, 1996). 35. First dorsal fin radials: [0] aplesodic, [1] semiplesodic (modified from Character 83 of Shirai, 1996; see also character for Clade 7b of Compagno, 1990). 36. Position of first dorsal fin: [0] directly above or posterior to level of pelvic fins, [1] anterior to level of pelvic fins. 37. Height of second dorsal fin compared to first dorsal fin: [0] approximately equal, [1] approximately 1/2, [2] very low. 68
79 38. Size of pelvic fins compared to that of first dorsal fin: [0] approximately equal or larger, [1] much smaller. 39. Height of anal fin compared to that of first dorsal fin: [0] approximately equal or larger, [1] approximately 1/2, [2] much smaller. 40. Length of upper caudal fin lobe compared to pre-caudal body length: [0] much shorter, [1] approximately equal. 41. Length of lower caudal fin lobe compared to that of upper caudal fin lobe: [0] much shorter, [1] approximately equal. 42. Total number of tooth rows on each jaw: [0] 40, [1] > 40 (additional data from Compagno, 1988). 69

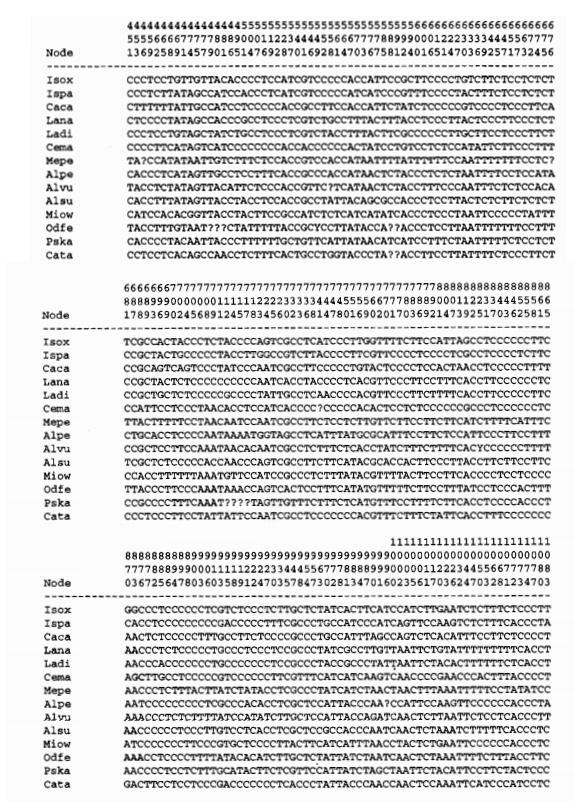
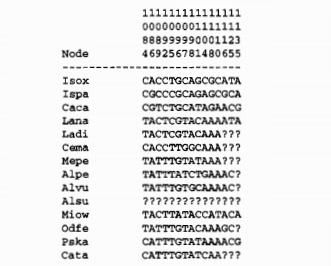
80 APPENDIX B MOLECULAR DATA FROM MARTIN AND NAYLOR S (1997) STUDY Alignment of phylogenetically informative sites in the cytochrome b gene for single representatives of each species of lamniform sharks surveyed. Isox = Isurus oxyrinchus; Ispa = I. paucus; Caca = Carcharodon; Lana = Lamna nasus; Ladi = L. ditropis; Cerna = Cetorhinus; Mepe = Megachasma; Alpe = Alopias pelagicus; Alvu = A. vulpinus; Alsu = A. superciliosus; Miow = Mitsukurina; Odfe = Odontaspis; Pska = Pseudocarcharias; Cata = Carcharias (Martin & Naylor, 1997). 70
81 71
82 72
Title: Phylogenetic Methods and Vertebrate Phylogeny
 Title: Phylogenetic Methods and Vertebrate Phylogeny Central Question: How can evolutionary relationships be determined objectively? Sub-questions: 1. What affect does the selection of the outgroup have
CLADISTICS Student Packet SUMMARY Phylogeny Phylogenetic trees/cladograms
 CLADISTICS Student Packet SUMMARY PHYLOGENETIC TREES AND CLADOGRAMS ARE MODELS OF EVOLUTIONARY HISTORY THAT CAN BE TESTED Phylogeny is the history of descent of organisms from their common ancestor. Phylogenetic
Species: Panthera pardus Genus: Panthera Family: Felidae Order: Carnivora Class: Mammalia Phylum: Chordata
 CHAPTER 6: PHYLOGENY AND THE TREE OF LIFE AP Biology 3 PHYLOGENY AND SYSTEMATICS Phylogeny - evolutionary history of a species or group of related species Systematics - analytical approach to understanding
Modern Evolutionary Classification. Lesson Overview. Lesson Overview Modern Evolutionary Classification
 Lesson Overview 18.2 Modern Evolutionary Classification THINK ABOUT IT Darwin s ideas about a tree of life suggested a new way to classify organisms not just based on similarities and differences, but
Fig Phylogeny & Systematics
 Fig. 26- Phylogeny & Systematics Tree of Life phylogenetic relationship for 3 clades (http://evolution.berkeley.edu Fig. 26-2 Phylogenetic tree Figure 26.3 Taxonomy Taxon Carolus Linnaeus Species: Panthera
Bibliographie de Kenshu Shimada
 Bibliographie de Kenshu Shimada Shimada, K. 1986. [Elasmobranchs from the Early Pliocene Naarai Formation, Choshi City, Chiba Prefecture, Japan]; pp. 357-359, Twenty-ninth Japanese Students Science Prize
Lecture 11 Wednesday, September 19, 2012
 Lecture 11 Wednesday, September 19, 2012 Phylogenetic tree (phylogeny) Darwin and classification: In the Origin, Darwin said that descent from a common ancestral species could explain why the Linnaean
Phylogeny Reconstruction
 Phylogeny Reconstruction Trees, Methods and Characters Reading: Gregory, 2008. Understanding Evolutionary Trees (Polly, 2006) Lab tomorrow Meet in Geology GY522 Bring computers if you have them (they will
muscles (enhancing biting strength). Possible states: none, one, or two.
. Possible states: none, one, or two.") Reconstructing Evolutionary Relationships S-1 Practice Exercise: Phylogeny of Terrestrial Vertebrates In this example we will construct a phylogenetic hypothesis of the relationships between seven taxa
Reconstructing Evolutionary Relationships S-1 Practice Exercise: Phylogeny of Terrestrial Vertebrates In this example we will construct a phylogenetic hypothesis of the relationships between seven taxa
UNIT III A. Descent with Modification(Ch19) B. Phylogeny (Ch20) C. Evolution of Populations (Ch21) D. Origin of Species or Speciation (Ch22)
 B. Phylogeny (Ch20) C. Evolution of Populations (Ch21) D. Origin of Species or Speciation (Ch22)") UNIT III A. Descent with Modification(Ch9) B. Phylogeny (Ch2) C. Evolution of Populations (Ch2) D. Origin of Species or Speciation (Ch22) Classification in broad term simply means putting things in classes
UNIT III A. Descent with Modification(Ch9) B. Phylogeny (Ch2) C. Evolution of Populations (Ch2) D. Origin of Species or Speciation (Ch22) Classification in broad term simply means putting things in classes
Ch 1.2 Determining How Species Are Related.notebook February 06, 2018
 Name 3 "Big Ideas" from our last notebook lecture: * * * 1 WDYR? Of the following organisms, which is the closest relative of the "Snowy Owl" (Bubo scandiacus)? a) barn owl (Tyto alba) b) saw whet owl
8/19/2013. Topic 4: The Origin of Tetrapods. Topic 4: The Origin of Tetrapods. The geological time scale. The geological time scale.
 Topic 4: The Origin of Tetrapods Next two lectures will deal with: Origin of Tetrapods, transition from water to land. Origin of Amniotes, transition to dry habitats. Topic 4: The Origin of Tetrapods What
May 10, SWBAT analyze and evaluate the scientific evidence provided by the fossil record.
 May 10, 2017 Aims: SWBAT analyze and evaluate the scientific evidence provided by the fossil record. Agenda 1. Do Now 2. Class Notes 3. Guided Practice 4. Independent Practice 5. Practicing our AIMS: E.3-Examining
Introduction to Cladistic Analysis
 3.0 Copyright 2008 by Department of Integrative Biology, University of California-Berkeley Introduction to Cladistic Analysis tunicate lamprey Cladoselache trout lungfish frog four jaws swimbladder or
C O L O S S A L F I S H
 COLOSSAL FISH GIANT DEVONIAN ARMORED FISH SKULL Titanichthys Termieri Lower Femannian, Upper Devonian Tafilalt, Morocco The Titanichthys was an immense armored fish, part of the Arthrodire order that ruled
Differences between Reptiles and Mammals. Reptiles. Mammals. No milk. Milk. Small brain case Jaw contains more than one bone Simple teeth
 Differences between Reptiles and Mammals Reptiles No milk Mammals Milk The Advantage of Being a Furball: Diversification of Mammals Small brain case Jaw contains more than one bone Simple teeth One ear
Skulls & Evolution. 14,000 ya cro-magnon. 300,000 ya Homo sapiens. 2 Ma Homo habilis A. boisei A. robustus A. africanus
 Skulls & Evolution Purpose To illustrate trends in the evolution of humans. To demonstrate what you can learn from bones & fossils. To show the adaptations of various mammals to different habitats and
Geo 302D: Age of Dinosaurs LAB 4: Systematics Part 1
 Geo 302D: Age of Dinosaurs LAB 4: Systematics Part 1 Systematics is the comparative study of biological diversity with the intent of determining the relationships between organisms. Humankind has always
ANTHR 1L Biological Anthropology Lab
 ANTHR 1L Biological Anthropology Lab Name: DEFINING THE ORDER PRIMATES Humans belong to the zoological Order Primates, which is one of the 18 Orders of the Class Mammalia. Today we will review some of
CHAPTER 26. Animal Evolution The Vertebrates
 CHAPTER 26 Animal Evolution The Vertebrates Impacts, Issues: Interpreting and Misinterpreting the Past No one was around to witness the transitions in the history of life Fossils allow us glimpses into
Fish 475: Marine Mammalogy
 Fish 475: Marine Mammalogy Taxonomy (continued) Friday, 3 April 2009 Amanda Bradford Course website: http://faculty.washington.edu/glennvb/fish475 Mysticeti: The baleen whales About 10-12 species; Formerly
AP Lab Three: Comparing DNA Sequences to Understand Evolutionary Relationships with BLAST
 AP Biology Name AP Lab Three: Comparing DNA Sequences to Understand Evolutionary Relationships with BLAST In the 1990 s when scientists began to compile a list of genes and DNA sequences in the human genome
The Making of the Fittest: LESSON STUDENT MATERIALS USING DNA TO EXPLORE LIZARD PHYLOGENY
 The Making of the Fittest: Natural The The Making Origin Selection of the of Species and Fittest: Adaptation Natural Lizards Selection in an Evolutionary and Adaptation Tree INTRODUCTION USING DNA TO EXPLORE
Evolution of Birds. Summary:
 Oregon State Standards OR Science 7.1, 7.2, 7.3, 7.3S.1, 7.3S.2 8.1, 8.2, 8.2L.1, 8.3, 8.3S.1, 8.3S.2 H.1, H.2, H.2L.4, H.2L.5, H.3, H.3S.1, H.3S.2, H.3S.3 Summary: Students create phylogenetic trees to
Evolution of Biodiversity
 Long term patterns Evolution of Biodiversity Chapter 7 Changes in biodiversity caused by originations and extinctions of taxa over geologic time Analyses of diversity in the fossil record requires procedures
Bio 1B Lecture Outline (please print and bring along) Fall, 2006
 Fall, 2006") Bio 1B Lecture Outline (please print and bring along) Fall, 2006 B.D. Mishler, Dept. of Integrative Biology 2-6810, bmishler@berkeley.edu Evolution lecture #4 -- Phylogenetic Analysis (Cladistics) -- Oct.
Bio 1B Lecture Outline (please print and bring along) Fall, 2006 B.D. Mishler, Dept. of Integrative Biology 2-6810, bmishler@berkeley.edu Evolution lecture #4 -- Phylogenetic Analysis (Cladistics) -- Oct.
8/19/2013. What is convergence? Topic 11: Convergence. What is convergence? What is convergence? What is convergence? What is convergence?
 Topic 11: Convergence What are the classic herp examples? Have they been formally studied? Emerald Tree Boas and Green Tree Pythons show a remarkable level of convergence Photos KP Bergmann, Philadelphia
17.2 Classification Based on Evolutionary Relationships Organization of all that speciation!
 Organization of all that speciation! Patterns of evolution.. Taxonomy gets an over haul! Using more than morphology! 3 domains, 6 kingdoms KEY CONCEPT Modern classification is based on evolutionary relationships.
Origin and Evolution of Birds. Read: Chapters 1-3 in Gill but limited review of systematics
 Origin and Evolution of Birds Read: Chapters 1-3 in Gill but limited review of systematics Review of Taxonomy Kingdom: Animalia Phylum: Chordata Subphylum: Vertebrata Class: Aves Characteristics: wings,
Introduction to phylogenetic trees and tree-thinking Copyright 2005, D. A. Baum (Free use for non-commercial educational pruposes)
") Introduction to phylogenetic trees and tree-thinking Copyright 2005, D. A. Baum (Free use for non-commercial educational pruposes) Phylogenetics is the study of the relationships of organisms to each other.
Introduction to phylogenetic trees and tree-thinking Copyright 2005, D. A. Baum (Free use for non-commercial educational pruposes) Phylogenetics is the study of the relationships of organisms to each other.
Sample Questions: EXAMINATION I Form A Mammalogy -EEOB 625. Name Composite of previous Examinations
 Sample Questions: EXAMINATION I Form A Mammalogy -EEOB 625 Name Composite of previous Examinations Part I. Define or describe only 5 of the following 6 words - 15 points (3 each). If you define all 6,
Red Eared Slider Secrets. Although Most Red-Eared Sliders Can Live Up to Years, Most WILL NOT Survive Two Years!
 Although Most Red-Eared Sliders Can Live Up to 45-60 Years, Most WILL NOT Survive Two Years! Chris Johnson 2014 2 Red Eared Slider Secrets Although Most Red-Eared Sliders Can Live Up to 45-60 Years, Most
Cladistics (reading and making of cladograms)
") Cladistics (reading and making of cladograms) Definitions Systematics The branch of biological sciences concerned with classifying organisms Taxon (pl: taxa) Any unit of biological diversity (eg. Animalia,
Cladistics (reading and making of cladograms) Definitions Systematics The branch of biological sciences concerned with classifying organisms Taxon (pl: taxa) Any unit of biological diversity (eg. Animalia,
LABORATORY EXERCISE 6: CLADISTICS I
 Biology 4415/5415 Evolution LABORATORY EXERCISE 6: CLADISTICS I Take a group of organisms. Let s use five: a lungfish, a frog, a crocodile, a flamingo, and a human. How to reconstruct their relationships?
Evolution as Fact. The figure below shows transitional fossils in the whale lineage.
 Evolution as Fact Evolution is a fact. Organisms descend from others with modification. Phylogeny, the lineage of ancestors and descendants, is the scientific term to Darwin's phrase "descent with modification."
Class Reptilia Testudines Squamata Crocodilia Sphenodontia
 Class Reptilia Testudines (around 300 species Tortoises and Turtles) Squamata (around 7,900 species Snakes, Lizards and amphisbaenids) Crocodilia (around 23 species Alligators, Crocodiles, Caimans and
TOPIC CLADISTICS
 TOPIC 5.4 - CLADISTICS 5.4 A Clades & Cladograms https://upload.wikimedia.org/wikipedia/commons/thumb/4/46/clade-grade_ii.svg IB BIO 5.4 3 U1: A clade is a group of organisms that have evolved from a common
What are taxonomy, classification, and systematics?
 Topic 2: Comparative Method o Taxonomy, classification, systematics o Importance of phylogenies o A closer look at systematics o Some key concepts o Parts of a cladogram o Groups and characters o Homology
COMPARING DNA SEQUENCES TO UNDERSTAND EVOLUTIONARY RELATIONSHIPS WITH BLAST
 Big Idea 1 Evolution INVESTIGATION 3 COMPARING DNA SEQUENCES TO UNDERSTAND EVOLUTIONARY RELATIONSHIPS WITH BLAST How can bioinformatics be used as a tool to determine evolutionary relationships and to
INQUIRY & INVESTIGATION
 INQUIRY & INVESTIGTION Phylogenies & Tree-Thinking D VID. UM SUSN OFFNER character a trait or feature that varies among a set of taxa (e.g., hair color) character-state a variant of a character that occurs
VERTEBRATE READING. Fishes
 VERTEBRATE READING Fishes The first vertebrates to become a widespread, predominant life form on earth were fishes. Prior to this, only invertebrates, such as mollusks, worms and squid-like animals, would
Exceptional fossil preservation demonstrates a new mode of axial skeleton elongation in early ray-finned fishes
 Supplementary Information Exceptional fossil preservation demonstrates a new mode of axial skeleton elongation in early ray-finned fishes Erin E. Maxwell, Heinz Furrer, Marcelo R. Sánchez-Villagra Supplementary
Classification systems help us to understand where humans fit into the history of life on earth Organizing the great diversity of life into
 You are here Classification systems help us to understand where humans fit into the history of life on earth Organizing the great diversity of life into categories (groups based on shared characteristics)
Animal Evolution The Chordates. Chapter 26 Part 2
 Animal Evolution The Chordates Chapter 26 Part 2 26.10 Birds The Feathered Ones Birds are the only animals with feathers Descendants of flying dinosaurs in which scales became modified as feathers Long
LABORATORY EXERCISE 7: CLADISTICS I
 Biology 4415/5415 Evolution LABORATORY EXERCISE 7: CLADISTICS I Take a group of organisms. Let s use five: a lungfish, a frog, a crocodile, a flamingo, and a human. How to reconstruct their relationships?
SUPPLEMENTARY ONLINE MATERIAL FOR. Nirina O. Ratsimbaholison, Ryan N. Felice, and Patrick M. O connor
 http://app.pan.pl/som/app61-ratsimbaholison_etal_som.pdf SUPPLEMENTARY ONLINE MATERIAL FOR Nirina O. Ratsimbaholison, Ryan N. Felice, and Patrick M. O connor Ontogenetic changes in the craniomandibular
Living Dinosaurs (3-5) Animal Demonstrations
 Animal Demonstrations") Living Dinosaurs (3-5) Animal Demonstrations At a glance Students visiting the zoo will be introduced to live animals and understand their connection to a common ancestor, dinosaurs. Time requirement One
Living Dinosaurs (3-5) Animal Demonstrations At a glance Students visiting the zoo will be introduced to live animals and understand their connection to a common ancestor, dinosaurs. Time requirement One
Biology 340 Comparative Embryology Lecture 12 Dr. Stuart Sumida. Evo-Devo Revisited. Development of the Tetrapod Limb
 Biology 340 Comparative Embryology Lecture 12 Dr. Stuart Sumida Evo-Devo Revisited Development of the Tetrapod Limb Limbs whether fins or arms/legs for only in particular regions or LIMB FIELDS. Primitively
6. The lifetime Darwinian fitness of one organism is greater than that of another organism if: A. it lives longer than the other B. it is able to outc
 1. The money in the kingdom of Florin consists of bills with the value written on the front, and pictures of members of the royal family on the back. To test the hypothesis that all of the Florinese $5
Comparing DNA Sequences Cladogram Practice
 Name Period Assignment # See lecture questions 75, 122-123, 127, 137 Comparing DNA Sequences Cladogram Practice BACKGROUND Between 1990 2003, scientists working on an international research project known
LABORATORY #10 -- BIOL 111 Taxonomy, Phylogeny & Diversity
 LABORATORY #10 -- BIOL 111 Taxonomy, Phylogeny & Diversity Scientific Names ( Taxonomy ) Most organisms have familiar names, such as the red maple or the brown-headed cowbird. However, these familiar names
Animal Diversity III: Mollusca and Deuterostomes
 Animal Diversity III: Mollusca and Deuterostomes Objectives: Be able to identify specimens from the main groups of Mollusca and Echinodermata. Be able to distinguish between the bilateral symmetry on a
Inferring Ancestor-Descendant Relationships in the Fossil Record
 Inferring Ancestor-Descendant Relationships in the Fossil Record (With Statistics) David Bapst, Melanie Hopkins, April Wright, Nick Matzke & Graeme Lloyd GSA 2016 T151 Wednesday Sept 28 th, 9:15 AM Feel
SOAR Research Proposal Summer How do sand boas capture prey they can t see?
 SOAR Research Proposal Summer 2016 How do sand boas capture prey they can t see? Faculty Mentor: Dr. Frances Irish, Assistant Professor of Biological Sciences Project start date and duration: May 31, 2016
COMPARING DNA SEQUENCES TO UNDERSTAND EVOLUTIONARY RELATIONSHIPS WITH BLAST
 COMPARING DNA SEQUENCES TO UNDERSTAND EVOLUTIONARY RELATIONSHIPS WITH BLAST In this laboratory investigation, you will use BLAST to compare several genes, and then use the information to construct a cladogram.
The Divergence of the Marine Iguana: Amblyrhyncus cristatus. from its earlier land ancestor (what is now the Land Iguana). While both the land and
. While both the land and") Chris Lang Course Paper Sophomore College October 9, 2008 Abstract--- The Divergence of the Marine Iguana: Amblyrhyncus cristatus In this course paper, I address the divergence of the Galapagos Marine
Chris Lang Course Paper Sophomore College October 9, 2008 Abstract--- The Divergence of the Marine Iguana: Amblyrhyncus cristatus In this course paper, I address the divergence of the Galapagos Marine
These small issues are easily addressed by small changes in wording, and should in no way delay publication of this first- rate paper.
 Reviewers' comments: Reviewer #1 (Remarks to the Author): This paper reports on a highly significant discovery and associated analysis that are likely to be of broad interest to the scientific community.
The Galapagos Islands: Crucible of Evolution.
 The Galapagos Islands: Crucible of Evolution. I. The Archipelago. 1. Remote - About 600 miles west of SA. 2. Small (13 main; 6 smaller); arid. 3. Of recent volcanic origin (5-10 Mya): every height crowned
Darwin and the Family Tree of Animals
 Darwin and the Family Tree of Animals Note: These links do not work. Use the links within the outline to access the images in the popup windows. This text is the same as the scrolling text in the popup
Introduction to Biological Anthropology: Notes 23 A world full of Plio-pleistocene hominins Copyright Bruce Owen 2011 Let s look at the next chunk of
 Introduction to Biological Anthropology: Notes 23 A world full of Plio-pleistocene hominins Copyright Bruce Owen 2011 Let s look at the next chunk of time: 3.0 1.0 mya often called the Plio-pleistocene
1 EEB 2245/2245W Spring 2014: exercises working with phylogenetic trees and characters
 1 EEB 2245/2245W Spring 2014: exercises working with phylogenetic trees and characters 1. Answer questions a through i below using the tree provided below. a. The sister group of J. K b. The sister group
Life in the Paleozoic
 Life in the Paleozoic Ocean Planet & The Great Migration Paleozoic Late Middle Early 543-248 Myr P r e c a m b r i a n Eon P h a n e r o z o i c Proterozoic Archean Hadean Geologic Time Scale Era Period
What is the evidence for evolution?
 What is the evidence for evolution? 1. Geographic Distribution 2. Fossil Evidence & Transitional Species 3. Comparative Anatomy 1. Homologous Structures 2. Analogous Structures 3. Vestigial Structures
Systematics, Taxonomy and Conservation. Part I: Build a phylogenetic tree Part II: Apply a phylogenetic tree to a conservation problem
 Systematics, Taxonomy and Conservation Part I: Build a phylogenetic tree Part II: Apply a phylogenetic tree to a conservation problem What is expected of you? Part I: develop and print the cladogram there
History of Lineages. Chapter 11. Jamie Oaks 1. April 11, Kincaid Hall 524. c 2007 Boris Kulikov boris-kulikov.blogspot.
 History of Lineages Chapter 11 Jamie Oaks 1 1 Kincaid Hall 524 joaks1@gmail.com April 11, 2014 c 2007 Boris Kulikov boris-kulikov.blogspot.com History of Lineages J. Oaks, University of Washington 1/46
Origin and Evolution of Birds. Read: Chapters 1-3 in Gill but limited review of systematics
 Origin and Evolution of Birds Read: Chapters 1-3 in Gill but limited review of systematics Review of Taxonomy Kingdom: Animalia Phylum: Chordata Subphylum: Vertebrata Class: Aves Characteristics: wings,
Do the traits of organisms provide evidence for evolution?
 PhyloStrat Tutorial Do the traits of organisms provide evidence for evolution? Consider two hypotheses about where Earth s organisms came from. The first hypothesis is from John Ray, an influential British
Human Evolution. Lab Exercise 17. Introduction. Contents. Objectives
 Lab Exercise Human Evolution Contents Objectives 1 Introduction 1 Activity.1 Data Collection 2 Activity.2 Phylogenetic Tree 3 Resutls Section 4 Introduction One of the methods of analysis biologists use
Teacher Workbooks. Language Arts Series Internet Reading Comprehension Oceans Theme, Vol. 1
 Teacher Workbooks Language Arts Series Internet Reading Comprehension Oceans Theme, Vol. 1 Copyright 2003 Teachnology Publishing Company A Division of Teachnology, Inc. For additional information, visit
Let s begin by learning a little more about rays, in general. First, an anatomy lesson!
 Let s begin by learning a little more about rays, in general. First, an anatomy lesson! Eyes Rays, in general, do not have very good eyesight. What they lack in eyesight, they make up for using electroreceptors,
Fishes, Amphibians, Reptiles
 Fishes, Amphibians, Reptiles Section 1: What is a Vertebrate? Characteristics of CHORDATES Most are Vertebrates (have a spinal cord) Some point in life cycle all chordates have: Notochord Nerve cord that
Evolution. Evolution is change in organisms over time. Evolution does not have a goal; it is often shaped by natural selection (see below).
.") Evolution Evolution is change in organisms over time. Evolution does not have a goal; it is often shaped by natural selection (see below). Species an interbreeding population of organisms that can produce
Evolution Evolution is change in organisms over time. Evolution does not have a goal; it is often shaped by natural selection (see below). Species an interbreeding population of organisms that can produce
Comparing DNA Sequence to Understand
 Comparing DNA Sequence to Understand Evolutionary Relationships with BLAST Name: Big Idea 1: Evolution Pre-Reading In order to understand the purposes and learning objectives of this investigation, you
Interpreting Evolutionary Trees Honors Integrated Science 4 Name Per.
 Interpreting Evolutionary Trees Honors Integrated Science 4 Name Per. Introduction Imagine a single diagram representing the evolutionary relationships between everything that has ever lived. If life evolved
You have 254 Neanderthal variants.
 1 of 5 1/3/2018 1:21 PM Joseph Roberts Neanderthal Ancestry Neanderthal Ancestry Neanderthals were ancient humans who interbred with modern humans before becoming extinct 40,000 years ago. This report
Vertebrate Evolution
 Vertebrate Evolution Torsten Bernhardt Redpath Museum, McGill University This teaching resource was made possible with funding from the PromoScience programme of NSERC. McGill University 2010 History of
Taxonomy and Pylogenetics
 Taxonomy and Pylogenetics Taxonomy - Biological Classification First invented in 1700 s by Carolus Linneaus for organizing plant and animal species. Based on overall anatomical similarity. Similarity due
HONR219D Due 3/29/16 Homework VI
 Part 1: Yet More Vertebrate Anatomy!!! HONR219D Due 3/29/16 Homework VI Part 1 builds on homework V by examining the skull in even greater detail. We start with the some of the important bones (thankfully
Unit 7: Adaptation STUDY GUIDE Name: SCORE:
 Unit 7: Adaptation STUDY GUIDE Name: SCORE: 1. Which is an adaptation that makes it possible for the animal to survive in a cold climate? A. tail on a lizard B. scales on a fish C. stripes on a tiger D.
This is an interlibrary loan request from a current IAMSLIC member, submitted through the IAMSLIC Z39.50 Distributed Library.
 Date: Wed, 3 Sep 2003 02:12:50-0700 To: parker@mlml.calstate.edu From: "Haspeslagh, Jan" Cc: "Haspeslagh, Jan" Subject: IAMSLIC ILL Request via Z39.50 Distributed Library
Natural Sciences 360 Legacy of Life Lecture 3 Dr. Stuart S. Sumida. Phylogeny (and Its Rules) Biogeography
 Biogeography") Natural Sciences 360 Legacy of Life Lecture 3 Dr. Stuart S. Sumida Phylogeny (and Its Rules) Biogeography So, what is all the fuss about phylogeny? PHYLOGENETIC SYSTEMATICS allows us both define groups
Natural Sciences 360 Legacy of Life Lecture 3 Dr. Stuart S. Sumida Phylogeny (and Its Rules) Biogeography So, what is all the fuss about phylogeny? PHYLOGENETIC SYSTEMATICS allows us both define groups
Name: Date: Hour: Fill out the following character matrix. Mark an X if an organism has the trait.
 Name: Date: Hour: CLADOGRAM ANALYSIS What is a cladogram? It is a diagram that depicts evolutionary relationships among groups. It is based on PHYLOGENY, which is the study of evolutionary relationships.
Welcome to Darwin Day!
 Welcome to Darwin Day! Considered to be the father of evolutionary ideas Sailed upon the HMS Beagle for 5 years around the world Gathered data and specimens from South America Galapagos Islands, as well
Color: body is dark brown to dark gray; belly and area near mouth and head are often light gray or white
 Sperm Whale Type: toothed Length: 33-60 feet Color: body is dark brown to dark gray; belly and area near mouth and head are often light gray or white Features/Markings: skin often appears wrinkled; enormous
Learning Goals: 1. I can list the traditional classification hierarchy in order.
 Learning Goals: 1. I can list the traditional classification hierarchy in order. 2. I can explain what binomial nomenclature is, and where an organism gets its first and last name. 3. I can read and create
Warm-Up: Fill in the Blank
 Warm-Up: Fill in the Blank 1. For natural selection to happen, there must be variation in the population. 2. The preserved remains of organisms, called provides evidence for evolution. 3. By using and
Biodiversity and Distributions. Lecture 2: Biodiversity. The process of natural selection
 Lecture 2: Biodiversity What is biological diversity? Natural selection Adaptive radiations and convergent evolution Biogeography Biodiversity and Distributions Types of biological diversity: Genetic diversity
Biodiversity and Extinction. Lecture 9
 Biodiversity and Extinction Lecture 9 This lecture will help you understand: The scope of Earth s biodiversity Levels and patterns of biodiversity Mass extinction vs background extinction Attributes of
Phylogeny of genus Vipio latrielle (Hymenoptera: Braconidae) and the placement of Moneilemae group of Vipio species based on character weighting
 and the placement of Moneilemae group of Vipio species based on character weighting") International Journal of Biosciences IJB ISSN: 2220-6655 (Print) 2222-5234 (Online) http://www.innspub.net Vol. 3, No. 3, p. 115-120, 2013 RESEARCH PAPER OPEN ACCESS Phylogeny of genus Vipio latrielle
International Journal of Biosciences IJB ISSN: 2220-6655 (Print) 2222-5234 (Online) http://www.innspub.net Vol. 3, No. 3, p. 115-120, 2013 RESEARCH PAPER OPEN ACCESS Phylogeny of genus Vipio latrielle
d a Name Vertebrate Evolution - Exam 2 1. (12) Fill in the blanks
 Fill in the blanks") Vertebrate Evolution - Exam 2 1. (12) Fill in the blanks 100 points Name f e c d a Identify the structures (for c and e, identify the entire structure, not the individual elements. b a. b. c. d. e. f.
Vertebrate Evolution - Exam 2 1. (12) Fill in the blanks 100 points Name f e c d a Identify the structures (for c and e, identify the entire structure, not the individual elements. b a. b. c. d. e. f.
Vertebrates. Vertebrates are animals that have a backbone and an endoskeleton.
 Vertebrates Vertebrates are animals that have a backbone and an endoskeleton. The backbone replaces the notochord and contains bones called vertebrae. An endoskeleton is an internal skeleton that protects
Spot the Difference: Using the domestic cat as a model for the nutritional management of captive cheetahs. Katherine M. Bell
 Spot the Difference: Using the domestic cat as a model for the nutritional management of captive cheetahs Katherine M. Bell Edited by Lucy A. Tucker and David G. Thomas Illustrated by Justine Woosnam and
Your web browser (Safari 7) is out of date. For more security, comfort and the best experience on this site: Update your browser Ignore
 is out of date. For more security, comfort and the best experience on this site: Update your browser Ignore") Your web browser (Safari 7) is out of date. For more security, comfort and the best experience on this site: Update your browser Ignore Activitydevelop EXPLO RING VERTEBRATE CL ASSIFICATIO N What criteria
Your web browser (Safari 7) is out of date. For more security, comfort and the best experience on this site: Update your browser Ignore Activitydevelop EXPLO RING VERTEBRATE CL ASSIFICATIO N What criteria
A NEW PLIOCENE FOSSIL CRAB OF THE GENUS (Trichopeltarion) FROM NEW ZEALAND
 FROM NEW ZEALAND") De/i & I f f n 8 t 0 * of Orustac^ A NEW PLIOCENE FOSSIL CRAB OF THE GENUS (Trichopeltarion) FROM NEW ZEALAND by R. K. DELL Dominion Museum, Wellington, New Zealand ABSTRACT A new Pliocene species of Trichopeltarion
De/i & I f f n 8 t 0 * of Orustac^ A NEW PLIOCENE FOSSIL CRAB OF THE GENUS (Trichopeltarion) FROM NEW ZEALAND by R. K. DELL Dominion Museum, Wellington, New Zealand ABSTRACT A new Pliocene species of Trichopeltarion
Lab 7. Evolution Lab. Name: General Introduction:
 Lab 7 Name: Evolution Lab OBJECTIVES: Help you develop an understanding of important factors that affect evolution of a species. Demonstrate important biological and environmental selection factors that
Resources. Visual Concepts. Chapter Presentation. Copyright by Holt, Rinehart and Winston. All rights reserved.
 Chapter Presentation Visual Concepts Transparencies Standardized Test Prep Introduction to Vertebrates Table of Contents Section 1 Vertebrates in the Sea and on Land Section 2 Terrestrial Vertebrates Section
Comparing DNA Sequences to Understand Evolutionary Relationships with BLAST
 Comparing DNA Sequences to Understand Evolutionary Relationships with BLAST INVESTIGATION 3 BIG IDEA 1 Lab Investigation 3: BLAST Pre-Lab Essential Question: How can bioinformatics be used as a tool to
Giant croc with T. rex teeth roamed Madagascar
 Giant croc with T. rex teeth roamed Madagascar www.scimex.org/newsfeed/giant-croc-with-t.-rex-teeth-used-to-roam-in-madagascar Embargoed until: Publicly released: PeerJ A fossil of the largest and oldest
Phylogeny of Animalia (overview)
") The Diversity of Animals 2 Chapter 23 Phylogeny of Animalia (overview) Key features of Chordates Phylum Chordata (the Chordates) includes both invertebrates and vertebrates that share (at some point in
The Diversity of Animals 2 Chapter 23 Phylogeny of Animalia (overview) Key features of Chordates Phylum Chordata (the Chordates) includes both invertebrates and vertebrates that share (at some point in
Evolution in Action: Graphing and Statistics
 Evolution in Action: Graphing and Statistics OVERVIEW This activity serves as a supplement to the film The Origin of Species: The Beak of the Finch and provides students with the opportunity to develop