MOLECULAR POLYMORPHISM ANALYSIS OF BMPR1B, IGFBP-3 AND POU1F1 GENES IN NILAGIRI AND MECHERI SHEEP
|
|
|
- Garry Hensley
- 5 years ago
- Views:
Transcription
1 MOLECULAR POLYMORPHISM ANALYSIS OF BMPR1B, IGFBP-3 AND POU1F1 GENES IN NILAGIRI AND MECHERI SHEEP A. SUDHAKAR I.D.No. DPV (AGB) DEPARTMENT OF ANIMAL GENETICS AND BREEDING MADRAS VETERINARY COLLEGE TAMILNADU VETERINARY AND ANIMAL SCIENCES UNIVERSITY CHENNAI
2 MOLECULAR POLYMORPHISM ANALYSIS OF BMPR1B, IGFBP-3 AND POU1F1 GENES IN NILAGIRI AND MECHERI SHEEP A. SUDHAKAR I.D.No. DPV (AGB) Thesis submitted in partial fulfillment of the requirements for the Degree of DOCTOR OF PHILOSOPHY in ANIMAL GENETICS AND BREEDING to the TAMILNADU VETERINARY AND ANIMAL SCIENCES UNIVERSITY CHENNAI DEPARTMENT OF ANIMAL GENETICS AND BREEDING MADRAS VETERINARY COLLEGE TAMILNADU VETERINARY AND ANIMAL SCIENCES UNIVERSITY CHENNAI
3 TAMILNADU VETERINARY AND ANIMAL SCIENCES UNIVERSITY Department of Animal Genetics and Breeding Madras Veterinary College Chennai CERTIFICATE This is to certify that the Thesis entitled MOLECULAR POLYMORPHISM ANALYSIS OF BMPR1B, IGFBP-3 AND POU1F1 GENES IN NILAGIRI AND MECHERI SHEEP submitted in partial fulfillment of the requirements for the Degree of DOCTOR OF PHILOSOPHY in ANIMAL GENETICS AND BREEDING to the Tamilnadu Veterinary and Animal Sciences University, Chennai is a record of bona fide research work carried out by A. SUDHAKAR under my supervision and guidance and that no part of this thesis has been submitted for the award of any other degree, diploma, fellowship or other similar titles or prizes and that the work has not been published in part or full in any scientific or popular journal or magazine. Place: Chennai Date : 31/08/2009 (P.S. RAHUMATHULLA) CHAIRMAN RECOMMENDED Place: Date : Chairman : EXTERNAL EXAMINER Member : 1. (P.S. RAHUMATHULLA) 2. (P. KUMARASAMY) 3. (R. RAJENDRAN) (G. DHINAKAR RAJ)
4 CURRICULUM VITAE Name : A. SUDHAKAR Date of birth : 26/04/1979 Place of birth : Villupuram District, Tamilnadu Major field of specialisation : Animal Genetics and Breeding Educational status : Completed B.V.Sc. & A.H. in 2001 from Pondicherry University Completed M.V.Sc. in 2003 from West Bengal University of Animal and Fishery Sciences, Kolkata Marital Status : Single Permanent Address : No. 56, Third Cross Street Thilagar Nagar Puducherry Membership in Professional : 1) Member, Veterinary Council of India Society 2) Member, Society for Conservation of Domestic Animal Biodiversity
5 Acknowledgement
6 ACKNOWLEDGEMENT I convey sincere gratitude and heartfelt thanks to my respected advisory committee Chairman, Dr. P.S. Rahumathulla, Professor and Head, Department of Animal Genetics and Breeding, Madras Veterinary College for his scholarly guidance, constant encouragement and generous provision of research facilities. I am highly obliged to Dr. R. Rajendran, Associate Professor, Institute of Poultry Production and Management, member, advisory committee for his keen interest in my research work, constant monitoring, valuable suggestions and the precious help extended in performing the research. I am extremely thankful to Dr. P. Kumarasamy, Associate Professor, Department of Animal Genetics and Breeding, Madras Veterinary College, and Dr. G. Dhinakar Raj, Professor, Department of Animal Biotechnology for their constructive criticism and useful suggestions. I wish to extend my deep sense of gratitude to Dr. M. Iyue, Professor and Head, SBRS, Sandynallah and Dr. K. Karunanithi, Professor and Head, MSRS, Pottaneri for their continuous support, personal interest and constructive suggestions. I express my personal indebtedness to Dr. R. Anil Kumar and Dr. C. Sreekumar, Associate Professors and Dr. R. Venkataramanan, Assistant Professor, SBRS, Dr. N. Arulnathan and Dr. K. Chinnamani, Assistant Professors, MSRS and Dr. V. Jeichitra, Assistant Professor, MVC for their moral support and liberal help. I am very much grateful to Dr. J. Kalatharan, Dr. S.N. Sivaselvam, Dr. K. Thilak Pon Jawahar, Dr. D. Balasubramanian, Dr. R. Thiagarajan, Dr. P. Devendran and Dr. D. Cauveri for their interest and unbound support for my research work. I thank the Dean, Madras Veterinary College and the Director, Centre for Animal Production Studies, TANUVAS for granting the permission to carry out this research and support rendered.
7 I express my sincere thanks to the valuable help extended by Dr. A.K. Mishra (CSWRI), Dr. C. Nimbkar (NARI), Dr. Loys Bodin (INRA, France), Dr. M.X. Chu (CAAS, China), Dr. X.Y. Lan (Northwest A & F University, China), Dr. Gua (Huazhong Agricultural University, China) and G.H. Davis (Invermay Agricultural Centre, New Zealand). I am highly indebted to Dr. C.R. Girija (RAGACOVAS) and Dr. S.K. Misra (WBUAFS) for their moral support and heartfelt blessings. I would like to extend my warm regards to my friends Dr. Saravanan Kaliyaperumal (U. Toledo, U.S), Dr. V. Sejian (CSWRI), Dr. S. Sadish (Nova Scotia Agricultural College, Canada), Dr. Dharma Purushotaman (UNE, Australia), Dr. R.C. Pandey, (IITM), Dr. Lakshmi Prasanth (IVRI), Dr. S. Vinoth (Veterinary College, Bangalore), Dr. N. Saravana Perumal (ABT, MVC), Dr. M. Ranjith Kumar (IVRI) and K. Muthukumar for their constant and generous help. The timely and invaluable help rendered by my friends in the Department Haris Girish, P. Ganapathi, S. Pramod, A. Barani, P. Radha, I. Sithi Marjitha, S. Feroz Mohammed, M. Mahendran, H. Jaferin and A. Rosalyn Mary Chandra in performing the research is gratefully and sincerely acknowledged. I wish to thank Thiru. T. Jai Sankar, Computer Operator for his efforts in alignment of Thesis typing. I also sincerely acknowledge the kind help extended by the non-technical staff of the Department of Animal Genetics and Breeding, Madras Veterinary College. I am highly thankful to Dr. Rathnasabapathy, Mr. Baskaran and Mr. Deepak staff of the library for the immense help rendered. At last but not the least I would to thank my parents and brother for their constant support, affection and guidance. (A. SUDHAKAR)
8 Abstract
9 ABSTRACT MOLECULAR POLYMORPHISM ANALYSIS OF BMPR1B, IGFBP-3 AND POU1F1 GENES IN NILAGIRI AND MECHERI SHEEP Name of the student : A. SUDHAKAR Degree for which submitted : Ph.D. Name of the Chairman : Dr. P.S. RAHUMATHULLA, Ph.D. Professor and Head Department : Animal Genetics and Breeding College : Madras Veterinary College University : Tamilnadu Veterinary and Animal Sciences University Year : 2009 Bone Morphogenetic Protein Receptor type 1 B (BMPR1B), Insulin like Growth Factor Binding Protein -3 (IGFBP-3) and Pituitary Transcription Factor 1 (POU1F1) are structural genes that have multiple physiological roles in reproduction and growth of animals. The present work was carried out on Nilagiri and Mecheri sheep maintained at Sheep Breeding Research Station, Sandynallah, The Nilgiris and Mecheri Sheep Research Station, Pottaneri, Salem district respectively. Polymorphisms of the genes were studied by PCR-RFLP technique. AvaII PCR-RFLP of BMPR1B gene revealed the presence of FecB mutation in Nilagiri sheep. In Nilagiri sheep, the frequency of FecB allele was found to be FecB mutation could not be identified in Mecheri sheep. PCR-RFLP of IGFBP-3 gene (316 bp region and 654 bp region) did not reveal polymorphism in both Nilagiri and Mecheri sheep. Polymorphism was not detected in POU1F1 gene by PCR-RFLP in the 508 bp and 450 bp regions analysed in both Nilagiri and Mecheri sheep.
10 Association analysis of genotypes at FecB locus with traits of economic importance was carried out in Nilagiri sheep only. The homozygous mutant (FecB BB ) genotype was not considered for association analysis as only one animal was identified with FecB BB genotype. The least-squares mean for litter size at birth, litter size at weaning, cumulative litter size at birth, cumulative litter size at weaning, cumulative litter weight at birth and cumulative litter weight at weaning was 1.04 ± 0.04, 1.01 ± 0.05, 3.10 ± 0.10, 2.86 ± 0.13, 8.06 ± 0.22 kg and ± 1.45 kg respectively among wild type (FecB ++ ) ewes and the same in heterozygous (FecB B+ ) ewes was 1.44 ± 0.05, 1.40 ± 0.06, 4.13 ± 0.14, 4.13 ± 0.19, 9.05 ± 0.32 kg and ± 2.19 kg. FecB B allele significantly (P<0.05 / P<0.01) increased the litter size at birth, litter size at weaning, cumulative litter size at birth, cumulative litter size at weaning, cumulative litter weight at birth and cumulative litter weight at weaning. Hence, FecB mutation can be used as a marker for prolificacy in Nilagiri sheep. The animals heterozygous at FecB locus (FecB B+ ) had slightly higher body weight than the wild type (FecB ++ ) animals except for birth weight. But the differences were not significant. Thus, FecB B allele did not have any significant effect on birth weight, weaning weight, body weight at six, nine and twelve months of age in Nilagiri sheep. Nucleotide sequencing of the 190 bp region of BMPR1B confirmed the presence of FecB mutation in Nilagiri sheep. In Nilagiri sheep, five new SNPs were also identified in the 654 bp region of the IGFBP-3 gene. Nucleotide sequencing of both 508 bp and 450 bp regions of POU1F1 genes revealed an A to T mutation in the exon 6 of the 450 bp fragment in Nilagiri sheep. Phylogenetic analysis with deduced nucleotide sequences revealed that sheep was closely related to goats than to cattle and buffalo. Swine was most distantly related to sheep among the livestock species studied. Key words: Sheep, Nilagiri, Mecheri, FecB mutation, IGFBP-3, POU1F1.
11 Contents
12 CONTENTS Chapter Title Page No. LIST OF TABLES LIST OF FIGURES LIST OF PLATES 1 INTRODUCTION REVIEW OF LITERATURE BONE MORPHOGENETIC PROTEIN RECEPTOR TYPE 1 B (BMPR1B) Biochemistry of BMPR1B Origin and identification of FecB mutation Biological functions of BMPR1B Association of FecB mutation with production traits in sheep 2.2 INSULIN LIKE GROWTH FACTOR BINDING PROTEIN-3 (IGFBP-3) Biochemistry of IGFBP Gene structure and mapping Biological functions of IGFBP Polymorphism and production association study PITUITARY TRANSCRIPTION FACTOR 1 (POU1F1) Biochemistry of POU1F Gene structure and mapping Biological functions of POU1F Polymorphism and production association study NUCLEOTIDE SEQUENCE HOMOLOGY AND PHYLOGENY 36
13 Chapter Title Page No. 3 MATERIALS AND METHODS MATERIALS Experimental animals Management of animals Nilagiri sheep Mecheri sheep Blood collection Preparation of glassware Preparation of solutions / reagents Solutions / reagents for DNA isolation Solution / reagents for checking of DNA samples METHODS Isolation of DNA Quality of DNA isolated Determination of purity and concentration of DNA Template DNA for PCR PCR-RFLP study on BMPR1B, IGFBP-3 and POU1F1 genes PCR-RFLP study on BMPR1B gene for detection of FecB mutation PCR-RFLP study on IGFBP-3 gene PCR-RFLP study on POU1F1 gene Statistical analyses Estimation of gene and genotype frequencies Association analysis of RFLP genotypes with traits of economic importance Nucleotide sequencing 56
14 Chapter 4 RESULTS Title Page No. 4.1 ISOLATION OF GENOMIC DNA PCR-RFLP STUDIES ON BMPR1B, IGFBP-3 AND POU1F1 GENES PCR-RFLP study on BMPR1B gene to detect FecB mutation AvaII-RFLP Gene and genotype frequencies at FecB locus PCR-RFLP study on IGFBP-3 gene HaeIII-RFLP Hinf I-RFLP PCR-RFLP study on POU1F1 gene EcoRI-RFLP AluI-RFLP ASSOCIATION OF GENOTYPES AT FecB LOCUS WITH TRAITS OF ECONOMIC IMPORTANCE Litter size at birth Litter size at weaning Cumulative litter size at birth Cumulative litter size at weaning Cumulative litter weight at birth Cumulative litter weight at weaning Birth weight Weaning weight Body weight at six months Body weight at nine months Body weight at twelve months 75
15 Chapter Title 4.4 SEQUENCING OF THE BMPR1B, IGFBP-3 AND POU1F1 GENES Page No Nucleotide sequence analysis of BMPR1B gene Nucleotide sequence analysis of IGFBP-3 gene IGFBP bp fragment IGFBP bp fragment Nucleotide sequence analysis of POU1F1 gene POU1F1-508 bp fragment POU1F1-450 bp fragment 94 5 DISCUSSION PCR-RFLP STUDIES ON BMPR1B, IGFBP-3 AND POU1F1 GENES PCR-RFLP study on BMPR1B gene PCR-RFLP study on IGFBP-3 gene HaeIII-RFLP HinfI-RFLP PCR-RFLP study on POU1F1 gene EcoRI-RFLP AluI-RFLP ASSOCIATION OF GENOTYPES AT FecB LOCUS WITH TRAITS OF ECONOMIC IMPORTANCE Litter size at birth Litter size at weaning Cumulative litter size at birth Cumulative litter size at weaning 107
16 Chapter Title Page No Cumulative litter weight at birth Cumulative litter weight at weaning Birth weight Weaning weight Body weight at six months Body weight at nine months Body weight at twelve months SEQUENCING OF THE BMPR1B, IGFBP-3 AND POU1F1 GENES Nucleotide sequence analysis of BMPR1B gene Nucleotide sequence analysis of IGFBP-3 gene Nucleotide sequence analysis of POU1F1 gene SUMMARY AND CONCLUSIONS REFERENCES APPENDICES
17 List of Tables
18 LIST OF TABLES Table No. Title Page No. 2.1 Studies showing the FecB B allele advantage for litter size, number of lambs weaned, birth weight and total weight of lamb weaned 3.1 Primer sequences used to amplify BMPR1B, IGFBP-3 and POU1F1 genes 3.2 Composition of PCR reaction mixture used to amplify 190 bp fragment of BMPR1B gene 3.3 PCR programme for amplification of 190 bp fragment of BMPR1B gene AvaII restriction digestion mix PCR programme for amplification of 316 bp fragment of IGFBP-3 gene HaeIII restriction digestion mix PCR programme for amplification of 654 bp fragment of IGFBP-3 gene HinfI restriction digestion mix PCR programme for amplification of 508 bp fragment of POU1F1 gene EcoRI restriction digestion mix PCR programme for amplification of 450 bp fragment of POU1F1 gene AluI restriction digestion mix Gene and genotype frequencies at FecB locus in Nilagiri sheep 4.2 Effect of FecB mutation on litter size at birth in Nilagiri sheep 58 61
19 Table No. Title Page No. 4.3 Least-squares analysis of variance of litter size at birth in Nilagiri sheep 4.4 Effect of FecB mutation on litter size at weaning in Nilagiri sheep 4.5 Least-squares analysis of variance of litter size at weaning in Nilagiri sheep 4.6 Effect of FecB mutation on cumulative litter size at birth in three lamb crops 4.7 Least-squares analysis of variance of cumulative litter size at birth 4.8 Effect of FecB mutation on cumulative litter size at weaning in three lamb crops 4.9 Least-squares analysis of variance of cumulative litter size at weaning 4.10 Effect of FecB mutation on cumulative litter weight at birth in three lamb crops 4.11 Least-squares analysis of variance of cumulative litter weight at birth 4.12 Effect of FecB allele on cumulative litter weight at weaning in three lamb crops 4.13 Least-squares analysis of variance of cumulative litter weight at weaning 4.14 Effect of FecB mutation on body weight at different ages in Nilagiri sheep 4.15 Least-squares analysis of variance of body weight at different ages in Nilagiri sheep 4.16 Single Nucleotide Polymorphisms (SNPs) observed in BMPR1B, IGFBP-3 and POU1F1 genes
20 List of Figures
21 LIST OF FIGURES Figure No. Title Page No. 4.1 Nucleotide sequences of 190 bp fragment of BMPR1B gene in Nilagiri and Mecheri sheep 4.2 Chromatogram of partial exon 6 of BMPR1B gene showing FecB mutation 4.3 Nucleotide sequence alignment of 190 bp fragment of BMPR1B gene of Nilagiri sheep with available sequences of different livestock species 4.4 Nucleotide sequence similarity and divergence between various species on the basis of partial BMPR1B gene (190 bp fragment) 4.5 Phylogenetic tree based on partial BMPR1B gene (190 bp fragment) 4.6 Nucleotide sequences of different fragments of IGFBP-3 gene in Nilagiri sheep 4.7 Nucleotide sequence alignment of 316 bp fragment of IGFBP-3 gene of Nilagiri sheep with available sequences of different livestock species 4.8 Nucleotide sequence similarity and divergence between various species on the basis of partial IGFBP-3 gene (316 bp fragment) 4.9 Phylogenetic tree based on partial IGFBP-3 gene (316 bp fragment) 4.10 Nucleotide sequence alignment of 654 bp fragment of IGFBP-3 gene of Nilagiri sheep with available sequences of different livestock species
22 Figure No. Title Page No Nucleotide sequence similarity and divergence between various species on the basis of partial IGFBP-3 gene (654 bp fragment) 4.12 Phylogenetic tree based on partial IGFBP-3 gene (654 bp fragment) 4.13 Nucleotide sequence of different fragments of POU1F1 gene fragment in Nilagiri sheep 4.14 Nucleotide sequence alignment of 508 bp fragment of POU1F1 gene of Nilagiri sheep with available sequences of different livestock species 4.15 Nucleotide sequence similarity and divergence between various species on the basis of partial POU1F1 gene (508 bp fragment) 4.16 Phylogenetic tree based on partial POU1F1 gene (508 bp fragment) 4.17 Nucleotide sequence alignment of 450 bp fragment of POU1F1 gene of Nilagiri sheep with available sequences of different livestock species 4.18 Nucleotide sequence similarity and divergence between various species on the basis of partial POU1F1 gene (450 bp fragment) 4.18 Phylogenetic tree based on partial POU1F1gene (450 bp fragment)
23 List of Plates
24 LIST OF PLATES Plate No. Title Page No. 3.1 Nilagiri Ram Nilagiri Ewe Mecheri Ram Mecheri Ewe PCR amplification of 190 bp fragment of BMPR1B gene AvaII-RFLP of BMPR1B gene to detect FecB mutation in Nilagiri sheep 4.3 AvaII-RFLP of BMPR1B gene to detect FecB mutation in Mecheri sheep PCR amplification of 316 bp fragment of IGFBP-3 gene HaeIII-RFLP of IGFBP-3 gene (316 bp fragment) in Nilagiri sheep 4.6 HaeIII-RFLP of IGFBP-3 gene (316 bp fragment) in Mecheri sheep PCR amplification of 654 bp fragment of IGFBP-3 gene HinfI-RFLP of IGFBP-3 gene (654 bp fragment) in Nilagiri sheep 4.9 HinfI-RFLP of IGFBP-3 gene (654 bp fragment) in Mecheri sheep PCR amplification of 508 bp fragment of POU1F1 gene EcoRI-RFLP of POU1F1 gene (508 bp fragment) in Nilagiri sheep 4.12 EcoRI-RFLP of POU1F1 gene (508 bp fragment) in Mecheri sheep PCR amplification of 508 bp fragment of POU1F1 gene AluI-RFLP of POU1F1 gene (450 bp fragment) in Nilagiri sheep 4.15 AluI-RFLP of POU1F1 gene (450 bp fragment) in Mecheri sheep
25 Introduction
26 INTRODUCTION Animal breeding has been practiced as a profession in India since time immemorial. Millions of farmers under varied agro-climatic conditions have over the centuries evolved numerous breeds of livestock each with unique traits that confer them adaptability to the environment in which they live. Most of the farmers are marginal/landless. With the increase in income levels of the general public, the demand for animal proteins has seen a sharp increase. Socio-cultural factors favouring mutton consumption leads to a very high rate of slaughter. The twinning / higher litter size in sheep is a very rare phenomenon. Hence it is imperative to improve the sheep population by genetically exploiting the litter size trait by increasing number of lambs produced per animal to enhance the economic efficiency of sheep production without putting pressure on the available natural resources. Productive traits in domestic livestock are generally inherited in a multigenic or quantitative manner (Falconer and Mackay, 1996) and consequently genetic progress in improving livestock may be slow. Identification and selection of genotypes with higher litter size and better growth traits is a logical approach in improving the mutton production. Improved reproductive performance under small holder livestock rearing, where larger litter can be nursed individually, is essential for increasing the income. Improved reproductive efficiency also plays a vital role in conservation and genetic upgradation of breeds and strains of livestock. Moreover, differences between breeds, between ewes and between rams within flocks, for their reproductive as well as growth performance is substantial. Hence genetic characterisation of different livestock populations and identification of Single Nucleotide Polymorphisms (SNPs) which influences reproduction and growth is essential for devising appropriate strategies for genetic improvement and conservation programmes. Though, many breeds of sheep have been characterised using phenotypic traits, genetic studies on specific genes and their associations with economic traits are very few. Genetic markers can be defined as a stable and inherited variation that can be measured or detected by a suitable method, and can be used subsequently to
27 detect the presence of specific genotype or phenotype other than itself, which otherwise is non-measurable or very difficult to detect. Genomic variations occurring at different levels, i.e., morphological, chromosomal, biochemical or DNA level can serve as the genetic markers. The various DNA markers include Restriction Fragment Length Polymorphism (RFLP), Minisatellite, Microsatellite, Random Amplified Polymorphic DNA (RAPD), Polymerase Chain Reaction- Restriction Fragment Length Polymorphism (PCR-RFLP), Amplified Fragment Length Polymorphism (AFLP), PCR-Single Strand Conformation Polymorphism (PCR-SSCP), etc. RFLP and SSCP are two powerful molecular tools to identify single nucleotide polymorphisms (SNPs). These SNPs are useful to create high-density genetic maps and provide the basis for superior and highly informative genotyping assay. The use of polymorphic genes as detectable molecular markers is a proven alternative to current methods of selection once the genes are proven to be associated with traits of interest in animals. The FecB is an A746G single nucleotide polymorphism (SNP) in the exon 6 of the Bone Morphogenetic Protein Receptor type 1 B (BMPR1B) gene in sheep. It is associated with an increased ovulation rate and litter size (Piper et al., 1985) and follow simple Mendelian inheritance pattern. FecB mutation had been identified in Booroola Merino, Garole, Javanese, Han, Hu (Davis et al., 2006), Kendrapada (Kumar et al., 2008a), Cele and Dulong (Hua and Yang, 2009) sheep without an intentional introgression. Australian Booroola Merino has largely contributed to FecB allele introgression into many breeds which is now identified in 48 breeds and composites in 19 countries (Davis, 2008). Ovulation rate can also be influenced by administering hormones exogenously and by environmental factors such as nutrition. Insulin, Insulin-like Growth Factors (IGF) I and II and their binding proteins (IGFBPs) mediate the nutritional effects directly in the ovary. These factors also affect the oocyte quality and consequently embryo development and survival (Hunter et al., 2004). IGFBP-3 (Insulin like Growth Factor Binding Protein-3) is a specific carrier protein primarily responsible for regulating the multiple effects of IGF s (Bale and Conover, 1992). IGFBP-3 has varied physiological role and
28 plays an important role in growth and reproduction. Selection of livestock using IGFBP-3 levels in growth is well established and patented. POU1F1 (also known as PIT-1 or GHF-1) is a tissue-specific transcription factor mainly expressed in the anterior pituitary (Bodner et al., 1988; Ingraham et al., 1988). Mutations identified in the POU1F1 gene lead to deficiency or absence of Growth Hormone (GH), Prolactin (PRL) and Thyroid Stimulating Hormone β (TSH-β), which may result in variability of development and growth (Radovick et al., 1992). The Pituitary development and POU domain gene expression are influenced by Bone Morphogenetic Protein signalling pathway either directly or indirectly. The endocrine regulation mediated by Hypothalamic Pituitary Ovarian system along with local actions of members of TGF ß super family play a crucial role in Ovarian follicular development. Thus, genetic variations in the BMPR1B, IGFBP-3 and POU1F1 genes and their associations with reproduction and growth traits in livestock could provide useful genetic markers for animal selection and breeding through Marker Assisted Selection (MAS) and introgression. The Nilagiri is a synthetic breed of sheep evolved during the 19 th century and contains an unknown level of inheritance of Coimbatore, Tasmanian Merino, Cheviot and South Down (Rao et al., 1960). They have a higher incidence (12%) of multiple litter size (Rajendran et al., 2008) which is a rare phenomenon among sheep. Mecheri sheep is a meat type breed, native of hot and dry part of Western Tamilnadu. These animals rarely give twins (0.1%). They constitute 24.28% of total sheep population of Tamilnadu (Karunanithi et al., 2004). This breed plays a major role in income generation for the marginal and landless livestock rearers. Keeping these facts in view, the present work was carried out with the following objectives: 1. To study the polymorphism of BMPR1B, IGFBP-3 and POU1F1 genes in Nilagiri and Mecheri sheep breeds. 2. To find out the association of these genes with economic traits, if any.
29 Review of Literature
30 2. REVIEW OF LITERATURE Within breed selection is a slow process for improving production traits. Further, improving prolificacy of sheep through within breed selection may introduce undesirable characteristics such as poor growth. The FecB allele which increases the ovulation rate by more than 1.0 per ovulation is a major allele, which significantly influences the ewe reproduction potential. Mutations positively associated with increased ovulation rate have also been discovered in the Bone Morphogenetic Protein 15 (BMP15), Growth Differentiation Factor 9 (GDF9), Inhibin α, Estrogen receptor, Prolactin receptor and Melatonin receptor 1a genes. IGFBP-3 and POU1F1 are structural genes that are associated with the expression of hormones related to growth and reproduction. Different alleles of IGFBP-3 and POU1F1 genes are positively associated with certain economically important traits (Renaville et al., 1997b; Sun et al., 2002; Lan et al., 2007a) 2.1 BONE MORPHOGENETIC PROTEIN RECEPTOR TYPE 1 B (BMPR1B) Biochemistry of BMPR1B Bone Morphogenetic Protein Receptor type 1 B (BMPR1B) also known as activin receptor-like kinase 6 (ALK6) belongs to the BMP family of proteins. The term Bone Morphogenetic Protein (BMP) was given by Urist (1965). The BMP sub-family is the largest within the Transforming Growth Factor β (TGF-β) superfamily of growth factors which includes TGF-β, activin / inhibin and GDF sub-families as well as proteins such as anti-mullerian hormone (AMH). A distinguishing structural feature of the TGF-β superfamily is the presence of seven conserved cysteines (Shimasaki et al., 2004). Two types of membrane-bound serine threonine kinases that form the receptor complexes signal the members of the TGF-β superfamily. There are seven type I receptors [activin receptor-like kinase (ALK) 1
31 to 7] and five type II receptors (ActRII, ActRIIB, BMPRII, TGFbRII and AMHRII) (de Caestecker, 2004; ten Dijke and Hill, 2004). FecB is a single nucleotide (A>G) transition mutation in the exon 6 of the subdomain 3 of the kinase domain of BMPR1B (Mulsant et al., 2001; Souza et al., 2001; Wilson et al., 2001) gene of the Transforming Growth Factor β (TGF-β) superfamily synthesizing Arginine instead of Glutamine Origin and identification of FecB mutation FecB is the first major allele to be identified which is associated with increased ovulation rate. The identification and exploitation of the FecB as a major allele started with the keen observation and reporting of the higher litter size in the Booroola Merino by Sears brothers in Australia in 1950 s. Sears brothers donated a small flock of Booroola Merino to the CSIRO to investigate the rationale behind it. In 1980, Piper and Bindon (1982) postulated that the increased litter size in Booroola Merino was due to a major single gene affecting the trait which was later confirmed by Davis et al. (1982). Initially the gene was named fecundity and the symbol F was assigned to the locus and allele (Davis et al., 1982). Later, when other major genes affecting litter size in sheep were identified, the gene was renamed as FecB (Fec = Fecundity and B = Booroola) by the committee on Genetic nomenclature of Sheep and Goats. In 1993, Montgomery and his colleagues identified linkage between microsatellite markers Oar AE 101 and Oar HH 55 with BMPR1B gene of the Transforming Growth Factor-β (TGF-β) receptor family. They also demonstrated the association between RFLP markers of Secreted Phospho Protein 1 (SPP1) and these microsatellite markers which were linked to FecB mutation. Later Mulsant et al. (1998) found Bovine microsatellite BMS2508 and Caprine microsatellite LSCV043 which were situated about 2 cm on either side of the FecB gene, was the closest flanking markers. BMPR1B has a coding sequence of 1509 bp consisting of 10 exons. FecB is a mutation located within a conserved syntenic group that maps to sheep chromosome 6q (Montgomery et al., 1994) orthologous to 4q region of human chromosome. The Booroola fecundity allele, FecB was identified
32 as a single autosomal mutation, an A 746 G nucleotide transition in the coding region (exon 6) of Bone Morphogenetic Protein Receptor type 1 B (BMPR1B) gene (Mulsant et al., 2001; Souza et al., 2001; Wilson et al., 2001). Souza et al. (2001) reported another mutation at nucleotide position 1113 (C to A) of sheep BMPR1B without any change in the aminoacid Biological functions of BMPR1B The members of transforming growth factor β (TGF-β) superfamily including BMPR1B have a vital role in the regulatory events of morphogenesis, organogenesis and cytodifferentiation including ovarian folliculogenesis (Hogan, 1996). Oocytes, granulosa and theca cells express the peptide growth factors of TGF-β in a developmental stage-related manner and function as intraovarian regulatory molecules involved in follicle recruitment, granulosa and theca cell proliferation / atresia, steroidogenesis, oocyte maturation, ovulation, and luteinization (Knight and Glister, 2003). Wilson et al. (2001) identified BMPR1B expression in the ovary and revealed its specific location to the oocyte and the granulosa cell by in situ hybridization. The BMPs act through receptors that are on oocytes and granulosa cells (Wilson et al., 2001; Souza et al., 2002) and have been shown to increase oestradiol and inhibin secretion by granulosa cells in vitro and may act by enhancing the actions of FSH (Souza et al., 2002). Chen et al. (2008) had proposed that regulation of Follicle Stimulating Hormone (FSH) and Oestrogen (E 2 ) in the ovine ovary by BMPR1B may be associated with follicular development and ovulation and its expression increased with follicular growth. Moreover, FSH and E 2 cooperatively play a physiological role in regulating BMPRIB gene expression in granulosa cells during follicular development in sheep. Yi et al. (2001) demonstrated the importance of BMP signaling pathways for estrus cyclicity, estradiol biosynthesis, and cumulus cell expansion in vivo and expression of BMPR1B in uterine tissues. Mutations of BMPs and BMP receptors have been incriminated in several inherited diseases of skeletal system (Kingsley et al., 1992). Growth Differentiation Factor (GDF5) has been shown to bind BMPR1B specifically (Nishitoh et al., 1996)
33 and null mutations in the BMPR1B gene causes a similar skeletal phenotype as that observed in GDF5 mutant mice (Yi et al., 2000). Heterozygous missense mutations in BMPR1B gene in humans cause brachydactyly type A2 and homozygous mutations in BMPR1B gene in humans show a severe defect in limb formation (Demirhan et al., 2005). The FecB allele is additive for ovulation rate though instances of its multiplicative nature have been elucidated by Gootwine et al. (1993) and partially dominant for litter size (Piper et al., 1985). In the FecB ewe carrying a single point mutation in the intracellular kinase domain of the BMPR1B gene, follicles mature at a smaller diameter with fewer granulosa cells relative to their counterparts in noncarriers and smaller corpora lutea which mature precociously. They become oestrogenic and develop LH receptors on the membrana granulosa at diameters of mm rather than at 4-6 mm in non carriers. Further Cytochrome P450 Aromatase and β A subunit of inhibin / activin are expressed in smaller follicles (Campbell et al., 2008). Higher ovulation rates of the FecB carriers were found to be associated with ovulation of smaller follicles (Driancourt et al., 1990), a reduction in follicle atresia (Mandiki et al., 2000), fewer granulosa cells per follicle (Driancourt et al., 1990) and lower oestradiol production (Avdi et al., 1997). Though the exact mechanism of action underlying the increased ovulation rate is not known clearly, Souza et al. (2001) indicated a partial deactivation of the BMPR1B receptor. Campbell et al. (2008) proposed that increased prolificacy in FecB carriers is due to an increased sensitivity to FSH mediated by the action of intra uterine follicular local factors. Higher ovulation rate in Booroola allele carriers is due to an extended recruitment period, lesser atresia resulting in larger number of smaller ovulatory follicles and not due to any variation in total number of antral follicles. The FecB allele in addition to its role in reproductive performance was found to decrease milk production in Assaf and Awassi ewes (Gootwine et al., 2001). Lambs from FecB carrier dams grew slower than those from the non carrier dams
34 and they required significantly more energy and protein intake per kg of average daily gain (Visscher et al., 2000). They also reported that FecB carrier lambs had higher dressing per centage and eye muscle depth and area along with an effect on meat colour but the lambs born to carrier dams had smaller eye muscle and slower growth reducing the feed efficiency. The carrier animals had greater fat content (Kleemann et al., 1988; Visscher et al., 2000). The FecB allele also affects the size of specific organs like adrenal gland (Souza and Baird, 2004) and regulating uterine function and capacity (Gootwine, 2005). FecB carrier rams had been found to have more spermatozoa production than the non carriers (Fitzgerald and Stellflug, 1990) and higher spermatozoa concentration (Kumar et al., 2007). While Oldham and Gray (1984) did not find any increase in testicular growth, Visscher et al. (2008) found FecB carrier males had a significantly higher testes weight (7.5%). Owens et al. (1985) reported that lambs from higher order births had low birth weight and consequently poor lamb survival. Low conception rate and lamb survival rate had been identified in homozygote FecB ewes by Walkden Brown et al. (2008), which they had termed as Homozygote penalty Association of FecB mutation with production traits in sheep The influence of FecB mutation on production in different breeds seem to vary due to factors like breed, ewe parity, nutrition, uterine capacity and environmental conditions etc. The various studies showing the effect of FecB B allele on ewes productivity in different breeds of sheep have been listed in Table 2.1. Hinch et al. (1985) studied the factors affecting lamb birth weights from high fecundity Booroola ewes including the influence of year, weight of ewes at mating, litter size and pregnancy wastage (ovulation rate minus litter size) with an average ovulation rate of 2.2 and 1.8. They found that largest proportion of variation in birth weight was associated with litter size (71 83%), a smaller proportion ( %) with year differences and minor but significant proportions with ewe mating weight ( %) and pregnancy wastage ( %). They also suggested that
35 high ovulation rates increased probability of prenatal deaths that were associated with a reduction in birth weight of lambs born in the resulting litters. Kleemann et al. (1985) investigated the effect of FecB gene on growth and carcass characters of the South Australian Merino (M) and its crosses with the Booroola (B) and Trangie Fertility Merino (TF). They reported that at 4-5 months of age, TF x M and M lambs were heavier than B x M lambs (25.3 and 24.8 kg respectively, Vs kg). Similar proportional strain differences were observed at months of age (38 kg slaughter group), but at one year, no difference was observed between the M and B x M strains, resulting in a Strain x Year interaction (P < 0.05). Gootwine et al. (1993b) investigated the reproductive performance of Assaf and Booroola Assaf crossbred ewes and reported that the mean ovulation rate increased by 1.2 and litter size by 0.8 in F 1 as compared to Assaf while the values were intermediate in ¾ Assaf ¼ Booroola ewes. They found that FecB carrier lambs of the same birth type had lesser birth weight than non carriers. Meyer et al. (1994a) investigated the effects of Booroola Merino breeding and the FecB gene on net lamb production by analysing various reproductive and lamb production traits in Romney, Perendale and Booroola Merino crossbred ewes. They found that relative to FecB ++ ewes, FecB B+ ewes produced 1.1 more lambs at birth but weaned only 0.4 lambs per ewe lambing. FecB B+ ewes giving birth to triplets weaned only 0.25 more lambs than those giving birth to twins and those producing more than three lambs at birth weaned fewer lambs than those that lambed triplets. Weight of lamb weaned per ewe weaning lambs was higher for FecB B+ ewes than for FecB ++ ewes, but weight of lamb weaned per ewe present was not significantly different. Crossbred ewes weaned lighter lambs than purebred ewes but weaned more weight of lamb per ewe present, largely due to lower barrenness. Meyer et al. (1994b) crossed Booroola Merino rams with Perendale and Romney ewes to study the influence of FecB on growth, onset of puberty, wool
36 production and wool traits in lambs and hoggets. They reported that crossbred had a slightly lighter bodyweight and the differences in body weight were 1 kg (5%) at weaning and 5 kg (10%) at 16 months of age but the crossbreds attained puberty sooner. The authors could not find any significant effect of FecB gene on growth or wool traits but F+ hoggets reached puberty earlier and had greater number of oestrous cycles. Souza et al. (1994) studied the ovulation rates and ovulation dynamics in three quarter Romney Marsh x one quarter Booroola Merino. They concluded that ovulation rate was greater in FecB carriers than in non carriers and FecB allele acts on the ovulation rate without affecting the ovulation time and ovulatory dynamics. Fogarty and Hall (1995) investigated reproduction, liveweight and wool production traits in Trangie Fertility x Dorset (TD) and Booroola x Dorset (BD) ewes. The BD ewes were 3-4 kg lighter (P<0.001) and had a higher ovulation rate (2.37 ± 0.03 Vs 1.65 ± 0.03), litter size (2.07 ± 0.03 Vs 1.66 ± 0.04) and number of lambs born per ewe joined (1.92 ± 0.04 Vs 1.56 ± 0.04) than for the TD ewes. The growth rate of lambs was lower from the BD ewes and overall they weaned 3.8 kg less (P<0.001) weight of lamb than TD ewes. BD ewes were classified as either carriers (F+) or non-carriers (++) of the FecB allele which was significant (P<0.001) for ovulation rate (+1.14 ovulations), litter size (+0.8 lambs), lamb survival (-18%), lambs born per ewe joined (+0.64 lambs) and total weight of lamb born per ewe joined (0.5 kg). Gootwine et al. (2001) analysed the impact of FecB introgression into the Assaf and Awassi breeds of sheep and found that genotype and parity had a highly significant effect (P<0.005) on prolificacy while the effect of backcrossing stage was not significant (P>0.6). The authors further reported that the prolificacy of FecB carriers were 1.88 and 1.22 lambs born / ewe lambing in Booroola Awassi crosses for the homozygotes and heterozygotes respectively and prolificacy reached a maximum of 2.18 in second back crosses.
37 Davis et al. (2002) screened seven strains of sheep for the presence of FecB and FecX I mutations. They found Garole and Javanese sheep to carry FecB mutation and FecX I mutation was absent in all the strains studied. Further, based on the test results and historical and circumstantial records, they also concluded that Booroola allele was introduced into Australian flocks from Garole sheep of India. Southey et al. (2002) compared the productivity of Booroola Merino (BM) x Rambouillet (R) ewes, from the first and second backcrosses to R rams and purebred R ewes. They reported an increase (P<0.001) of ovulation rate by 1.6 ova per ewe and prolificacy by 0.65 lambs born per ewe lambing for each copy of the FecB allele. The BM crossbred ewes were 11 kg lighter than R ewes (P<0.001) at breeding. Ewes of FecB B+ genotype produced lambs with lower (P<0.001) live weights than did ewes of FecB ++ genotype with the differences ranging from -1.4 kg at birth to -5.6 kg at 120 days of age. Lambs from FecB B+ ewes had approximately 15% lower (P<0.001) survival than did lambs from FecB ++ ewes. They also concluded that higher reproductive performance of FecB B+ ewes was offset by poor growth and survival of their lambs resulting in a lack of difference between FecB genotypes for total weight of lamb produced per ewe at 30, 60 or 120 days post-partum. Willingham et al. (2002) studied the effect of FecB allele on birth weight and post weaning production traits of Rambouillet Booroola cross wethers. They reported that genotype of lamb had no effect on birth weight (BW), adjusted 91 day weaning weight (AWW), adjusted 203 day final weight (AFW) or post weaning average daily gain (PADG) and the differences in BW, AWW and AFW were due to birth type (P<0.0001). Significant sire effect was also found for BW, AWW and AFW. Rearing type had a significant effect on AWW (P<0.0001) and AFW (P<0.0001). Genotype within sire, birth type, or rear type was not found to have significant effect on PADG. Growth rate of wether lambs that had the FecB allele was not significantly different from those that did not. Chu et al. (2003) investigated the association of three microsatellite loci (Oar AE101, BM1329 and BMS2508) located in a 10 cm region covering the FecB
38 gene and litter size in 244 ewes of small tail Han sheep and reported that BMS2508 had significant (P<0.05) effect on litter size in second parity. Nimbkar et al. (2003a) investigated the growth rates of lambs born to crosses of highly prolific Garole with Deccani and Bannur. They reported that breed of sire, breed of dam, year of birth and type of birth of lambs had a highly significant (P<0.01) effect on post natal body weight up to 6 months. Nimbkar et al. (2003b) studied the ovulation rate (OR) and litter size (LS) in non carrier Deccani, Bannur, heterozygote Garole and F 1 ewes of crosses of Garole with Deccani and Bannur. They found that one copy of FecB allele increased OR from 1.03 to 2.02 and LS from 1.01 to 1.83 (average of second and third parities) in multiparous ewes and one copy of the allele increased litter size by 0.52, 0.61 and 1.03 in first, second and third parities, respectively in ¼ Garole ewes. Schulze et al. (2003) studied the effect of FecB allele on ovulation rate, fertility, litter size, number of lambs weaned within paternal half sib families in Rambouillet cross ewes. They reported that estimated differences between heterozygous FecB and non carrier ewes were ± 0.12 ova/cycle (P = 0.001) for ovulation rate and ± 0.16 lambs born/ewe lambing (P = 0.002) and ± 0.18 lambs weaned/ewe lambing in first parity ewes. The estimated body weight differences between FecB B+ and FecB ++ ewes were ± 0.97 kg at 7 month of age (P = 0.36) and ± 1.15 at 18 months of age (P = 0.07). The differences between FecB B+ and FecB ++ ewes for other traits was not significant (P<0.05). Sharma et al. (2004) investigated the reproduction and production traits of Garole x Malpura (GM) sheep and reported that traits such as lambing rate, litter size at birth and weaning were higher in Malpura ewes. They also reported that type of birth influenced birth weight and weaning weight only. Weight of lambs weaned / ewe lambed in Malpura and G x M genetic group was kg and kg respectively. Average liter size at birth was 1.02 and 1.46 and litter size at
39 weaning was 0.97 and 1.19 in Malpura and GM respectively. The twin lambing in GM was 45.71% compared to 2.55% of the Malpura. Abella et al. (2005) analyzed the effects of the FecB allele on birth weight, body growth rate in 44 FecB B+ and 48 FecB ++ Booroola Merinos d'arles (MA) ewe lambs and 46 MA ewe lambs. The presence of FecB allele was determined by ovulation rate of 3, at least once. They found that type of birth (single Vs twins) but not the presence of the FecB allele, affected birth weight and body growth. They concluded that the presence of one copy of the FecB allele did not modify puberty which is an important difference between the Booroola and other prolific breeds such as Romanov, Finn or D'Man, which were distinctly characterized by precocious puberty. Gootwine (2005) studied the effects of carrying the FecB allele on birth weight and early post natal growth traits in Booroola Merino x Assaf. They reported that the FecB allele negatively affected (P<0.05) the birth weight and post weaning growth rates. Jia et al. (2005) investigated the polymorphism of BMPR1B gene and its effect on litter size in Small tailed Han sheep, Poll Dorsett and their crosses. They reported that the FecB BB genotype (44.55%) and FecB allele (66.34%) frequencies in small tailed Han sheep were higher than those of others and polymorphism of BMPR1B gene was associated positively with litter size. The mean litter size of genotype FecB BB and FecB B+ were about 1.04 and 0.74 more than wild type (FecB ++ ) genotype (P<0.05). Pardeshi et al. (2005) screened four Indian breeds of sheep viz. Garole (136), Bannur (26), Madras Red (20) and five strains of Deccani namely Lonand (150), Sangola (20), Kolhapuri (20), Sangamneri (20) and Magdyal (20) for the presence of FecB mutation and found that Garole alone carried the mutation. Further, they reported that introgression of one copy of FecB allele increased the prolificacy of Deccani sheep by about 0.7 lambs born/ewe.
40 Kolte et al. (2005) crossed Garole sires with non prolific Malpura ewes to introgress the FecB allele into Garole x Malpura (G x M) to increase the prolificacy and to study the effect of carrying FecB gene on body weight in Garole and G x M sheep. They found litter size to be 1.87 and 1.48 in Garole and G x M crosses. They could not find any significant effect (P < 0.05) of FecB B allele on body weight in both Garole and G x M but for a significant effect (P<0.05) on birth weight in G x M crosses. They could not identify any significant interaction between genetic group and the FecB genotype. Nimbkar et al. (2005) investigated the reproductive performance of ¼ Garole ewes (with Deccani and Bannur breeds). They found that FecB B+ ewes produced 0.5 lambs more per ewe lambing, weaned 0.3 more lambs and 1.1 kg higher litter weight at 105 days. The heterozygous animals produced 49% twins, 2.5% triplets and remaining were singles. Wang et al. (2005) performed BMPR1B gene polymorphism analysis to identify the effect of different alleles on sheep litter size in four sheep lines, Hu-Yang, Chinese Merino monotocous, Chinese Merino multiparous for wool production and Chinese Merino multiparous for mutton production. They found a A to G SNP in BMPR1B gene at base 746 and three genotypes (FecB BB, FecB B+ and FecB ++ ), based on A to G locus, were found in all four lines. They concluded that the A to G mutation influenced significantly the sheep litter sizes, and the FecB BB and FecB B+ ewes had significant higher litter sizes than FecB ++ ewes. They found frequencies of genotypes vary significantly among the lines (P<0.001), with FecB BB genotype primarily existing in Hu-Yang, FecB ++ genotype in Chinese Merino monotocous line and FecB B+ genotype in Chinese Merino multiparous lines. Davis et al. (2006) screened 21 prolific breeds and strains of sheep from around the world for the FecB mutation. They identified FecB mutation in two breeds, Hu and Han from China, but not in any of the other breeds.
41 Gootwine et al. (2006) studied the effect of FecB mutation in Assaf sheep and reported a significant (P = 0.01) difference in birth weight between the homozygous FecB lambs and non carriers lambs. They also identified a FecB associated maternal effect on the birth weight of ewe lambs. They also found that genotypes of the lambs did not affect their preweaning growth rate while the post weaning growth rate varied significantly (P = 0.05) between the FecB homozygotes and the non homozygotes. The genotype at the FecB locus also decreased mature body weight of ewes highly significantly (P<0.001) between the homozygote and non homozygote genotypes. Kumar et al. (2006a) studied the linkage of twinning with FecB mutation and found FecB mutation was associated with twinning/higher litter size in Garole ewes, while twinning in Marwari and Bharat Merino ewes was not linked with FecB mutation. Kumar et al. (2006b) screened the Garole, Garole x Malpura (GM) and Malpura sheep for the presence of FecB mutation. They found the mutation to be present in Garole (98% approximately) and in GM crosses which had atleast one litter of twin/triplets and not in Malpura. GM ewes that never produced twins were all non-carriers of the FecB mutation. The mean litter size was 1.95 ± 0.08 and 1.60 ± 0.11 in Garole and GM ewes, respectively. None of the Malpura sheep carried the FecB mutation. They also reported that a single copy of FecB allele produced 0.93 extra lambs in GM ewes and the allele had a partially dominant effect on litter size. Chu et al. (2007) detected single nucleotide polymorphisms of BMPR1B (Q249R) and BMP15 (Q239Ter) genes in Small Tailed Han ewes (n = 188) and studied the combined effect of the 2 genes on the prolificacy of Small Tailed Han sheep. The Small Tailed Han ewes with genotypes FecB BB and FecB B+ had 1.40 (P<0.01) and 1.11 (P<0.01) more lambs, respectively, than those with genotype FecB ++. Further, they reported that Small Tailed Han ewes carrying mutations in both BMPR1B and BMP15 genes had greater litter size than those with either mutation alone.
42 Guan et al. (2007) investigated the FecB gene polymorphism and its effect on litter size, body weight and body size in 9 breeds of Chinese sheep (n = 615). They reported that all the Hu animals were homozygous for the FecB allele (FecB BB ) and in the Chinese Merino prolific meat strain, the genotype frequencies of FecB BB, FecB B+ and FecB ++ were 51%, 30% and 19%, respectively. In the Chinese Merino prolific meat strain, the mean litter sizes of ewes with genotype FecB BB and FecB B+ were 2.84 ± 0.74 and 2.34 ± 0.63, whereas FecB ++ ewes had a litter size of only 1.2 ± Body weights of FecB BB/B+ lambs at 90 days after birth, were higher than that of FecB ++ lambs (18.6 ± 3.70 kg, 18.0 ± 3.71 kg versus 15.6 ± 2.22 kg). The heart girth and chest width of FecB BB/B+ lambs were significantly longer than FecB ++ lambs. But they could not identify significant difference in either body weight or body size at day 120. They observed that litter size at first lambing in Hu at different regions were significantly different. In addition to the additive effect on litter size, they identified for the first time a positive effect of the FecB gene on early postnatal body growth. Nimbkar et al. (2007) investigated the effect of introgression of FecB allele from Garole into Deccani breed. They reported that one copy of the FecB allele increased the number of lambs born alive per ewe lambing by 0.54 and the effect of this allele on this trait was completely dominant. The number of lambs alive at 3 months per ewe lambing increased by 0.41 with one copy of the FecB allele and the total weight of 3 months old lamb increased by 1.86 kg. Further, heterozygous (FecB B+ ) and homozygous (FecB BB ) ewes tended to have lower weights. Walkden - Brown et al. (2007) studied the expression of reproductive and production traits of ewes having the FecB mutation and reported that the mutation does not have deleterious effects on growth (weaning weight and 18 month old hogget weight) and wool production but for those with a higher incidence of multiple births. Further the effect of FecB allele on ovulation rate was additive with a dominant effect on litter size. They also observed a non-significant decrease in
43 litter size with the second copy of the allele and lower fertility rates and increased lamb losses in homozygous FecB BB ewes. Banerjee et al. (2008) found the prolificacy of Garole to be higher in its native tract than in organized farm, 2.65 ± 0.3 Vs 2.39 ± 0.3 and 1.86 ± 0.2 Vs 1.59 ± 0.41 for FecB BB and FecB B+ animals respectively. They reported that introgression of single copy of the FecB allele into Muzzafarnagri from Garole increased the mean litter size at birth from 0.80 ± 0.1 to 1.42 ± 0.2. Gootwine et al. (2008) investigated the prolificacy up to fifth parity in 31/32 Awassi and 31/32 Assaf sheep of all the three genotypes at the FecB locus. In the Awassi, lambs born/lambing (LB/L) in FecB ++, FecB B+ and FecB BB ewes was 1.28, 1.90 and 1.92, respectively while in Assaf it was 1.68, 2.40 and 2.55 LB/L, respectively. FecB genotype-litter size interactions were not significant (P<0.05). They investigated breed environment combination effects of FecB locus on prolificacy of the FecB ++ and FecB B+ genotypes and identified a multiplicative effect of FecB allele on prolificacy. Kumar et al. (2008a) identified the Booroola (FecB) mutation in Kendrapada sheep with a mean litter size of 2.08 ± 0.08 (n = 30). They reported the frequency of the FecB allele in this sample as Though the results indicated the higher frequency of FecB mutation, the gene is not fixed in the population as in Garole sheep. Kumar et al. (2008b) evaluated the effects of FecB genotypes on body weight, ewe s productivity efficiency (EPE) and litter size in FecB introgressed Garole Malpura (GM) crossbred sheep (n = 235) with a frequency of The FecB genotypes were significantly (P<0.01) associated with the lamb s body weights from birth to 12 months of age. Type of birth and sex significantly (P<0.01) affected the body weight from birth to 12 months of age; and body weight of single born lambs was significantly higher (P<0.01) than that of twins and triplets from birth to 12 months of age. The EPE was affected significantly (P<0.01) by the FecB
44 genotypes at birth, 3 and 12 months of age. The EPE of B+ and BB ewes were 7.86 kg (36.9%) and 2.32 kg (10.9%) higher as compared to ++ ewes at 12 months of age, respectively. The mean litter size of BB ewes (2.17 ± 0.24) was significantly higher (P<0.01) than that of B+ ewes (1.73 ± 0.04) and ++ ewes (1.03 ± 0.23). They found that the body weight and ADG of carrier lambs (BB and B+) was comparatively lower than that of non-carriers (++), while EPE of B+ ewes was comparatively higher than that of BB and ++ ewes. Further, they reported an increase of 0.70 and 1.14 extra lambs in heterozygous and homozygous individuals compared to non-carriers (++), respectively. Mishra et al. (2008) evaluated the effects of FecB genotypes on cumulative lifetime (three lamb crops) litter size (CLS), cumulative number of weaned lambs (CWL) and cumulative ewe s productivity efficiency (CEPE) in 51 Garole Malpura (GM) crossbred sheep. The majority (78.4%) of F 1 GM individuals were carriers (FecB B+ ) for the FecB mutation. In the first parity 55% FecB B+ ewes gave birth to multiple lambs. The FecB genotypes were significantly (P < 0.01) associated with the CLS and CWL. The FecB B+ ewes resulted in 65.6 and 62.1% higher CLS and CWL, respectively compared to non-carriers. The CEPE was also affected significantly by the FecB genotypes at birth, weaning, 6 and 12 months of age. The FecB B+ ewes weaned 20.9% higher total litter weight as compared to FecB ++ ewes and at 12 months age the difference was 43.5% in favor of FecB B+ ewes. The study indicated that the CLS, CWL and CEPE of carrier ewes (FecB B+ ) were comparatively higher than that of non-carriers (FecB ++ ). Arora et al. (2009) investigated the effect of mating of different combination of FecB allele carrier rams and ewes on growth traits in the progeny. They found a highly significant (P<0.01) effect of genotype and sex of animal on body weight from weaning to twelve months, while year of birth had a highly significant (P<0.01) influence on six and twelve months body weight. Parity of lambing had a significant effect (P<0.05) only on lambs weaning weight. Highly significant (P<0.01) effect of birth type was noticed on body weight up to six months. Ewes
45 mating weight had a highly significant (P<0.01) effect on weight traits up to six months.
46 Litter size Table 2.1 Studies showing effect of FecB B allele on litter size, number of lambs weaned, birth weight and total weight of lamb weaned Lambs weaned Birth weight (kg) Weight weaned (kg) Records (n) F gene contrast and ewe breeds a Country Reference b -1.9 b 2,000 B L x M Vs BL x M Australia Afolayan et al., FF Vs ++, G x Mal intercross F+ Vs ++ India Kumar et al., 2008b F+ Vs ++, G x Mal India Mishra et al., ,245 2,315 FF Vs ++, B M x Awassi F+ Vs ++ FF Vs ++, B M x Assaf F+ Vs ++ Israel Gootwine et al., 2008 Israel Gootwine et al., FF Vs ++, G x Muzzafarnagri India Banerjee et al., bc bc , b +3.3 b 599 2,200 FF Vs ++, Chinese meat M F+ Vs ++ FF Vs ++, G x Dec backcross F+ Vs ++ FF Vs ++, B M x M backcross F+ Vs ++ FF Vs ++, B M x RomS backcross F+ Vs ++ China Guan et al., 2007 India Nimbkar et al.,2007 Australia Walkden Brown et al., 2007 New Zealand Farquhar et al., ,815 F+ Vs ++, G x Dec India Nimbkar et al., FF Vs ++, B M x Assaf F+ Vs ++ Israel Gootwine et al., F+ Vs ++, G crosses India Nimbkar et al., 2003b F+ Vs ++, B M x Ram USA Schulze et al., 2003
47 Litter size Lambs weaned Birth weight (kg) Weight weaned (kg) Records (n) F gene contrast and ewe breeds a Country Reference b 278 F+ Vs ++, B M x Ram & backcross USA Southey et al., F+ Vs ++, B M x Tex backcross Netherlands Nieuwhof et al., b 686 F+ Vs ++, B M x Arles M backcross France Teyssier et al., b b b b 137 FF Vs ++, B M x SB, F 2 & backcross F+ Vs ++, (BL x B M) x M Vs BL x M B L(FF) x M Vs BL x M UK Boulton et al., 1995 Australia Eppleston and Robards, F+ Vs ++, B M x D(9-19 months) Australia Fogarty et al., b -1.3 b 965 F+ Vs ++, B M x D Australia Fogarty and Hall, F+ Vs ++, B M x Aw backcross Israel Gootwine et al., b 925 F+ Vs ++, B M x Rom, B M x Per New Zealand Meyer et al., 1994a b -6.5 b 443 F+ Vs ++, B M x D Australia Fogarty et al., F+ Vs ++, B M x Arles M backcross France Bodin et al., b +1.8 b 3,782 B M x Vs local x 11 experiments 9 countries Davis et al., FF Vs ++; combined flock data F+ Vs ++ New Zealand Dodds et al., b 246 B M x Cp Vs M x Cp New Zealand Isaacs et al., B M x Fi & B M x Suf Vs Fi & Suf Canada Castonguay et al., F+ Vs ++, B M x M Australia Kleemann et al., b +7.0 b 6,000 B M x Rom backcross nucleus Vs Rom control New Zealand Williams and Nicoll, n.a. B M x P Vs P BL(B M x P) Vs BL x P Australia King, F+ Vs ++, B M x Rom New Zealand Quirke et al., 1987
48 Litter size Lambs weaned Birth weight (kg) Weight weaned (kg) Records (n) F gene contrast and ewe breeds a Country Reference b +2.5 b 614 B M x M Vs M Australia Beetson and Lewer, b b n.a B M(F+) x Var Vs Var, 6 comm. Flocks B M(FF) x Var Vs Var, 3 comm. Flocks F+ Vs ++, B M x Rom( 7 9 months) F+ Vs ++, B M x Rom( years) FF Vs F+, B M x Rom( 7 9 months) FF Vs F+, B M x Rom( years) New Zealand Davis and Hinch, 1985 New Zealand Montgomery et al., b 617 B M x M Vs M Australia Ponzoni et al., b 525 BL & D x B M Vs BL & D x M Australia Bindon et al., BL x (B M x M) Vs BL x M Australia Dunstan and Phillips, b n.a B M x M Vs M Australia McGuirk et al., F+ Vs ++, B M x M, B M x Rom New Zealand Montgomery et al., F+ Vs ++, B M x M backcross New Zealand Davis et al., b b 1, B M Vs M B M x M Vs M Australia Piper and Bindon, ,008 B M x M Vs M New Zealand Allison et al., 1977 a Aw Awassi Fi Finsheep RomS Romney (Selected) As Assaf G Garole Suf Suffolk B M Booroola Merino M Merino Tex Texel B L B ooroola Leicester (B M x BL 7/8 backcross) Mal Malpura Var Various breeds BL Border Leicester P Polworth b Per ewe joined Cp Coopworth Per Perendale c Based on ewes scanned D Dorset Ram Rambouillet d Ovulation rate of 210 mixed age Booroola Merino ewes not available Dec Deccani Rom Romney Adapted from Fogarty (2008)
49 2.2 INSULIN LIKE GROWTH FACTOR BINDING PROTEIN-3 (IGFBP-3) Kupffer cells of the liver are the principal tissue involved in the synthesis and secretion of IGFBP-3 (Arany et al., 1994). It is also synthesized by cells of skeletal muscle (Isgaard et al., 1988), cells of mammary gland (Romagnolo et al., 1992), osteoblast and other bone cells (Linkhart et al., 1996), theca interstitial cells, luteal cells and granulosa cells of ovarian follicle (Spicer and Echternkamp, 1995) and by various immunocompetent cells (Auernhammer and Strasburger, 1995) Biochemistry of IGFBP-3 Insulin like Growth Factor Binding Proteins (IGFBPs) are a family of secreted proteins that forms an essential part of the Insulin-like Growth Factor (IGF) system. These molecules have structural similarities to insulin and hence they were named insulin-like growth factor. The IGF system is an evolutionarily conserved signaling pathway with two IGF ligands, two IGF receptors and six IGF binding proteins (Duan and Xu, 2005). These IGFBPs bind IGF with high affinities that are equal to or greater than those of the IGF-receptors. Six different IGFBPs (IGFBP-1 to 6), have been isolated and characterized from variety of species including humans, mouse and rats. These IGFBPs, have a molecular mass of kda with a highly similar domain organization. They all have a highly conserved N-terminal domain, a conserved C-terminal domain, and a variable central linker (L) domain. This domain structure is highly conserved among this gene family and across species (Duan et al., 1999). The N-domain contains 12 conserved cysteine residues. Though the C-domains contribute to the ligand-binding capacity, the major IGF-binding site lies in N-domains (Clemmons, 2001). All C-domains have six conserved cysteine residues and often mediate IGFBP interactions with other proteins. IGFBP-3 exists as many translational variants, the major modifications being the degree of glycosylation and proteolytic cleavage Gene structure and mapping In cattle, IGFBP-3 gene had been mapped to Chromosome 4 (Maciulla et al., 1997) and is 8.9 Kb in length which is composed of five exons; the fifth exon consists
50 of 3 untranslated region (Martin and Baxter, 1992). In human, IGFBP-1 and IGFBP- 3 are on the same chromosome organized in a tail to tail orientation, about 20 bp apart (Cubbage et al., 1990). The bovine IGFBP-3 gene has been cloned and characterized and its mrna is 1.65 Kb in length (Spratt et al., 1991). But information on complete DNA sequence is not available in sheep so far; however, the complete mrna sequence of IGFBP-3 gene is available with GenBank (accession number FJ752574) Biological functions of IGFBP-3 IGFBPs are carrier proteins that regulate circulating IGF turnover, transport, distribution and thus facilitate the varied functions of insulin like growth factors (IGFs) system. IGFBP-3 is the most important of the six IGFBPs and acts as the principal binding protein for circulating IGF-I, protects it from proteolytic degradation, and regulates its interaction with the IGF-1R (Collet-Solberg and Cohen, 1996). The role of members of IGF system has been indicated in communication between fetal and maternal tissues and to be involved in the initiation, development, and maintenance of pregnancy and also in regulating lifespan. Post-translational modifications and proteolysis influences IGFBP-3 activity in the circulation and at the cellular level (Collett-Solberg and Cohen, 1996). IGFBP-3 has both IGF dependant and independent action. The IGFBP-3 has multiple mechanisms of action i.e., stimulatory and inhibitory and multiple modes of action autocrine, paracrine and endocrine (Hossner et al., 1997). Based on its association with the IGF to exert its action, its activity can be classified as IGF dependent action and IGF independent action. The IGFBP-3 primarily binds with a larger protein, ALS (Acid labile subunit) and IGF to form a ternary complex of 150 KDa (Lee and Rechler, 1995). This ternary complex acts as a stable reservoir of circulating IGFs and this complex does not cross the capillary endothelium. Insulin-like growth factor binding protein-3 (IGFBP-3) binds about 90% of the IGF-I present in serum and is an important determinant for IGF-I bioactivity (Baxter, 1991). The IGF IGFBP binary complexes probably cross the capillary endothelium carrying the bound IGF to target tissues.
51 The stimulating activity of the IGFBPs is essentially due to IGF IGFBP complex association with cell surfaces. Cell surface association (Binoux and Hossenlopp, 1988) and proteolysis of IGFBP-3 results in reduced affinity for IGF-I. Thus, the potentiating action on IGF-I activity is due to the IGFBP-3 fragment with low ligand binding affinity, whereas intact high affinity IGFBP-3 reduces IGF activity (Schmid et al., 1991). Insulin like growth factors (IGFs) and their binding proteins (IGFBPs) along with the renin angiotensin system, play an important role in follicular control and ovulation. In the ovary, IGFBPs bind with IGFs lowering concentrations of bioactive IGF. IGFBP-3 along with IGFBP-2 inhibits binding of IGF-I and -II to bovine thecal and luteal cells, inhibiting IGF-I induced cell proliferation and progesterone production (Spicer et al., 1997). The insulin-like growth factor family has a major influence on embryonic, fetal and placental development (Baker et al., 1993); differences in IGF expression may account for embryonic losses during placental attachment and differences in growth factor gene expression during early placental attachment may directly or indirectly contribute to increased embryonic losses (Moore et al., 2007). The role of IGFBP-3 in the conceptus capsule of embryos in modulating the action of IGFs on the developing foetus has been elucidated by Herrier et al. (2000). Further, IGFBP-3 increases the mitogenic activity of IGFs in vitro (Zapf, 1995). Ko et al. (1991) found the presence of IGF-I and IGF-II in ovine uterine luminal fluid and the stimulatory effect of combined IGFs on OTP-1 secretion in vitro, suggesting the involvement of peptide growth factors in peri-attachment conceptus development in sheep. In 2002, Thue and Buchanan reported that IGFBP-3 levels peak during puberty. Rajah et al. (1997) reported a novel pathway independent of either p53 or IGF IGF receptor for the IGFBP-3 in inducing apoptosis of p53 prostrate cancer line PC3. Oh et al. (1993) has elaborated on the role of IGFBP-3 in reducing the proliferation of breast and prostate cancer cells by a cellular signaling pathway independent of IGFs. Additionally, IGFBP-3 has its own IGF-independent apoptotic effects, mediated through a specific cell surface receptor (Firth and Baxter, 2002).
52 2.2.4 Polymorphism and production association study Sheep Kumar et al. (2006d) studied the PCR-RFLP HaeIII restriction pattern of a 654 bp fragment comprising of a part of exon 2, complete intron 2, exon 3 and a part of intron 3 of IGFBP-3 gene in Marwari, Mandya, Madras Red, Muzzafanagari and Bannur breeds of sheep. HaeIII restriction enzyme digestion of 654 bp yielded single restriction pattern of eight fragments of sizes 201, 201, 87, 67, 56, 19, 16 and 7 bp in all the animals studied revealing absence of polymorphism in sheep. Nucleotide sequencing revealed 90% homology of IGFBP-3 gene with cattle and buffalo. Shen et al. (2008) studied the genetic variation in IGFBP-3 gene in Chinese Merino and Kazakh sheep by PCR-SSCP analysis. They amplified a 178 bp fragment corresponding to partial intron 1 which showed three unique banding patterns by SSCP analysis. Frequencies of the genotype AA, AB, BB and allele A, B in Chinese Merino sheep were 0.70, 0.24, 0.06, and 0.82, 0.18 respectively, and they were 0.87, 0.13, 0.00, and 0.93, 0.07 respectively in Kazakh sheep. Sequence analysis revealed a G/T transversion at position 122 of the fragment. Goats Lan et al. (2007c) studied the polymorphisms of goat IGFBP-3 gene by PCR- SSCP and DNA sequencing methods in 767 samples. They identified four mutations (namely, EX2 58C>T resulting in P155S change, EX2 67C>G producing R158G change, IVS2+78A>G and IVS2+217G>A) at the goat IGFBP-3 locus. They further, described HaeIII and XspI PCR-RFLP methods for detecting EX2 67C>G and IVS2+217G>A mutations, respectively. In the PCR-RFLP analysis with HaeIII, the frequencies of goat IGFBP-3-H2 allele varied from to in seven Chinese native breeds. In the PCR-RFLP analysis with XspI, the frequencies of goat IGFBP-3- X1 alleles were 0.507, 0.700, 0.831, 0.283, 0.242, and for Xinong Sannen, Laoshan, Guanzhong, Inner Mongolia White Cashmere, Guizhou White, Leizhou and Shaannan White populations respectively. The associations of the HaeIII
53 and XspI PCR-RFLPs of goat IGFBP-3 locus with milk traits were analyzed in dairy goat, but significant statistical results were not found between them (P > 0.05). Cattle Spratt et al. (1991) investigated the bovine IGFBP-3 gene by isolating cdna encoding the complex amino acid sequence for bigfbp-3. The deduced amino acid sequence revealed a mature polypeptide consisting of 264 amino acids and a 27 amino acid putative signal peptide. The amino acid sequence had 78 89% homology with those of human, rat and pig and the most divergent region between these species was the central region of the protein. Further they reported that bovine IGFBP-3 cdna sequence was 1568 bp. Maciulla et al. (1997) detected HaeIII - RFLP in bigfbp-3 gene of taurine cattle (Angus, Hereford and Holstein). The amplified fragment consisted of 3 exons and 2 introns. A 651 bp amplified fragment was digested with HaeIII revealing two allelic variants A and B in intron 2. The alleleic variant A consisted of 8 fragments i.e 199, 164, 154, 56, 36, 18, 16 and 8 bp whereas the allele B had 7 fragments i.e., 215,164, 154, 56, 36, 18 and 8 bp. Haegeman et al. (1999) cloned a 653 bp fragment of the IGFBP-3 from a Blonde d Aquitaine and a Belgian Blue crossbred animal and sequenced the fragments. They identified a T to C substitution in intron 2 of the IGFBP-3 gene in the Belgian Blue crossbred animal which could be identified by digestion with NlaIII. The length of the digestion fragments were 470 bp bp + 69 bp for the mutant allele and 539 bp bp for the wild type allele. The frequency of the mutant alleles were 0.7 (Belgian blue), 0.7 (Red Pied), 0.25 (Red Holstein), 0.43 (Black Holstein), 0.5 (Belgian blue crossbred), 0.43 (Limousin), 0.2 (Blonde d Aquitaine) and 0.47 (Red West Flanders). Shukla (2001) studied HaeIII PCR-RFLP pattern in both Indicine (Nimari, Gir and Sahiwal) and Taurine (Holstein Friesian and Jersey) breeds of cattle. The amplified fragment (651 bp) on digestion with HaeIII yielded 8 restriction fragments of sizes 199, 164, 154, 56, 36, 18, 16 and 8 bp (AA genotype) in Nimari, Gir and Sahiwal. HF and Jersey had three restriction fragment pattern: AA 199, 164, 154,
54 56, 36, 18 and 8 bp; BB 215, 164, 154, 56, 36, 18 and 8 bp and AB 215, 199, 164, 154, 56, 36, 18, 16 and 8 bp. The genotype frequency of AA genotype and allelic frequency of A allele was 1.0 (unity) in Indicine breeds, while the genotype frequencies were found to be 0.750, and in Jersey and 0.294, and in HF. The allelic frequencies of A and B were and 0.137, and and in Jersey and HF respectively. Sun et al. (2002) investigated the HaeIII PCR-RFLP IGFBP-3 gene polymorphism and its relationship with the beef performance of Qinchuan cattle. The frequency of AA, AB and BB genotypes were found to be 0.70, 0.28 and 0.02 and the allele frequencies were 0.84 and 0.16 for A and B respectively. They also reported that eye muscle area of AA genotype was significantly higher than BB genotype (P < 0.05) and beef fat content of AB and BB genotypes were significantly higher than AA (P = 0.01). Thue and Buchanan (2002) detected an SNP where a thymine was substituted with a cytosine with the amino acid remaining as serine. They developed a EarI Forced PCR-RFLP to detect the polymorphism which digested the 260 bp fragment to 239 and 21 bp in the presence of cytosine. The 239 and 21 bp alleles occurred with a frequency of 30% in 20 unrelated cattle of the Canadian beef reference herd. Kim et al. (2005) thoroughly investigated the full length of the IGFBP-3 gene by direct sequencing in 24 animals of the Korean Hanwoo cattle (Bos taurus coreanae). They identified twenty two novel SNPs one in promoter, eight in intron 1, three in intron 2, two in intron 3, seven in intron 4 and one in 5 UTR. Choudhary et al. (2007) studied the HaeIII PCR-RFLP restriction patterns of IGFBP-3 gene in Hariana, Holstein Friesian and its crosses. They found 3 restriction patterns in HF and crossbred cattle revealing polymorphism in both the populations and only one restriction pattern in Hariana cattle. The polymorphic site was identified as a C to A mutation in the intron 2. The frequency of the genotypes AA, AB and BB were 0.65, 0.32 and 0.03 in crossbred cattle, while the allele frequencies were 0.29, 0.65 and 0.06 in Holstein Friesian, respectively. In crossbred cattle, animals of AB
55 genotype showed higher birth weight and body weight than the animals possessing AA genotype. Zhang et al. (2007) studied the association of polymorphism between IGFBP- 3 genotypes with milk production traits and mastitis related traits in Chinese Holstein. Allele frequencies of A and B in IGFBP-3 gene were and in Chinese Holstein population. The genotypes of animals at IGFBP-3 locus significantly affected 305 day standard milk yield, protein percentage and somatic cell score. The B allele increased the milk yield, while the AB genotype had a higher protein percentage than AA and BB. Cheong et al. (2008) investigated the polymorphic sites identified earlier (Kim et al., 2005) to find possible association of SNPs of IGFBP-3 gene with cold carcass weight and marbling score in Korean cattle. They identified that 854 G>C SNP had putative association with marbling score. Buffalo Padma et al. (2004) explored the IGFBP-3 gene using HaeIII, TaqI and MspI PCR-RFLP polymorphism of a 651 bp fragment in Murrah, Surti, Jaffarabadi and Nagpuri breeds. HaeIII digestion yielded 8 fragments i.e., 199, 164, 154, 56, 36, 18, 16 and 8 bp while TaqI digestion gave 2 fragments of 413 and 238 bp, MspI digestion yielded 2 fragments of 507 and 144 bp in all the animals studied revealing non polymorphic nature of the gene while the exotic cattle breeds and their crosses were polymorphic at HaeIII PCR-RFLP sites. Further, nucleotide sequence revealed an addition of 4 bases in the intronic region. 2.3 PITUITARY TRANSCRIPTION FACTOR 1 (POU1F1) The pituitary gland secretes many transcription factors including POU1F1, Rpx (Rathke s Pouch homeobox), Pitx (Pituitary homeobox), Lhx3 (LIM homeobox 3) and Prop -1 (Prophet of Pit-1). These transcription factors play a major role in general body growth, development of organ and specific cell types.
56 2.3.1 Biochemistry of POU1F1 POU1F1 (also known as PIT-1 or GHF-1 or Pit-1 ß) is a tissue-specific transcription factor that belongs to the large family of POU domain proteins. The acronym POU was derived from the first described proteins of this domain namely - POU1F1; Oct1, 2 and Unc86, while the first two were identified in mammals and the latter is associated with neuronal development in Caenorhabditis elegans. These proteins have a region of homology called as the POU domain. The protein has three functional domains, a trans - activation domain (TAD), a POU-specific (POU-S) domain, a ~ 75 amino acid amino- terminal region and the carboxy terminal 60 aminoacid, POU homeo (POU-H) domain. The POU-S and POU-H domains are both crucial for high-affinity DNA binding on the GH and PRL promoters (Dattani, 2005). Chen et al. (1990) identified two Pit-1 binding and regulatory elements in the gene flanking the cap site. The 5 sequence was a positive regulatory element, conferring Pit-1 dependant gene expression while the 3 element was an inhibitory element attenuating expression by 10 fold. Pit-1 expression is restricted to the anterior pituitary lobe (Bodner et al., 1988) and was identified by its specific binding to ATrich cell-specific elements in the rat PRL and GH genes (Ingraham et al., 1988). Four splicing variants of POU1F1 gene has been reported in ovines - the wild-type (wt) open-reading frame (ORF) has 876 bp but the previously reported sequence of this variant by Thomas et al. (2000) differ by eight nucleotides revealing polymorphic nature of the variant; POU1F1-β, with a 78 bp insert downstream of the nucleotide 142 in the trans-activation domain with a 954 bp ORF; POU1F1-γ that lacks 225 bp of exon 3 and POU1F1-δ that lacks exons 3, 4 and 5 has a 426 bp ORF (Bastos et al., 2006b). Correspondingly the protein isoforms are characterized in terms of POU1F1 - wt (291 amino acid), insertion of 26 aa (amino acid) into the TAD results in POU1F1- β isoform with 317 aa. POU1F1-γ has 216 aa as a consequence of the loss of 75 aa from positions 72 to 146 of the Wt. The isoform, POU1F1-δ because of the 150 aa deletion has a mere 141 aa Gene structure and mapping The Ovine and Caprine POU1F1 gene were located to chromosome 1q (Woollard et al., 1999). The Bovine POU1F1 gene was localized to a region midway
57 between TGLA57 and RM95 (Moody et al., 1995) in chromosome 1 and in centromeric region of chromosome1 (BTA1) by Dierkes et al. (1998). The 5787bp POU1F1 gene in sheep consists of six exons and five introns and has a high level of conservation with its bovine, human and rat counterparts showing 98.2%, 91.2% and 86.2% of similarity at the coding level, respectively (Bastos et al., 2006a) Biological functions of POU1F1 POU1F1 is a tissue-specific transcription factor mainly expressed in the anterior pituitary (Bodner et al., 1988; Ingraham et al., 1988). POU is associated with varying biological functions since different splicing variants of this gene gives rise to mrna s and protein variants with diverse biological activities. This protein was first associated with a critical role in the transcriptional regulation of growth hormone (GH) and prolactin (PRL) genes (Lefevre et al., 1987). It is also involved in the activation of the β subunit of Thyroid Stimulating Hormone (TSH β) (Li et al., 1990), POU1F1 itself (Chen et al., 1990; McCormick et al., 1990) and Growth hormone releasing hormone receptor (GHRH-R) genes (Lin et al., 1992). POU1F1 is necessary for the differentiation, proliferation and survival of somatotrope, lactotrope and thyrotrope cells (Li et al., 1990) which are essential for the expression of GH, PRL and TSH β respectively. POU1F1 is expressed relatively late during embryonic development and expression persists throughout post-natal life and adulthood (Bodner et al., 1988). While POU1F1 - wt and POU1F1 - β are associated with transcriptional activation of GH and PRL, POU1F1 - γ and POU1F1-γ act as dominant negative repressors of POU1F1-wt transactivation (Bastos et al., 2006b). Mutations in the POU1F1 gene lead to a deficiency or an absence of GH, PRL, and TSH-β and thus have indirect influence on growth and reproduction. Mammalian growth and development requires steady expression of the POU1F1 gene (Ingraham et al., 1999). But expression of hormone deficiency vary in individuals with POU1F1 mutations; while GH and PRL deficiencies are observed earlier in life; TSH deficiency is highly variable with expression later in childhood (Pfaffle et al., 1992; Pfaffle et al.,1997).
58 Certain genotypes of this gene has been associated with superior fibre yield in goats (Lan et al., 2009a); milk yield (Zwierzschowski et al., 2001; Oshimo and Serrano, 2002) and milk protein yield (Renaville et al., 1997b) in cattle Polymorphism and production association study of POU1F1 Sheep Bastos et al. (2006b) characterized POU1F1 gene in Ovis aries which is 5787 bp including six exons and two complete introns in 100 animals of the Churra da Terra Quente breed and identified polymorphisms in exon 2, 3 and intron 4. In codon 58 of exon 2, a change from cysteine to tyrosine was observed. In exon 3, two polymorphisms were detected: a G to A transition at codon 89 producing glycine instead of asparagine and a G to A transition at codon 105 converting an alanine into threonine. In intron 4, an A to G transition was detected. Exons 1, 4 and 6 showed no polymorphisms. Ansary et al. (2008) studied Pit1 gene polymorphic variants by PCR-SSCP and identified two alleles, A and B with frequencies of 0.67 and 0.33 respectively. The genotypic frequencies were 0.37, 0.60 and 0.03 for AA, AB and B, respectively. They reported a significant (P< 0.05) association of the Pit1 genotypes with average daily gain from birth to three months. Goats Lan et al. (2007a) performed a DdeI PCR-RFLP for detecting a silent allele in a 450bp region of exon 6 and 3 UTR of the goat POU1F1 gene : TCT (241 Ser) > TCG (241 Ser). The frequencies of D 1 allele (200 bp, 118 bp, 102 bp, 20 bp and 11 bp) varied from to in the nine breeds studied. Milk yield (P < 0.05) and one year old weight (P < 0.05) exihibited significant association with DdeI PCR- RFLP genotypes. The genotype D 1 D 1 animals had a higher performance for milk yield, litter size and weight when compared to those with genotypes D 1 D 2 (P < 0.05). Hence, they have suggested POU1F1 gene as a potential candidate gene for milk performance, reproduction trait and weight trait.
59 Lan et al. (2007b) studied AluI PCR-RFLP pattern of POU1F1 gene in goats. The 450 bp exon 6 region revealed polymorphism when digested with AluI restriction enzyme. They identified four mutations. Two mutations (T to G and T to C) were found in exon 6 at nucleotide 60 and 174 and other two mutations (T to C and A to G) were in the 3 flanking region. The T to G mutation of the exon 6 revealed a silent allele at POU1F1 locus: TCT (Ser)-TCG (Ser) at position 241 of the mature protein (291 aa). The T to C mutation in the 174 th nucleotide of the POU1F1 locus: AGT (Ser)-AGC (Ser) at position 279 of the mature protein is also a silent allele which could be detected by AluI endonuclease. They named the allele characterized by the presence of T as POU1F1- T, while that of C for POU1F1-C. Three fragments viz. 216, 124 and 110 bp were produced by AluI digestion of the POU1F1-C allele, while the T allele produced two fragments of 340 and 110 bp. The frequency of POU1F1-C allele varied from to in the analyzed populations. They found significant (P<0.05) statistical association for milk yield and birth weight traits in Chinese goat breeds. Lan et al. (2009b) explored the AluI PCR-RFLP polymorphism of exon 6 and 3 untranslated region (UTR) in 4 Chinese goat breeds. Their analysis showed a predominance of TT genotype and the frequencies of allele T were 0.859, 0.976, and respectively in Shaanbei white cashmere goat, Boer, Xuhuai and Haimen. Further, based on the previously reported distributions of genotypic and allelic frequencies for nine breeds along with this four breeds, significant difference among populations were identified indicating that the breed factor significantly affects the molecular genetic character of POU1F1 gene. Further diversity analysis revealed that Chinese indigenous populations had a wide spectrum of genetic diversity in POU1F1-AluI locus. Cattle Woollard et al. (1994) amplified a 451 bp fragment of the Pit1 gene consisting of Intron 5 and Exon 6. On digestion with HinfI, two alleles were revealed. The A allele was undigested with HinfI yielding the original 451 bp fragment. The B allele had a restriction site, generating two fragments of 244 and 207 bp in length.
60 Renaville et al. (1997a) studied the 451 bp HinfI PCR-RFLP Pit1 gene polymorphism in Italian Holstein Friesian bulls. They identified 2 alleles viz. A and B: and three genotypes AA, AB and BB. The genotypic frequencies for AA, AB and BB were 2.2, 31.5 and 66.3 percent respectively. The A allele was found as superior for milk and protein yields, inferior for fat percentage and superior for body depth, angularity and rear leg set. Stasio et al. (2002) studied the polymorphism of POU1F1 gene and its association with meat production traits in 287 Piedmontese male calves by HinfI PCR-RFLP polymorphism. They investigated fourteen traits that were considered, expressing growth (weight at 5, 7 and 11 months, daily gain), size [withers height, trunk length, chest girth at 12 months] and meat conformation [withers width, shoulder muscularity, loin width, loin thickness, thigh muscularity, thigh profile, bone thinness]. They could not establish any association of POU1F1 polymorphism with meat production traits. Oprzadek et al. (2003) investigated the HinfI PCR-RFLP polymorphism of a 1355 bp region of exon 2 and 3 of Black and white Friesian bulls. The frequencies of the A and B allele were 0.25 and 0.75 respectively. They reported that the AA homozygotes had a higher chest girth and depth as well as circumference of round, while BB homozygotes showed higher length and width of round. The heterozygous bulls at the Pit1 locus consumed more dry matter and crude protein. Mattos et al. (2004) studied the Gyr bulls for Pit1 gene polymorphism in a 1355 bp region of exon 5 and 6. They observed Pit1 HinfI polymorphism and frequencies of A allele was 0.95% and the B allele was 0.05%. Association analysis revealed that heterozygous bulls were superior for milk fat production, in relation to homozygous Pit-1 HinfI animals. Zhao et al. (2004) studied the region between intron 2 and exon 6 of the Pit-1 gene to identify polymorphisms by PCR-SSCP and observed two polymorphisms in intron 3 and one each in intron 4 and 5. They also reported that selection on IGFI concentrations did not have any influence on the frequencies of these polymorphisms.
61 No significant association of these polymorphisms of this gene with growth and carcass traits could be found. Curi et al. (2006) studied the polymorphism pattern of POU1F1/HinfI PCR- RFLP in Nellore, Canchim and Nellore crosses with Simmental and Charolais breeds in a 1301 bp region covering the exons 5 and 6. The A allele (617, 424 and 270 bp fragments) showed a significantly higher frequency than the B allele (617, 379 and 260 bp fragments) in all groups. There was a lack of association of polymorphism of POU1F1/HinfI with growth and carcass traits. Kai et al. (2006) applied PCR-RFLP to analyze the effect of the POU1F1 gene polymorphism on growth traits of 100 Nanyang cattle. The results showed that the 451 bp PCR product digested with HinfI demonstrated polymorphism in the population, which was at Hardy-Weinberg equilibrium and the frequencies of alleles A/B in the Nanyang population were 0.465/ Animals with the BB genotype had higher mean values for birth weight, average weight increase before lactation, body height at 12 months, body weight, body length, and chest girth at 6 months and 12 months (P<0.05) than those with the genotype AB. But the BB individuals had a higher body weight at 12 months than the AA individuals (P<0.05). The body weight and body sizes also showed a similar trend with allele B > allele A in the other age groups. They therefore, had suggested that the genotype BB may be a dominant genotype and the allele B may be a dominant allele. Carrijo et al. (2008) examined a Kb region of the Pit1 gene for HinfI PCR-RFLP restriction polymorphism on growth traits of Canchim cattle, from two lineages, GG1 and GG2. Pit1 PCR-RFLP genotypes were evaluated for various economic traits like birth weight, standardized weaning weight (W240), weight at 12 months of age (W365), and the average daily weight gain from birth to weaning (AGBW), and from weaning to 12 months of age (AGW12). They found Pit1 genotype to be associated with W240, AGBW and AGW12 (P < 0.05). The genotypes HinfI ( / ), HinfI (+/+) and HinfI (+/ ) had differences in W240 and AGBW in GG2 (P < 0.05), revealing superiority of ( / ) genotype for those traits. They also found that HinfI(-) had a dominant effect for W240 and AGBW and the allele had a favourable effect on W240 and AGBW in GG2, in homozygous condition. They attributed the difference between Pit1 gene behavior in the two genetic groups may be
62 due to the action of a quantitative trait locus linked to Pit1, segregating only in GG2 population. Edriss et al. (2008) amplified a 451bp region of the intron 5 and exon 6 of the Pit 1 gene for analyzing the HinfI PCR-RFLP polymorphism in Holstein cows under different management conditions. They observed that the frequency of A allele (451 bp) and B allele (244 and 207 bp) were and over all the herds and the population was not in Hardy - Weinberg equilibrium for average genotypic frequencies. Huang et al. (2008) investigated whether the POU1F1 gene was associated with economically important traits in Holstein dairy cattle. They used a pooled DNA sequencing approach to identify single nucleotide polymorphisms (SNPs) in all the 6 exons of the gene. They identified a 545G>A SNP in exon 2 and three SNPs were identified in exon 3: 577C>A (p.pro76his), 606T>C and 647A>G. PCR-RFLP was performed to identify the different genotypes. They performed a forced PCR-RFLP to identify the POU1F1 polymorphism that changes a proline to a histidine. The rarer 577 AA genotype was associated with a significant increase in productive life and milk yield. Mukesh et al. (2008) studied the distribution pattern of known variants at Pit- 1/Hinf I locus in 16 distinct Indian native cattle (Bos indicus) breeds. PCR-RFLP analysis of 1350 bp fragment revealed the predominance of BB genotype and B allele with a mean frequency of and 0.937, respectively, irrespective of utility type (dairy, dual, draft), geographical region (northern, central and southern) and coat colour (red/brown and grey/white). AB genotype was the next most frequent with a mean frequency of Interestingly, only a single individual out of 723 screened was observed to have AA genotype. The significantly low frequency of A allele observed in their study differed from Bos taurus breeds. Significant differences (P<0.05) were observed between utility type categories (dual vs draft and dairy vs draft). Oztabak et al. (2008) investigated the polymorphism of the pituitary-specific transcription factor-1 (Pit1) in South Anatolian Red (SAR) and East Anatolian Red (EAR) cattle that were earlier reported to be associated with milk production traits in
63 cattle. Exon 6 of Pit1 was analysed by HinfI PCR-RFLP to identify the single nucleotide polymorphisms (SNPs). They concluded that Pit1 allele A which was associated with milk production traits was found in low frequency in SAR and EAR. In 1995, Moody et al. identified a HinfI PCR-RFLP polymorphism in a 1301 bp region of exon 5 and 6 in cattle; the mutation that caused the polymorphism was later located to position 1256 of exon 6 (Dierkes et al., 1998). Swine Yu et al., (1995) utilized crosses of Meishan x Duroc, Meishan x Hampshire, Meishan x Landrace, Minzhu x Hampshire, and Minzhu x Landrace for evaluating the three Pitl polymorphisms based on two RFLP using a Pitl POU-domain cdna probe and the restriction enzymes BamHI and MspI and a PCR-RFLP using RsaI. The three Pitl polymorphisms were associated with production traits like 21-d, and 42-d weights, average daily gain, backfat measurements, longissimus muscle area, muscle color, marbling and firmness scores. They concluded that pigs with the MspI CC genotype (P<.01) were associated with heavier birth weight than DD genotype. Also, the MspI CC genotype pigs were also significantly associated with greater average backfat, greater first-rib backfat, greater last-rib backfat and greater last lumbar backfat than the DD genotype pigs. Stancekova et al. (1999) analysed porcine POU1F1 genetic variability of Large White and Large White Landrace pigs, by using PCR-RFLP and determined its possible associations with two carcass traits (backfat and percentage of lean content). They performed two different POU1F1 PCR-RFLP (POU1F1/RsaI and POU1F1/MspI) tests with genomic DNA isolated from porcine blood (120 pigs) and hair roots (10 pigs). They concluded that the MspI DD genotype was the fattest compared with both other genotypes (CC, CD) in analyzed swine population. For POU1F1/RsaI polymorphism no significant differences were identified for lean to fat ratio. Pierzchała et al. (2003) investigated the POU1F1 polymorphism and its relation with performance traits. RsaI Restriction digestion of the amplified exons 4, 5 and 6 revealed polymorphism. They found the POU1F1 genotypes to have a
64 significant effect on average daily gain (g), meat content of carcass (%) and meat content of ham (%) in FF genotype and fat traits were associated with genotypes EE. Song et al. (2005) studied the MspI polymorphism in the 3 rd intron of the porcine gene encoding the pituitary 1 transcription factor among 5 breeds of pigs. They observed that differences in BW 180 and ADG between DD pigs and both CD and CC pigs were significant (P<0.05) and the DD pigs had significantly higher body weight on day 45 (BW45) and on day 70 (BW70) than CC pigs (P<0.05); and D allele had a favourable positive effect on growth traits. 2.4 NUCLEOTIDE SEQUENCE HOMOLOGY AND PHYLOGENY Comparative sequence analyses performed under principles of molecular evolutionary genetics is essential to infer the evolutionary patterns of the genome, species evolution and elucidate mechanisms of evolution of various morphological and physiological characters (Kumar et al., 2004). ClustalW is the most commonly used multiple alignment procedure to find homology between species based on both DNA and protein data (Thompson et al., 1994). The phylogenetic analysis is carried out based on DNA and protein data using either PHYLIP, MEGA or DNAStar software.
65 Materials and Methods
66 3. MATERIALS AND METHODS 3.1 MATERIALS Experimental animals The Nilagiri sheep (Plate 3.1 and 3.2) maintained at Sheep Breeding Research Station, Sandynallah (11 25 N latitude and E longitude) , The Nilgiris and the Mecheri sheep (Plate 3.3 and 3.4) maintained at Mecheri Sheep Research Station, Pottaneri (11 45 N latitude and E longitude) , Salem district were utilized for the present study. The Nilgiris is at an altitude of 2090 to 2235 metres above mean sea level with the annual precipitation ranging from 848 to 3000 mm. The climate is generally cool with the temperature ranging from sub zero levels in the winter to 24 C in the summer. Pottaneri in Salem district is located at an altitude of 650 feet above mean sea level, which remains hot and dry through most part of the year but for the monsoon season Management of animals Nilagiri sheep The ewes were allowed to breed at 18 months of age. The ewes were either hand mated or inseminated with freshly collected semen with a ram:ewe ratio of 1:20. Two breeding seasons of 55 to 60 days were followed in a year. The main breeding season in Nilagiri is from September to November (northeast monsoon) and the lean lambing season extended from March to May (summer). Correspondingly the main lambing season occur in summer (March to May) while the lean lambing season occurs during the northeast monsoon (September to November). In the Nilgiris, the fodder availability follows a cyclic pattern. Early summer rains during the month of May ensure the availability of rich pasture, which continues till November when the northeast monsoon starts receding. Frost in winter (December and January) affects the pasture inadvertently leading to a lean season of grazing between December and April. Supplementary concentrate feed is provided during this period.
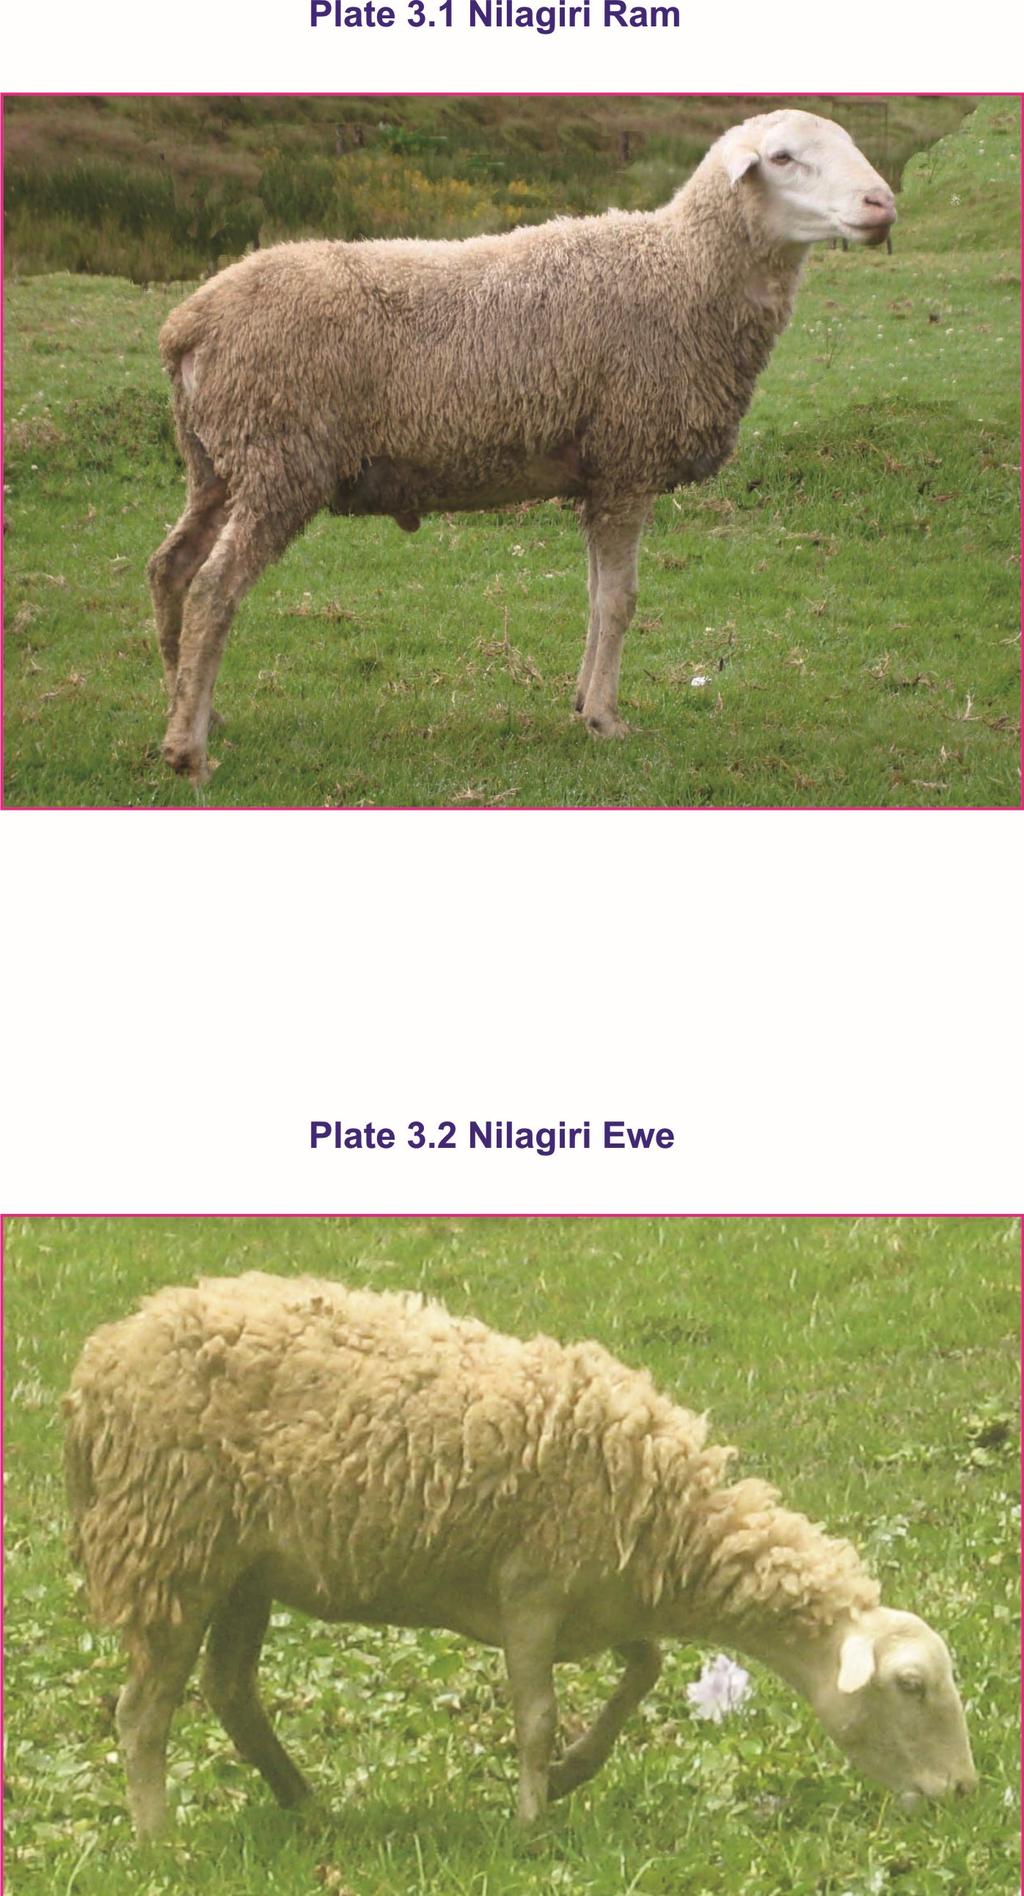
67
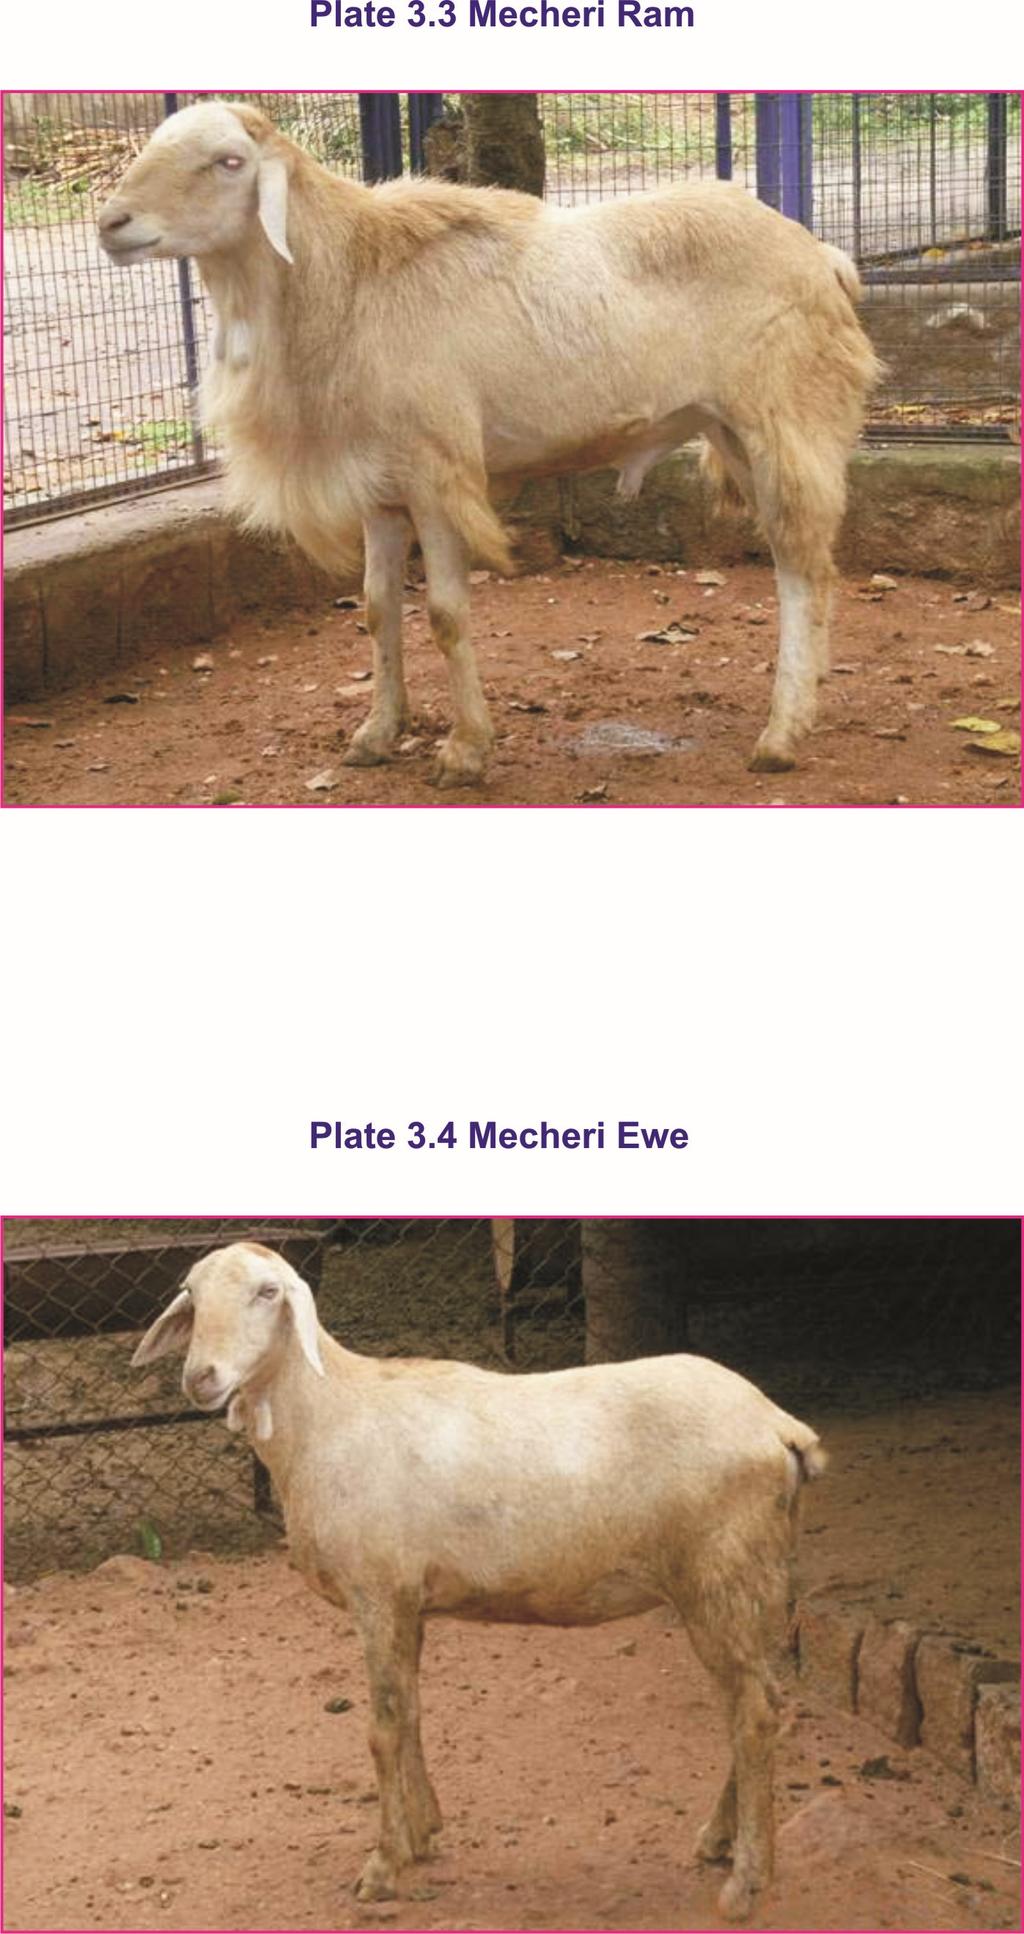
68
69 Mecheri sheep Two breeding seasons were followed, viz., March to April (lean season) and September to October (main season). Each breeding season extended over a period of 45 to 50 days. Correspondingly two lambing seasons were observed, viz., February to March being the main lambing season and August to September, the lean lambing season. The ewes in estrus were detected by allowing apronized rams into the flock, with a ram:ewe ratio of 1:20. Controlled mating/hand mating was followed to ensure pedigree data collection. In both the Nilagiri and Mecheri sheep, all lambs were weighed and ear tagged at birth for identification Blood collection Blood samples (6 ml) from Nilagiri (n = 145 ; 123 female and 22 male) and Mecheri (n = 62 ; 39 female and 23 male) breeds of sheep were collected in sterile vacutainers containing EDTA as an anticoagulant in duplicate from jugular vein and brought to the Department of Animal Genetics and Breeding, Madras Veterinary College, Chennai in ice flasks with coolant packs. The blood samples were kept at -20 C till initiation of DNA isolation by Phenol - Chloroform method Preparation of glassware All the glassware were washed in running tap water using commercial detergents and rinsed with triple glass distilled water. The mouth of the bottles were covered with aluminium foil and sterilized in hot air oven at 180ºC for an hour Preparation of solutions / reagents The solutions were prepared using triple glass distilled water. The chemicals were weighed in a clean aluminium foil sheet. Magnetic stirrer was used to ensure complete dissolution of chemicals. The buffers (RBC lysis buffer, TAE buffer, TE
70 buffer and gel loading buffer) were stored at 4ºC. Proteinase K and restriction enzymes were stored at -20ºC in the deep freezer Solutions / reagents for DNA isolation i) RBC lysis buffer Ammonium chloride (155 mm) g Potassium carbonate (10 nm) - 1 g Disodium EDTA (0.1 mm) g Triple glass distilled water to make up ml Adjusted to ph 7.4 and stored at 4 C. ii) Sodium dodecyl sulphate (SDS) - 20% SDS - 20 g Triple glass distilled water to make up ml Dissolved with magnetic stirrer and stored at room temperature. iii) Phenol Tris saturated phenol ph 8 (as supplied by the manufacturer) Stored in amber coloured bottle at 4ºC and kept away from direct light. iv) Phenol : Chloroform : Isoamyl alcohol mixture (25 : 24 : 1) Tris saturated phenol (ph 8) - 25 parts Chloroform - 24 parts Isoamyl alcohol - 1 part The mixture was prepared afresh, whenever required. v) Chloroform: Isoamyl alcohol mixture (24 : 1) Chloroform - 24 parts Isoamyl alcohol - 1 part Chloroform : Isoamyl alcohol mixture was prepared afresh as per the requirement.
71 vi) Sodium acetate (3M) Sodium acetate g Triple glass distilled water to make up ml Adjusted to ph 5.2 and stored at room temperature. vii) Proteinase K (10 mg/ml) Proteinase K mg TE buffer (1X) - 10 ml The enzyme was weighed and suspended in triple glass distilled water, aliquoted and stored at -20 C. Thawed at room temperature before use and replaced immediately in deep freezer. viii) Tris - EDTA Buffer (TE) Tris (hydroxymethyl) aminomethane g (10 mm, ph 7.6) EDTA (0.1 mm) g Triple glass distilled water to make up ml Adjusted to ph 8.0 and stored under refrigeration (4 C) Solution / reagents for checking of DNA samples i) Tris acetate EDTA (TAE) buffer (50X) Tris (hydroxymethyl) aminomethane (10 mm) g (ph 7.6) Glacial acetic acid ml EDTA (0.5M) - 20 ml (ph 8.0) Triple glass distilled water to make up ml The 50X buffer was kept as stock at 4 C and was diluted to make tank buffer (1X TAE) for submarine electrophoresis unit (Hoefer-Pharmacia Biotech, USA) and for preparation of agarose gels.
72 ii) Agarose (1%) Agarose g AE (50X) - 1 ml Triple glass distilled water to make up - 50 ml iii) Agarose (2%) Agarose - 1 g TAE (50X) - 1 ml Triple glass distilled water to make up - 50 ml iv) Agarose (3%) Agarose g TAE (50X) - 1 ml Triple glass distilled water to make up - 50 ml v) Ethidium bromide staining solution (1%) Ethidium bromide - 10 mg Triple glass distilled water to make up - 1 ml 3.2 METHODS Isolation of DNA The leucocytes contain DNA in abundance, while the erythrocytes and platelets contain meager amount of DNA. Hence, the DNA isolation procedure is designed to remove the erythrocytes from whole blood followed by the lysis of leucocytes and subsequent liberation of DNA into aqueous phase. DNA was recovered by addition of alcohol in the presence of monovalent cations. Genomic DNA was isolated from blood samples by Phenol-Chloroform method as described by Sambrook and Russel (2001). Procedure
73 The blood samples kept at -20 C were thawed at room temperature. The following steps were then followed. 1. Whole blood (6 ml) was transferred from vacutainer to sterile 15 ml autoclaved polypropylene tubes. 2. Equal volume of RBC lysis buffer was added, mixed well and the tubes were kept in crushed ice for 20 minutes to accelerate cell lysis. 3. The mix was then centrifuged at 2500 rpm for 15 minutes. After centrifugation, the supernatant was discarded and step 2 was continued till RBCs were completely lysed which was indicated by the formation of white coloured pellet and colourless supernatant after centrifugation. 4. Supernatant was discarded and then 3 ml of lysis buffer, 1 ml of 20% SDS, 250 µl Proteinase-K (20 mg/ml) were added to the WBC pellet and the mix was incubated in a shaking waterbath at 37 C for 12 hours. 5. Equal volume of Tris-phenol (ph 8.0) was added on completion of incubation. The contents of the tubes were gently tapped and then vortexed to obtain a solution with buttermilk consistency and the lysate was centrifuged at 8000 rpm for 10 minutes. 6. Supernatant was taken into new tubes and equal volume of Phenol: Chloroform:Isoamyl alcohol mixture in the ratio 25:24:1 was added, vortexed and kept at room temperature for 10 minutes. The tubes were centrifuged at 8000 rpm for 10 minutes. 7. Equal volume of Chloroform:Isoamyl alcohol (24:1) was added to the supernatant taken into new tube and mixed well. The tubes were centrifuged at 8000 rpm for 10 minutes. 8. Supernatant was transferred into a new tube and added 250 µl of 3M Sodium acetate and 8 to 10 ml of Isopropanol. The tubes were mixed gently by inversion and the DNA was allowed to precipitate as thread like material, which was removed with the help of a cut tip and transferred to 1.5 ml microcentrifuge tube.
74 9. One ml of 70% ethanol was added to remove the salts. Spun at rpm for 10 minutes and the supernatant was discarded and the tube allowed to dry µl of TE buffer was added to the tube and kept with lid open on a water bath at 65 C for 2 hours to inactivate DNAase and other enzymes. 11. The microcentrifuge tube was kept in ice for a while and then kept at 4 C in a refrigerator for 48 hours for the DNA to dissolve completely and then transferred to -80ºC freezer for longer storage as stock DNA Quality of DNA isolated The quality of the isolated genomic DNA was assessed by horizontal submarine agarose gel electrophoresis using 1.0% w/v agarose (low EEO). Agarose gel electrophoresis 1. Agarose (0.5 g) was weighed and mixed with 50 ml of 1X TAE buffer, melted in a microwave oven and allowed to cool to lukewarm temperature. 2. One μl of Ethidium bromide (10 mg/ml stock made to a working solution of 0.5 μg/ml concentration) was added and mixed thoroughly. 3. Cellophane tape was stuck on open sides of tray to form the mould. 4. The melted agarose was poured into a gel casting tray fitted with acrylic comb and allowed to solidify. 5. DNA samples were mixed with 6X loading dye and loaded into the wells. 6. Electrophoresis was run at 5-6 volts/cm, till the loading dye (Bromophenol blue) reached the other end of the gel. 7. The DNA was visualized with a gel documentation system. Only DNA samples showing intact band were used further Determination of purity and concentration of DNA
75 The purity and concentration of the genomic DNA were checked by UV spectrophotometry. An aliquot of 10 µl of stock DNA was dissolved in 90 µl of triple glass distilled water and optical densities (OD) were measured at 260 nm and 280 nm in 3 ml silica cuvette with TE buffer as blank. DNA samples having OD 260 nm:od 280 nm ratio between 1.7 and 2.0 were diluted in sterile triple distilled water for further research. Other DNA samples were purified by repeating steps 5 to 10 of the Phenol - Chloroform method. The concentration of DNA was estimated using the following formula: OD 260 x 50 x 10 (dilution factor) Concentration of DNA (µg/µl) = One OD value at 260nm is equivalent to 50 µg double stranded DNA/ml Template DNA for PCR The working DNA was prepared by diluting the stock DNA in ultra filtered water to obtain a template nucleic acid concentration of 20 to 50 ng per µl and stored at -20 C PCR-RFLP study on BMPR1B, IGFBP-3 and POU1F1 genes One region (190 bp) of the BMPR1B, two regions (316 and 654 bp) of IGFBP-3 and two regions (508 and 450 bp) of the POU1F1 genes were amplified. The primer sequences used to amplify the genes are provided in Table 3.1. The primer sequences for amplification of POU1F1 gene were designed based on the available sequence of sheep - AJ (Bastos et al., 2006b) in Genbank. The restriction enzymes for IGFBP-3 (EF and AF306012) and POU1F1 (AJ549207) genes were chosen by analyzing the DNA sequences using the Gene Tool Lite 1.0 software. Table 3.1 Primer sequences used to amplify BMPR1B, IGFBP-3 and POU1F1 genes Gene Primer sequence Fragment size (bp) Reference
76 BMPR1B B 1 : 5 - CCA GAG GAC AAT AGC AAA GCA AA 3 B 2 : 5 - CAA GAT GTT TTC ATG CCT CAT CAA CAC GGT C Davis et al. (2002) IGFBP-3 POU1F1 P 1 : 5 - GAA ATG GCA GTG AGT CGG 3 P 2 : 5 -TGG GCT CTT GAG TAA TGG TG P 3 : 5 - CCA AGC GTG AGA CAG AAT AC-3 P 4 : 5 - AGG AGG GAT AGG AGC AAG AT P 5 : 5 - ATA CCA GGC AAT TCT ACA CTG 3 P 6 : 5 - GGC CTT GCT TTT CTT TAT AG P 7 : 5 - TGA TCA TCT CCC TTC TT- 3 P 8 : 5 - AAT GTA CAA TGT GCC TTC TGA G Lan et al. (2007c) Maciulla et al. (1997) Bastos et al. (2006b) Bastos et al. (2006b) PCR-RFLP study on BMPR1B gene for detection of FecB mutation A 190 bp fragment of exon 6 of the BMPR1B gene was amplified by Forced PCR-RFLP method using the primers B 1 and B 2. The reverse primer was designed as per Davis et al. (2002) to introduce a point mutation in the amplified products that creates an AvaII restriction site (G GACC) in the DNA with FecB mutation. Then the AvaII enzyme would cleave the DNA with FecB mutation that would produce two fragments of 160 bp and 30 bp while the wild type remains uncleaved. PCR reaction mixture : The PCR reaction was set to a volume of 20 µl. The composition of the reaction mixture was as in Table 3.2. Table 3.2 Composition of PCR reaction mixture used to amplify 190 bp fragment of BMPR1B gene Sl. No. Component Volume (µl) 1 10X PCR assay buffer 2 2 dntp s mix (10 mm) 1 3 Taq DNA polymerase (1 unit/µl) with Red dye 1 4 Forward primer (10 pm/µl) 1 Reverse primer (10 pm/µl) 1 5 Genomic DNA (50 ng/µl) 2
77 6 Ultra filtered water 12 Total 20 Note : 1X Assay buffer contains 10 mm Tris - HCl, 1.5mM MgCl 2, 50 mm KCl and 0.01% gelatin. PCR programme : Amplification was carried out using a pre programmed thermal cycler (Eppendorf AG, Germany) with the following conditions as in Table 3.3.
78 Table 3.3 PCR programme for amplification of 190 bp fragment of BMPR1B gene Step Process Temperature Duration 1 Initial denaturation 95ºC 90 seconds 2 Denaturation 95ºC 10 seconds 3 Annealing 62ºC 30 seconds 4 Extension 72ºC 30 seconds 5 Go to step 2 34 times - 6 Final extension 72ºC 5 minutes 7 Refrigeration 4ºC forever Checking of amplified product : The amplified products were verified in a horizontal submarine gel electrophoresis with 2% w/v agarose (low EEO) gel. 5 µl of the PCR product was run along with a 50 bp DNA ladder (Gene Ruler, Fermentas). The electrophoresis was performed at 5-6 volts/cm for 2 hours. The amplified products were checked in a UV trans-illuminator (Bio-Rad, USA) and documented by a gel documentation system (Pharmacia Biotech, USA). Digestion of PCR product with AvaII : The PCR products were digested with Fastdigest AvaII (Eco471) at 37ºC for 10 minutes in a PCR thermal cycler with the restriction digestion mix as in Table 3.4. The restriction enzyme was inactivated by increasing the incubation temperature to 65ºC. The digested products were checked in 3% agarose gel along with 50 bp DNA ladder in a gel documentation system. Table 3.4 AvaII restriction digestion mix Sl. No. Component Volume (µl) 1 PCR product X Assay buffer 2 3 Fastdigest AvaII (Eco471) (1 FDU/µl) 1 4 Triple distilled water 7
79 PCR-RFLP study on IGFBP-3 gene Total HaeIII-RFLP Complete exon 2 and partial intron 2 of the IGFBP-3 gene (316 bp) was amplified using the primers, P 1 and P 2. PCR reaction mixture : The total volume of PCR reaction was set to 20 µl as provided in Table 3.2. PCR programme : The amplification was performed in a pre programmed thermal cycler (Eppendorf AG, Germany) with the following conditions (Table 3.5): Table 3.5 PCR programme for amplification of 316 bp fragment of IGFBP-3 gene Step Process Temperature Duration 1 Initial denaturation 94ºC 4 minutes 2 Denaturation 94ºC 45 seconds 3 Annealing 62ºC 45 seconds 4 Extension 72ºC 1 minute 5 Go to step 2 34 times - 6 Final extension 72ºC 10 minutes 7 Refrigeration 4ºC forever Checking of amplified product : The amplified PCR products were checked in a horizontal submarine gel electrophoresis with a 2% w/v agarose (low EEO) gel. Digestion of PCR product with HaeIII : The components of the HaeIII restriction digestion were as in Table 3.6.
80 Table 3.6 HaeIII restriction digestion mix Sl. No. Component Volume (µl) 1 PCR product X assay buffer 3 3 HaeIII (10units/µl) 1 4 Triple distilled water 11 Total 30 The amplified products were digested with HaeIII with restriction site (GG CC) at 37ºC in a thermal cycler (PTC 200, MJ Research) for overnight and the enzyme was inactivated by heat inactivation at 80ºC for 15 minutes. The restriction pattern was studied by loading 8 µl of the digested PCR product along with a 50 bp DNA ladder (Gene Ruler, Fermentas) in 3% agarose gel HinfI-RFLP A 654 bp fragment spanning a part of exon 2, intron 2, exon 3 and part of intron 3 of the IGFBP-3 gene was amplified using the primers, P 3 and P 4 furnished in Table 3.1. PCR reaction mixture : The PCR reaction was set in a volume of 20 µl as in Table 3.2. PCR programme : A pre programmed thermal cycler (Eppendorf AG, Germany) was used to perform the amplification with the following conditions (Table 3.7).
81 Table 3.7 PCR programme for amplification of 654 bp fragment of IGFBP-3 gene Step Process Temperature Duration 1 Initial denaturation 94ºC 5 minutes 2 Denaturation 94ºC 1 minute 3 Annealing 60ºC 1 minute 4 Extension 72ºC 1 minute 5 Go to step 2 34 times - 6 Final extension 72ºC 5 minutes 7 Refrigeration 4ºC forever Checking of amplified product : Horizontal submarine gel electrophoresis was used to check the amplified products with 2% w/v agarose (low EEO) gel. Digestion of PCR product with HinfI : Table 3.8 provides components of the restriction digestion mix. Table 3.8 HinfI restriction digestion mix Sl. No. Component Volume (µl) 1 PCR product 15 2 Hinf I assay buffer (10X) 3 3 Hinf I (10 units/µl) 1 4 Triple distilled water 11 Total 30
82 The PCR products were digested with HinfI (with restriction site G ANTC) at 37ºC by incubating in a thermal cycler (PTC 200, MJ Research) for overnight. The restriction enzyme was inactivated by heat inactivation at 80ºC. 10 µl of the digested PCR product was run along with a 50 bp DNA ladder (Gene Ruler, Fermentas) in 3% agarose gel to study the restriction pattern PCR-RFLP study on POU1F1 gene EcoRI-RFLP The primers, P 5 and P 6 (Table 3.1) were used to amplify a 508 bp region covering the exon 4 of the POU1F1 gene. PCR reaction mixture : The final volume of PCR reaction mix was set to 20 µl. The Table 3.2 provides the composition of the reaction mixture. PCR programme : The 508 bp fragment of the POU1F1 gene was amplified in a pre-programmed thermal cycler (Eppendorf AG, Germany) with the following conditions (Table 3.9). Table 3.9 PCR programme for amplification of 508 bp fragment of POU1F1 gene Step Process Temperature Duration 1 Initial denaturation 95ºC 4 minutes 2 Denaturation 94ºC 45 seconds 3 Annealing 57.5ºC 45 seconds 4 Extension 72ºC 1 minute 5 Go to step 2 34 times - 6 Final extension 72ºC 10 minutes 7 Refrigeration 4ºC forever
83 Checking of amplified product : A 2% w/v agarose (low EEO) gel horizontal submarine gel electrophoresis was used to check the amplified products along with DNA ladder (50 bp). Digestion of PCR product with EcoRI : The PCR-RFLP pattern of the 508 bp PCR product was studied by digesting with EcoRI restriction enzyme and the reaction mix was as follows (Table 3.10). Table 3.10 EcoRI restriction digestion mix Sl. No. Component Volume (µl) 1 PCR product X Assay buffer 2 3 EcoRI (10 units/µl) 1 4 Triple distilled water 7 Total 20 The PCR products were digested by the restriction enzyme EcoRI (with restriction site - G AATTC) at 37ºC by overnight incubation in a thermal cycler (PTC 200, MJ Research). The enzyme (EcoRI) was inactivated by heat inactivation at 80ºC for 10 minutes. The restriction pattern was studied by loading 8 µl of the digested PCR product along with a 50 bp DNA ladder (Gene Ruler, Fermentas) in 2.0% agarose gel AluI-RFLP A 450 bp region of the intron 5 and exon 6 of the POU1F1 gene was amplified with the primers, P 7 and P 8 (Table 3.1). PCR reaction mixture : The PCR reaction mix was set to 20 µl volume. The Table 3.2 provides the composition of the reaction mixture.
84 PCR programme : The amplification of the intron 5 and exon 6 region was carried out in a pre-programmed thermal cycler (Eppendorf AG, Germany) with the following conditions (Table 3.11) :
85 Table 3.11 PCR programme for amplification of 450 bp fragment of POU1F1 gene Step Process Temperature Duration 1 Initial denaturation 95ºC 4 minutes 2 Denaturation 94ºC 45 seconds 3 Annealing 55ºC 45 seconds 4 Extension 72ºC 1 minute 5 Go to step 2 34 times - 6 Final extension 72ºC 10 minutes 7 Refrigeration 4ºC forever Checking of amplified product : The amplified products were electrophoresed in 2% w/v agarose (low EEO) gel together with DNA ladder (50 bp). Digestion of PCR product with AluI : The components of the AluI retriction digestion were as in Table Table 3.12 AluI restriction digestion mix Sl. No. Component Volume (µl) 1 PCR product X Assay buffer 2 3 AluI (10 units/µl) 1 4 Triple distilled water 7 Total 20 The PCR products were digested by the restriction enzyme AluI (with restriction site - AG CT) at 37ºC by overnight incubation in a thermal cycler (PTC
86 200, MJ Research). The enzyme (AluI) was inactivated by heat inactivation at 80ºC for 20 minutes. 8 µl of the digested PCR product was run along with a 50 bp DNA ladder (Gene Ruler, Fermentas) in 3% agarose gel to analyse the restriction digestion pattern Statistical analyses Estimation of gene and genotype frequencies The genotypes were assigned on the basis of restriction digestion pattern of the PCR products. The allele and genotype frequencies were calculated by standard formula (Falconer and Mackay, 1996). where, Number of individuals of a particular genotype Genotype frequency = Total number of animals of all genotypes 2D + H Gene frequency = N D = number of animals homozygous for a particular allele H = number of heterozygote animals N = total number of animals Association analysis of RFLP genotypes with traits of economic importance PCR-RFLP polymorphism was detected only in BMPR1B gene of Nilagiri sheep revealing FecB mutation. Hence, the association analysis to find out the effect of FecB mutation on the traits of economic importance in Nilagiri sheep was carried out using least-squares analysis of variance (Harvey, 1990). To find out association with litter size, cumulative litter size and cumulative litter weight, the data of genotyped ewes having a minimum of two lambing records were utilized. For analysis of association with body weight at different ages, data of genotyped animals of both sexes that had body weight records for atleast a year were utilised.
87 Definition of traits i. Litter size at birth - number of lambs born alive per ewe lambing ii. Litter size at weaning - number of lambs weaned per ewe lambing iii. Cumulative litter size at birth (CLSB) (Mishra et al., 2008) Total number of lambs born alive during three parities CLSB = Total number of ewes lambed iv. Cumulative litter size at weaning (CLSW) (Mishra et al., 2008) Total number of lambs weaned in 3 months in three parities CLSW = Total number of ewes lambed v. Cumulative litter weight at birth - Total birth weight of lambs born alive in first three lambing vi. vii. Cumulative litter weight at weaning - Total weight of lambs weaned in first three lambing Body weight at birth, 3, 6, 9 and 12 months of age The models used for association analysis of FecB mutation were as follows: For association with litter size at birth and litter size at weaning Y ijklm = µ + A i + B j + C k + D l + (AD) il + b(wm ijkl - WM) + e ijklm where, Y ijklm = observation on m th ewe in l th parity in k th season of lambing of j th year with i th genotype µ = overall mean of the population for the trait A i = fixed effect of i th genotype of ewe (FecB ++ and FecB B+ ) B j = fixed effect of j th year of lambing (2002 to 2009)
88 C k = fixed effect of k th season of lambing (summer and N.E. monsoon) D l = fixed effect of l th parity of ewe (1 to 6) (AD) il = interaction effect of l th parity with i th genotype b(wm ijkl - WM) = regression of Y on dam s weight at mating e ijklm = random residual error, NID (0, σ 2 ) For association with cumulative litter size and cumulative litter weight Y ijk = µ + A i + B j + e ijk where, Y ijk = observation on k th ewe born in j th year with i th genotype µ = overall mean of the population for the trait A i = fixed effect of i th genotype of ewe (FecB ++ and FecB B+ ) B j = fixed effect of j th year of birth of ewe (1991 to 2005) e ijk = random residual error, NID (0, σ 2 ) For association with body weight Y ijklmn = µ + A i + B j + C k + D l + E m + b(wm ijkl - WM) + e ijklmn where, Y ijklmn = observation on n th animal of m th sex born in l th season in k th year as j th type of birth with i th genotype µ = overall mean of the population for the trait A i = fixed effect of i th genotype of animal (FecB ++ and FecB B+ ) B j = fixed effect of j th type of birth of animal (Single and Twin)
89 C k = fixed effect of k th year of birth of animal (1999 to 2007) D l = fixed effect of l th season of birth of animal (summer and N.E. monsoon) E m = fixed effect of m th sex (male and female) b(wm ijkl - WM) = regression of Y on dam s weight at mating e ijklmn = random residual error, NID (0, σ 2 ) Nucleotide sequencing Nucleotide sequencing of PCR products of the 190 bp fragment of BMPR1B, 316 bp and 654 bp fragments of IGFBP-3 and 508 bp and 450 bp fragments of POU1F1 genes were carried out. The number of samples sequenced for various fragments of different genes has been furnished below: Sl. No. Gene Fragment size (bp) Number of samples sequenced 1 BMPR1B IGFBP-3 3 POU1F The BMPR1B gene was sequenced to ascertain the presence of FecB mutation. The sequencing was performed at two independent companies, MWG AG (Bangalore) and Ocimum Biosolutions (Hyderabad) to verify and deduce the nucleotide sequences. The obtained nucleotide sequences were subjected to NCBI BLAST (Basic Local Alignment Search Tool) and similar sequences of other domestic animals were retrieved from the NCBI Genbank ( The DNAStar software was used to align the obtained sequences with other available sequences in NCBI Genbank by ClustalW method of MegAlign programme to find out polymorphisms and to carry out phylogenetic study.
90 Results
91 4. RESULTS 4.1 ISOLATION OF GENOMIC DNA The purity of isolated genomic DNA was assessed using 1.0% w/v agarose in a horizontal submarine agarose gel electrophoresis. The purity and concentration of the DNA was also assessed by UV Spectrophotometry. The OD 260 to OD 280 ratio of most of the DNA samples were between 1.7 and 2.0. The yield of DNA ranged from to μg/ml. The stock DNA was diluted in sterile triple distilled water to get a final working DNA of 20 to 50 ng per µl. 4.2 PCR-RFLP STUDY ON BMPR1B, IGFBP-3 AND POU1F1 GENES PCR-RFLP study on BMPR1B gene to detect FecB mutation AvaII-RFLP The PCR product was found as 190 bp in both Nilagiri and Mecheri sheep (Plate 4.1), which was later confirmed by nucleotide sequencing. Digestion of the PCR product with AvaII restriction enzyme revealed three different restriction digestion patterns indicating the presence of FecB mutation in Nilagiri sheep. The restriction pattern that had only the uncut PCR product (190 bp) was assigned as FecB ++ (homozygous wild type) genotype, the pattern that had 190 bp, 160 bp and 30 bp fragments as FecB B+ (heterozygous) genotype and the third with 160 bp and 30 bp fragments as the FecB BB (homozygous mutant) genotype in Nilagiri sheep (Plate 4.2). However, only one allele FecB + was observed revealing absence of FecB mutation in Mecheri sheep (Plate 4.3) Gene and genotype frequencies at FecB locus The frequency of the FecB ++, FecB B+ and FecB BB genotypes in Nilagiri sheep was found to be 0.73, 0.26 and 0.01 respectively. The gene frequency was 0.86 and 0.14 for FecB + and FecB B allele respectively (Table 4.1). The frequency of the FecB + allele in Mecheri sheep is unity as Mecheri sheep had only FecB ++ genotype.
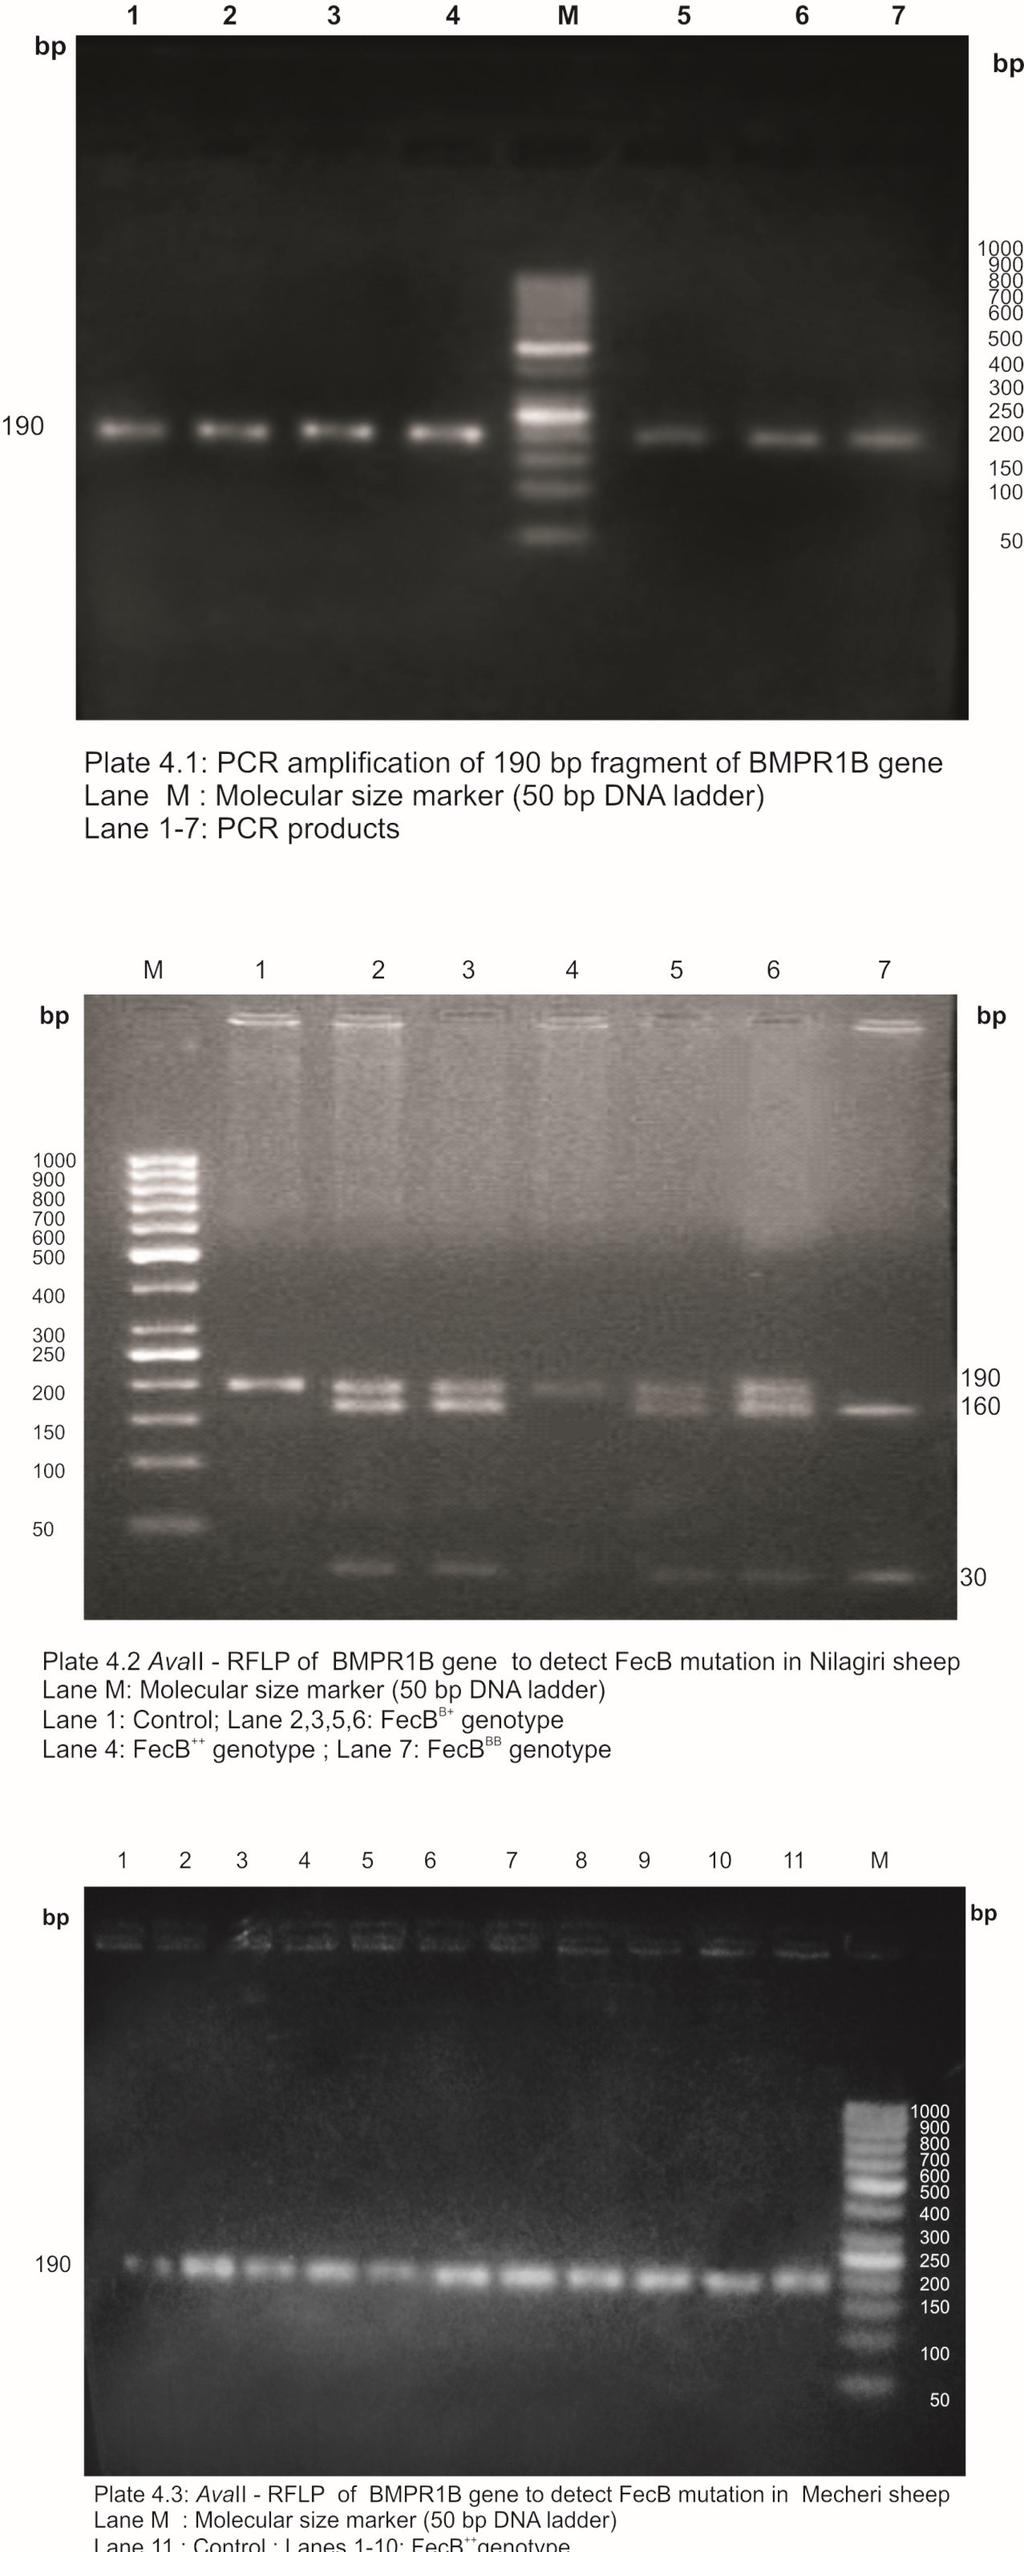
92
93 Table 4.1 Gene and genotype frequencies at FecB locus in Nilagiri sheep Sl. No. Particulars Frequency FecB Genotype FecB B FecB BB Allele FecB FecB B PCR-RFLP study on IGFBP-3 gene HaeIII-RFLP The PCR amplification of the IGFBP-3 gene using primers P 1 and P 2 produced a 316 bp fragment (Plate 4.4). The length of the amplified fragment was later confirmed by nucleotide sequencing. The restriction digestion of the 316 bp fragment with the enzyme HaeIII, yielded three fragments of 263 bp, 45 bp and 8 bp in all the animals of both Nilagiri (Plate 4.5) and Mecheri (Plate 4.6) sheep. However, the 8 bp fragment could not be observed in 3% agarose gel. Only one allele (A) was observed among the animals screened for the HaeIII polymorphism in Nilagiri and Mecheri sheep indicating the monomorphic nature of this locus Hinf I-RFLP The amplification with P 3 and P 4 primers produced a 654 bp fragment consisting of a part of exon 2, intron 2 and exon 3 (Plate 4.7). The size of the

94 amplified region was also confirmed by nucleotide sequencing.
95 Only one pattern which consisted of four fragments of size 315 bp, 133 bp, 109 bp and 97 bp was produced by the digestion of the 654 bp fragment by HinfI restriction enzyme in Nilagiri (Plate 4.8) and Mecheri (Plate 4.9) sheep. This revealed the presence of only one allele indicating the absence of polymorphism at this locus in both the breeds studied PCR-RFLP study on POU1F1 gene EcoRI-RFLP The amplification with P 5 and P 6 primers produced a 508 bp fragment consisting of exon 4 (Plate 4.10). Nucleotide sequencing confirmed the fragment length. The restriction digestion by the endonuclease, EcoRI yielded two fragments of sizes 284 bp and 224 bp (Plate 4.11 and Plate 4.12) in Nilagiri and Mecheri sheep. These results indicated the monomorphic nature of the gene in both the breeds AluI-RFLP The amplification with P 7 and P 8 primers produced a 450 bp fragment consisting of a part of intron 5 and exon 6 of POU1F1 (Plate 4.13). The size of the amplified region was also confirmed by nucleotide sequencing. Digestion of the PCR product with the enzyme AluI produced only one pattern with three fragments of 278 bp, 111 bp and 61 bp in both Nilagiri (Fig 4.14) and Mecheri (Plate 4.15) sheep which revealed the presence of only one allele at this locus. 4.3 ASSOCIATION OF GENOTYPES AT FecB LOCUS WITH TRAITS OF ECONOMIC IMPORTANCE PCR-RFLP polymorphism was observed only in BMPR1B gene in Nilagiri sheep. IGFBP-3 and POU1F1 genes did not reveal any PCR-RFLP polymorphism in both the breeds. Association analysis of FecB genotypes was therefore carried out only in

96 Nilagiri sheep.
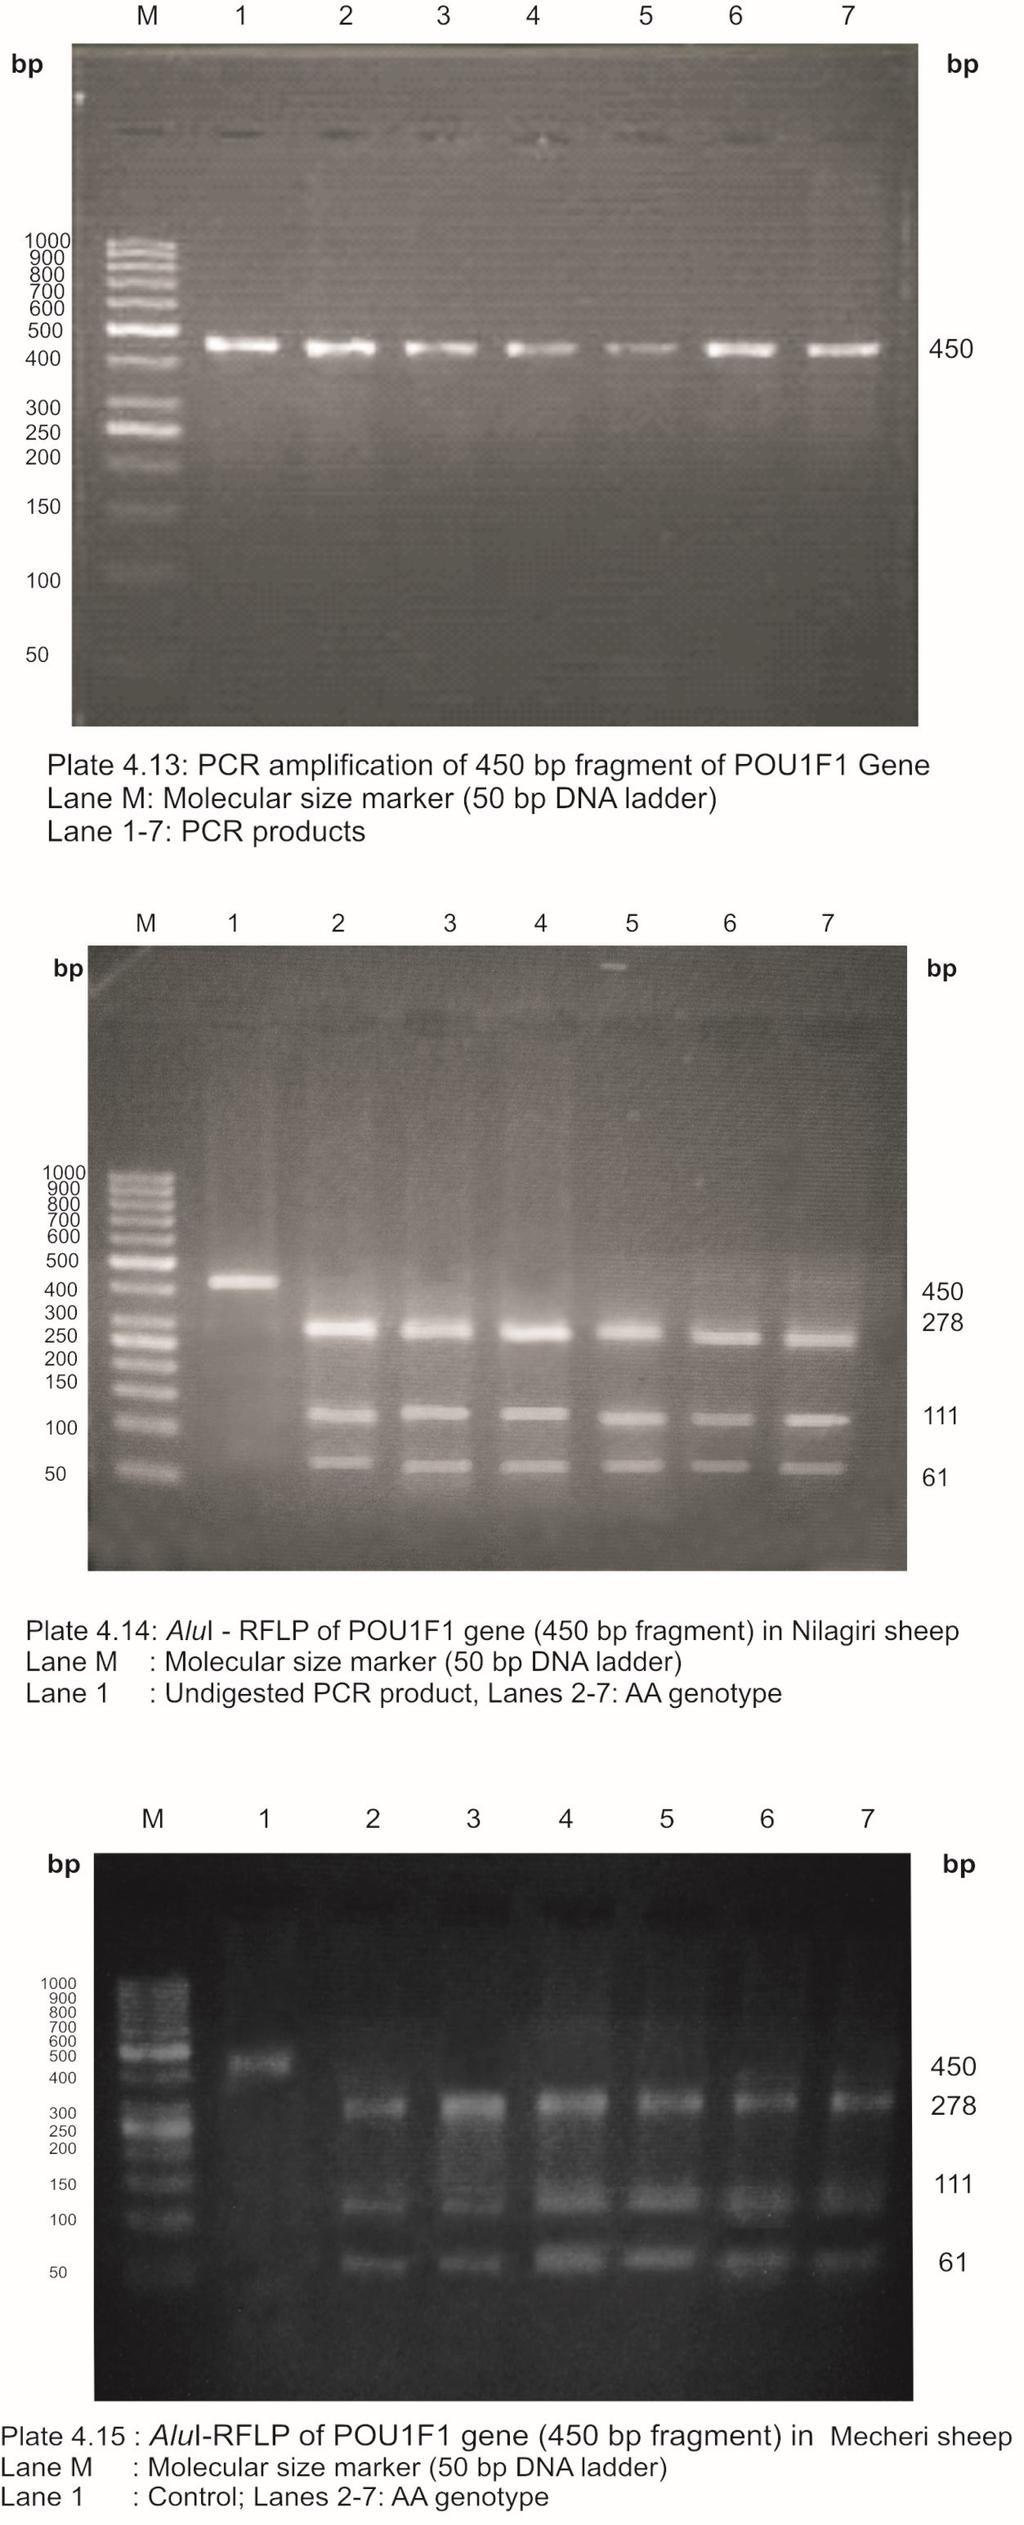
97
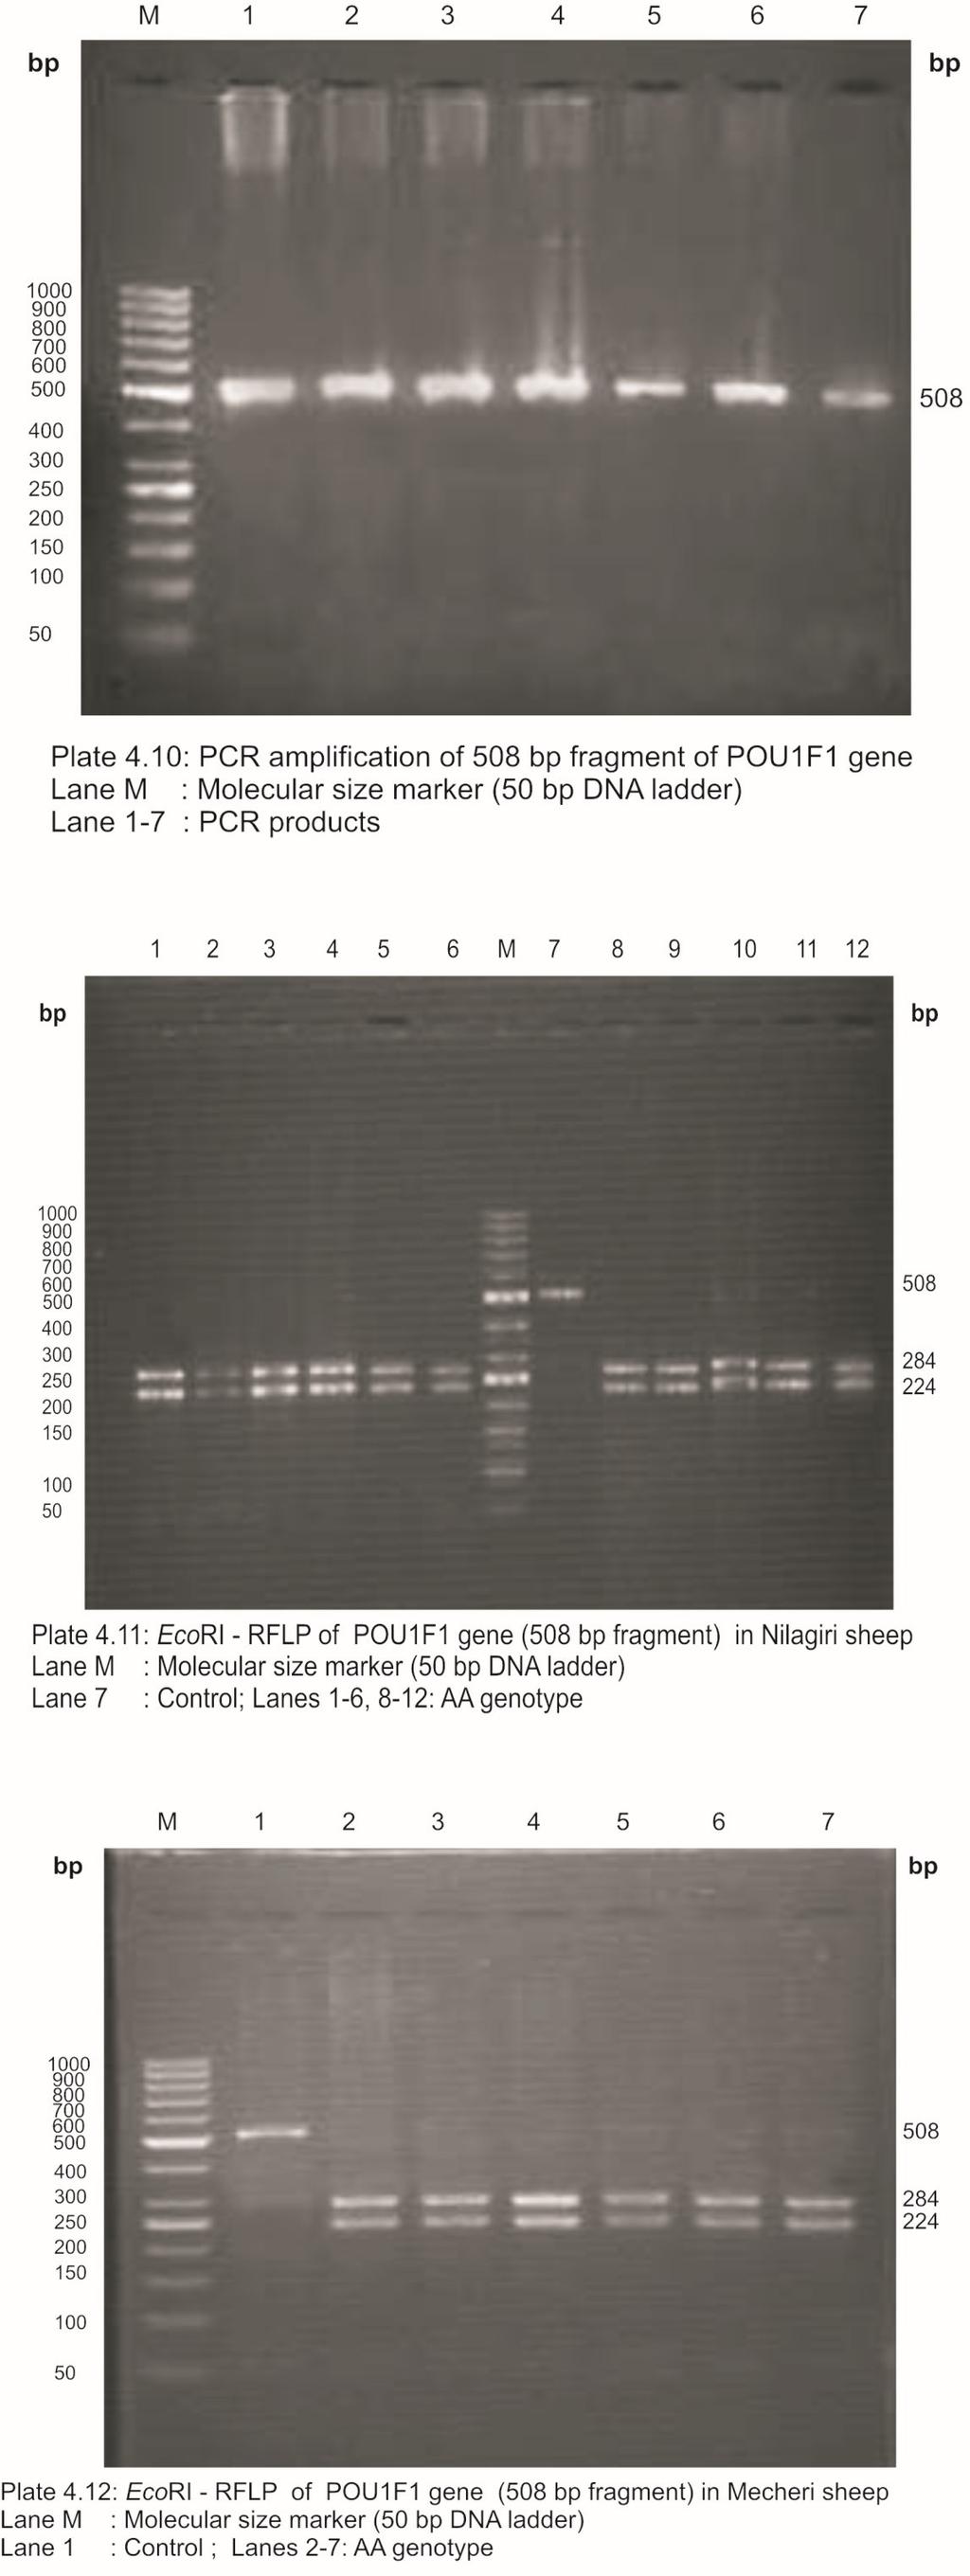
98
INTROGRESSION OF FECUNDITY GENE (FecB) IN NON-PROLIFIC SHEEP BREEDS: A BOON FOR FARMERS
 IN NON-PROLIFIC SHEEP BREEDS: A BOON FOR FARMERS") International Journal of Science, Environment and Technology, Vol. 6, No 1, 2017, 375 380 ISSN 2278-3687 (O) 2277-663X (P) INTROGRESSION OF FECUNDITY GENE (FecB) IN NON-PROLIFIC SHEEP BREEDS: A BOON FOR
International Journal of Science, Environment and Technology, Vol. 6, No 1, 2017, 375 380 ISSN 2278-3687 (O) 2277-663X (P) INTROGRESSION OF FECUNDITY GENE (FecB) IN NON-PROLIFIC SHEEP BREEDS: A BOON FOR
QUANTITATIVE AND QUALITATIVE IMPROVEMENT OF THE SHEEP MUTTON PRODUCTION WITH THE HELP OF MOLECULAR MARKER AND GENOME EDITING TECHNOLOGY : A REVIEW
 Bhartiya Krishi Anushandhan Patrika, 31(4), 285-291, 2016 QUANTITATIVE AND QUALITATIVE IMPROVEMENT OF THE SHEEP MUTTON PRODUCTION WITH THE HELP OF MOLECULAR MARKER AND GENOME EDITING TECHNOLOGY : A REVIEW
An assessment of the benefits of utilising Inverdale-carrying texel-type rams to produce crossbred sheep within a Welsh context
 An assessment of the benefits of utilising Inverdale-carrying texel-type rams to produce crossbred sheep within a Welsh context Introduction Less than 60% of all lambs sold in the UK meet mainstream buyer
1 of 9 7/1/10 2:08 PM
 LIFETIME LAMB AND WOOL PRODUCTION OF TARGHEE OR FINN-DORSET- TARGHEE EWES MANAGED AS A FARM OR RANGE FLOCK N. Y. Iman and A. L. Slyter Department of Animal and Range Sciences SHEEP 95-4 Summary Lifetime
Crossbreeding to Improve Productivity ASI Young Entrepreneur Meeting. David R. Notter Department of Animal and Poultry Sciences Virginia Tech
 Crossbreeding to Improve Productivity ASI Young Entrepreneur Meeting David R. Notter Department of Animal and Poultry Sciences Virginia Tech Denver, CO Jan. 27, 2017 1 The Evolution of Modern Animal Breeding
Genotypes of Cornel Dorset and Dorset Crosses Compared with Romneys for Melatonin Receptor 1a
 Genotypes of Cornell Dorset and Dorset Crosses Compared with Romneys for Melatonin Receptor 1a By Christian Posbergh Cornell Undergraduate Honor Student, Dept. Animal Science Abstract: Sheep are known
Economically important trait. Increased demand: Decreased supply. Sheep milk cheese. 2007: $2.9 million for milk production (Shiflett, 2008)
") Genetic Markers for Milk Production Raluca Mateescu, OklahomaStateUniversity Michael Thonney, Cornell University Milk production & Sheep Industry Economically important trait 2007: $2.9 million for milk
Genetic Markers for Milk Production Raluca Mateescu, OklahomaStateUniversity Michael Thonney, Cornell University Milk production & Sheep Industry Economically important trait 2007: $2.9 million for milk
Lower body weight Lower fertility Lower fleece weight (superfine) (fine)
 (fine)") Generally, finer wool merino sheep are best suited to cooler areas Major Sheep Breeds In Australia Merino (75%) Border Leicester Merino x Border Leicester (12%) Suffolk Cheviot Poll Dorset Romney Merino
Generally, finer wool merino sheep are best suited to cooler areas Major Sheep Breeds In Australia Merino (75%) Border Leicester Merino x Border Leicester (12%) Suffolk Cheviot Poll Dorset Romney Merino
Crossbred lamb production in the hills
 Crossbred lamb production in the hills ADAS Pwllpeiran Cwmystwyth Aberystwyth Ceredigion SY23 4AB Institute of Rural Sciences University of Wales, Aberystwyth Llanbadarn Campus Aberystwyth Ceredigion SY23
11 Genetic and Environmental Impacts on Prenatal Loss H.H. Meyer
 Volume 17, Number 3: 2002 Contents: 1 Preface and Overview Maurice Shelton 6 Selection for Reproductive Efficiency G. E. Bradford 11 Genetic and Environmental Impacts on Prenatal Loss H.H. Meyer 15 Lamb
Sheep Breeding. Genetic improvement in a flock depends. Heritability, EBVs, EPDs and the NSIP Debra K. Aaron, Animal and Food Sciences
 ASC-222 Sheep Breeding Heritability, EBVs, EPDs and the NSIP Debra K. Aaron, Animal and Food Sciences Genetic improvement in a flock depends on the producer s ability to select breeding sheep that are
Experiences with NSIP in the Virginia Tech Flocks Scott P. Greiner, Ph.D. Extension Animal Scientist, Virginia Tech
 Experiences with NSIP in the Virginia Tech Flocks Scott P. Greiner, Ph.D. Extension Animal Scientist, Virginia Tech The registered Suffolk and Dorset flocks at Virginia Tech are utilized heavily in the
INFLUENCE OF FEED QUALITY ON THE EXPRESSION OF POST WEANING GROWTH ASBV s IN WHITE SUFFOLK LAMBS
 INFLUENCE OF FEED QUALITY ON THE EXPRESSION OF POST WEANING GROWTH ASBV s IN WHITE SUFFOLK LAMBS Introduction Murray Long ClearView Consultancy www.clearviewconsulting.com.au Findings from an on farm trial
Richard Ehrhardt, Ph.D. Sheep and Goat Extension Specialist Michigan State University
 Optimizing Reproductive Efficiency in Sheep Production with Strategic Nutritional Management Presenter: Richard Ehrhardt, Ph.D. Sheep and Goat Extension Specialist Michigan State University June 23, 2015
Early lambing with: Improved fertility Improved fecundity Improved prolificacy Compact lambing period Normal return to season Normal sexual cycle
 Early lambing with: Improved fertility Improved fecundity Improved prolificacy Compact lambing period Normal return to season Normal sexual cycle Presentation: Regulin is a yellow cylindrical implant containing
Key Information. Mountain Hill Vs Lowland Production. Breeding Strategy
 Key Information Short day breeder (come into heat in autumn as the day length decreases) Length of oestrus = 17 day cycle Duration of oestrus = 36 hours Length of gestation = 147 days or 5 months Can birth
Correlation of. Animal Science Biology & Technology, 3/E, by Dr. Robert Mikesell/ MeeCee Baker, 2011, ISBN 10: ; ISBN 13:
 Correlation of Animal Science Biology & Technology, 3/E, by Dr. Robert Mikesell/ MeeCee Baker, 2011, ISBN 10: 1435486374; ISBN 13: 9781435486379 to Indiana s Agricultural Education Curriculum Standards
A-l. Students shall examine the circulatory and respiratory systems of animals.
 Animal Science A-l. Students shall examine the circulatory and respiratory systems of animals. 1. Discuss the pathway of blood through the heart and circulatory system. 2. Describe and compare the functions
InternationalJournalofAgricultural
 www.ijasvm.com IJASVM InternationalJournalofAgricultural SciencesandVeterinaryMedicine ISSN:2320-3730 Vol.5,No.2,May2017 E-Mail:editorijasvm@gmail.com oreditor@ijasvm.comm@gmail.com Int. J. Agric.Sc &
Lincoln University Digital Dissertation
 Lincoln University Digital Dissertation Copyright Statement The digital copy of this dissertation is protected by the Copyright Act 1994 (New Zealand). This dissertation may be consulted by you, provided
How Does Photostimulation Age Alter the Interaction Between Body Size and a Bonus Feeding Program During Sexual Maturation?
 16 How Does Photostimulation Age Alter the Interaction Between Body Size and a Bonus Feeding Program During Sexual Maturation? R A Renema*, F E Robinson*, and J A Proudman** *Alberta Poultry Research Centre,
How to accelerate genetic gain in sheep?
 How to accelerate genetic gain in sheep? N Mc Hugh 1, A. O Brien 1, F. McGovern 1, E. Wall 2, T. Pabiou 2, K. McDermott 2, and D. Berry 1 1 Teagasc, Moorepark, Ireland & 2 Sheep Ireland Sheep Breeders
KANSAS SHEEP RESEARCH 1994
 KANSAS SHEEP RESEARCH 1994 Report of Progress 703 Agricultural Experiment Station Kansas State University, Manhattan Marc A. Johnson, Director TABLE OF CONTENTS Performance of Lambs Sired by Rambouillet,
SHEEP SIRE REFERENCING SCHEMES - NEW OPPORTUNITIES FOR PEDIGREE BREEDERS AND LAMB PRODUCERS a. G. Simm and N.R. Wray
 SHEEP SIRE REFERENCING SCHEMES - NEW OPPORTUNITIES FOR PEDIGREE BREEDERS AND LAMB PRODUCERS a G. Simm and N.R. Wray The Scottish Agricultural College Edinburgh, Scotland Summary Sire referencing schemes
Ovulation rate and prolificacy in Booroola Olkuska crossbred ewes
 Animal Science Papers and Reports vol. 22 (2004) no. 3, 325-333 Institute of Genetics and Animal Breeding, Jastrzębiec, Poland Ovulation rate and prolificacy in Booroola Olkuska crossbred ewes Józef Klewiec
Sheep Breeding in Norway
 Sheep Breeding in Norway Sheep Breeders Round Table 2015 Thor Blichfeldt Ron Lewis Director of Breeding Professor, University of Nebraska-Lincoln The Norwegian Association of Sheep and Goat Breeders (NSG)
1981 Sheep and Wool Days
 105 55,. 7Yummary of Reports.. 1981 Sheep and Wool Days Special Report 613 Agricultural Experiment Station April 1981 Oregon State University, Corvallis CONTENTS INCREASED PRODUCTIVITY THROUGH GENETICS
Abstract. Introduction. RBMOnline - Vol 8. No Reproductive BioMedicine Online; on web 10 February 2004
 RBMOnline - Vol 8. No 4. 2004 414-418 Reproductive BioMedicine Online; www.rbmonline.com/article/1059 on web 10 February 2004 Article The Booroola (FecB) mutation is associated with smaller adrenal glands
Pedigree Dorset Horn sheep in Australia
 Australian Journal of Exberimental Agriculture and Animal Husbandry: Pedigree Dorset Horn sheep in Australia I. Breed expansion and other vital s Summary-The Dorset Horn in Australia is maintained almost
Some Problems Concerning the Development of a Poultry Meat Industry in Australia
 Some Problems Concerning the Development of a Poultry Meat Industry in Australia by Fred. SKALLER* INTRODUCTION Poultry meat can be supplied either from culled laying birds, a by-product of the egg industry,
Volume 18: Contents:
 Volume 18: 2003 Contents: 1 Interrelationships of Traits Measured on Fine-wool Rams During a Central Performance Test C.J. Lupton, D.F. Waldron, and F.A. Pfeiffer 8 Effects of Supplementing Polyethylene
Diallel Cross of Three Inbred Lines Of Suffolk Sheep
 Estimation of Combining Abilities From a Diallel Cross of Three Inbred Lines Of Suffolk Sheep JAN 1969 LIBRARY OREGON STATE G UNIVERSITY i Agricultural Experiment Station Oregon State University Corvallis
TRANSPORT OF SPERMATOZOA AND APPARENT FERTILIZATION RATE IN YOUNG AND MATURE MERINO EWES
 Proc. Aust. Soc. Anim. Prod. (1972) 9: 176 TRANSPORT OF SPERMATOZOA AND APPARENT FERTILIZATION RATE IN YOUNG AND MATURE MERINO EWES T. G. KENNEDY* and J. P. KENNEDY* Summary Transport of spermatozoa and
Innovating sheep genetics
 27 July 2018 Rabobank Industry Innovator Presentation Innovating sheep genetics Derek Daniell Masterton Strong base Family of innovators Grandfather, 1913 51 survived WW1, slump, WW2, pushed aerial topdressing
Genetic approaches to improving lamb survival under extensive field conditions
 Genetic approaches to improving lamb survival under extensive field conditions Forbes Brien University of Adelaide and Mark Young Beef + Lamb New Zealand Genetics EAAP 16 Abstract Number 24225 Introduction
7. Flock book and computer registration and selection
 Flock book/computer registration 7. Flock book and computer registration and selection Until a computer service evolved to embrace all milk-recorded ewes in Israel and replaced registration in the flock
Keeping and Using Flock Performance Records Debra K. Aaron, Animal and Food Sciences
 ASC-221 Keeping and Using Flock Performance Records Debra K. Aaron, Animal and Food Sciences University of Kentucky College of Agriculture, Food and Environment Cooperative Extension Service Performance
International sheep session Focus on Iceland Eyþór Einarsson 1, Eyjólfur I. Bjarnason 1 & Emma Eyþórsdóttir 2 1
 International sheep session Focus on Iceland Eyþór Einarsson 1, Eyjólfur I. Bjarnason 1 & Emma Eyþórsdóttir 2 1 The Icelandic Agricultural Advisory Centre 2 The Agricultural University of Iceland Sheep
Understanding Postpartum Anestrus and Puberty
 Understanding Postpartum Anestrus and Puberty Dr. Jack C. Whittier, Colorado State University Dr. Jim Berardinelli, Montana State University Dr. Les Anderson, University of Kentucky 2008 Robert E. Taylor
OPPORTUNITIES FOR GENETIC IMPROVEMENT OF DAIRY SHEEP IN NORTH AMERICA. David L. Thomas
 OPPORTUNITIES FOR GENETIC IMPROVEMENT OF DAIRY SHEEP IN NORTH AMERICA David L. Thomas Department of Meat and Animal Science University of Wisconsin-Madison Sheep milk, as a commodity for human consumption,
Overview of some of the latest development and new achievement of rabbit science research in the E.U.
 First Jilin Rabbit Fair and Conference on Asian Rabbit Production Development, Changchun (China), 8-10 Septembre 2009. Overview of some of the latest development and new achievement of rabbit science research
Inheritance of Livershunt in Irish Wolfhounds By Maura Lyons PhD
 Inheritance of Livershunt in Irish Wolfhounds By Maura Lyons PhD Glossary Gene = A piece of DNA that provides the 'recipe' for an enzyme or a protein. Gene locus = The position of a gene on a chromosome.
The genetic basis of breed diversification: signatures of selection in pig breeds
 The genetic basis of breed diversification: signatures of selection in pig breeds Samantha Wilkinson Lu ZH, Megens H-J, Archibald AL, Haley CS, Jackson IJ, Groenen MAM, Crooijmans RP, Ogden R, Wiener P
Selection of Sheep. Table Ewe (Maternal) Breeds. Characteristics. White face, ears, and legs Acceptable carcass qualities
 Breeds. Characteristics. White face, ears, and legs Acceptable carcass qualities") Selection of Sheep This lesson addresses the selection process when managing a sheep operation. Within Missouri and throughout the Midwest, producers can choose many different breeds of sheep. Each breed
Selection of Sheep This lesson addresses the selection process when managing a sheep operation. Within Missouri and throughout the Midwest, producers can choose many different breeds of sheep. Each breed
Crossbred ewe performance in the Welsh hills
 Crossbred ewe performance in the hills Report on lamb performance to data (23 26) Prepared for: Lynfa Davies Hybu Cig Cymru Author: Dr Barbara McLean Livestock Research Scientist, ADAS Pwllpeiran Introduction
Influence of Experimentally- induced clinical mastitis on Reproductive Performance of Dairy Cattle
 Influence of Experimentally- induced clinical mastitis on Reproductive Performance of Dairy Cattle Dr. Mitch Hockett Department of Animal Science North Carolina State University Characteristics of Mastitis
Approaches to Enhancing Lambing Rate from Out of Season Breeding
 Approaches to Enhancing Lambing Rate from Out of Season Breeding Presenter: Marlon Knights, PhD Associate Professor, Reproductive Physiology Division Animal and Nutritional Sciences Davis College of Agriculture
GENETIC IMPROVEMENT O F LITTER SIZE IN SHEEP
 GENETIC IMPROVEMENT O F LITTER SIZE IN SHEEP J.M. Elsen1, L. Bodin1, D. Francois1, J.P. Poivey1 and J Teyssier2 1INRA Station d'amdlioration G6n6tique des Animaux. BP27-31326 Castanet Tolosan - FRANCE
KANSAS SHEEP RESEARCH
 KANSAS SHEEP RESEARCH 1995 Report of Progress 728 Agricultural Experiment Station Kansas State University, Manhattan Marc A. Johnson Director TABLE OF CONTENTS Performance of Lambs Sired by Rambouillet,
Assessment Schedule 2017 Subject: Agricultural and Horticultural Science: Demonstrate knowledge of livestock management practices (90921)
") NCEA Level 1 Agricultural and Horticultural Science (90921) 2017 page 1 of 6 Assessment Schedule 2017 Subject: Agricultural and Horticultural Science: Demonstrate knowledge of livestock management practices
NCEA Level 1 Agricultural and Horticultural Science (90921) 2017 page 1 of 6 Assessment Schedule 2017 Subject: Agricultural and Horticultural Science: Demonstrate knowledge of livestock management practices
Table1. Target lamb pre-weaning daily live weight gain from grazed pasture
 Grassland Management for High Lamb Performance Tim Keady and Noel McNamara Animal & Grassland Research & Innovation Centre, Teagasc, Mellows Campus, Athenry, Co. Galway. To improve the financial margin
FURTHER OBSERVATIONS ON FACE COVER SCORE IN CORRIEDALES, MERINOS AND THEIR RECIPROCAL CROSSBREEDS
 FURTHER OBSERVATIONS ON FACE COVER SCORE IN CORRIEDALES, MERINOS AND THEIR RECIPROCAL CROSSBREEDS B. C. JEFFERIE* Corriedale and Merino ewes 1961 were scored for face cover lambing, in September after
Ram Buyers Guide.
 Ram Buyers Guide www.hccmpw.org.uk Hybu Cig Cymru / Meat Promotion Wales Tŷ Rheidol, Parc Merlin, Glanyrafon Industrial Estate Llanbadarn Fawr, SY23 3FF Tel: 01970 625050 Fax: 01970 615148 Email: info@hccmpw.org.uk
The BCSBANZ Registered Breeds Handbook
 The BCSBANZ Registered Breeds Handbook Aims: to introduce new, existing, and potential BCSBANZ members to the aims and objectives of the purebreeding of sheep; to document all aspects of the registration
Breeding for Meat Sheep in France
 Breeding for Meat Sheep in France Valérie LOYWYCK, Agathe CHEYPE, Laurence TIPHINE, Jean-Michel ASTRUC 42nd ICAR Conference, Auckland (New Zealand) Workshop: Identification, Meat & Reproduction Recording
The BCSBANZ Registered Breeds Handbook
 The BCSBANZ Registered Breeds Handbook Aims: to introduce new, existing, and potential BCSBANZ members to the aims and objectives of the purebreeding of sheep; to document all aspects of the registration
Mr. Heggie Page 1 of 7
 CONTENT STANDARD 13.0 : PARTICIPATE IN LEADERSHIP TRAINING THROUGH MEMBERSHIP IN FFA PERFORMANCE STANDARD 13.1 : RECOGNIZE THE TRAITS OF EFFECTIVE LEADERS AND PARTICIPATE IN LEADERSHIP TRAINING THROUGH
PROJECT SUMMARY. Optimising genetics, reproduction and nutrition of dairy sheep and goats
 PROJECT SUMMARY Optimising genetics, reproduction and nutrition of dairy sheep and goats Introduction The Australian dairy sheep industry currently has six well established businesses, all of which are
Bixby Public Schools Course Animal Science Grade: 10,11,12
 Weeks 1 6 Chapter 1 Basic animal management Goal: to learn basic understanding of animal management and health. Chapter 2 Basic animal reproduction Goal: To learn the importance of animal reproduction
Worksheet for Morgan/Carter Laboratory #9 Mendelian Genetics II: Drosophila
 Worksheet for Morgan/Carter Laboratory #9 Mendelian Genetics II: Drosophila Ex. 9-1: ESTABLISHING THE ENZYME REACTION CONTROLS Propose a hypothesis about AO activity in flies from vial 1a and flies from
Unit E Segments of the Animal Industry. Lesson 2 Exploring the Sheep and Goat Industry
 Unit E Segments of the Animal Industry Lesson 2 Exploring the Sheep and Goat Industry 1 Terms Buck Cashmere Chammy Confinement Doe Ewe Kid Kidding Lamb Lambing Mohair Mutton Ram Wether Wool Yearling 2
Bi156 Lecture 1/13/12. Dog Genetics
 Bi156 Lecture 1/13/12 Dog Genetics The radiation of the family Canidae occurred about 100 million years ago. Dogs are most closely related to wolves, from which they diverged through domestication about
ANESTRUS BUFFALO TREATMENT SUCCESS RATE USING GNRH
 : 4545-4550 ISSN: 2277 4998 ANESTRUS BUFFALO TREATMENT SUCCESS RATE USING GNRH YAGHOUBAZIZIYAN, FARDGHRAKHANLU 1 AND SAMAD MOSAFERI 2* 1: Department of Veterinary Medicine, Tabriz Branch, Islamic Azad
Published December 4, 2014
 Published December 4, 2014 Effect of the FecX R polymorphism in the bone morphogenetic protein 15 gene on natural or equine chorionic gonadotropin-induced ovulation rate and litter size in Rasa Aragonesa
The Relation between Patterns of Ovarian Follicle Growth and Ovulation Rate in Sheep
 Aust. J. Bioi. Sci., 1978, 31, 649-55 The Relation between Patterns of Ovarian Follicle Growth and Ovulation Rate in Sheep K. E. Turnbull, P. E. Mattner, J. M. George and R. J. Scaramuzzi Division of Animal
New Zealand s Strategy for a more profitable sheep & beef industry. 5 September 2011 P11026
 New Zealand s Strategy for a more profitable sheep & beef industry 5 September 2011 P11026 Outline New Zealand Production Performance recording translates to industry improvement Summary New Zealand Production
2014 Iowa State FFA Livestock Judging Contest 8/23/2014 LIVESTOCK EVALUATION TEST
 2014 Iowa State FFA Livestock Judging Contest 8/23/2014 LIVESTOCK EVALUATION TEST 1. Which of the following correctly defines the acronym EPD? a. Expected Prodigy Differences b. Expected Progeny Differences
WHEN YOU THINK of sheep, you probably think of
 Breeds of Sheep and Goats WHEN YOU THINK of sheep, you probably think of white, round, wooly little animals that produce fiber for clothing. You might even think of meat for a meal or special occasion.
Mastitis and the link to infertility
 CONTINUING EDUCATION I LARGE ANIMAL Mastitis and the link to infertility Mastitis and infertility are the two most common disease complexes in dairy cattle worldwide. Both are major reasons for culling
PRACTICAL APPLICATION OF ARTIFICIAL INSEMINATION IN CONJUNCTION WITH SYNCHRONIZATION OF HEAT CYCLE IN THE EWE
 Proc. Aust. Soc. Anim. Prod. (1972) 9= 171 PRACTICAL APPLICATION OF ARTIFICIAL INSEMINATION IN CONJUNCTION WITH SYNCHRONIZATION OF HEAT CYCLE IN THE EWE P. T. WALKER* Summary Results of artificial insemination
non-carriers of a major gene influencing their ovulation rate
 Differences in ovarian activity between Booroola \mx\merino ewes which were homozygous, heterozygous and non-carriers of a major gene influencing their ovulation rate K. P. McNatty, S. Lun, D. A. Heath,
{Received 21st August 1964)
") RELATIONSHIP OF SEMEN QUALITY AND FERTILITY IN THE RAM TO FECUNDITY IN THE EWE C. V. HULET, WARREN C. FOOTE and R. L. BLACKWELL U.S. Department of Agriculture, Agriculture Research Service, Animal Husbandry
RELATIONSHIP OF SEMEN QUALITY AND FERTILITY IN THE RAM TO FECUNDITY IN THE EWE C. V. HULET, WARREN C. FOOTE and R. L. BLACKWELL U.S. Department of Agriculture, Agriculture Research Service, Animal Husbandry
OVULATION RATE AND LITTER SIZE OF BARBADOS, TARGHEE AND CROSSBRED EWES'
 OVULATION RATE AND LITTER SIZE OF BARBADOS, TARGHEE AND CROSSBRED EWES' G. E. Bradford and J. F. Quirke 2 University of California 3, Davis 95616 ABSTRACT Ovulation rate was measured in Barbados Blackbelly
The Power of NSIP to Increase Your Profits. August 17, 2015 Rusty Burgett, Program Director
 The Power of NSIP to Increase Your Profits August 17, 2015 Rusty Burgett, Program Director NSIP to Increase Profits National Sheep Improvement Program A profit driven genetic selection tool Our Mission:
Crusader Meat Rabbit Project Which Breed and How to Use Different Breeds SJ Eady and KC Prayaga
 Crusader Meat Rabbit Project Which Breed and How to Use Different Breeds SJ Eady and KC Prayaga Livestock Industries Which breed of rabbit is best? This is one of the first questions a rabbit farmer asks.
Mendelian Genetics SI
 Name Mendelian Genetics SI Date 1. In sheep, eye color is controlled by a single gene with two alleles. When a homozygous brown-eyed sheep is crossed with a homozygous green-eyed sheep, blue-eyed offspring
MULTIPLE CHOICE QUESTIONS
 MULTIPLE CHOICE QUESTIONS 1. Mendel verified true-breeding pea plants for certain traits before undertaking his experiments. The term true-breeding refers to: A. genetically pure lines. B. organisms that
Internal Assessment Resource NCEA Level 1 Science AS KEEP CALM AND COUNT SHEEP. A unit of learning to be assessed for
 Internal Assessment Resource NCEA Level 1 Science AS 90949 KEEP CALM AND COUNT SHEEP A unit of learning to be assessed for KEEP NCEA CALM using AND Science COUNT 1.10 (AS90949) SHEEP 1 Contents.. Overview.................
Putting Science into Animal Science Projects. Area: Using Genetics (advanced members) Activity: Eradicate Scrapie in Sheep through Genetic Selection
 Activity: Eradicate Scrapie in Sheep through Genetic Selection") Putting Science into Animal Science Projects Area: Using Genetics (advanced members) Activity: Eradicate Scrapie in Sheep through Genetic Selection Goal: Provide advanced members with the information and
Putting Science into Animal Science Projects Area: Using Genetics (advanced members) Activity: Eradicate Scrapie in Sheep through Genetic Selection Goal: Provide advanced members with the information and
AUTUMN AND SPRING-LAMBING OF MERINO EWES IN SOUTH-WESTERN VICTORIA
 AUTUMN AND SPRING-LAMBING OF MERINO EWES IN SOUTH-WESTERN VICTORIA J. W. MCLAUGHLIN* Summary In each of four years, ewes lambing in the spring (September-October) had a higher proportion of multiple births
2013 Holiday Lectures on Science Medicine in the Genomic Era
 INTRODUCTION Figure 1. Tasha. Scientists sequenced the first canine genome using DNA from a boxer named Tasha. Meet Tasha, a boxer dog (Figure 1). In 2005, scientists obtained the first complete dog genome
Evaluating the performance of Dorper, Damara, Wiltshire Horn and Merino breeds in the low rainfall wheatbelt of Western Australia Tanya Kilminster
 Evaluating the performance of Dorper, Damara, Wiltshire Horn and Merino breeds in the low rainfall wheatbelt of Western Australia Tanya Kilminster Department of Agriculture and Food WA, Merredin Email:
Like to see more lambs?
 Like to see more lambs? Ovastim can help you increase your profitability The sale of lambs constitutes 7% of gross income in second cross lamb enterprises, and over 5% of gross income in first cross enterprises
Pavel Vejl Daniela Čílová Jakub Vašek Naděžda Šebková Petr Sedlák Martina Melounová
 Czech University of Life Sciences Prague Faculty of Agrobiology, Food and Natural Resources Department of Genetics and Breeding Department of Husbandry and Ethology of Animals Pavel Vejl Daniela Čílová
Improving sheep welfare for increased production
 Improving sheep welfare for increased production Emma Winslow 3 April 2017 SARDI - Struan sheep Research Livestock innovation and welfare group: Sheep welfare and wellbeing Production and management Genetic
FOLLICULAR GROWTH PATTERN IN BUFFALOES SYNCHRONIZED TO ESTRUS WITH PROGESTERONE IMPREGNATED INTRAVAGINAL SPONGES
 International Journal of Science, Environment and Technology, Vol. 3, No 3, 2014, 960 965 ISSN 2278-3687 (O) FOLLICULAR GROWTH PATTERN IN BUFFALOES SYNCHRONIZED TO ESTRUS WITH PROGESTERONE IMPREGNATED
S e c t i o n 8 Page 89 Section 8
 Section 8 BREEDING What is the natural breeding season for ewes?......................... 90 How long is the estrous cycle of a ewe during the ovulatory period?......... 91 What are the signs of estrus?.......................................
Karyotypes Pedigrees Sex-Linked Traits Genetic Disorders
 Karyotypes Pedigrees Sex-Linked Traits Genetic Disorders Consists of 23 pairs of chromosomes. Images are taken from diploid cells during mitosis. Chromosomes 1 through 22 are called autosomes. The X and
Student Exploration: Mouse Genetics (One Trait)
") Name: Date: Student Exploration: Mouse Genetics (One Trait) Vocabulary: allele, DNA, dominant allele, gene, genotype, heredity, heterozygous, homozygous, hybrid, inheritance, phenotype, Punnett square,
Name: Date: Student Exploration: Mouse Genetics (One Trait) Vocabulary: allele, DNA, dominant allele, gene, genotype, heredity, heterozygous, homozygous, hybrid, inheritance, phenotype, Punnett square,
Breeding and feeding for more lambs. Andrew Thompson & Mark Ferguson
 Breeding and feeding for more lambs Andrew Thompson & Mark Ferguson What ewe type do you/your clients predominantly run? A) Fine and super fine Merino B) Medium Merino C) Meat Merino (Including Dohnes
Ewes carrying the Booroola and Vacaria prolificacy alleles respond differently to ovulation induction with equine chorionic gonadotrophin
 Ewes carrying the Booroola and Vacaria prolificacy alleles respond differently to ovulation induction with equine chorionic gonadotrophin J.C.F. Moraes and C.J.H. Souza Embrapa Pecuária Sul, Bagé, RS,
Biology 120 Lab Exam 2 Review
 Biology 120 Lab Exam 2 Review Student Learning Services and Biology 120 Peer Mentors Sunday, November 26 th, 2017 4:00 pm Arts 263 Important note: This review was written by your Biology Peer Mentors (not
The estrous cycle. lecture 3. Dr. Wafer M. Salih Dr. Sadeq J. Zalzala Dr. Haydar A. AL-mutar Dr. Ahmed M. Zakri
 The estrous cycle lecture 3 By Dr. Wafer M. Salih Dr. Sadeq J. Zalzala Dr. Haydar A. AL-mutar Dr. Ahmed M. Zakri The estrous cycle Definition Sexual Puberty in the females is defined as the age at the
Reasons for an Autumn Lambing Programme in the Western District of Victoria
 Reasons for an Autumn Lambing Programme in the Western District of Victoria W. W EATHERLY* Summary The advantages and disadvantages of an autumn lambing are outlined. Advantages : The autumn lambing programme
Analysis of genetic improvement objectives for sheep in Cyprus
 Analysis of genetic improvement objectives for sheep in Cyprus Mavrogenis A.P. in Gabiña D. (ed.). Analysis and definition of the objectives in genetic improvement programmes in sheep and goats. An economic
Jerry and I am a NGS addict
 Introduction Identification and Management of Loss of Function Alleles Impacting Fertility L1 Dominette 01449 Jerry and I am a NGS addict Jerry Taylor taylorjerr@missouri.edu University of Missouri 2014
Effect of inbred on reproduction and body weight of sheep in a closed Booroola flock
 Animal Science Papers and Reports vol. 23 (2005) no. 4, 237-247 Institute of Genetics and Animal Breeding, Jastrzębiec, Poland Effect of inbred on reproduction and body weight of sheep in a closed Booroola
7. IMPROVING LAMB SURVIVAL
 7. IMPROVING LAMB SURVIVAL Introduction It is widely accepted that there is a large amount of lamb wastage in Merino flocks. Fertility rates, as measured by the number of lambs present at scanning are
Survey and Performance Evaluation of Malpura Sheep in Farmers Flocks of its Native Tract
 DOI Number 10.5958/2277-940X.2014.00078.3 Journal of Animal Research: v.4 n.1, p. 75-84. June 2014 Survey and Performance Evaluation of Malpura Sheep in Farmers Flocks of its Native Tract A.L. Arora 1,
AGE OF ONSET OF PUBERTY IN MERINO EWES IN SEMI-ARID TROPICAL QUEENSLAND
 Proc. Aust. Soc. Anim. Prod. (1972) 9: 181 AGE OF ONSET OF PUBERTY IN MERINO EWES IN SEMI-ARID TROPICAL QUEENSLAND R. M. MURRAY* Summary TWO groups, each of 25 ewes were run with harnessed vasectomized