rs G/A chr10: C/T rs C/T rs T/G
|
|
|
- Marcia Moody
- 5 years ago
- Views:
Transcription
1 Supplementary Figure 1 minor allele frequency alleles (major/minor) case control ceph rs G/A rs C/T chr10: C/T chr10: A/G rs C/T rs T/G chr10: G/A chr10: C/A rs G/T chr10: G/T Exon SNP Novel SNP
2 Supplemental Figure 1. Re-sequence Analysis of Exons/Promoter Region in MSMB Bi-directional sequence analysis was performed using ABI big-dye terminator mix and analyzed on a 3730x. Primers are available on the SNP500Cancer website (
3
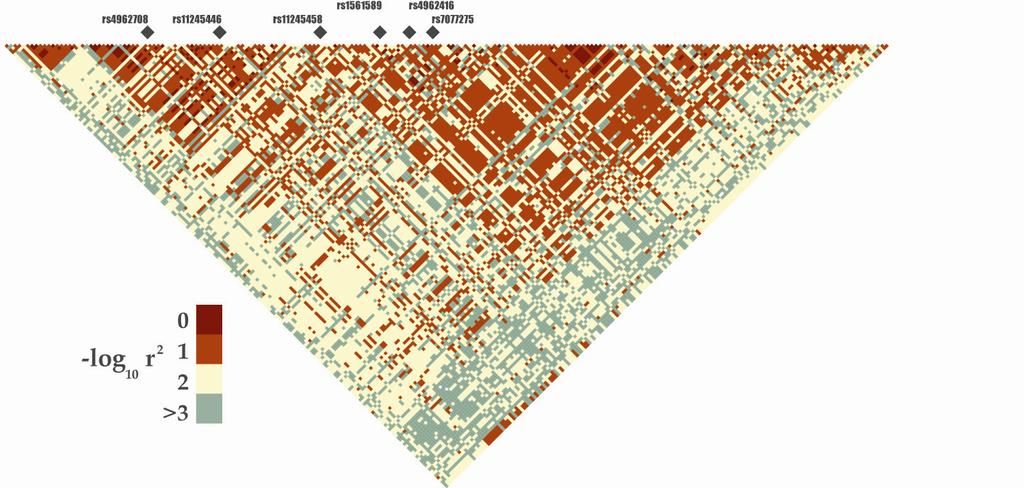
4 Supplemental Figure 2. Location of the association signal and linkage disequilibrium across the CTBP2 region. The pattern of linkage disequilibrium across the CTBP2 and ZRANB1 genes on chromosome 10 is depicted based on the CEU of HapMapII (MAF > 5% with r 2 > 0.8). The color code indicates the estimated LD on the log 10 (r 2 ) scale.
5 Supplementary Methods Cancer Genetic Markers of Susceptibility (CGEMS) Prostate Cancer Follow-up Scan 1 The CGEMS data portal provides public access to association results for approximately 550,000 SNPs genotyped in the CGEMS prostate cancer whole-genome scan (Phase 1A with HumanHap300 and Phase 1B HumanHap240 assays, both from Illumina Corp., San Diego, CA) in more than 1,100 prostate cancer patients and an equivalent number of controls from the PLCO Cancer Screening Trial. The materials and methods of the initial genome-wide scan have been reported 1 and are also available in a PDF format at Analysis of nearly 550,000 SNP genotypes resulted in the choice of 29,018 SNPs to type in additional 4,020 prostate cancer cases and 4,028 controls drawn from four additional studies using a custom Illumina iselect assay chip. Studies 1. Prostate, Lung, Colon and Ovarian (PLCO) The Prostate, Lung, Colon and Ovarian (PLCO) Cancer Screening Trial is a large, randomized controlled trial of approximately 155,000 men and women 2,3. Participants are randomized to either a screening or control arm. Each year after enrollment, subjects are asked to notify the study of any cancers diagnosed in the past year using the Annual Study Update (ASU). The trial is designed to test the efficacy of cancer screening to prevent early death from prostate, lung, colorectal and ovarian cancer. The collection of questionnaire data and biospecimens (e.g., repeated blood samples and in some instances, buccal cell samples) allows investigation of early markers for cancer as well as etiology of common cancers 4. PLCO enrollment began in 1993 and ended in Recruitment included men and women, aged 55 to 74 with no reported history of prostate, lung, colon and ovarian cancer, although prior diagnoses of other cancers were acceptable. The CGEMS cohort consisted of men enrolled in the screening arm of the PLCO Trial who: 1. were White and non-hispanics; 2. had no prior history of prostate of cancer before randomization; 3. had at least one (PLCO) prostate cancer screen (PSA testing) before October 1, 2003; 4. had completed a Baseline Questionnaire about risk factors for cancer; 5. had signed informed consent; 6. had provided a blood sample sufficient to meet one of the following criteria: a. at least 11 µg DNA after extraction 1
6 b. at least 1 vial of buffy coat, or c. at least 7 vials of whole blood was available; and 7. for controls, had returned at least one Annual Study Update (ASU). Based on these criteria, 28,521 men were included in the CGEMS sub-cohort. CGEMS distinguishes between non-aggressive and aggressive cases of prostate cancer at the time of diagnosis. The two subtypes are defined as follows: 1. Non-aggressive: cases with a Gleason Score < 7 and Stage < III. 2. Aggressive: cases with a Gleason Sore > 7 or Stage > III. Study enrollment began on October 1, Consequently, study years in the PLCO Trial are counted according to the Federal fiscal year, Oct 1 to the following September 30. All men diagnosed with prostate cancer between enrollment and the end of FY2001 were considered for inclusion in CGEMS. Because of our interest in the clinically more significant, but less common aggressive form of prostate cancer, we increased the fraction of aggressive cases in the CGEMS case series by extending eligibility for cases diagnosed with aggressive prostate cancer through the end of FY ,361 subjects with prostate cancer met the eligibility criteria and were considered for the CGEMS project; 737 cancers were aggressive 624 cancers were non-aggressive. Of the eligible cases, all aggressive cases (n=737) were chosen to be cases in the CGEMS prostate cancer study. Of the 624 men found to have non-aggressive tumors, 493 men (70.4%) whose diagnosis was temporally closest to the first screening were included in this study. Controls were selected by incidence-density sampling. The first step was creation of non-overlapping sets of cases characterized by: 1. Calendar year (FY) of entry into the cohort, 2. Age at entry in five-year intervals (55-59, 60-64, 65-69, 70-74) 3. Number of years under follow-up between enrollment and diagnosis of prostate cancer. Next, for each case set, we identified eligible men among all 28,251 men in the CGEMS cohort who met each of the following three criteria: 1. Same year of entry into the cohort as the case set 2. Same five-year age-at-entry interval (55-59, 60-64, 65-69, 70-74) as the case set 3. Observed through the year of follow-up in the case set with no prostate cancer diagnosis. For cases diagnosed before 2002, some samples had already been extracted for another prostate cancer study within the PLCO cohort. To assure that all eligible subjects had equal inclusion probability for this study, we replaced some of the previously selected controls with newly enrolled cohort members according to a random selection rule that ensured that the chance of inclusion as a control in the CGEMS study for a given case was the same for each man eligible to be a control. 2
7 The analysis of PLCO subjects for the CGEMS whole-genome scan applied an incidence density sampling approach to obtain a random sample of controls from the corresponding risk set with size equal to the number of cases in the set. In incidence density sampling, a male subject is included as a control for a given case set independently of eligibility and selection as a control for other case sets and independently of future diagnosis as a case. However in this follow up analysis, these data were analyzed by the simpler cumulative incidence sampling, where each subject is included once in a phenotype group at the last of the study follow up. The ranking of the most significant SNPs changed little when shifting from incidence to cumulative density sampling. 2. Health Professionals Follow-up Study The Health Professionals Follow-up Study (HPFS) began in 1986 and is an ongoing prospective cohort study of 51,529 United States male dentists, optometrists, osteopaths, podiatrists, pharmacists, and veterinarians 40 to 75 years of age 5. The baseline questionnaire provided information on age, marital status, height and weight, ancestry, medications, smoking history, disease history, physical activity, and diet. At baseline the cohort was 97% white, 2% Asian American, and 1% African American. The median follow-up through 2005 was 10.5 years (range 2-19 years). Self-reported prostate cancer diagnoses were confirmed by obtaining medical and/or pathology records. Prostate cancer deaths are either reported by family members in response to follow-up questionnaires, discovered by the postal system, or the National Death Index. Questionnaires are sent every two years to surviving men to update exposure and medical history. In 1993 and 1994, a blood specimen was collected from 18,018 men without a prior diagnosis of cancer. Prostate cancer cases are matched to controls on birth year (+/-1) and ethnicity. Controls are selected from those who are cancer-free at the time of the case s diagnosis, and had a prostate-specific antigen test after the date of blood draw. 3. Alpha-Tocopherol, Beta-Carotene Cancer Prevention Study (ATBC) The Alpha-Tocopherol, Beta-Carotene Cancer Prevention Study (ATBC Study) was initiated in 1985 as a randomized controlled trial of 29,133 Caucasian male smokers years old in southwestern Finland that tested the cancer preventive effects of vitamin E and beta-carotene on cancer incidence 6. It was continued as a longitudinal cohort, following the intervention period. Current follow-up exists for up to 20 years (16 years at the time the nested case-control set was created for the BPC3). Cancer incidence and overall mortality are 100% ascertained follow-up through national registries in Finland. Serum and questionnaire data were collected for all participants at baseline, and whole blood (for DNA) in 1992 from 20,243 men. The ATBC Study nested set for the BPC3 included 1,058 prostate cancer cases and 1,058 controls without prostate cancer who were matched based on age, intervention assignment, date of blood draw. 3
8 4. The American Cancer Society Cancer Prevention Study II Nutrition Cohort (CPS-II) The American Cancer Society Cancer (ACS) Prevention Study II Nutrition Cohort (CPS-II) was established in 1992; the cohort includes over 86,000 men and 97,000 women from 21 U.S. states who completed a mailed questionnaire in At baseline, the cohort was 97% white and the median age of participants was 63 (range: 40-92) 7. Starting in 1997, follow-up questionnaires have been sent to surviving cohort members every other year to update exposure information and to ascertain occurrence of new cases of cancer; a >90% response rate has been achieved for each follow-up questionnaire. Incident cancers are verified through medical records, state cancer registries, or death certificates. From , blood samples were collected from a subgroup of 39,376 cohort members. To further supplement the DNA resources, during , buccal cell samples were collected by mail from an additional 70,004 cohort members. Cases of prostate cancer were frequency matched to controls on single year of age, ethnicity, date of sample collection and specimen type (blood or buccal cell sample). All controls were selected from individuals who were cancer-free (except for non-melanoma skin cancer) at the beginning of the interval preceding the diagnosis of each case. Similarly, cases were not eligible if they had a history of another cancer other than nonmelanoma skin cancer prior to their diagnosis of prostate cancer. Oversampling of aggressive prostate cancer cases included mainly buccal samples and controls were matched as above using buccal samples. For all cases, exposure information was collected by questionnaire before the cancer diagnosis. However, collection of some biologic samples occurred after cancer diagnosis or immediately preceding cancer diagnosis. DNA from buccal samples were extracted with a standard method The CeRePP French Prostate Case-Control Study The French Prostate Cancer Case Control Study (CeRePP), also known as ProGene study began in July Patients treated in three French Departments of Urology (Paris, Brest and Nancy) were recruited for the study 9. Patients who had histologically confirmed prostate cancer were included after receiving their informed consent. At this time, a blood sample was collected. Clinical and histological data in the probands were obtained from medical records. Each participating patient received a questionnaire by mail to collect family data on their first-degree relatives (date of birth, and if deceased, age at death and cause of death) and the occurrence of cancers in their families. Controls were recruited as participating in a systematic health screening program funded by the French National Health Insurance and found unaffected (asymptomatic for prostate cancer, normal digital rectal examination and total PSA < 4 ng/ml). They were recruited in the same geographical areas as the three Hospitals. They also completed a questionnaire to collect information on occurrence of cancers in their first-degree relatives. 4
9 Additional information for both cases and controls included the month and year of blood donation, height & weight at diagnosis/screening, history of smoking at blood donation and family history for prostate cancer in first-degree relatives. Additional information for cases included tumor stage (TNM), tumor grade (Gleason score), tumor histology and death (year, date and whether due to prostate cancer). Cases were matched with controls within each recruiting location and by 5 year interval at age of interview/diagnostic. Replication Design A total of 29,018 SNPs were included in the replication study and were chosen based on several criteria (Table 1) 10. A. Whole genome scan replication, 1-SNP model: The majority (87.07%) of SNPs were chosen for testing in follow-up based on a single-locus test of association (see Association Testing below). The p value cut-off for inclusion was In order to maximize the number of regions monitored in replication, a linkage disequilibrium (LD) filter was applied using TagZilla ( such that only the most significant SNP in a set of highly correlated SNPs (r 2 0.8) was advanced to replication. B. Whole genome scan replication, 2-SNP model: 1,348 SNPs were chosen based on a 2-SNP model. Two locus tests were selected by taking each of SNP with a marginal p<0.05 and constructing a model with each SNP up to 25 SNPs upstream and 25 SNPs downstream within 200kb. An unadjusted stratified analysis was performed by constructing three 3x3 contingency tables of the phenotype by genotype counts of the non-reference SNP stratified on the reference SNP. This is essentially the same as fitting a logistic model including the genotype effects of both loci, all possible interactions, but no other covariates, and testing for the main effects of the non-reference SNPs and all possible interactions with 12 degrees of freedom. Of the approximately 50 models tested for each reference SNP, the one with the smallest p-value was retained. These 2-SNP models where ranked and the top 1,348 pairs were taken, provided that both SNPs were not already included by the single-snp selection criteria. C. Population substructure: 1,508 SNPs were chosen to monitor population stratification (see below). D. Candidate genes/regions: To perform fine mapping at the 8q24 candidate region, the region was tagged in HapMap CEU 11,12 using TagZilla ( using SNPs with a minor allele frequency (MAF) greater than 5% and r 2 > 0.80; 184 SNPs were identified by this method. Two hundred SNPs were chosen to follow-up a preliminary scan of 91 patients with prostate cancer from the Framingham Heart Study Collaboration 13. In order to investigate possible associations with interesting candidate genes, 5 genes were fine-mapped using a strategy similar to that which was used for the 8q24 region. Tags were selected from each of 5 genic regions 20kb 5 of the start of transcription and 10kb 3 of the end of the last exon. Of the 29,018 SNPs that were originally selected, a total of 26,958 SNPs were successfully genotyped. Specifically, 24,748 SNPs were tested in the single locus replication phase (see below for discussion of SNPs that failed genotyping quality control). 5
10 Table 1. SNPs selected for replication Failed Manufacturing Final Count Hypothesis Ordered Failed QC Whole-genome scan replication 26,613 1, ,748 Single locus (p<0.069) 25,265 1, ,485 Two locus 1, Population Stratification 1, Framingham Heart Study Collaboration 8q24 Fine Mapping Candidate gene fine mapping ATBF ERG KLK MSR RUNX Total 29,018 1, ,958 Sample handling DNA samples were received from each cohort and visually inspected for adequate fluid in individual tubes. Three measurements of quantification were performed according to the standard procedures at the Core Genotyping Facility of the National Cancer Institute. These include pico-green analysis, optical density spectrophotometry and real time PCR ( Samples were also analyzed with 15 short tandem repeats and the Amelogenin marker in the Identifiler Assay (ABI, Foster City, CA). All samples advanced to genotype analysis completed no less than 13 of the 15 micro-satellite markers. 332 DNAs were aliquoted in duplicate for quality control purposes, and are discussed in the genotype concordance section below. After final review and sample handling, a total of 8,693 DNA samples were selected for genotyping. See Table 3 for a detailed breakdown by study and phenotype. Genotype Quality control Assessment of Call Rates A total of 26,958 SNP genotype assays were attempted on the 8,693 DNA samples using the custom iselect Infinium platform, using SNPs already included on the Illumina HumanHap550 assay. Samples that did not meet a 90% completion threshold were excluded from further analysis. See Table 2 for the number of samples from each cohort that were excluded based on these criteria. The remaining 8,498 DNAs were retained for the subsequent analyses. SNPs were excluded for 2 reasons: 1) The assay failed manufacturing at Illumina or 2) The assay exhibited low completion rate in the laboratory. A total of 249 SNPs failed to provide reliable genotype results due to either no call or low call rates (<90%; see Table 1 for distribution among SNP categories of inclusion). 6
11 Table 2. Samples genotyped Attempted Failed QC Passed QC CPS-II (blood) 2, ,765 CPS-II (buccal) 1, ,088 ATBC 2, ,981 CeRePP 1, ,378 HPFS 1, ,286 Total 8, ,498 Table 3. Subject counts by study that passed sample-level genotype QC Cases Controls All Cases Non-aggressive tumor Aggressive tumor Unknown stage tumor PLCO 1,105 1, CPS-II 1,797 1, ATBC CeRePP HPFS Replication 4,028 4,020 1,620 1, All 5,133 5,200 2,109 2, Assessment of unique subjects After removal of sample and locus data due to low completion rates, genotypes for each sample that appeared in duplicate were merged to form consensus genotypes for each study subject; for any observed genotype discordances were henceforth considered as missing observations. Table 3 contains the detailed numbers for each study of the distribution of subjects by phenotype. Assay concordance The genotype concordance rate for SNP assays was evaluated using the 332 pairs of known duplicated DNA samples. These pairs of samples were separate aliquots from the same DNA preparation and all met quality control criteria requested for the other samples, thereby, providing reliable data for comparison. An average discordance rate of % was observed. No SNP or sample was excluded from further analysis based on discordance rate. Table 4 shows the individual study discordance rates in more detail. Table 4. Intra-cohort sample genotype concordance Concordance Discordance Rate Total Comparisons Mean Max Cohort Pairs Discordant Concordant CPS-II (blood) ,998,477 2,998, % 0.267% CPS-II (buccal) ,011,119 1,011, % 0.011% ATBC ,751,688 2,751, % 0.060% CeRePP , , % 0.213% HPFS ,312,424 1,312, % 0.160% Total ,050,148 9,050, % 0.267% 7
12 Concordance analysis also revealed monozygotic twins or individuals enrolled unexpectedly in more than one study. 18 pairs of such subjects were found and were verified to have nearly identical age and phenotypes. Table 5 shows the discordance rates per inter-cohort comparison. Table 5. Inter-cohort sample genotype concordance Genotype Counts Discordance Rate Cohort 1 Cohort 2 Pairs Discordant Concordant Total Comparisons Mean Max PLCO CPS-II (blood) , , % 0.181% PLCO CPS-II (buccal) ,972 79, % 0.015% PLCO HPFS ,093 80, % 0.011% CPS-II (blood) HPFS , , % 0.004% CPS-II (buccal) HPFS ,423 54, % 0.007% Hardy Weinberg Proportions in control DNA Genotype data were tested for deviation from Hardy-Weinberg proportions using an exact test 14. The analysis was conducted in each cohort s control group. Significant deviations were observed for an average of 5.34% of all SNPs at the level of p<0.05 and 0.39% at p< Table 6 contains the proportion of SNPs per study that deviate from Hardy-Weinberg proportions. None of these SNPs were excluded from analysis since the tests for association applied to such data are valid in the presence of departure from Hardy-Weinberg proportions, although with potentially reduced power when these deviations are due to systematic genotyping errors with equal effects among cases and controls. Table 6. Percent of SNPs exhibiting deviation from Hardy-Weinberg Proportions by Study Proportion of SNPs p<0.05 p<0.001 PLCO CPS-II ATBC CeRePP HPFS
13 Subject exclusions Subjects with valid genotypes were excluded from analysis based on the following (summarized in Table 7): 1. For unanticipated inter-study duplicates, the subject was excluded from the larger study. An exception was made retaining all duplicate subjects in the PLCO cohort, since their genotypes were already published as part of the initial genomewide scan. 2. Imputed race, where only subject with imputed European background were retained, regardless of their self-reported race. 3. Sparse groups. Only 2 PLCO subjects were available from one study center and were excluded. Also, only 5 non-aggressive cases were part of the CPS-II buccal group, so they were also excluded. 4. Missing covariates. These subjects were missing one or more covariates necessary for association analysis. Table 7. Excluded Subjects Inter-study Duplicates Non-European Origin* Sparse Group Missing Covariates Total PLCO CPS-II ATBC CeRePP HPFS Replication All Non-European origin is defined as having less than 0.85 European origin as inferred using the program STRUCTURE 15. After the exclusion of subjects based on various criteria, the total number of cases and controls for association analyses were 5,064 and 5,116, respectively. Table 8 contains the final subject counts per study for each phenotypic state. Table 8. Final subject counts for association analysis Cases Controls All Cases Non-aggressive tumor Aggressive tumor Unknown stage tumor PLCO 1,100 1, CPS-II 1,775 1, ATBC CeRePP HPFS Replication 3,964 3,941 1,583 1, All 5,064 5,116 2,071 2, In order to confirm the validity of the genotype call using the Infinium Technology (Illumina Corp., San Diego, CA), the notable SNPs were assayed by 9
14 TaqMan (ABI, Foster City, CA) platform in two studies, HPFS and CPS-II (buccal component) to assess the concordance between Infinium -generated genotype calls (see Figures 1 and 2 for cluster plots for the SNPs for HPFS and CPS-II, respectively) and TaqMan. Table 9 displays % concordance between Infinium and TaqMan genotypes and GenTrain scores for the Infinium assays 10. Table 10 contains the primer and probe sequences for each assay. Table 9. Concordance between Infinium (iselect) and TaqMan-derived genotypes for the SNPs in Table 1 (main text) and GenTrain Scores Concordance GenTrain Score # (%) CPS-II (buccal) HPFS CPS-II (buccal) HPFS rs * rs * rs rs rs rs rs rs rs rs rs rs * Previously reported for both Infinium and TaqMan technologies 1 + Assay failed in manufacturing # A number from 0 to 1 indicating how well the samples clustered for a particular locus. Score is based on cluster tightness as well as relative separation between clusters. Table 10. Primer and Probe Sequences for TaqMan Assays Forward/Reverse Primer Fam/Vic Probe rs CTCCTTCTCCTTTCTGAAGAAATTCTCA CCTGCCCAATTTAAGCTTTATGCA CAGACTGGAAATGC rs TCAACCCTCTGTAAACACTCAATGTG CTTTTATACTGGAGAGGGCAACCA rs CATAGCTGAAAGATGAGGAGTCAAGA CCAAGGTTCAGCCTCATCTCTT rs CCTTTCCTGCTTTAATCATAGCCAAAT CATTAAAACTGTAAAGCCCAAGCATCT rs GGTTTGGGAGTCAGCCAGATG GGCCAAGAGACCACATGGA rs AGTTAGCAAAAGCAAATTAATGTAGTTTGACAA ACCTATAAGCTGTCCTCTGGTCTT rs ATGATGTTTGGTGCAGTCTTGAAAG AGAAAAGCTCAGGACATAGAAAGCA rs CACGATCCTGAGTCACTGTGAT GGGTCTGGATGTCGGCTAAC rs CAGGGAAGTCCATTTCTTCAACTGA GAGGACCCTGCAGTAACAGTAA ACAGACTGGAGATGC CATTCGACATCATTGG CATTCGACGTCATTGG CCCTTCTTAAACTTTCAG CCCTTCTTAAATTTTCAG CTCTAAGTTTAAGTATCCC CTCTAAGTTTAAATATCCC CTGAATTCTATCCATGGCCA CTGAATTCTATCCGTGGCCA TAGAGCTGGGCATTT AAATAGAGCTGGACATTT CGCAGTCACTGTGGAG CGCAGTCACTATGGAG TCCAGTCTCCATCATT CCAGTCCCCATCATT CAGACTTCAAGTCTCG TCAGACTTCACGTCTCG 10


15 Figure 1. Illumina Infinium HumanHap550 genotype clustering for HPFS cohort rs rs rs rs rs rs rs rs rs rs rs rs


")


16 Figure 2. Illumina Infinium HumanHap550 genotype clustering for CPS-II (buccal) cohort rs rs rs rs rs rs rs rs rs rs rs rs
17 Assessment of Population Structure Two independent sets of SNPs were used for the detection of population stratification in the four follow up samples. The first set of pre-selected 1,508 SNPs had been specifically chosen for typing in the follow-up studies for this purpose and were selected because of completion rates higher than 90%, a residual linkage disequilibrium r 2 value lower than 0.1 for any pair of SNPs less than 200 Kb apart and enabling a stable detection of the first two principal components of population structure identified in the PLCO study 16. The second set of 10,693 SNPs was selected from all of the SNPs typed in the follow-up studies because of indication of their possible associations in the genome-wide scan. The selection was based upon a completion rate higher than 90% and residual linkage disequilibrium r 2 value lower than for any pair of SNPs less than 200Kb apart. In an attempt to maximize genetic homogeneity, subjects with significant estimated non- European ancestry were excluded from analysis. This estimation was done using the STRUCTURE program by merging the genotypes from the follow-up studies with those of the reference HapMap population downloaded from the HapMap web site. The number of clusters (the k parameter) was set to three and the CEU, YRI and JPT+CHB samples were each specified to a different cluster schematically representing populations of European, African and Asian origin respectively. The CGEMS samples were left unspecified. A total of 112 subjects were estimated to have less than 85% European ancestry and were excluded from analysis (Figure 1). All individuals that had at greater than 85% European ancestry were retained for the replication study, regardless of their reported origin (Table 7). 13
18 Figure 3. Admixture plot We defined the imputed origin as follows: a subject is considered to have a single continental origin if the estimated admixture portion was greater than 85% with any single seed population. Subjects were labeled admixed if their estimated proportion of admixture was greater than 15% with only one population, but less than 85%. Subjects with greater than 15% estimated admixture with more than one seed population was labeled as the concatenation of all such seed populations. 14
19 Table 11. Cross-tabulation of reported versus imputed race Cohort Reported Origin African STUDY Imputed origin Caucasian American Asian Hispanic Unknown PLCO Caucasian 2,277 Admixed Caucasian 2 African + Caucasian 1 Asian + Caucasian 2 CPS-II Caucasian 3, Admixed African 1 Admixed Caucasian 7 2 African 2 Asian 2 African + Caucasian 4 6 Asian + Caucasian ATBC Caucasian 1,850 Admixed Caucasian 25 Asian + Caucasian 2 CeRePP Caucasian 1,313 Admixed Caucasian 1 African 3 African + Caucasian 19 Asian + Caucasian 3 African + Asian + Caucasian 1 HPFS Caucasian 1, Admixed Caucasian 4 2 Asian 2 African + Caucasian 8 Asian + Caucasian 2 1 To adjust for any remaining finer-grained population differences, a principal component analysis of all DNAs used in this study was performed using the EIGENSTRAT program 16. Both sets of SNPs detected essentially the same three most significant principal components. The correlation coefficients of the DNA coordinates along these directions were 0.84, 0.78 and The fourth component was not correlated. As the density of the clustering appeared more clearly with the second set of SNPs, this set was used for correction of population stratification using four components. The use of one additional component, as compared to the analysis that was done for the first stage (PLCO study), which used three components, accounts for the distinct difference of the Finnish subjects with respect to the rest of the cases and controls 1. Thus four eigenvectors were included as quantitative covariates when testing for association between prostate cancer phenotypes and SNPs typed as part of the replication scan. 15
20 Association Analysis The primary analysis of the CGEMS prostate GWAS study explores the association between single SNPs and prostate cancer susceptibility in 26,985 SNPs per subject overall. 25,265 SNPs were selected based on single-snp association tests and 1,348 SNPs were selected based on two-snp association tests, in addition to the 1,508 SNPs chosen to aid in the characterization of population structure. Additional SNPs were chosen to explore high-profile candidate genes, fine-mapping, and non-cgems hypotheses and will not be discussed here. For the follow-up replication studies, all one- and two- SNPs analyses were conducted using unconditional logistic regression, adjusted for age (in ten-year categories), study, and center for the two studies in which center for recruitment was available (i.e., PLCO and the French Prostate Case Control). We analyzed each study separately, the pooled replication studies (all except PLCO), and all studies combined. The analytic approach assumes no structure to the risk across the 3 possible genotypes at each locus. This approach maintains power to detect recessive or overdominant alleles at the cost of a small decrease in power relative to the Cochrane- Armitage trend test 17,18 for the detection of alleles with multiplicative effect. Prostate cancer stage and grade at diagnosis are important predictors of survival; they may also have different etiologic factors. Therefore, we distinguish between nonaggressive and aggressive prostate cancer in the analysis. Essentially, our analysis combines the effect from looking separately at the two case phenotypes. Our analysis has power to identify susceptibility loci specific to aggressive or non-aggressive prostate cancer, at a small cost of power for loci with the same odds ratio in aggressive and nonaggressive cases. Genetic Models In order to maintain high power to detect SNPs that are involved in non multiplicative models (such as complete recessive or over-dominance), we provide analyses of the data based on genotype frequencies. Each of the three possible genotype states are considered separately. Accordingly, for autosomal loci, analysis of each case phenotype uses a statistical test with two degrees of freedom for each case phenotype considered separately (aggressive and non aggressive separately yield 4 degrees of freedom with 3 genotypes). For tests involving X-linked loci in the initial genome-wide scan, a single degree of freedom is used per case phenotype. Design of follow-up studies We compared two follow-up designs to evaluate our ability to identify SNPs that would demonstrate the genome wide significance threshold of 10-7 based on our available resources. The initial genome wide scan had been performed on 1,172 cases and 1,157 controls; 4,020 cases and 4,028 controls were available for follow-up. Follow-up of the initial scan was simulated either as a single stage, which would involve the typing of all SNPs that reached a p-value lower than at the initial screen on all cases and controls, or as two stages, with a first stage involving the typing of the same SNPs on all 16
21 4,020 cases and 4,028 controls followed by a second stage which would type only those SNPs that reached a p value lower than 10-3 on the remaining 5,000 pairs. Simulation was performed under the following assumptions: the frequency of the at-risk allele is uniformly distributed between 0.05 and 0.95; odds ratio, OR, of the at-risk homozygote varied between 1.1 and 2 (Table 12). The heterozygote was assumed to have an OR equal either to 1 (recessive model), or to the square root of the OR of the at-risk homozygote (multiplicative model of risk i.e. additive on the log OR scale) or to the OR of the at-risk homozygote (dominant model). For each model, genotypes were randomly generated based on their expected frequency and p values were computed on the merged genotypes that would have been available at the completion of each phase. A two-degree of freedom χ2 was used when all 6 cells had more than 5 individuals, otherwise the Fisher exact test was used. For each evaluation, 10,000 simulations were done using the Stata9 software package. We present estimates and 95% confidence limits of the absolute power loss. The 2-stage follow-up test can only reject a hypothesis when the 1-stage follow-up test also rejects the hypothesis. Therefore, we first estimate the proportion not rejected by the 2- stage followup test among those hypotheses rejected by the 1-stage follow-up test. To calculate the 95% CI for absolute power loss, we first calculate the 95% CI for the proportion of hypotheses rejected by the 1-stage follow-up test that are not rejected by the 2-stage follow-up test, then multiply the CI limits by the power of the 1-stage follow-up in order to reflect the absolute power loss rather than the power loss conditional on rejection of the 1-stage follow-up test. These confidence limits are slightly too narrow, as they are conditional on the observed number rejected by the 1-stage test, because under the condition, the observed number rejected by the 2-stage test is binomial. Table 12 Power estimation in a 1-stage and 2-stage follow-up strategy at risk Recessive model Additive model Dominant model Homo 1-stage 2-stage power 1-stage 2-stage power 1-stage 2-stage zygote Odds followuup (95%CI) up up (95%CI) up follow- loss follow- follow- loss follow- followup Ratio % 0.2% % 4.0% % 20.0% % 37.3% % 50.8% % 68.1% % 78.1% 0.0% ( ) 0.4% ( ) 1.3% ( ) 0.8% ( ) 0.0% 0.0% 0.6% 0.5% 3.5% 3.1% 13.9% 12.8% 0.0% ( ) 0.1% ( ) 0.4% ( ) 1.2% ( ) 0.5% 29.6% 28.1% 1.5% ( ) ( ) 0.3% ( ) 55.6% 54.7% 0.9% ( ) 0.3% ( ) 72.5% 72.1% 0.4% ( ) 0.2% 0.2% 4.9% 4.6% 19.6% 18.7% 36.6% 35.7% 50.0% 49.4% 66.0% 65.7% 73.6% 73.4% power loss (95%CI) 0.0% ( ) 0.4% ( ) 0.8% ( ) 0.9% ( ) 0.6% ( ) 0.3% ( ) 0.2% ( ) 17
22 % 82.8% % 88.7% % 91.5% 0.2% ( ) 0.1% ( ) 0.1% ( ) 83.0% 82.7% 93.8% 93.6% 96.9% 96.9% 0.3% ( ) 0.2% ( ) 0.1% ( ) 78.5% 78.3% 83.8% 83.7% 86.4% 86.3% 0.2% ( ) 0.1% ( ) 0.1% ( ) Thus, if the at risk homozygote genotypic odds ratio was 1.5, we estimate a loss of power of 0.5% or less under the 3 models shown. This represents the statistical cost of the 2-stage follow-up versus the 1-stage design follow-up. 18
23 References 1. Yeager, M. et al. Genome-wide association study of prostate cancer identifies a second risk locus at 8q24. Nat Genet 39, (2007). 2. Gohagan, J.K., Prorok, P.C., Hayes, R.B. & Kramer, B.S. The Prostate, Lung, Colorectal and Ovarian (PLCO) Cancer Screening Trial of the National Cancer Institute: history, organization, and status. Control Clin Trials 21, 251S-272S (2000). 3. Prorok, P.C. et al. Design of the Prostate, Lung, Colorectal and Ovarian (PLCO) Cancer Screening Trial. Control Clin Trials 21, 273S-309S (2000). 4. Hayes, R.B. et al. Methods for etiologic and early marker investigations in the PLCO trial. Mutat Res 592, (2005). 5. Chen, Y.C. et al. Sequence variants of Toll-like receptor 4 and susceptibility to prostate cancer. Cancer Res 65, (2005). 6. Group., T.A.C.P.S. The alpha-tocopherol, beta-carotene lung cancer prevention study: design, methods, participant characteristics, and compliance. Ann Epidemiol 4, 1-10 (1994). 7. Calle, E.E. et al. The American Cancer Society Cancer Prevention Study II Nutrition Cohort: rationale, study design, and baseline characteristics. Cancer 94, (2002). 8. Feigelson, H.S. et al. Determinants of DNA yield and quality from buccal cell samples collected with mouthwash. Cancer Epidemiol Biomarkers Prev 10, (2001). 9. Valeri, A. et al. Segregation analysis of prostate cancer in France: evidence for autosomal dominant inheritance and residual brother-brother dependence. Ann Hum Genet 67, (2003). 10. Chanock, S.J. et al. Replicating genotype-phenotype associations. Nature 447, (2007). 11. The International HapMap Project. Nature 426, (2003). 12. A haplotype map of the human genome. Nature 437, (2005). 13. Murabito, J.M. et al. A genome-wide association study of breast and prostate cancer in the NHLBI's Framingham Heart Study. BMC Med Genet 8 Suppl 1, S6 (2007). 14. Wigginton, J.E., Cutler, D.J. & Abecasis, G.R. A note on exact tests of Hardy- Weinberg equilibrium. Am J Hum Genet 76, (2005). 15. Pritchard, J.K., Stephens, M. & Donnelly, P. Inference of population structure using multilocus genotype data. Genetics 155, (2000). 16. Price, A.L. et al. Principal components analysis corrects for stratification in genome-wide association studies. Nat Genet 38, (2006). 17. Agresti, A. Categorical Data Analysis, (John Wiley & Sons, Inc., New York, 1990). 18. Margolin, B.H. Test for Trend in Proportions. in Encyclopedia of Statistical Sciences, Vol. 9 (eds. Klotz, S. & Johnson, N.L.) (John Wiley & Sons, Inc., New York, 1988). 19
24 Thomas et al. Supplementary Table 1. Definition of Regions for 194 SNPs from the Combined Analysis with p < 10-3 Rank a Locus b p c Alleles d MAF Chr Location e Neighborhood f region # g 194 rs T,C rs G,A DHCR rs A,G GPR rs E-05 A,G NTNG rs E-05 C,T LOC rs C,T rs G,A PRRX rs E-05 G,A SOX rs C,T SOX rs G,A RAB3GAP2,AURKAPS rs A,G rs C,T rs G,A SLC35F rs C,T RGS rs G,A WDR rs C,T TGIF2P1,ADSS rs C,T GDF7,C2orf rs E-05 G,T PLEKHH rs A,G PLEKHH2,DYNC2LI rs C,T rs A,G rs G,A B3GNT rs T,C LOC rs T,C rs T,C PARD3B rs C,A rs C,T FBLN rs G,A OSBPL rs T,G OSBPL rs T,C MAGI rs T,C rs G,A EEFSEC rs T,C SH3BP rs C,A rs A,C KCNIP rs C,T rs C,T rs G,A TIGD rs G,A rs E-05 A,G GRID rs C,T rs T,C rs G,T rs A,G rs T,C rs C,A rs T,C rs T,G rs C,A ARL rs A,C LOC rs C,T TMEM rs C,T rs A,G F2R rs A,G rs E-05 A,G rs G,A rs C,T LOC442141,CCDC rs T,G rs C,A rs C,T rs C,T ODZ rs G,A KCNIP rs T,C LOC rs T,C GMPR,ATXN rs C,T
25 123 rs A,G rs T,C rs T,G rs G,T rs G,A FRMD rs A,G NXPH rs G,A LOC rs E-06 G,A JAZF rs A,G CREB rs C,T AUTS rs T,C rs A,G IRF5,TNPO rs T,C rs G,A RP1L rs E-05 G,T rs C,T LOC rs C,T SULF rs G,A CPNE rs T,C CPNE rs C,T CPNE3,CNGB rs C,T rs A,G STK rs G,A EXT rs A,G COLEC rs E-12 G,T q24 centromeric rs E-08 T,C q24 centromeric rs E-08 G,A q24 centromeric rs E-08 G,A q24 centromeric rs E-05 G,A q24 centromeric rs E-05 G,A q24 centromeric rs A,G q24 centromeric 85 1 rs E-19 G,A q24 telomeric 86 2 rs E-18 A,C q24 telomeric 86 3 rs E-17 C,A q24 telomeric 86 4 rs E-17 G,T q24 telomeric 86 5 rs E-16 A,G q24 telomeric 86 6 rs E-13 A,C q24 telomeric 86 7 rs E-13 A,G q24 telomeric rs E-06 G,A q24 telomeric rs E-06 G,C q24 telomeric rs E-06 A,G q24 telomeric rs E-06 A,C q24 telomeric rs E-05 A,G q24 telomeric rs E-05 C,T q24 telomeric rs E-05 A,T q24 telomeric rs C,T q24 telomeric rs T,C q24 telomeric rs T,C rs G,A DMRT1,DMRT rs A,G DAPK rs G,A LOC rs C,T LOC rs A,G rs E-05 G,A HMCN rs A,G C10orf rs T,G PTPLA rs A,C PTPLA,STAM rs G,A PTPLA rs T,C rs E-13 C,T MSMB rs E-08 C,T MSMB rs G,A rs E-05 T,C rs G,A SORCS rs G,A rs C,T rs E-07 T,C ZRANB rs E-06 A,G ZRANB rs E-06 T,C CTBP rs E-06 T,C CTBP rs E-05 C,T CTBP rs C,T CTBP2 102
26 98 rs A,G GALNTL rs T,C GALNTL rs G,A GALNTL rs G,A GALNTL rs T,C GALNTL rs C,T rs E-05 G,A rs G,A rs E-09 G,A rs C,T EFCAB4B,FLJ rs C,T LOC283392,TRHDE rs A,C rs G,A RIMBP rs A,G HTR2A rs T,G rs G,A TBC1D rs C,T ABCC rs C,T rs G,A rs C,T rs T,C rs T,C rs C,T RIN rs C,A LOC rs A,C RYR rs E-05 G,A IL rs C,T rs G,A IL4R rs C,T ZFHX rs C,T rs E-05 G,A CDH rs G,T rs T,C DKFZp434O rs A,G ABR rs A,G rs E-05 G,A HNF1B rs E-10 A,G HNF1B rs E-09 C,T HNF1B rs T,C PDK rs G,A ADCYAP rs G,A DCC rs E-05 A,G rs A,C rs T,C CD rs C,T PPP1R14A,SPINT rs E-05 G,A RASGRP4,RYR rs A,G RYR rs G,A RYR rs T,C rs E-05 A,G PLA2G4C rs G,A BIRC8,LOC rs G,A TRIB rs C,T rs G,A RIN rs A,G SIM rs A,C DSCR rs G,A a Rank p-value based on the combined trichotomous analysis (Supplementary Table 1) b dbsnp ID ( c p-value based on the combined trichotomous analysis (Supplementary Table 1) d Major/minor allele in combined trichotomous analysis (Supplementary Table 1) e Chromosomal coordinate based on Human genome build 35. f Relative to SNP position, gene(s) located within 20kb of their transcription start site or 10kb from its last exon; SNPs at 8q24 are also indicated. g regions arbitrarily defined by SNPs within 100kb
Bi156 Lecture 1/13/12. Dog Genetics
 Bi156 Lecture 1/13/12 Dog Genetics The radiation of the family Canidae occurred about 100 million years ago. Dogs are most closely related to wolves, from which they diverged through domestication about
Biochemical HA T FT AD Iceland (1,2) Cohort IM Clinical HA. 10 follicles 2 10 mm or > 10 cc volume. > 63 ng/dl NA >3.8 ng/ml. menses/yr.
 Cohort IM Clinical HA. 10 follicles 2 10 mm or > 10 cc volume. > 63 ng/dl NA >3.8 ng/ml. menses/yr.") Supplementary Table 1: Defining clinical, biochemical and ultrasound criteria of women with PCOS in contributing cohorts. Abbreviations: IM irregular menses; HA hyperandrogenism; PCOM polycystic ovary
Supplementary Table 1: Defining clinical, biochemical and ultrasound criteria of women with PCOS in contributing cohorts. Abbreviations: IM irregular menses; HA hyperandrogenism; PCOM polycystic ovary
Comparative Evaluation of Online and Paper & Pencil Forms for the Iowa Assessments ITP Research Series
 Comparative Evaluation of Online and Paper & Pencil Forms for the Iowa Assessments ITP Research Series Catherine J. Welch Stephen B. Dunbar Heather Rickels Keyu Chen ITP Research Series 2014.2 A Comparative
EVOLUTIONARY GENETICS (Genome 453) Midterm Exam Name KEY
 Midterm Exam Name KEY") PLEASE: Put your name on every page and SHOW YOUR WORK. Also, lots of space is provided, but you do not have to fill it all! Note that the details of these problems are fictional, for exam purposes only.
PLEASE: Put your name on every page and SHOW YOUR WORK. Also, lots of space is provided, but you do not have to fill it all! Note that the details of these problems are fictional, for exam purposes only.
Biology 2108 Laboratory Exercises: Variation in Natural Systems. LABORATORY 2 Evolution: Genetic Variation within Species
 Biology 2108 Laboratory Exercises: Variation in Natural Systems Ed Bostick Don Davis Marcus C. Davis Joe Dirnberger Bill Ensign Ben Golden Lynelle Golden Paula Jackson Ron Matson R.C. Paul Pam Rhyne Gail
Clarifications to the genetic differentiation of German Shepherds
 Clarifications to the genetic differentiation of German Shepherds Our short research report on the genetic differentiation of different breeding lines in German Shepherds has stimulated a lot interest
Biology 164 Laboratory
 Biology 164 Laboratory CATLAB: Computer Model for Inheritance of Coat and Tail Characteristics in Domestic Cats (Based on simulation developed by Judith Kinnear, University of Sydney, NSW, Australia) Introduction
AKC Canine Health Foundation Grant Updates: Research Currently Being Sponsored By The Vizsla Club of America Welfare Foundation
 AKC Canine Health Foundation Grant Updates: Research Currently Being Sponsored By The Vizsla Club of America Welfare Foundation GRANT PROGRESS REPORT REVIEW Grant: 00748: SNP Association Mapping for Canine
2013 Holiday Lectures on Science Medicine in the Genomic Era
 INTRODUCTION Figure 1. Tasha. Scientists sequenced the first canine genome using DNA from a boxer named Tasha. Meet Tasha, a boxer dog (Figure 1). In 2005, scientists obtained the first complete dog genome
Worksheet for Morgan/Carter Laboratory #9 Mendelian Genetics II: Drosophila
 Worksheet for Morgan/Carter Laboratory #9 Mendelian Genetics II: Drosophila Ex. 9-1: ESTABLISHING THE ENZYME REACTION CONTROLS Propose a hypothesis about AO activity in flies from vial 1a and flies from
Bayesian Analysis of Population Mixture and Admixture
 Bayesian Analysis of Population Mixture and Admixture Eric C. Anderson Interdisciplinary Program in Quantitative Ecology and Resource Management University of Washington, Seattle, WA, USA Jonathan K. Pritchard
Building Rapid Interventions to reduce antimicrobial resistance and overprescribing of antibiotics (BRIT)
") Greater Manchester Connected Health City (GM CHC) Building Rapid Interventions to reduce antimicrobial resistance and overprescribing of antibiotics (BRIT) BRIT Dashboard Manual Users: General Practitioners
Greater Manchester Connected Health City (GM CHC) Building Rapid Interventions to reduce antimicrobial resistance and overprescribing of antibiotics (BRIT) BRIT Dashboard Manual Users: General Practitioners
PROGRESS REPORT for COOPERATIVE BOBCAT RESEARCH PROJECT. Period Covered: 1 April 30 June Prepared by
 PROGRESS REPORT for COOPERATIVE BOBCAT RESEARCH PROJECT Period Covered: 1 April 30 June 2014 Prepared by John A. Litvaitis, Tyler Mahard, Rory Carroll, and Marian K. Litvaitis Department of Natural Resources
husband P, R, or?: _? P P R P_ (a). What is the genotype of the female in generation 2. Show the arrangement of alleles on the X- chromosomes below.
. What is the genotype of the female in generation 2. Show the arrangement of alleles on the X- chromosomes below.") IDTER EXA 1 100 points total (6 questions) Problem 1. (20 points) In this pedigree, colorblindness is represented by horizontal hatching, and is determined by an X-linked recessive gene (g); the dominant
IDTER EXA 1 100 points total (6 questions) Problem 1. (20 points) In this pedigree, colorblindness is represented by horizontal hatching, and is determined by an X-linked recessive gene (g); the dominant
Jerry and I am a NGS addict
 Introduction Identification and Management of Loss of Function Alleles Impacting Fertility L1 Dominette 01449 Jerry and I am a NGS addict Jerry Taylor taylorjerr@missouri.edu University of Missouri 2014
Fruit Fly Exercise 2 - Level 2
 Fruit Fly Exercise 2 - Level 2 Description of In this exercise you will use, a software tool that simulates mating experiments, to analyze the nature and mode of inheritance of specific genetic traits.
Manhattan and quantile-quantile plots (with inflation factors, λ) for across-breed disease phenotypes A) CCLD B)
 for across-breed disease phenotypes A) CCLD B)") Supplementary Figure 1: Non-significant disease GWAS results. Manhattan and quantile-quantile plots (with inflation factors, λ) for across-breed disease phenotypes A) CCLD B) lymphoma C) PSVA D) MCT E)
Supplementary Figure 1: Non-significant disease GWAS results. Manhattan and quantile-quantile plots (with inflation factors, λ) for across-breed disease phenotypes A) CCLD B) lymphoma C) PSVA D) MCT E)
Inheritance of Livershunt in Irish Wolfhounds By Maura Lyons PhD
 Inheritance of Livershunt in Irish Wolfhounds By Maura Lyons PhD Glossary Gene = A piece of DNA that provides the 'recipe' for an enzyme or a protein. Gene locus = The position of a gene on a chromosome.
17 th Club Phase 1 Annual Meeting April 5, Pierre Maison-Blanche Hopital Bichat, Paris, France
 Practical Issues for the clinical evaluation of QT/QTc interval prolongation 17 th Club Phase 1 Annual Meeting April 5, 2018 Pierre Maison-Blanche Hopital Bichat, Paris, France Disclosure Chiesi Pharmaceuticals
Determining the Inheritance Patterns of Purple Eye, Lobe Eye, and Yellow Body Traits of. Drosophilia Flies. Introduction
 Karen Jacques and Audrey Puleio Mrs. Lajoie Honors Biology April 30, 2012 Determining the Inheritance Patterns of Purple Eye, Lobe Eye, and Yellow Body Traits of Drosophilia Flies Introduction This experiment
Patterns of heredity can be predicted.
 Page of 6 KEY CONCEPT Patterns of heredity can be predicted. BEFORE, you learned Genes are passed from parents to offspring Offspring inherit genes in predictable patterns NOW, you will learn How Punnett
Muppet Genetics Lab. Due: Introduction
 Name: Block: Muppet Genetics Lab Due: _ Introduction Much is known about the genetics of Sesamus muppetis. Karyotyping reveals that Sesame Street characters have eight chromosomes: three homologous pairs
Questions About the PLN Research
 Questions About the PLN Research Dr. Meryl Littman and Dr. Paula Henthorn, University of Pennsylvania School of Veterinary Medicine very kindly answered these questions for us. We want to thank them for
Genome 371; A 03 Berg/Brewer Practice Exam I; Wednesday, Oct 15, PRACTICE EXAM GENOME 371 Autumn 2003
 PRACTICE EXAM GENOME 371 Autumn 2003 These questions were part of the first exam from Autumn 2002. Take the exam in a quiet place and only when you are sure you will have time to complete the exam uninterrupted.
A Genetic Comparison of Standard and Miniature Poodles based on autosomal markers and DLA class II haplotypes.
 A Genetic Comparison of Standard and Miniature Poodles based on autosomal markers and DLA class II haplotypes. Niels C. Pedersen, 1 Lorna J. Kennedy 2 1 Center for Companion Animal Health, School of Veterinary
Part One: Introduction to Pedigree teaches students how to use Pedigree tools to create and analyze pedigrees.
 Genetics Monohybrid Teacher s Guide 1.0 Summary The Monohybrid activity is the fifth core activity to be completed after Mutations. This activity contains four sections and the suggested time to complete
Understandings, Applications and Skills (This is what you maybe assessed on)
") 3. Genetics 3.4 Inheritance Name: Understandings, Applications and Skills (This is what you maybe assessed on) Statement Guidance 3.4.U1 3.4.U2 3.4.U3 3.4.U4 3.4.U5 3.4.U6 3.4.U7 3.4.U8 3.4.U9 Mendel discovered
3. Genetics 3.4 Inheritance Name: Understandings, Applications and Skills (This is what you maybe assessed on) Statement Guidance 3.4.U1 3.4.U2 3.4.U3 3.4.U4 3.4.U5 3.4.U6 3.4.U7 3.4.U8 3.4.U9 Mendel discovered
Period of study: 12 Nov 2002 to 08 Apr 2004 (first subject s first visit to last subject s last visit)
") Study Synopsis This file is posted on the Bayer HealthCare Clinical Trials Registry and Results website and is provided for patients and healthcare professionals to increase the transparency of Bayer's
Study Synopsis This file is posted on the Bayer HealthCare Clinical Trials Registry and Results website and is provided for patients and healthcare professionals to increase the transparency of Bayer's
Online Heredity Lab. 5. Explain how a trait can disappear and then reappear in later generations.
 Name: Online Heredity Lab Period Mendel and his Peas Mendel Animation 1. What fundamental questions did Mendel try to answer? 2. What does Homozygous mean? 3. What is a Gamete? 4. What is a Phenotype?
Faculty of Agricultural and Nutritional Science
 Faculty of Agricultural and Nutritional Science Christian-Albrechts-University Kiel Institute of Animal Breeding and Husbandry Genome-wide association studies for production traits in pooled pig FF 2 designs
Mendelian Genetics Using Drosophila melanogaster Biology 12, Investigation 1
 Mendelian Genetics Using Drosophila melanogaster Biology 12, Investigation 1 Learning the rules of inheritance is at the core of all biologists training. These rules allow geneticists to predict the patterns
Miniature Schnauzer Annual Breed Health Report 2016
 Miniature Schnauzer Annual Breed Health Report 2016 This form should be completed by your Breed Health Co-ordinator and submitted via email to the Kennel Club s Health Team (email address tbc). Section
Question 3 (30 points)
") Question 3 (30 points) You hope to use your hard-won 7.014 knowledge to make some extra cash over the summer, so you adopt two Chinchillas to start a Chinchilla breeding business. Your Chinchillas are
Question 3 (30 points) You hope to use your hard-won 7.014 knowledge to make some extra cash over the summer, so you adopt two Chinchillas to start a Chinchilla breeding business. Your Chinchillas are
Virtual Genetics Lab (VGL)
") Virtual Genetics Lab (VGL) Experimental Objective I. To use your knowledge of genetics to design and interpret crosses to figure out which allele of a gene has a dominant phenotype and which has a recessive
Virtual Genetics Lab (VGL) Experimental Objective I. To use your knowledge of genetics to design and interpret crosses to figure out which allele of a gene has a dominant phenotype and which has a recessive
Comments on the Ridge Gene, by Clayton Heathcock; February 15, 2008
 Comments on the Ridge Gene, by Clayton Heathcock; February 15, 2008 Note: This article originally appeared in the March 2008 issue of "The Ridgeback", the official publication of the Rhodesian Ridgeback
BioSci 110, Fall 08 Exam 2
 1. is the cell division process that results in the production of a. mitosis; 2 gametes b. meiosis; 2 gametes c. meiosis; 2 somatic (body) cells d. mitosis; 4 somatic (body) cells e. *meiosis; 4 gametes
STAT170 Exam Preparation Workshop Semester
 Study Information STAT Exam Preparation Workshop Semester Our sample is a randomly selected group of American adults. They were measured on a number of physical characteristics (some measurements were
Lesson Overview. Human Chromosomes. Lesson Overview Human Chromosomes
 Lesson Overview 14.1 Genome a full set of all the genetic information that an organism carries in its DNA. Karyotypes Karyotype a picture that shows the complete diploid set of human chromosomes, They
Molecular characterization of CMO. A canine model of the Caffey syndrome, a human rare bone disease
 Molecular characterization of CMO A canine model of the Caffey syndrome, a human rare bone disease (Report summarised by Dr P. Bamas) Abstract Dog CMO disease (Cranio Mandibular Osteopathy) is a clinical
Mastitis in ewes: towards development of a prevention and treatment plan
 SCHOOL OF LIFE SCIENCES, UNIVERSITY OF WARWICK Mastitis in ewes: towards development of a prevention and treatment plan Final Report Selene Huntley and Laura Green 1 Background to Project Mastitis is inflammation
Population characteristics and neuter status of cats living in households in the United States
 Population characteristics and neuter status of cats living in households in the United States Karyen Chu, phd; Wendy M. Anderson, jd; Micha Y. Rieser, ma SMALL ANIMALS/ Objective To gather data on cats
Hypotheses: Biology 105 Human Biology
 Student ID#: 1 2 3 4 5 6 Student Name: Ophelia Dominguez Team Name: WANNA BEE s Lab Assignment #: Lab #2 Lab Title: Personal Genetic Profile Date: 2014-02-22 Purpose / Objective(s): Profile common genetic
SCIENTIFIC REPORT. Analysis of the baseline survey on the prevalence of Salmonella in turkey flocks, in the EU,
 The EFSA Journal / EFSA Scientific Report (28) 198, 1-224 SCIENTIFIC REPORT Analysis of the baseline survey on the prevalence of Salmonella in turkey flocks, in the EU, 26-27 Part B: factors related to
PLEASE PUT YOUR NAME ON ALL PAGES, SINCE THEY WILL BE SEPARATED DURING GRADING.
 MIDTERM EXAM 1 100 points total (6 questions) 8 pages PLEASE PUT YOUR NAME ON ALL PAGES, SINCE THEY WILL BE SEPARATED DURING GRADING. PLEASE NOTE: YOU MUST ANSWER QUESTIONS 1-4 AND EITHER QUESTION 5 OR
VIZSLA EPILEPSY RESEARCH PROJECT General Information
 General Information INTRODUCTION In March 1999, the AKC Canine Health Foundation awarded a grant to researchers at the University of Minnesota College of Veterinary Medicine to study the molecular genetics
Cytogenetic Investigation of Canine Soft Tissue Sarcomas. and Histiocytic Malignancies INFORMED CONSENT FOR PARTICIPANTS GOLDEN RETRIEVER
 Cytogenetic Investigation of Canine Soft Tissue Sarcomas and Histiocytic Malignancies Matthew Breen PhD., FSB. - Principal Investigator NCSU College of Veterinary Medicine INFORMED CONSENT FOR PARTICIPANTS
Cow Exercise 1 Answer Key
 Name Cow Exercise 1 Key Goal In this exercise, you will use StarGenetics, a software tool that simulates mating experiments, to analyze the nature and mode of inheritance of specific genetic traits. Learning
Karyotypes Pedigrees Sex-Linked Traits Genetic Disorders
 Karyotypes Pedigrees Sex-Linked Traits Genetic Disorders Consists of 23 pairs of chromosomes. Images are taken from diploid cells during mitosis. Chromosomes 1 through 22 are called autosomes. The X and
Answers to Questions about Smarter Balanced 2017 Test Results. March 27, 2018
 Answers to Questions about Smarter Balanced Test Results March 27, 2018 Smarter Balanced Assessment Consortium, 2018 Table of Contents Table of Contents...1 Background...2 Jurisdictions included in Studies...2
GENETIC DRIFT Carol Beuchat PhD ( 2013)
") GENETIC DRIFT Carol Beuchat PhD ( 2013) By now you should be very comfortable with the notion that for every gene location - a locus - an animal has two alleles, one that came from the sire and one from
GENETIC DRIFT Carol Beuchat PhD ( 2013) By now you should be very comfortable with the notion that for every gene location - a locus - an animal has two alleles, one that came from the sire and one from
Lesson Overview. Human Chromosomes. Lesson Overview Human Chromosomes
 Lesson Overview 14.1 Karyotypes To find what makes us uniquely human, we have to explore the human genome. A genome is the full set of genetic information that an organism carries in its DNA. A study of
Surveillance. Mariano Ramos Chargé de Mission OIE Programmes Department
 Mariano Ramos Chargé de Mission OIE Programmes Department Surveillance Regional Table Top Exercise for Countries of Middle East and North Africa Tunisia; 11 13 July 2017 Agenda Key definitions and criteria
Pre-AP Biology Tuesday February 20. Introduction to Pedigrees
 Pre-AP Biology Tuesday February 20 Introduction to Pedigrees If you were absent: 1. See slides 3 7 for review question/answers 2. See slides 9 11 for background on how to read pedigrees 3. Try practice
SBI3U: Exploring Modes of Inheritance. Purpose
 SBI3U: Exploring Modes of Inheritance Assigned: Purpose Name: Due: To master understanding of various modes of inheritance by creating original creatures with various traits that are passed on by each
1/27/10 More complications to Mendel
 1/27/10 More complications to Mendel Required Reading: The Interpretation of Genes Natural History 10/02 pg. 52-58 http://fire.biol.wwu.edu/trent/trent/interpretationofgenes.pdf NOTE: In this and subsequent
COMPARING DNA SEQUENCES TO UNDERSTAND EVOLUTIONARY RELATIONSHIPS WITH BLAST
 COMPARING DNA SEQUENCES TO UNDERSTAND EVOLUTIONARY RELATIONSHIPS WITH BLAST In this laboratory investigation, you will use BLAST to compare several genes, and then use the information to construct a cladogram.
The Human Genome. Chapter 14 Human Heredity Human Chromosomes. Factors to Consider in Pedigrees. Pedigree. Sex Chromosomes and Autosomes
 Sex Chromosomes and Autosomes The Human Genome Chapter 14 Human Heredity Human Chromosomes Two of the 46 chromosomes in humans are known as the sex chromosomes. X Chromosome Y Chromosome The remaining
TE 408: Three-day Lesson Plan
 TE 408: Three-day Lesson Plan Partner: Anthony Machniak School: Okemos High School Date: 3/17/2014 Name: Theodore Baker Mentor Teacher: Danielle Tandoc Class and grade level: 9-10th grade Biology Part
Evolution in dogs. Megan Elmore CS374 11/16/2010. (thanks to Dan Newburger for many slides' content)
") Evolution in dogs Megan Elmore CS374 11/16/2010 (thanks to Dan Newburger for many slides' content) Papers for today Vonholdt BM et al (2010). Genome-wide SNP and haplotype analyses reveal a rich history
Evolution in dogs Megan Elmore CS374 11/16/2010 (thanks to Dan Newburger for many slides' content) Papers for today Vonholdt BM et al (2010). Genome-wide SNP and haplotype analyses reveal a rich history
ESTIMATING NEST SUCCESS: WHEN MAYFIELD WINS DOUGLAS H. JOHNSON AND TERRY L. SHAFFER
 ESTIMATING NEST SUCCESS: WHEN MAYFIELD WINS DOUGLAS H. JOHNSON AND TERRY L. SHAFFER U.S. Fish and Wildlife Service, Northern Prairie Wildlife Research Center, Jamestown, North Dakota 58402 USA ABSTRACT.--The
17 Inherited change Exam-style questions. AQA Biology
 1 Two genes in a mouse interact to control three possible coat colours: grey, black and brown. The two genes are located on separate chromosomes. Each gene has two alleles: A is dominant to a and B is
Adjustment Factors in NSIP 1
 Adjustment Factors in NSIP 1 David Notter and Daniel Brown Summary Multiplicative adjustment factors for effects of type of birth and rearing on weaning and postweaning lamb weights were systematically
Epigenetic regulation of Plasmodium falciparum clonally. variant gene expression during development in An. gambiae
 Epigenetic regulation of Plasmodium falciparum clonally variant gene expression during development in An. gambiae Elena Gómez-Díaz, Rakiswendé S. Yerbanga, Thierry Lefèvre, Anna Cohuet, M. Jordan Rowley,
Heather J. Huson Bridgett M. vonholdt Maud Rimbault Alexandra M. Byers Jonathan A. Runstadler Heidi G. Parker Elaine A. Ostrander
 Mamm Genome (2012) 23:178 194 DOI 10.1007/s00335-011-9374-y ORIGINAL CONTRIBUTION Breed-specific ancestry studies and genome-wide association analysis highlight an association between the MYH9 gene and
Name: Period: Student Exploration: Mouse Genetics (One Trait)
") Directions: 1) Go to Explorelearning.com; 2) Login using your assigned user name and password. USER NAME: 1C772 PASSWORD: RAIN515 3) Find the MOUSE GENETICS ONE TRAIT Gizmo and click Launch Gizmo Name:
Directions: 1) Go to Explorelearning.com; 2) Login using your assigned user name and password. USER NAME: 1C772 PASSWORD: RAIN515 3) Find the MOUSE GENETICS ONE TRAIT Gizmo and click Launch Gizmo Name:
7.013 Spring 2005 Problem Set 2
 MIT Department of Biology 7.013: Introductory Biology - Spring 2005 Instructors: Professor Hazel Sive, Professor Tyler Jacks, Dr. Claudette Gardel NAME TA 7.013 Spring 2005 Problem Set 2 FRIDAY February
Results for: HABIBI 30 MARCH 2017
 Results for: 30 MARCH 2017 INSIDE THIS REPORT We have successfully processed the blood sample for Habibi and summarized our findings in this report. Inside, you will find information about your dog s specific
Indigo Sapphire Bear. Newfoundland. Indigo Sapphire Bear. January. Dog's name: DR. NEALE FRETWELL. R&D Director
 Indigo Sapphire Bear Dog's name: Indigo Sapphire Bear This certifies the authenticity of Indigo Sapphire Bear's canine genetic background as determined following careful analysis of more than 300 genetic
Effective Vaccine Management Initiative
 Effective Vaccine Management Initiative Background Version v1.7 Sep.2010 Effective Vaccine Management Initiative EVM setting a standard for the vaccine supply chain Contents 1. Background...3 2. VMA and
Genetics Lab #4: Review of Mendelian Genetics
 Genetics Lab #4: Review of Mendelian Genetics Objectives In today s lab you will explore some of the simpler principles of Mendelian genetics using a computer program called CATLAB. By the end of this
Economically important trait. Increased demand: Decreased supply. Sheep milk cheese. 2007: $2.9 million for milk production (Shiflett, 2008)
") Genetic Markers for Milk Production Raluca Mateescu, OklahomaStateUniversity Michael Thonney, Cornell University Milk production & Sheep Industry Economically important trait 2007: $2.9 million for milk
Genetic Markers for Milk Production Raluca Mateescu, OklahomaStateUniversity Michael Thonney, Cornell University Milk production & Sheep Industry Economically important trait 2007: $2.9 million for milk
Genome-wide Association and Haplotype-based Association. Mapping of Mastitis in Lacaune Sheep
 European Master in Animal Breeding and Genetics (EM-ABG) Genome-wide Association and Haplotype-based Association Mapping of Mastitis in Lacaune Sheep Student: Bingjie Li Supervisors: Rachel Rupp Dag Inge
In the first half of the 20th century, Dr. Guido Fanconi published detailed clinical descriptions of several heritable human diseases.
 In the first half of the 20th century, Dr. Guido Fanconi published detailed clinical descriptions of several heritable human diseases. Two disease syndromes were named after him: Fanconi Anemia and Fanconi
Council on Dairy Cattle Breeding Genomic evaluations including crossbred animals. Ezequiel L. Nicolazzi and George Wiggans March 15 th, CDCB Webinar
 Council on Dairy Cattle Breeding Genomic evaluations including crossbred animals Ezequiel L. Nicolazzi and George Wiggans March 15 th, CDCB Webinar Credits For AGIL-USDA: Mel Tooker and Paul VanRaden (all
Genetics Lab #4: Review of Mendelian Genetics
 Genetics Lab #4: Review of Mendelian Genetics Objectives In today s lab you will explore some of the simpler principles of Mendelian genetics using a computer program called CATLAB. By the end of this
+ Karyotypes. Does it look like this in the cell?
 + Human Heredity + Karyotypes A genome is the full set of genetic information that an organism carries in its DNA. Karyotype: Shows the complete diploid set of chromosomes grouped together in pairs, arranged
SNP genotypes of olfactory receptor genes associated with olfactory ability in German Shepherd dogs
 SHORT COMMUNICATION doi: 10.1111/age.12389 SNP genotypes of olfactory receptor genes associated with olfactory ability in German Shepherd dogs M. Yang*, G.-J. Geng, W. Zhang, L. Cui, H.-X. Zhang and J.-L.
Today: Mendel s Technique: What Mendel Observes: Mendelian Genetics: Consider this. Mendelian Genetics and Problems (In-Class 6)
") Today: Mendelian Genetics and Problems (In-Class 6) Mendelian Genetics: Consider this. 8 million possible chromosome combinations in each egg, and each sperm = >70 trillion possibilities! How are we able
Today: Mendelian Genetics and Problems (In-Class 6) Mendelian Genetics: Consider this. 8 million possible chromosome combinations in each egg, and each sperm = >70 trillion possibilities! How are we able
Linked genetic variants on chromosome 10 control ear morphology and body mass among dog breeds
 Webster et al. BMC Genomics (2015) 16:474 DOI 10.1186/s12864-015-1702-2 RESEARCH ARTICLE Open Access Linked genetic variants on chromosome 10 control ear morphology and body mass among dog breeds Matthew
Naked Bunny Evolution
 Naked Bunny Evolution In this activity, you will examine natural selection in a small population of wild rabbits. Evolution, on a genetic level, is a change in the frequency of alleles in a population
MULTIPLE CHOICE QUESTIONS
 MULTIPLE CHOICE QUESTIONS 1. Mendel verified true-breeding pea plants for certain traits before undertaking his experiments. The term true-breeding refers to: A. genetically pure lines. B. organisms that
TECHNICAL BULLETIN Claude Toudic Broiler Specialist June 2006
 Evaluating uniformity in broilers factors affecting variation During a technical visit to a broiler farm the topic of uniformity is generally assessed visually and subjectively, as to do the job properly
Name: Block: Date: Packet #12 Unit 6: Heredity
 Name: Block: Date: Packet #12 Unit 6: Heredity Objectives: By the conclusion of this unit, you should be able to: Topic 1: Simple Heredity 1. Define and relate the following terms: self-fertilization,
Supplemental Information. A Deletion in the Canine POMC Gene. Is Associated with Weight and Appetite. in Obesity-Prone Labrador Retriever Dogs
 Cell Metabolism, Volume 23 Supplemental Information A Deletion in the Canine POMC Gene Is Associated with Weight and Appetite in Obesity-Prone Labrador Retriever Dogs Eleanor Raffan, Rowena J. Dennis,
Page 1 of 7. Name: A. Preliminary Assessment #3. You may need a calculator for numbers 2&3.
 Page 1 of 7 Name: 03-121-A Preliminary Assessment #3 You may need a calculator for numbers 2&3. You may bring one 3 inch by 5 inch card or paper with anything handwritten on it (front and back). You have
Required and Recommended Supporting Information for IUCN Red List Assessments
 Required and Recommended Supporting Information for IUCN Red List Assessments This is Annex 1 of the Rules of Procedure for IUCN Red List Assessments 2017 2020 as approved by the IUCN SSC Steering Committee
COMPARING DNA SEQUENCES TO UNDERSTAND EVOLUTIONARY RELATIONSHIPS WITH BLAST
 Big Idea 1 Evolution INVESTIGATION 3 COMPARING DNA SEQUENCES TO UNDERSTAND EVOLUTIONARY RELATIONSHIPS WITH BLAST How can bioinformatics be used as a tool to determine evolutionary relationships and to
What would explain the clinical incidence of PSS being lower than the presumed percentage of carriers should be producing?
 Many of the data sources seem to have a HUGE margin of error (e.g., mean age of 7.26 +/- 3.3 years). Is that a bad thing? How does this impact drawing conclusions from this data? What would need to be
Reintroducing bettongs to the ACT: issues relating to genetic diversity and population dynamics The guest speaker at NPA s November meeting was April
 Reintroducing bettongs to the ACT: issues relating to genetic diversity and population dynamics The guest speaker at NPA s November meeting was April Suen, holder of NPA s 2015 scholarship for honours
Biology 120 Lab Exam 2 Review
 Biology 120 Lab Exam 2 Review Student Learning Services and Biology 120 Peer Mentors Sunday, November 26 th, 2017 4:00 pm Arts 263 Important note: This review was written by your Biology Peer Mentors (not
Bell Ringer. Which features do you have that match your mother? Your father? Which of the following features do you have?
 Bell Ringer Which features do you have that match your mother? Your father? Which of the following features do you have? Widow s Peak? Ability to roll your tongue? Attached earlobes? Simple Genetics Exploring
Trends in exposure of veterinarians to physical and chemical hazards and use of
 Trends in exposure of veterinarians to physical and chemical hazards and use of protection practices Lin Fritschi 1 Adeleh Shirangi 2 Ian D Robertson 3 Lesley M Day 4 1. Laboratory for Cancer Medicine,
Genes What are they good for? STUDENT HANDOUT. Module 4
 Genes What are they good for? Module 4 Genetics for Kids: Module 4 Genes What are they good for? Part I: Introduction Genes are sequences of DNA that contain instructions that determine the physical traits
Furry Family Genetics
 Furry Family Genetics Name: Period: Directions: Log on to http://vital.cs.ohiou.edu/steamwebsite/downloads/furryfamily.swf and complete your Furry Family. In the tables provided, list the genotypes and
Science 10-Biology Activity 17 Worksheet on More Complex Genetics
 Science 10-Biology Activity 17 Worksheet on More Complex Genetics 10 Name Due Date Show Me Hand In Correct and Hand In Again By NOTE: This worksheet is based on material from pages 398-404 in Science Probe.
STEPHEN N. WHITE, PH.D.,
 June 2018 The goal of the American Sheep Industry Association and the U.S. sheep industry is to eradicate scrapie from our borders. In addition, it is ASI s objective to have the United States recognized
CROSSOVER PROBLEMS. 4.The crossover percentage between genes O and J is 10%, N and M is 11%, J and N is 20%, O and M is 41%.
 CROSSOVER PROBLEMS 1. In a study of crossovers the following map distances were determined: gene G to L = 34 map units, gene L to X = 9 map units, and gene X to gene G = 43 map units. Draw the chromosomes
Biology 120 Structured Study Session Lab Exam 2 Review
 Biology 120 Structured Study Session Lab Exam 2 Review *revised version Student Learning Services and Biology 120 Peer Mentors Friday, March 23 rd, 2018 5:30 pm Arts 263 Important note: This review was
TOPIC 8: PUNNETT SQUARES
 Page 1 TOPIC 8: PUNNETT SQUARES PUNNETT SQUARES 8.1: Definition A Punnett square is a device to help you predict the possible genotypes of the offspring if you know the genotypes of the parents. Because
Dogs and cats are enormously popular as companion
 Search and identification methods that owners use to find a lost dog Linda K. Lord, dvm, phd; Thomas E. Wittum, phd; Amy K. Ferketich, phd; Julie A. Funk, dvm, phd; Päivi J. Rajala-Schultz, dvm, phd SMALL