DEVELOPING A PROTOTYPE WELFARE ASSESSMENT PROTOCOL FOR HORSES AND DONKEYS
|
|
|
- Lesley Lewis
- 5 years ago
- Views:
Transcription


1 SCUOLA DI DOTTORATO IN SANITÀ E PRODUZIONI ANIMALI: DIPARTIMENTO SCIENZA, DI TECNOLOGIA SCIENZE ANIMALI E BIOTECNOLOGIE DOTTORATO DI RICERCA IN PRODUZIONI ANIMALI XXVII CICLO DEVELOPING A PROTOTYPE WELFARE ASSESSMENT PROTOCOL FOR HORSES AND DONKEYS Tesi di: Dott.ssa Emanuela Dalla Costa Docente guida: Dott.ssa Michela Minero Anno Accademico 2013/2014
2
3 To Daniel who have always told me that I could do it and to Michela who made this dream true
4 INDEX Chapter 1 - General introduction... 4 Current situation of the equine industry... 5 On-farm welfare assessment... 8 Overview of the Animal Welfare Indicators project...12 Work Package 1 (WP1)...13 Work Package 2 (WP2)...14 Work Package 3 (WP3)...15 Work Package 4 (WP4)...16 References...18 Chapter 2 - Overview on equine animal-based indicators...20 Equine on-farm welfare assessment: a review on animal-based indicators...21 Abstract...21 Introduction...23 Materials and methods...26 Results and discussion...29 Conclusions...61 Animal welfare implications...62 Acknowledgments...62 References...64 Chapter 3 - Horses...72 Development of the Horse Grimace Scale (HGS) as a pain assessment tool in horses undergoing routine castration
5 Abstract...73 Introduction...75 Materials and methods...77 Results...91 Discussion...95 Acknowledgements References Validation of a fear test in sport horses using infrared thermography Abstract Introduction Methods Results and discussion Conclusion and future directions Acknowledgments References Chapter 4 - Donkeys A study on validity and reliability of on-farm tests to measure human-animal relationship in horses and donkeys Abstract Introduction Material and methods Results Discussion Conclusion Acknowledgements References
6 Use of Qualitative Behaviour Assessment as an indicator of welfare in donkeys Abstract Introduction Material and methods Results Discussion Conclusions Acknowledgements References Chapter 5 - Training material Learning Objects References LO: Facial expression of pain in horses: the Horse Grimace Scale Abstract Description The HGS smartphone app Abstract Description Welfare Indicators Tarining material Description Chapter 6 - General conclusions Acknowledgments

7 CHAPTER 1 - GENERAL INTRODUCTION 4
8 Chapter 1 General introduction CURRENT SITUATION OF THE EQUINE INDUSTRY In the past equines were vital in industry, agriculture, transport and the military; the equine industry today involves both people and equines owned for leisure or sporting activity, racing, pet, animal assisted therapy, agriculture, transport or foreign trade/meat production. This industry is of economic importance to all countries all over the world. Nowadays, in Europe, the total number of horses is estimated to exceed 5 million (Table 1), while the total number of donkeys is over 1 million (Eurostat, 2009; Faostat, 2011). Member state Total number of horses (2007) Horses/1000 persons Austria Belgium Czech Republic Denmark Estonia Finland France Germany Great Britain Greece Hungary Ireland Italy Latvia Luxembourg Netherlands Norway Poland Serbia Slovakia Slovenia Spain Sweden ,1 28,5 6,3 27,6 3,7 14,6 14,3 12,1 16,6 2,4 6,0 19,0 5,1 5,9 9,7 24,5 9,6 8,4 17,5 1,5 11,0 12,8 30,9 Table 1 - Total number of horses and the number of horses every 1000 persons in some European Countries. 5
9 Chapter 1 General introduction Although no definitive statistics are available on the annual economic impact of the equine industry in Europe, it is estimated that is around 100 billion euros a year: with full time jobs equivalent provided by the sector and 6 million hectares of permanent grassland given over to horse grazing (European Horse Network, 2010). Additionally, it is a growing sector, with the number of horse riders growing by 5% a year. In the United States is estimated that the economic impact of the horse industry is significant and involves some $300 billion dollars, 4 million horses, and 1,6 million full-time jobs (The Equestrian Channel, 2014). In 2009, the American Horse Publications (AHP) launched a survey of American horse owners and caretakers to gauge trends in the equine industry (American Horse Publications, 2009). The goal of the survey was to identify trends in horse activity participation, find out what issues are currently most important to members of the horse community, and to analyze equine health issues. Over 11 thousand usable responses were gathered and much different information were collected, varying from the involvement in equine industry and horse health issues to costs of horse keeping and hot-issues for the equine industry (American Horse Publications, 2009). Regarding the hot-issues (concerns should be addressed first in the respondents opinion), the welfare of equines was one of the most important with more than 60% of respondents selected the destiny of unwanted horses, owners who do not understand their horses, horses that are not trained properly and ineffective welfare laws (Figure 1). Another important concern pointed out was the lack of educational material; in fact improved education for breeders and horse caretakers was proposed by 9,7% of respondents who offered suggestions in how to solve these hot-issues. From the year 2000, the number of donkeys in Europe was reported to be growing (Faostat, 2011); and their welfare, both at home and abroad, has become a concern. 6
 to the American Horse Publications survey regarding the issues facing the equine industry (from http://www.horsechannel.com/horse-news/2010/04/29/ahpsurvey-results.")
10 Chapter 1 General introduction In fact, a number of sanctuaries for retired and rescued donkeys as well as NGOs have been set up (e.g. the Donkey Sanctuary). Figure 1 Responses (%) to the American Horse Publications survey regarding the issues facing the equine industry (from Evidences to date suggest that the equine industry is an important growing sector and the interest for the welfare of equines is growing all over the world, not only among owners and people that work with them, but also among citizens and governmental organizations. Therefore, a welfare assessment protocol is needed to evaluate and guarantee the welfare of equines involved in all the activities of the equine industry. 7
11 Chapter 1 General introduction ON-FARM WELFARE ASSESSMENT Animal welfare refers to the state of an animal and it relates to both the animal s feelings as well as to its health state (Berthe et al., 2012; Broom, 2011). Public concern about animal welfare has steadily grown during recent years mainly for ethical reasons (Main et al., 2003). Simultaneously, animal welfare assessment at farm level is a scientific discipline that is rapidly developing. In the last decade, the European Commission founded different scientific projects to develop welfare assessment protocols for farm animals (e.g. Welfare Quality project). In fact, welfare assessment can play many roles such as identifying current welfare problems, checking if legislative requirements have been met, indicating risk factors leading to a welfare problem, testing the efficacy of interventions, formulating a product information/labelling system, or research tool for evaluating and comparing management systems, environments (Whay, 2007). It is generally accepted that scientific welfare assessment requires a multidimensional approach (Edwards, 2007; Mason and Mendl, 1993), and should aim to objectively evaluate whether all the needs of animals are met. With this aim, the EU Welfare Quality project, starting from the concept of the animals' Five Freedoms (Brambell, 1965), defined four welfare Principles, linked to twelve Criteria (Blokhuis et al., 2010; Rushen et al., 2011) (see Table 2). Each Principle is phrased to communicate a key welfare question and is divided into different Criteria: each welfare Criterion represents a specific area of welfare, which indicates an area of concern; consequently, Criteria are independent of each other and form an exhaustive, but concise list (Welfare Quality Consortium, 2009). 8
.")
12 Chapter 1 General introduction Figure 2 - The four Principles and 12 animal-based Criteria used as guidelines for good welfare according to the Welfare Quality project (from EFSA Panel on Animal Health and Welfare, 2012). On-farm welfare assessment tools must involve measures that at the same time are 1) valid and reliable; 2) easily operated by trained people, and require limited time (Winckler, 2004). Two broad categories of indicator can be used to assess animal welfare at the farm level: resource-based and animal-based (EFSA Panel on Animal Health and Welfare, 2012). Resource-based measures evaluate whether resources provided to the animal (e.g. food, water, lying space) are sufficient; the use of such indirect indicators is attractive because their measurement is mostly quick, easy and reliable. While, animal-based indicators are directly measurable on animals, either by observation or by inspection; and this is an important advantage especially for equines that are kept in different housing conditions (e.g. single stabled or group housed). It is however challenging, to select and develop reliable and at the same time feasible animal-based measures for on-farm assessment protocols. In practice, resource-based measures may also be included in on-farm assessment protocols when they are closely correlated to animal-based indicators 9
.")
13 Chapter 1 General introduction and because they can form the basis for the identification of causes of welfare problems (Winckler, 2004) (see Figure 3). Figure 3 - Influencing factors and animal-based parameters in relation to the animal s welfare state (modified from Winckler, 2004). The assessment of animal welfare is a complex subject, especially when it is carried out on-farm where environment and management are relatively uncontrolled and may contain many confounding factors to complicate interpretation of the results. However, welfare scientists emphasise that on-farm application is the final objective of all welfare science endeavours, and also gives unique options for large-scale population studies and access to a diversity of environmental circumstances (Berthe et al., 2012; Main et al., 2003). Furthermore, on-farm welfare assessment not only provides an opportunity for extending knowledge on animal requirements, but is also a necessary tool to respond to the growing demand for assessment and certification of animal welfare status by legislators and consumers. In this view, animal-based indicators can be a good aid; mainly because they are now being more widely explored, and the validation and 10
14 Chapter 1 General introduction standardisation of simple integrative measures for such approaches is an important future development. 11
15 Chapter 1 General introduction OVERVIEW OF THE ANIMAL WELFARE INDICATORS PROJECT The growing interest for animal welfare among consumers and there is also a need of a standardize on-farm welfare assessment to guarantee the well-being of animal involved in the food chain. For this reason, there is an increase of EU founded project to investigate on-farm welfare assessment. The Animal Welfare Indicators project (AWIN) is financed by the EU VII Framework Program (FP7-KBBE ) and aims to address animal welfare indicators in sheep, goats, turkeys, horses and donkeys. The research is organized into four distinct, but complementary, Work Packages. Each Work Package feeds into both further research and education materials (see Figure 4): Work Package 1 (WP1): developing an on-farm welfare assessment protocols, including pain, for sheep, goats, turkeys horses, and donkeys. Work Package 2 (WP2): investigating the impact of diseases and pain on animal welfare. Work Package 3 (WP3): assessing how early experience can affect the later on behaviour. Work Package 4 (WP4): global Hub for research and education in animal welfare. 12
 The overall objective is to develop animal welfare assessment protocols, including pain assessment protocols, for sheep, goats, horses, donkeys and turkeys by: Developing an")
16 Chapter 1 General introduction Figure 4: Overall organization of the AWIN project. Work Package 1 (WP1) The overall objective is to develop animal welfare assessment protocols, including pain assessment protocols, for sheep, goats, horses, donkeys and turkeys by: Developing an early-warning system of welfare problems; Developing a prototype welfare assessment protocol for all the species involved; Assessing the practical on-farm feasibility of the protocols; Presenting welfare assessment protocols to stakeholders. As a starting point, WP1 produces a list of relevant animal-based indicators, including pain, derived from the existing scientific literature. Validity, on-farm feasibility, reliability of each animal-based indicator found was discussed during an Expert Group Meeting among AWIN scientists. Therefore, the development of suitable indicators was supported by close integration with WP2 and WP3. In order 13
17 Chapter 1 General introduction to develop the horse and donkey welfare assessment protocols, scientists from Università degli Studi of Milan and Havelland Clinic carried out studies to investigate the validity, repeatability and on-farm feasibility of relevant animal based welfare indicators, following recommendation provided by the Experts Group. Subsequently, the resulting protocols were submitted to a network of stakeholders to increase the acceptability on the welfare assessment procedure and to identify possible solutions to potential barriers to the application in practice. According to the results of the studies to refining the indicators and the stakeholders' feedback, final protocols were tested in different countries and different housing systems (e.g. single box for horses, group housing for donkeys) by trained assessors. The final goal of the WP1 is to propose a stepwise strategy for practical on-farm animal welfare assessment. The protocols offer, initially, a quick screening, which depending on the outcomes could evolve into a more in-depth assessment. The outcomes generated in WP1 will be tested in WP2 and WP3 and will be used as an outreach and training protocol in WP4. This work was part of the WP1 and was focused on: 1) identifying new animalbased indicators to assess pain, fear reaction, positive emotional state and humananimal relationship in horses and donkeys to be included in the welfare assessment protocols; 2) to produce training material to train assessors; 3) to test the welfare assessment prototype protocols on-farm (horse stables and donkeys farm). Work Package 2 (WP2) The overall goal is to study the impact of diseases and pain on animal welfare by: Assessing attitudes and knowledge towards pain and diseases in donkeys, goats, horses, sheep and turkeys; 14
18 Chapter 1 General introduction Investigating the welfare consequences of foot-rot and other causes of lameness in sheep and goats; Assessing the welfare consequences of laminitis in horses; Assessing the welfare consequences of mastitis and pregnancy toxaemia in sheep and goats; Studying the acceptability and limitations of pain alleviation protocols used on farm management procedures. To do so, WP2 scientists used a combination of surveys and experimental data collection to assess relationships between animal welfare and some commonly occurring painful conditions with a special focus on behavioural and physiological indicators of pain and discomfort. In addition to the welfare measures developed by WP1 for routine on-farm use, WP2 used an experimental approach also investigating more in-depth biomarkers of pain that might not be suitable for routine welfare assessment. The species included in the experimental studies were goats, sheep and horses. In all experimental studies, a multidisciplinary approach was used combining clinical assessment of disease, behaviour, and physiological responses to determine the most appropriate pain indicators for the range of conditions and situations studied. The outcomes of these studies contributed to the development and refinement of welfare assessment protocols for these species developed in WP1. Work Package 3 (WP3) The overall aim is to examine how different prenatal social environments, social dynamics and prenatal handling methods affect the development and welfare of the offspring in sheep, goats and horses by: 15
19 Chapter 1 General introduction Studying the impact of group size and animal density during pregnancy on behaviour and welfare of the mothers and offspring; Characterising the impact of positive and negative handling during pregnancy on offspring development and welfare in sheep and goats; Studying the impact of common situations or events, farm management and housing conditions affecting social environment during pregnancy in domestic horses on behaviour and welfare of the mothers and offspring. WP3 scientists formed an experimental model to test in a controlled manner how three major resource based factors that we see on a farm influence welfare of pregnant females and their offspring, namely animal density, group size and human handling. In addition to many of the animal-based welfare measures from WP1 and partly WP2, WP3 was more focused on behavioural, physiological as well as brain measures that are difficult to use directly when assessing welfare in commercial herds. Work Package 4 (WP4) The overall aim is to create a global hub for research and education in animal welfare that integrates past, present and future research and teaching materials by: Developing a website and a database with the goal of integrating animal welfare information from different institutions that is useful and easy to access by students, professionals and others end-users; Providing information for specialised teaching programs on animal welfare including material on the welfare consequences of disease and pain assessment in farm and domestic animals; Developing a collection of learning objects available to interested parties including professionals in the animal industry; 16
20 Chapter 1 General introduction Offering an outstanding research training environment for post graduate teaching in animal welfare in each of the different institutions taking part in this consortium. There is a societal demand to find practical ways to disseminate existing and new knowledge in animal welfare to interested parties/stakeholders for example: the lay-person, policy makers, students and professionals. It is also paramount to ensure that the transfer of knowledge from the welfare indicators project is efficient and effective. For this reason, the Animal Welfare Science Hub ( was created in It is a website, which hosts and shares animal welfare information worldwide to stakeholders and parties, allowing them to use and add to animal welfare knowledge in a network of excellence. The Hub provides users with an interactive and innovative knowledge environment that can be personalized according to the user s preferences. The Hub consists of two sections: Animal Welfare Education: the user can find all the animal welfare courses. Animal Welfare Interactive: the user can access to interactive training material (e.g. learning objects, apps). 17
21 Chapter 1 General introduction REFERENCES American Horse Publications, AHP Equine Industry Survey. URL Berthe, F., Vannier, P., Have, P., Serratosa, J., Bastino, E., Broom, D.M., Hartung, J., Sharp, J.M., The role of EFSA in assessing and promoting animal health and welfare 10, Blokhuis, H.J., Veissier, I., Miele, M., Jones, B., The Welfare Quality project and beyond: safeguarding farm animal well-being. Acta Agric. Scand. Sect. A - Anim. Sci. 60, Brambell, F.W.R., Report of the Technical Committee to Enquire into the Welfare of Animals Kept under Intensive Livestock Husbandry Systems. Broom, D.M., A history of animal welfare science. Acta Biotheor. 59, Edwards, S.A., Experimental welfare assessment and on-farm application EFSA Panel on Animal Health and Welfare, (AHAW), Statement on the use of animal-based measures to assess the welfare of animals. EFSA J. 10, European Horse Network, Key Figures. Eurostat, Eurostat. URL 0 Faostat, URL Lim, Y.C., Chiew, T.K., Creating reusable and interoperable learning objects for developing an e-learning system that supports remediation learning strategy. Comput. Appl. Eng. Educ. 22, Main, D.C.J., Kent, J.P., Wemelsfelder, F., Ofner, E., Tuyttens, F.A.M., Applications for methods of on-farm welfare assessment. Anim. Welf. 12, Mason, G., Mendl, M., Why is there no simple way of measuring animal welfare? Anim. Welf. 2, Rushen, J., Butterworth, A., Swanson, J.C., Animal behavior and well-being symposium. Farm animal welfare assurance: science and application. J. Anim. Sci. 89, The Equestrian Channel, US Horse Industry Statistics. Horse Counc. Stat. URL Welfare Quality Consortium, Welfare Quality assessment protocol for cattle. Whay, H., The journey to animal welfare improvement. Anim. Welf. 18
22 Chapter 1 General introduction Winckler, C., The use of animal-based health and welfare parameters what is it all about? URL 19

23 CHAPTER 2 - OVERVIEW ON EQUINE ANIMAL-BASED INDICATORS 20
24 Chapter 2 Overview on animal-based indicators EQUINE ON-FARM WELFARE ASSESSMENT: A REVIEW ON ANIMAL-BASED INDICATORS Emanuela Dalla Costa 1, Leigh Murray 1, Francesca Dai 1, Elisabetta Canali 1, Michela Minero 1 1 Università degli Studi di Milano, Dipartimento di Scienze Veterinarie e Sanità Pubblica, Milano, Via Celoria 10, Milano, Italy Published in: Animal Welfare 2014, 23: Abstract The adaptability of horses and donkeys to different types of activity has seen the European equine industry become an important economic sector, giving rise to increasing concern regarding equine welfare. As part of the AWIN (Animal Welfare Indicators) project, this review focuses on scientific literature to find potential animal-based welfare indicators - the initial step in developing a valid, reliable and feasible on-farm welfare assessment protocol for equines. Forty-nine indicators were considered and classified in accordance with the four Principles and twelve Criteria developed by Welfare Quality. Only practical indicators specifically for on-farm use were included, those requiring the use of specific instruments or laboratory analysis were excluded. Academic scientists, partners and collaborators of the AWIN project, discussed and agreed on validity, reliability, on-farm feasibility and acceptance by farmers for each indicator. Some aspects of equine welfare have been thoroughly investigated and appear to have indicators ready for on-farm use (e.g. absence of prolonged hunger, absence of 21
25 Chapter 2 Overview on animal-based indicators injuries and diseases ). On the other hand, a lack of animal-based measures were identified for other Criteria such as absence of pain and positive emotional state. Ongoing research within the AWIN project has begun exploring some of the aforementioned Criteria these preliminary results of promising indicators have been included (e.g. Horse Grimace Scale and Qualitative Behaviour Assessment). Further research should address the validity and reliability of indicators, such as human-animal relationship tests and signs of cold stress. As well as for working equines, the development and application of a welfare assessment protocol could be the first step for enhancing on-farm equine welfare. Keywords: Animal welfare, animal-based indicator, donkey welfare, equine welfare, horse welfare, on-farm welfare assessment protocol. 22
26 Chapter 2 Overview on animal-based indicators Introduction It is estimated that more than six million equines live in Europe, however there are no definitive statistics (European Horse Network, 2010; Faostat, 2011). The European equine industry is an important economic sector, thanks to the adaptability of horses and donkeys to very different types of activity (e.g. breeding, leisure and sport, education) and the effect of people s continued fascination with equids, and their willingness to spend money on them as either a business or hobby. Equine welfare is an increasing cause for concern due to limitations of the present European legislation, which differs between countries and does not encompass all aspects of welfare. There is currently increased public awareness and demand for improved equine welfare (Fraser, 2001). The frequent need for rapid responses to address contingent equine welfare issues and to answer public concerns has forced scientists to produce suboptimal criteria to assess welfare onfarm (Broom, 2011). Animal welfare is a term that describes a potentially measurable quality of a living animal at a particular time and hence is a scientific concept (Pond et al., 2011). The assessment of animal welfare requires a multi-dimensional approach (Mason and Mendl, 1993), and should aim to determine the actual welfare of animals, including both physical and mental states (EFSA Panel on Animal Health and Welfare, 2012). Funded by the European Commission, in the Seventh Framework Programme, the AWIN (Animal Welfare Indicators) project s goals include the improvement of animal welfare by developing practical on-farm welfare assessment protocols for several species, including horses and donkeys. This current review of scientific literature is the starting point to identify promising animal-based indicators. Based on the findings in this review, AWIN scientists will develop a research action plan to address the lack of knowledge regarding the validity, repeatability and feasibility 23
27 Chapter 2 Overview on animal-based indicators of single indicators. The resulting list of indicators will then be tested on-farm by trained assessors. The overall assessment of welfare should be regarded as a multidimensional process that takes into consideration several aspects that are almost independent (e.g. good human-animal relationship and absence of pain). Due to the differences in equine use, housing and management throughout Europe, it should be clarified that the term on-farm refers to any type of facility housing equines where the assessment may take place, where it is performed on-site, such as riding schools, race course, stables, livery yard, sanctuary, actual farm, etc. Working equines refers to animals used to transport crops, fuel wood, water, building materials and people by carts or on their back, tillage and in occupational therapy programs (Mekuria and Abebe, 2010). It should also be clarified that farmer refers also to owner or the primary carer of the animals. In 2008, the EU Welfare Quality project defined four welfare Principles, linked to twelve Criteria (Blokhuis et al., 2010; Rushen et al., 2011), starting from the concept of the animals' Five Freedoms (Brambell, 1965) (see Figure 1). Each Principle is phrased to communicate a key welfare question and is divided into different Criteria. Each welfare Criterion represents a specific area of welfare, which indicates an area of concern; consequently, Criteria are independent of each other and form an exhaustive, but concise list (Welfare Quality Consortium, 2009). 24
28 Chapter 2 Overview on animal-based indicators Figure 1 - The link between the concept of the five freedoms proposed by the Farm Animal Welfare Council and the four Animal Welfare Principles and 12 Criteria formulated by Welfare Quality. Two broad categories of indicator can be used to assess animal welfare at the farm level: animal-based and resource-based (EFSA Panel on Animal Health and Welfare, 2012). The use of animal-based indicators for equine welfare assessment allows assessment of welfare in different housing conditions as the indicators refer to the animal itself rather than the environment. One important advantage of using animal-based indicators is the possibility of evaluating the animals, either by observation or by inspection. The advantages of using directly evaluable indicators are given by EFSA, animal-based measures are linked to welfare-related outcomes and they can be considered as a form of toolbox from which to select the range of measures necessary to address the specific objectives of the assessment for that particular species and category of animal at that time. That is to say, the measures chosen should be fit for purpose. Which measure is the most appropriate will depend on a number of different things, e.g. the purpose of the assessment, the skills of the person collecting the measure, the conditions under which it is to be gathered, the time available to collect it and financial constraints (EFSA Panel on Animal Health and Welfare, 2012). 25
29 Chapter 2 Overview on animal-based indicators The research question addressed by this review was: to date, which animal-based indicators used to evaluate equine welfare are valid, reliable and feasible on-farm? Materials and methods To capture as many relevant citations as possible, a range of databases (Web of Science, CAB Abstracts, PubMed and Scopus) were searched to identify key studies addressing animal-based welfare indicators in equines since 1980 (see Table 1 for keywords used). The search resulted in 4940 citations from which relevant studies were selected for the review: we aimed to include key studies in equines that address animal-based welfare indicators in any housing condition and category (e.g. working equines). We included full papers published in peer reviewed journals and proceedings and, when full papers were not available, abstracts written in English with a clear explanation of the experimental design and the methods followed were sought; we excluded any studies that solely concentrated on resource-based (e.g. bedding) or management-based (e.g. questionnaires) indicators. After exclusions, 54 papers from 21 countries remained, published between 1988 and 2013, which were relevant to the question posed for the review. 26
30 Chapter 2 Overview on animal-based indicators Keywords Major descriptors Welfare Welfare measure Welfare indicator Welfare assessment Absence of prolonged hunger Absence of prolonged thirst Comfort around resting Thermal comfort Ease of movement Absence of injuries Absence of disease Absence of pain induced by management procedures Expression of social behaviours Expression of other behaviours Positive emotional state Good human-animal relationship Disease Pain Fear Discomfort Anxiety Frustration Stress Stress assessment Behavior test Behavior preference Preference test Body condition score BCS Human-animal relationship Aggressive behaviour Aggression Learned helplessness Conflict behavior Skin lesions Combined with Equine* Equid* Equus Horse* Donkey* Table 1 Keywords used for database search. After studies had been selected, they were classified in tables according to the Five Freedoms (Brambell, 1965; Farm Animal Welfare Council, 1979), four Principles and twelve Criteria (Welfare Quality Consortium, 2009) (see Figure 1). Tables 27
31 Chapter 2 Overview on animal-based indicators included information on animal category (age, sex, breed and attitude), type of housing (individually or group stabled, paddock, pasture, etc.), sample size and validity, reliability and on-farm feasibility of the identified animal-based indicator, as well as references to the literature. Validity concerns the relationship between an indicator and what it is supposed to measure or predict (Acock, 2008). Criterion-related validity picks one or more criteria or standards for evaluating a scale, such as a predictive or a concurrent measure. Predictive validity measures the ability of an indicator to predict some later criterion, while concurrent validity measures the correlation between an indicator and other measures to which it is theoretically related (Kamphaus and Frick, 2005). Reliability refers to repeatability in time and consistency within and between observers (Martin and Bateson, 2007). On-farm feasibility considers the practical likelihood of using the indicator during on-farm inspection. Therefore, it is a more dynamic concept, dependent on factors such as the purpose of the assessment and budgetary constraints. Together with biosecurity and safety issues, time needed to collect the data as well as farmers and stakeholders acceptance, these comprise the main variables to be evaluated (Knierim and Winckler, 2009). Thirteen academic scientists, internationally acknowledged for their expertise in equine welfare and peer reviewed publications on relevant topics, were selected as partners and collaborators in the AWIN project. They were given a fixed definition for validity, reliability, on-farm feasibility and were subsequently asked to fill in the tables, scoring each indicator within each paper on the above-mentioned variables. Possible scores were: tested/not tested (i.e. was the repeatability tested?) and yes/no (i.e. repeatable/not repeatable). Scientists agreed on definitions and scores of validity and reliability, whereas a consensus had to be reached regarding the on-farm feasibility of some indicators. The point of view of each scientist was considered, discussed and compared during a meeting; definitions and explanations 28
32 Chapter 2 Overview on animal-based indicators were used to reach a consensus regarding on-farm feasibility and to define promising indicators to be included in the equine welfare assessment protocols. A research action plan was defined to cover the lack of knowledge for some of the indicators. Results and discussion A total of 54 peer-reviewed papers regarding experimental studies on the development of animal-based welfare indicators satisfied the search criteria, identifying 49 indicators. The total number of recognized indicators seems large; however, following the evaluation of validity, reliability and feasibility, only a few meet all of the necessary requirements. As reported above, the discussion on equine animal-based indicators is presented following the four welfare Principles and twelve Criteria of Welfare Quality. 1. Principle: good feeding Animal-based indicators to assess the Principle good feeding, their validity, reliability and on-farm feasibility are reported in Table 2. 29
33 Species Housing / Category Validity Test-retest Reliability Inter-observer Reliability On-farm Feasibility Chapter 2 Overview on animal-based indicators Animal-based welfare indicators References 1. Good feeding 1.1. Absence of prolonged hunger Weight estimation tape H S,P no Weight formula estimation H,D S,P yes Visual estimate H S,P no Body Condition Score H,D S,P,W yes yes yes yes Bedding investigation H S Bedding eating H S Resting behaviour H S Absence of prolonged thirst Ellis and Hollands, 2002, 1998 Burden, 2012; Carrol and Huntington, 1988; Ellis and Hollands, 1998 Burkholder, 2000; Ellis and Hollands, 1998; Reavell, 1999 Burden, 2012; Burkholder, 2000; Burn et al., 2009, 2010; Cappai et al., 2013; Carrol and Huntington, 1988; Mekuria and Abebe, 2010; Pearson and Ouassat, 1996; Pritchard et al., 2005; Quaresma et al., 2013 Ninomiya and Kusunose, 2004; Ninomiya et al., 2007a Ninomiya and Kusunose, 2004; Ninomiya et al., 2007a Ninomiya and Kusunose, 2004; Ninomiya et al., 2007a Skin tent test H,D W no yes no yes Burn et al., 2009; Pritchard et al., 2008, 2007, 2006, 2005 Burn et al., 2009; Mekuria Mucous membrane H,D W no - yes yes and Abebe, 2010; Pritchard dryness et al., 2008, 2005 Drinking test H,D W yes Pritchard et al., 2008, 2006 H Horse; D Donkey. S Single box P Paddock W working equine yes tested and valid, reliable or feasible; no tested and not valid, not reliable or not feasible; - not tested. Table 2 Animal-based indicators for assessing the Principle good feeding. 30
34 Chapter 2 Overview on animal-based indicators 1.1 Criterion: absence of prolonged hunger When dealing with horses and donkeys, particularly in Europe, obesity is as much a welfare issue as being of low weight; for example, some ponies or donkeys might be obese but still hungry. Therefore, we focused on animal-based indicators which would assess the appropriate nutrition of equines. Two categories of animal-based indicator were identified: 1) weight estimation, 2) the feeling of hunger linked with behavioural expression by equines. Weight estimation The weight estimation of horses can be assessed by various methods: weigh tape, weight estimation formula, visual estimate and body condition score (BCS). A weigh tape is a tool which is frequently used to record weight directly, by passing it around the horse at the lowest point of the withers. There are different commercially available weigh tapes with varying efficacy (Ellis and Hollands, 2002, 1998). Weight estimation formulas use the heart girth and body length measurements in centimetres to calculate the weight in kilograms. There are a number of weight estimation formulas for horses and a separate one for donkeys (Burden, 2012; Carrol and Huntington, 1988; Ellis and Hollands, 1998). Visual estimation appears to be the most commonly used method by experienced horse persons and veterinarians for determining equine weight (Ellis and Hollands, 1998; Reavell, 1999), it is a wholly subjective method using only visual appraisal. BCS is a well known and widely used method for assessing appropriate nutrition of farm animals, including equines (Burden, 2012; Burn et al., 2009, 2010; Carrol and Huntington, 1988; Mekuria and Abebe, 2010; Pearson and Ouassat, 1996; Pritchard et al., 2005). It is a subjective, semi-quantitative method for evaluating body fat and muscle that takes into account the deposition of body fat in different areas by separate examination of the neck, back, ribs, pelvis and rump (Carrol and Huntington, 1988). Burden (2012) reported that body condition scoring for 31
35 Chapter 2 Overview on animal-based indicators donkeys and mules requires a different technique to that used in horses, as donkeys lay down fat stores in more localised areas and have a different body shape. In horses, BCS assessment can be performed visually, through palpation, or both, while in donkeys, palpation is necessary due to the different length of the coat and thickness of the skin (Cappai et al., 2013). It can be scored using a 5-point (Carrol and Huntington, 1988; The Donkey Sanctuary BCS scale) or 9-point scale (Henneke et al., 1983). The optimum body condition score is considered to be a 3 or a 5, with the 5- or the 9-point scale respectively. Weight estimation formulas were found to be valid for estimating weight (Burden, 2012; Cappai et al., 2013; Carrol and Huntington, 1988; Ellis and Hollands, 1998). However, weigh tapes were not. Compared with a weighbridge, estimates obtained using Spillers and Dalton weigh tapes were not accurate. Measures obtained were influenced by the dimensions of the horse, particularly whether it was greater or less than 15 hh (about 152 cm) (Ellis and Hollands, 1998). Visual estimation of a horse s weight has been found to be inaccurate and unreliable (Ellis and Hollands, 1998), particularly for the excessive subjectivity of the estimates (Burkholder, 2000). Burkholder (2000) reported that BCS is a repeatable measure when performed in accordance with specific protocols, and it also has good inter-observer reliability. Using the 5-point scale, BCS seemed to be reliable among 6 10 different observers (Burn et al., 2009, 2010; Pritchard et al., 2005). Test retest reliability of the other indicators, as well as their repeatability, has never been evaluated. On-farm feasibility has only been considered for BCS, which is feasible to measure with relative ease under different housing and management conditions: not only on-farm, but also in working equines (Carrol and Huntington, 1988; Mekuria and Abebe, 2010; Pritchard et al., 2005). Furthermore, the BCS system has been reported to be easy to learn and even the most complicated and evolved BCS 32
36 Chapter 2 Overview on animal-based indicators protocol can be mastered relatively quickly through application and practise (Burkholder, 2000). All the animal-based indicators found seem to be acceptable to farmers, because they require simple measurements. In view of all the observations reported above, BCS is a valid, reliable, feasible and easy to learn animal-based indicator; therefore it is probably the best current method of assessing on-farm nutrition of equines. Besides the quantity and quality of feed, one must take into account that other factors, as the age of the subject and the presence of disease can affect body condition. The feeling of hunger Food restriction - and the consequent eating frustration - might be necessary to improve the welfare of equines in the long term, in cases of specific clinical conditions or to treat obesity. Excellent body condition in a horse or a donkey does not necessarily mean that eating/grazing/foraging need is fulfilled. High energy diets provide the nutritional requirements, but a psychological need to forage for many hours per day may still exist. The feeling of hunger, as well as feeding satisfaction in the subject can be assessed using behavioural indicators such as bedding investigation and eating, and resting behaviour after a meal. Bedding investigation (smelling bedding or moving it with the nose) and bedding eating during the two hours post-feeding have been reported to be an indicator of eating frustration, linked with the feeling of hunger in horses (Ninomiya and Kusunose, 2004), while resting behaviour after eating (e.g. standing-sleep) was described by Ninomiya et al. (2007a; 2007b) as an indicator of eating satisfaction in horses. However, the validity of bedding investigation, bedding eating and resting behaviour as behavioural indicators of eating frustration and satisfaction has never been studied and should be carefully evaluated. Additionally, there are doubts about the feasibility of using these indicators because they require a long observation time. 33
37 Chapter 2 Overview on animal-based indicators Further studies should be conducted to evaluate the validity and reliability of behavioural indicators (e.g. bedding eating) as these indicators could contribute important information regarding eating frustration (for stereotypies see the Criterion expression of other behaviours) and feeding satisfaction that are considered to be welfare issues, primarily for stabled horses. 1.2 Criterion: absence of prolonged thirst Indicators found to assess the absence of prolonged thirst were the skin tent test, mucous membrane dryness and the drinking test. All the animal-based indicators found have only been assessed in working equines, while in stabled equines, resource-based indicators are regularly preferred. Two categories of animal-based indicators were also identified: 1) dehydration, 2) the feeling of thirst. Dehydration Dehydration can be assessed by performing the skin tent test or by checking for mucous membrane dryness. The skin tent test is assessed by pinching and immediately releasing the skin of the cranial margin of the animal s scapula and a vertical fold of skin overlying the Musculus brachiocephalicus, then observing when the skin returns to its normal position. If there is a delay in the return of tented skin to its normal position, the animal could be dehydrated (Burn et al., 2009; Pritchard et al., 2008, 2006, 2005). Mucous membrane dryness is evaluated using a fast filter paper placed on the gingival mucosa for 10 seconds (Pritchard et al., 2008). Qualitative assessment of dryness and adhesion to the mucosa is scored with a 0 5 point scale. The validity of the skin tent test has been evaluated in a number of studies (Burn et al., 2009; Pritchard et al., 2008, 2006, 2005), but was found to be limited, particularly for assessing dehydration in horses (there is a poor correlation with physiological measures such as plasma osmolarity). It is of paramount importance 34
38 Chapter 2 Overview on animal-based indicators that the authors of these studies could not exclude the presence of the confounding effects of malnutrition. The skin tent test is a moderately repeatable measure (Pritchard et al., 2007). Researchers found differences between different anatomical locations (e.g. side: skin tents on the left side of the animal were longer than on the right). Inter-observer reliability of the skin tent test can be improved with increased training of assessors (introducing the concept of biological variability, e.g. for elasticity of the skin) and by using a simplified score (yes no) (Pritchard et al., 2007). Although relatively simple and feasible, the qualitative and quantitative assessment of mucous membrane dryness does not seem to be a valid measure of dehydration. A study concerning inter-observer reliability of mucous membrane dryness considered it to be not reliable, because, for example, drinking water can influence this measure by decreasing dryness (Pritchard et al., 2006). A study on inter-observer reliability of mucous membrane dryness evaluates it as ambiguous in both horses and donkeys (Burn et al., 2009). The feeling of thirst The drinking test is a simple experiment in which the assessor offers water-filled buckets (at ambient environmental temperature) to the animal, and observes its behaviour for 10 minutes (Pritchard et al., 2008, 2006). To avoid bias due to other confounding factors, the bucket and the water provided should be familiar to the animal. It could be an easy way to assess the feeling of thirst in horses and donkeys, especially if they do not have free access to water. The drinking test appears to be a valid, direct animal-based measure for assessing the feeling of thirst, in particular, for horses exercising in conditions of high ambient temperature. Water intake also appears to be linked with dehydration of the subject (Pritchard et al., 2006). However, possible confounding factors arising when testing exhausted horses, horses in a novel environment or when different 35
39 Chapter 2 Overview on animal-based indicators motivation factors are present, should be noted and the results regarded with due caution. The reliability of the drinking test and repeatability of mucous membrane test have never been assessed. The drinking test appears to be a feasible animal-based indicator, however it is important to evaluate drinking test feasibility in relation to the condition of an on-farm welfare assessment protocol. Another major consideration regarding feasibility of the drinking test is the potential issue of biosecurity and the transfer of pathogens and disease among equines within facilities. The difficulty of finding a valid and feasible animal-based measure for assessing absence of prolonged thirst is clear. On-farm feasibility and reliability for the drinking test should be investigated. At present, resource-based indicators, such as continuous water availability and cleanliness of drinkers, are the most valid, reliable and feasible indicators for on-farm assessment of this Criterion. 2. Principle: good housing Animal-based indicators to assess the Principle good housing, their validity, reliability and on-farm feasibility are reported in Table 3. 36
40 Species Housing / Category Validity Test-retest Reliability Inter-observer Reliability On-farm Feasibility Chapter 2 Overview on animal-based indicators Animal-based welfare indicators References 2. Good housing 2.1 Comfort around resting Lying behaviour H S no 2.2 Thermal comfort Behavioural signs of heat stress (increased frequency and depth of respiration, flared nostrils, perfuse sweating, head nodding and apathy Behavioural signs of cold stress (shivering, shelter seeking, huddling H,D W yes yes yes yes H P yes - - yes Chaplin and Gretgrix, 2010; Heleski et al., 2002; Pedersen and Ladewig, 2004 Burn et al., 2009; Holcomb et al., 2013; Minka and Ayo, 2007; Pritchard et al., 2006, 2005 Heleski and Murtazashvili, 2010b; Mejdell and Bøe, Ease of movement Daily activity H S no Chaplin and Gretgrix, 2010 Locomotory Bachmann et al., 2003; stereotypies (box Heleski et al., 2002; walking, weaving, H S yes McGreevy et al., 1995; fence pacing, pawing, Ninomiya et al., 2007b box kicking H Horse; D Donkey. S Single box P Paddock W working equine yes tested and valid, reliable or feasible; no tested and not valid, not reliable or not feasible; - not tested. Table 3 Animal-based indicators for assessing the Principle good housing. 37
41 Chapter 2 Overview on animal-based indicators 2.1 Criterion: comfort around resting The only animal-based indicator found to assess this Criterion was lying behaviour (Chaplin and Gretgrix, 2010; Heleski et al., 2002; Pedersen and Ladewig, 2004). To achieve paradoxical sleep, horses prefer to lie down in lateral rather than in sternal recumbency (Pedersen and Ladewig, 2004). For this reason, the inability to lie down affects their welfare and performance. Raabymagle and Ladewig (2006) observed that box size can affect the lying behavior of horses; in their study they spent more time recumbent in a large box [(2.5 x the height of the horse) 2 m 2 ] than in a small one [(1.5 x the height of the horse) 2 m 2 ]. An important observation raised by Pedersen and Ladewig (2004) is that single-boxed horses attempted to roll over before standing up. A possible explanation for this behaviour is an attempt to create distance from the box wall in order to be able to make the forward movement to get up. Rolling attempts can lead to different welfare problems, for example they can increase the risk of the horse becoming stuck against the box wall (i.e. becoming cast ), therefore lying space should be checked to ensure it is appropriate. Although lying behaviour has never been tested for validity, reliability and repeatability, equine welfare scientists involved in the discussion agreed that this behaviour can be considered as a well-founded measure for assessing comfort around resting. Data are available on the time budgets for lying behaviour in horses; however measuring time budgets is very time consuming, therefore not truly feasible during a brief on-farm assessment. Undoubtedly there are a lack of animal-based indicators for assessing comfort around resting. In some cases, it may be helpful and easier to ask specific questions to the caretakers (e.g. what is your horse s preferred resting position?), even if it may lack objectivity. To address the Criterion comfort around resting, the absence of fresh/recent hock injuries, along with difficulties in getting up, should be 38
42 Chapter 2 Overview on animal-based indicators considered as promising new animal-based indicators, as well as resource-based indicators, such as amount of lying space and quality of bedding. In some cases, as proven by Houpt and colleagues (2001), horses with no previous experience in straight stalls may be reluctant to lie down. In this study nine of 16 mares kept in straight stalls were not observed in recumbency throughout a six-month observation period. Therefore, it should be borne in mind that, when insufficient lying space is provided (less than the small box measures reported by Raabymagle and Ladewig, 2006), or the quality of bedding is very poor, horses do not lie at all, so neither getting up nor hock injuries can be observed. In this case resource-based measures are highly indicative of inadequate comfort. 2.2 Criterion: thermal comfort This Criterion states that animals should neither be too hot nor too cold (Welfare Quality Consortium, 2009). The literature has largely focused on behavioural signs of heat stress in working equines in developing countries (Burn et al., 2009; Minka and Ayo, 2007; Pritchard et al., 2006, 2005). Recently, Holcomb et al. (2013) examined how behavioural and physiological parameters can be affected by hot temperatures in horses kept in on-farm environments and found that mature horses showed a preference for using shade in summer conditions; shade provided significant physiological benefits even with limited use. Increased frequency and depth of respiration, flared nostrils, profuse sweating, head nodding and apathy are behavioural signs used to assess the presence of heat stress. If four or more of these signs are observable on the same subject, the animal is suffering from heat stress (Burn et al., 2009; Pritchard et al., 2006, 2005). Heat stress is the only animalbased indicator that has been tested for all parameters and found to be valid, repeatable and reliable for assessing this criterion. On-farm feasibility was considered by different authors for assessing behavioural signs of heat stress (Burn 39
43 Chapter 2 Overview on animal-based indicators et al., 2009; Holcomb et al., 2013; Pritchard et al., 2005), in different housing and management conditions. As well as heat, cold temperatures might affect the welfare of equines that do not have any shelter. Shivering, shelter seeking and huddling are assumed to be important behavioural signs of cold stress (Heleski and Murtazashvili, 2010; Mejdell and Bøe, 2005). Heleski and Murtazashvili (2010) studied shelter seeking behaviour (SSB) and found that more horses used shelters in rainy, breezy conditions; in particular, the probability of SSB increased if the temperature was less than -1 C. Shivering is usually an acute response to a sudden cold exposure. Shivering and SSB could be considered valid measures of thermal comfort in cold temperatures (Heleski and Murtazashvili, 2010; Mejdell and Bøe, 2005). Although inter-observer reliability has not been evaluated for shivering and SSB, experts considered that good reliability could easily be achieved with training of assessors. Behavioural signs of cold stress also seem to be feasible and acceptable on-farm animal-based indicators. Signs of heat and cold stress can be easily used on-farm to assess thermal comfort. As the absence of a shelter in presence of extreme temperatures can definitively compromise the ability of thermoregulation, resource-based indicators, such as presence of an appropriate shelter of adequate dimension, should be taken into consideration together with animal-based measures. 2.3 Criterion: ease of movement This Criterion asserts that animals should have enough space to be able to move around freely (Welfare Quality Consortium, 2009). Locomotion plays a key role in horses, because it has both positive physical and mental effects on their health and because we take advantage of their ability to move when we use them. A common method for keeping horses in a domestic environment is single box 40
44 Chapter 2 Overview on animal-based indicators housing; therefore, a good animal-based indicator for evaluating when confinement compromises their welfare is needed. Daily activity and the presence of abnormal locomotory behaviours were found as animal-based indicators described in the literature. Daily activity can be electronically recorded using a motion sensor (Chaplin and Gretgrix, 2010). Although data can be collected for an exact calculation of the daily activity of the subject, the use of an electronic device for 24 hours is not seen as acceptable from the farmer s point of view, whereas the presence of abnormal behaviours (e.g. locomotor stereotypies such as box walking, weaving, fence pacing, pawing, box kicking) can be directly observed. Locomotor stereotypies have been partially linked with insufficient activity, however validity has not been tested in experimental studies (Bachmann et al., 2003; Heleski et al., 2002; McGreevy et al., 1995; Ninomiya et al., 2007b). McGreevy and colleagues (1995) found that horses are less likely to develop abnormal behaviour if they spend more time out of the stable. To confound matters, locomotor stereotypies may indicate a previous welfare status versus the current welfare status. Although repeatability and inter-observer reliability were not evaluated for either of these indicators, it is considered plausible that inter-observer reliability in recognising locomotor stereotypies or signs of their presence is achievable with training of assessors (e.g. videos). The presence of locomotor stereotypies seems to be a feasible and acceptable onfarm animal-based indicator, however if considered alone without any other measure, it is not specific enough to assess the ability of horses to move around freely. Therefore, resource-based indicators regarding facilities (e.g. the possibility of going out to pasture), as well as the ratio between horse and box measures, together with a management-based indicator such as a questionnaire concerning the 41
45 Species Housing / Category Validity Test-retest Reliability Inter-observer Reliability On-farm Feasibility Chapter 2 Overview on animal-based indicators daily activity of the animals should be helpful in assessing the Criterion ease of movement. 3. Principle: good health Animal-based indicators to assess the Principle good health, their validity, reliability and on-farm feasibility are reported in Table 4. Animal-based welfare indicators References 3. Good health 3.1 Absence of injuries Hair discoloration H S yes Vervaecke et al., 2011 Hairless patches Skin lesions Swollen joints/tendons Lameness H, D H, D H, D H, D W - yes yes yes S, W - yes yes yes W - yes yes yes S, W - yes yes - Sensitive back H S Absence of diseases Ectoparasites H, D W - - yes yes Burn et al., 2009; Mekuria and Abebe, 2010; Pritchard et al., 2005; Vervaecke et al., 2011 Burn et al., 2009, 2010; Leeb et al., 2003; Mekuria and Abebe, 2010; Neijenhuis et al., 2011; Pritchard et al., 2005; Vervaecke et al., 2011 Burn et al., 2009, 2010; Mekuria and Abebe, 2010; Pritchard et al., 2005 Burn et al., 2009, 2010; Mekuria and Abebe, 2010; Neijenhuis et al., 2011; Pritchard et al., 2005; Viñuela-Fernández et al., 2011 Asknes and Mejdell, 2012; Neijenhuis et al., 2011 Burn et al., 2009, 2010; Leeb et al., 2003; Mekuria and Abebe, 2010; Pritchard et al.,
46 Chapter 2 Overview on animal-based indicators Coat health Fecal soiling Abnormal breathing /dyspnoea H, D H, D W - yes yes yes W - yes yes yes H S Burn et al., 2009, 2010; Leeb et al., 2003; Mekuria and Abebe, 2010; Pritchard et al., 2005 Burn et al., 2009, 2010; Leeb et al., 2003; Mekuria and Abebe, 2010; Pritchard et al., 2005 Couëtil and Hoffman, 2007; Kutasi et al., 2011; Leeb et al., 2003 Cough H S Kutasi et al., 2011 Ocular discharge Nasal discharge Mucous Colour Membrane Limb/hoof associated abnormalities H, D H, D H, D H, D W - yes yes yes W W - yes yes yes W - yes yes yes 3.3 Absence of pain induced by management procedures Pain-related behaviours Composite measures pain score H,D S yes - yes - H S yes yes yes yes Burn et al., 2009; Leeb et al., 2003; Mekuria and Abebe, 2010; Pritchard et al., 2005 Kutasi et al., 2011; Leeb et al., 2003 Burn et al., 2009, 2010; Mekuria and Abebe, 2010; Pritchard et al., 2005 Burn et al., 2009, 2010; Leeb et al., 2003; Mekuria and Abebe, 2010; Pritchard et al., 2005 Ashley et al., 2005; Dalla Costa et al., 2010; Taylor et al., 2002 Bussières et al., 2008; Graubner et al., 2011; van Loon et al., 2010 Horse Grimace Scale H S yes - yes yes Minero et al., 2013 H Horse; D Donkey. S Single box P Paddock W working equine yes tested and valid, reliable or feasible; no tested and not valid, not reliable or not feasible; - not tested. Table 4 Animal-based indicators for assessing the Principle good health. 3.1 Criterion: absence of injuries The animal-based indicators found in the literature were: the occurrence of hair discolouration, hairless patches, skin lesions, swollen joints/tendons, sensitive back and lameness (Burn et al., 2009; Leeb et al., 2003; Neijenhuis et al., 2011; 43
47 Chapter 2 Overview on animal-based indicators Pritchard et al., 2005; Vervaecke et al., 2011). These conditions might be linked with the presence of pain. Hair discoloration is generally noted as unnatural patches of white hairs, presumably caused by inappropriate equipment (Vervaecke et al., 2011); it indicates a lesion occurred in the past. Hairless patches are an area with hair loss and undamaged skin; whereas with a lesion, the skin is damaged either in the form of a scar, scab or wound (Burn et al., 2009; Pritchard et al., 2005). Hair discoloration, hairless patches and skin lesions are assessed by visual inspection of the animal s body and are recorded either on a presence/absence basis (Burn et al., 2009; Mekuria and Abebe, 2010) or a 3-point scale (Leeb et al., 2003). Only lesions covering an area greater than 2 2 cm, 1 4 cm rectangle or 2.3 cm diameter on the body are recorded (Mekuria and Abebe, 2010; Pritchard et al., 2005). Their presence can be influenced by the type (e.g. ridden vs pack equines), quantity and intensity of work and by the type and quality of the equipment used, as well as the presence of disease (e.g. ectoparasites) or aggressive social interactions. Therefore, their location on the body (e.g. mouth corners, girth/belly, tail), number and severity should be recorded. Swollen joints/tendons are assessed by visual inspection of the flexor tendons and fetlock joints (Burn et al., 2010) and scored either on a 3-point scale (Burn et al., 2009; Leeb et al., 2003), a presence/absence basis (Pritchard et al., 2005) or as normal/swollen (Burn et al., 2010). A sensitive back is assessed via palpation of the sides of the spine and evaluating the tension and/or sensitivity of the back muscles of the horse and is scored using by a 3- or 4-point scale (Asknes and Mejdell, 2012; Neijenhuis et al., 2011). Lameness is assessed by visual inspection of the subject during locomotion and is scored either by ticking a visual analogue scale (Viñuela-Fernández et al., 2011), a 3- or 5-point scale (Neijenhuis et al., 2011; Viñuela-Fernández et al., 44
48 Chapter 2 Overview on animal-based indicators 2011) or on a presence/absence basis (Burn et al., 2009, 2010; Pritchard et al., 2005). None of the indicators found for this Criterion have been scientifically tested for validity, but the presence of, for example lesions, should be considered if there is evidence that injuries have occurred. Test retest reliability has only been evaluated for skin lesions, swollen joints/tendons and lameness (Burn et al., 2009). Inter-observer reliability has been tested and considered good for swollen joints/tendons (Burn et al., 2009; Pritchard et al., 2005). However, it has been found to be controversial for skin lesions, with Burn et al. (2009) reporting low reliability, while Pritchard and colleagues (2005) reported it to be good. Burn et al. (2010) suggest that their low inter-observer reliability was confounded by uncertainties among observers, due to unclear interpretation of low scale range when scoring indicators, as well as unbalanced prevalence of many indicators. Inter-observer reliability of the assessment of lameness has proven to be difficult to achieve, requiring extensive training and personal experience of the observer (Viñuela-Fernández et al., 2011). The use of a very simple scoring system (yes/no) is reported to be helpful to achieve good reliability among assessors (Burn et al., 2009). Simple, user-friendly scoring systems and proper training of assessors are necessary to improve reliability when recording skin lesions and lameness on-farm. All of the reported indicators have been used for welfare assessment on working equines and have been described as easy to conduct under field conditions, requiring no expensive equipment (Burn et al., 2009; Leeb et al., 2003). All are designed to be practical, rapid, and to minimise handling and disruption to the animal s working routine (Mekuria and Abebe, 2010; Pritchard et al., 2005). Some doubts have been raised regarding on-farm feasibility of lameness and back sensitivity assessments, thus feasibility needs to be verified, and so too does 45
49 Chapter 2 Overview on animal-based indicators acceptance by farmers. In order to adequately evaluate these indicators, it is essential to handle and move the horse out of its box. All other animal-based indicators outlined seem to be acceptable, possibly due to their ease of use and low disruption to work. Criterion: absence of disease The presence of disease can be determined through use of animal-based measures, which may infer its presence, rather than diagnose a particular disease. Several indicators that suggest an animal may be suffering from an underlying disease were found: depressed stance and presence of pain-related behaviours (see also the paragraph 3.3 Criterion: absence of pain induced by management procedures), the presence of ectoparasites, unhealthy coat, faecal soiling, cough, abnormal breathing/dyspnoea, ocular and nasal discharge, changes in mucous membrane colour (MMC) and limb/hoof-associated abnormalities (Burn et al., 2009, 2010; Leeb et al., 2003; McDonnell, 2002; Mekuria and Abebe, 2010; Pritchard et al., 2005). All of these indicators are assessed by visual inspection. The presence of ectoparasites (e.g. flies, lice, ticks) has been scored on both a 3-point scale (Leeb et al., 2003) and on a presence/absence basis (Burn et al., 2009; Mekuria and Abebe, 2010; Pritchard et al., 2005). The assessment of coat health is performed by examination of the hair on the both sides of animal s neck and recording whether there are any signs of alteration, e.g. matted, scabby or scruffy hair (Burn et al., 2009; Leeb et al., 2003; Mekuria and Abebe, 2010; Pritchard et al., 2005). Faecal soiling is assessed by inspecting the area inside the thighs and down back of the hocks and recording the presence (yes/no) of any amount of soiling with fresh or dried-on liquid faeces (Leeb et al., 2003; Mekuria and Abebe, 2010; Pritchard et al., 2005), when present it is an indicator of diarrhea. The presence of a cough, abnormal breathing/dyspnoea 46
50 Chapter 2 Overview on animal-based indicators and/or nasal discharge can be signs of respiratory disease (Couëtil and Hoffman, 2007; Kutasi et al., 2011; Leeb et al., 2003). To assess the presence of abnormal breathing/dyspnoea the observer should examine whether expiration is supported by the muscles of the trunk and whether the nostrils are dilated. Ocular discharge (or eye abnormalities) may be scored or on a presence/absence basis (Burn et al., 2010), or on a 3-point scale (Pritchard et al., 2005) ranging from signs of mild discharge to signs of ocular pain, keratitis, uveitis and blindness. Nostrils should also be clean and free from discharge in healthy animals. Mucous membrane colour (MMC), is assessed by observation of the upper gum (e.g. pinkish in colour when normal, and ranging from pale, yellow, white, or purple in colour if abnormal) and scored as normal/abnormal (Burn et al., 2009; Mekuria and Abebe, 2010; Pritchard et al., 2005). Limb/hoof-associated abnormalities may cause gait abnormality (Ross and Dyson, 2010), as well as signs of neglect (e.g. hoof lesions, overgrown) can increase the risk of lameness. They are evaluated through observation of the subject whilst moving to determine whether any hoof-associated problems have caused mild or severe lameness and/or gait abnormality. Standard lameness and gait abnormalities were generally examined, where time allowed, over a 20 meters trot-away before returning to the observer (Pritchard et al., 2005). The validity of these indicators has never been scientifically tested, but they are universally recognised as clinical signs linked with the presence of disease. Coat health, faecal soiling, ocular discharge, MMC and limb/hoof abnormalities were evaluated by Burn et al. (2009) and considered to be repeatable indicators. The presence of ectoparasites, coat health, faecal soiling, ocular discharge, MMC and limb/hoof-associated abnormalities were tested for inter-observer reliability by different authors: Burn et al. (2010) found low reliability among observers; while, Pritchard et al. (2005) successfully tested inter-observer agreement. Burn et al. (2010) explained their low inter-observer reliability as probably being due to the 47
51 Chapter 2 Overview on animal-based indicators homogeneity of the studied population and suggested that to increase this parameter, a more diverse equine population should be selected. Most of the indicators were used in a simple way to assess the presence of disease on working equines, so they can be considered feasible for an on-farm welfare assessment and acceptable from the farmer s point of view. In view of all the observations reported above, most of the indicators have been found to be valid, reliable, feasible and observers can easily be trained. Therefore, they can be used on-farm to assess the Criterion absence of disease. 3.3 Criterion: absence of pain induced by management procedures This Criterion considers that animals should not suffer pain induced by inappropriate management, handling, slaughter, or surgical procedures (e.g. castration without anaesthesia and/or analgesia) (Welfare Quality Consortium, 2009). Pain can be provoked by different conditions and can compromise equine welfare, therefore animal-based indicators are needed to identify pain and evaluate when appropriate pain-relief treatment is advisable. Indicators of pain described in the literature are the presence of pain-related behaviours and composite measure pain scores. Pain-related behaviours (e.g. considerable restlessness, flank watching, reluctance to move, abnormal weight distribution, weight-shifting, lowered head carriage - not associated with sleep/dozing -, fixed stare, dilated nostrils, clenched jaw) are considered to be valid animal-based indicators, as their presence is clearly linked with the presence of pain (see Ashley et al., 2005 for a review; Dalla Costa et al., 2010; Olmos et al., 2010; Taylor et al., 2002). Other indicators that can be used are composite measure pain scores (e.g. composite pain scale (CPS), post abdominal surgery pain assessment scale (PASPAS)), carried out through a brief observation of the subject (e.g
52 Chapter 2 Overview on animal-based indicators minutes). Composite measure pain scores are a result of focusing not only on the presence of pain-related behaviours and changes in normal behaviour patterns (e.g. loss of appetite), but also on physiological parameters (e.g. heart rate, rectal temperature, respiratory rate). The CPS has been successfully applied by several authors following both surgical procedures (e.g. castration) or in the presence of injury and disease such as laminitis and colic (Bussières et al., 2008; Graubner et al., 2011; van Loon et al., 2010), and its validity has been tested (Bussières et al., 2008; van Loon et al., 2010). Both pain-related behaviours and the composite measure pain scores show good inter-observer reliability (Bussières et al., 2008; Dalla Costa et al., 2012b; Graubner et al., 2011; van Loon et al., 2010). On-farm feasibility was not directly considered by the authors, but composite measure pain scores are primarily used for pain assessment in everyday practice by equine clinicians. Both indicators might be well accepted by the farmer as they only require observation of the subject. Composite measure pain scores require no more than five minutes per subject to record and can easily be used on stabled horses. They could, therefore, be considered feasible to measure on-farm. The use of pain-related behaviours as indicators may have some limitations: considering that equines, as prey animals, can mask obvious signs of pain in the presence of an unknown human - especially when the pain is mild - pain-related behaviours may be subtle and not overtly obvious. Recently, a new approach to pain evaluation has been developed in other species utilising the assessment of facial expressions, incorporated into species-specific grimace scales (Keating et al., 2012; Langford et al., 2010; Sotocinal et al., 2011). Equines are very expressive animals and some facial changes (e.g. fixed stare, dilated nostrils, clenched jaw) are already described and commonly used to identify the presence of pain. Therefore, AWIN scientists focused their research on 49
53 Species Housing / Category Validity Test-retest Reliability Inter-observer Reliability On-farm Feasibility Chapter 2 Overview on animal-based indicators the development of the Horse Grimace Scale (HGS), with preliminary results suggesting HGS could be a promising pain indicator (Dalla Costa et al., 2014; Minero et al., 2013). As many management procedures (e.g. castration) are performed when welfare assessors are not on-farm, the effects of surgery should be measured using questionnaires and analgesic drugs administered, to prevent horses and donkeys suffering from pain following these routine procedures. 4. Principle: good behaviour Animal-based indicators to assess the Principle good behaviour, their validity, reliability and on-farm feasibility are reported in Table 5. Animal-based welfare indicators References 4. Good behaviour 4.1 Expression of social behaviour Isolation test H S, P yes - - no Lansade et al., 2008a Attraction test H S, P no - - no Lansade et al., 2008a Vocalizations H S, P yes Harewood and McGowan, 2005; Lansade et al., 2008a Aggressive Knubben et al., 2008; behaviours and H P McDonnell, 2002 related injuries Allo-grooming H P Feh and de Mazières, 1993; McDonnell, Expression of other behaviours Stereotypies H S yes Dierendonck and Goodwin, 2005; Mills and Riezebos, 2005; Sarrafchi and Blokhuis, 2013; Wickens and Heleski,
54 Chapter 2 Overview on animal-based indicators Novel object test H S, P yes yes - yes Startling test H S yes yes - yes Novel arena H S, P yes yes - - Restraint and human fear test H S, P yes yes - - Christensen et al., 2008; Górecka-Bruzda et al., 2011; Lansade et al., 2008c; Le Scolan et al., 1997; Leiner and Fendt, 2011; Momozawa et al., 2003; Visser et al., 2002; Wolff et al., 1997 Christensen et al., 2008; Górecka-Bruzda et al., 2011; Lansade et al., 2008c; Visser et al., 2001 Lansade et al., 2008b; Le Scolan et al., 1997; Seaman et al., 2002; Wolff et al., 1997 Górecka-Bruzda et al., 2011; Le Scolan et al., 1997; Visser et al., 2001; Wolff et al., Positive emotional state Play and affiliative H,D P Boissy et al., 2007 behaviours Qualitative Behaviour Assessment 4.4 Good human-animal relationship H S yes - yes yes Approach test H,D W yes yes yes - Walking down side H,D W yes yes yes - Chin contact H,D W yes yes yes - Voluntary approach Forced approach animal human H S, P yes - yes yes H S, P yes - yes yes Fleming and Paisley, 2013; Minero et al., 2009; Napolitano et al., 2008 Burn et al., 2010; Popescu and Diugan, 2013; Pritchard et al., 2005 Burn et al., 2010; Popescu and Diugan, 2013; Pritchard et al., 2005 Burn et al., 2010; Popescu and Diugan, 2013; Pritchard et al., 2005 Dalla Costa et al., 2012; Maros et al., 2010; Søndergaard and Halekoh, 2003 Dalla Costa et al., 2012; Søndergaard and Halekoh, 2003 H Horse; D Donkey. S Single box P Paddock W working equine yes tested and valid, reliable or feasible; no tested and not valid, not reliable or not feasible; - not tested. Table 5 Animal-based indicators for assessing the Principle good behaviour. 4.1 Criterion: expression of social behaviours 51
55 Chapter 2 Overview on animal-based indicators This Criterion considers that animals should be able to express normal, nonharmful, social behaviours (e.g. grooming) (Welfare Quality Consortium, 2009). Horses are highly social herd animals that prefer to live in a group; thus contact with other conspecifics plays an important role in their welfare. As horses are commonly stabled in single boxes, animal-based indicators are needed to evaluate whether their need for social contact is fulfilled. To date, the search for indicators has focused on two main topics: 1) tests performed to assess sociability and stress linked with separation from conspecifics (isolation test, attraction test, vocalizations) and 2) tests to address the quality of social contacts (e.g. kicks, bites and skin lesions, allo-grooming). Isolation stress has been shown to significantly reduce welfare in many social species (e.g. cows: Boe and Faerevik, 2003; rats: Patterson-Kane et al., 2002; pigs: Pedersen et al., 2002; rodents: Rault, 2012). The isolation test is primarily designed to determine the presence of distress, resulting from short-term separation from conspecifics, without the possibility of joining or communicating with them, and to observe their reaction to isolation for 5 minutes (e.g. escape attempt, movements, alertness) (Lansade et al., 2008a). The attraction test consists of isolating the test horse at one end of a corridor, with the opportunity to join familiar horses at the opposite end the aim of this test is to assess the reaction to a social attraction (Lansade et al., 2008a). Murray et al. (2013) highlighted the importance of social contact in donkeys, demonstrating that pair-bonded individuals will seek out and preferentially choose their companion when presented alongside a familiar or unfamiliar donkey. Vocalizations (e.g. neighing, whinny, bray) are proven to increase in frequency when horses and donkeys are stressed during separation from other conspecifics (Harewood and McGowan, 2005; Lansade et al., 2008a). An animal may live in a good overall social environment, yet still show signs of separation stress, indirectly reducing the efficacy of other positive welfare 52
56 Chapter 2 Overview on animal-based indicators measures already in place. Therefore entering a stable and hearing a lot of vocalizations could be a sign of separation stress. It is important to underline that vocalizations have never been tested on-farm to assess equine welfare. Aggressive behaviour, such as biting and kicking, is reported to be normal equine behaviour, which helps to create and maintain long-lasting dominance hierarchies (Knubben et al., 2008; McDonnell, 2002). As a consequence, a stable social group leads to the establishment of bonds and affiliative interactions among subjects, allowing allogrooming to become more frequent, thus helping to alleviate social tension (Feh and de Mazières, 1993; McDonnell, 2002). The mixing of different herds or changes in group composition can result in elevated aggressive behaviour, with a higher occurrence of both biting and kicking related injuries (Knubben et al., 2008). Thus, the occurrence of biting, kicking and related injuries (e.g. skin lesions) can be used as animal-based indicators to assess the stability of hierarchies and may also indicate insufficient resource availability and acquisition; e.g. quantity of hay provided/feeding density; how much space is allowed to avoid conflict near desired resources. Lansade et al. (2008a) tested the validity of both the isolation and the attraction tests: the isolation test is reported to be valid, whilst the attraction test was not. Vocalizations, kicks, bites, skin lesions and allo-grooming have never been tested for their validity. Repeatability and inter-observer reliability have not been evaluated for any of the indicators described. Concerns have been raised regarding the feasibility and the acceptance by farmers for the isolation and attraction tests, because they require a lot of time, handling and disruption to the animal s working routine and this is not compatible with a brief on-farm welfare assessment. 53
57 Chapter 2 Overview on animal-based indicators Although equine social behaviour is well studied, assessing this on-farm or in a welfare assessment context might not be feasible and needs further development. At present, no animal-based indicators are available to fully assess the Criterion expression of social behaviour, particularly in single-box housed equines. Therefore, resource and management-based measures (assessing the quantity and quality of social contact between horses) should be collected, as well as other promising indicators, such as bite and kick related injuries, vocalizations and allogrooming. 4.2 Criterion: expression of other behaviours This Criterion considers that animals should be able to express other normal behaviours, i.e. it should be possible for them to express species-specific natural behaviours such as foraging (Welfare Quality Consortium, 2009). Some features of the environment of domestic horse could act as a potential stressor by limiting the ability to perform normal species-specific behaviour, restricting feeding or locomotion and imposing social isolation (McBride and Hemmings, 2009). An environment which lacks stimuli and provides little to no possibility to express natural behaviour may be responsible for the development of abnormal behaviours (e.g. stereotypies) (Broom and Kennedy, 1993; Hothersall and Casey, 2012). Stereotypic behaviour is described as repetitive behaviour with no obvious goal and function (Mason, 1991) and has been linked to poor welfare and suboptimal environments (Cooper and Albentosa, 2005; Cooper and Mason, 1998). Stereotypies are normally performed as a result of learned responses to environmental challenges or changes; signs may include crib-biting, wind sucking, weaving, box walking, head nodding, tongue playing, door kicking (Dierendonck and Goodwin, 2005; Mills and Riezebos, 2005; Sarrafchi and Blokhuis, 2013; Wickens and Heleski, 2010). Stereotypies can be used as animal-based indicators 54
58 Chapter 2 Overview on animal-based indicators when directly observed or, indirectly, when evidence of their presence are detectable in the stable (e.g. damage to the wall, box-door or bedding) and/or on the horse (e.g. anti-cribbing collars). Stereotypies can become habit-forming, therefore, particularly during on-farm assessment, it may be unclear whether any observed stereotypies are representative of the current situation or a previous suboptimal situation. On-farm feasibility and acceptance by farmers of the assessment of the presence of stereotypies has never been verified, but it does not seem impractical or time-consuming. Horses are a prey species and as such it is their nature, in fear-eliciting situations, to show flight reactions which can be dangerous for both horse and handler. The presence of a threat in a horse s immediate environment, coupled with a fearful temperament, plays an important role in determining a long term negative emotional state and over-reaction to fear-eliciting stimuli. These reactions can in turn cause harsh human responses that can affect the human horse relationship and further jeopardize the animal s welfare. Therefore, finding appropriate indicators for assessing fearfulness in horses has important practical implications, not only for horse welfare, but also for human safety. Fear tests are experimental situations designed to evaluate fear responses: novel object tests (e.g. plastic tarpaulin), startle tests (e.g. opening an umbrella), novel arena tests or restraint and human fear tests have been used by different authors to assess behavioural responses to a fear eliciting stimulus (Christensen et al., 2008; Górecka-Bruzda et al., 2011; Lansade et al., 2008b; Le Scolan et al., 1997; Leiner and Fendt, 2011; Momozawa et al., 2003; Seaman et al., 2002; Visser et al., 2002, 2001; Wolff et al., 1997). Parameters recorded have included measuring frequency of behaviours (e.g. glances, sniffing, licking or nibbling), latency to approach the stimuli, flight distance, vocalizations (e.g. snorting, snuffling), defecation during the event as well as physiological parameters, such as heart rate before and after the test. 55
59 Chapter 2 Overview on animal-based indicators Predictive and concurrent validity for fearfulness tests (novel object, startling, novel arena and human fear tests) have been confirmed (Lansade et al., 2008b; Le Scolan et al., 1997; Leiner and Fendt, 2011; Momozawa et al., 2003; Seaman et al., 2002; Visser et al., 2002, 2001; Wolff et al., 1997). In particular, Góreka-Bruzda et al. (2011) found the most reliable indicator of a fearfulness trait was the time to approach the new stimulus and experimenter. The same results were also found by Christensen et al. (2005), Henry et al. (2005) and Visser et al. (2001). Results were found to be valid (predictive, convergent and discriminant validity were all tested) and repeatable; however, inter-observer reliability was not evaluated. Moreover, the test was performed on only one breed (the Polish cold blood); therefore validation in other breeds may be necessary. Although the animal-based indicators to determine fearfulness can be carried out and measured easily (Lansade et al., 2008b), time constraints to actually conduct the tests during an on-farm assessment may hinder their efficacy, so that their use, undoubtedly relevant, might be limited to comprehensive welfare assessments. In summary, stereotypic behaviour and fear tests are considered valid and reliable measures, which can be used as animal-based indicators for assessing the Criterion expression of other behaviours. As these indicators do not completely evaluate when this need for expression is required, the recording of other managementbased measures (e.g. questionnaires that assess the possibility of foraging freely) should be integrated. Moreover, as fear and startle tests have the potential to cause short and long-term welfare issues, their use needs careful consideration. 4.3 Criterion: positive emotional state This Criterion focus on the emotional state of animals, suggesting that negative emotions such as fear, distress, frustration or apathy should be avoided, whereas positive emotions such as security or contentment should be promoted (Welfare 56
60 Chapter 2 Overview on animal-based indicators Quality Consortium, 2009). The potential to assess the positive emotions that animals may experience has aroused scientific interest over the past few years, with the realisation that animal well-being and welfare are not merely based on the absence of negative effects, but also the presence of positive effects (Boissy et al., 2007). No animal-based indicators to evaluate this Criterion in equines have been found in the literature to date; however Boissy et al. (2007) suggest that some behaviours are indicative of positive emotional states (e.g. play, affiliative behaviours). If we consider that horses are frequently stabled in single boxes, it is clear that these behaviours can be difficult to observe, although they may be useful when assessing horses kept in a group. Mendl and colleagues (2010) recently investigated cognitive bias in animals and developed tests to measure whether manipulations designed to alter affective states (e.g. living in an inappropriate environment) were linked to cognitive bias in the manner they predicted. Although these studies should be regarded as a significant development in animal welfare science and their validity is generally accepted, there is no doubt that the feasibility of cognitive bias tests during a relatively brief on-farm welfare assessment is limited. A relatively new and promising animal-based measure is qualitative behavioural assessment (QBA), which characterises behaviour as expressive body language and uses subjective descriptive terms to capture the animal s dynamic style of interaction with the environment by considering the animal as a whole, thus providing an insight into the animal s quality of life (Wemelsfelder, 2007). QBA requires a limited observation period (10-15 minutes) in which the assessor focuses on how the animal expresses any given behaviour. Descriptors may be a fixed list of expressive or emotional terms of behaviour, or observers may generate their own descriptors (Free Choice Profiling). They are then qualitatively scored on a Visual Analogue Scale of the intensity of the perceived expression of behaviour, 57
61 Chapter 2 Overview on animal-based indicators for example how relaxed or agitated the animal is perceived to be (Wemelsfelder, 2007). Qualitative behavioural assessment has already been used by various authors to evaluate horse behaviour (Fleming and Paisley, 2013; Minero et al., 2009; Napolitano et al., 2008), and results to date indicate that a meaningful relationship exists between QBA and quantitative measures (frequency and duration of behaviours, e.g. activity). These studies confirmed what was previously found for other farm animals, thus QBA is a biologically valid form of assessment (Rutherford et al., 2012; Wemelsfelder, 2012, 2007). Furthermore, QBA was found to have high inter-observer reliability in other species, e.g. pigs (Wemelsfelder, 2012). However, it should be highlighted, as with any other skill, adequate training must be undertaken by observers to ensure its efficacy. A possible down-side for on-farm use of QBA is that the result of the assessment is not immediate; in fact, it always requires some form of statistical analysis. Thus, efforts should be focused on finding an easy way to collect and analyse the data. A possible solution to this problem is the development of software which can store and analyse the data automatically as soon as they are uploaded. Play and affiliative behaviours have not been validated, nor tested for repeatability or reliability, although it is emphasized that they are important and are potential welfare indicators of positive emotional states based on the studies of farm animals (Boissy et al., 2007). Ambiguity regarding play behaviour arises when it transforms into fighting and may be difficult to reliably measure without training. Another important issue to address is on-farm feasibility, due to the potentially extensive observation time required. In fact, the standards for on-farm welfare assessments and information systems need to be simplified, with both resource and financial implications reduced. Although there is an evident lack of animal-based 58
62 Chapter 2 Overview on animal-based indicators indicators to evaluate this criterion, the use of QBA could be a promising, quick, non-invasive and feasible on-farm measurement of positive emotional state, even if adequate validation and prior training of assessors is required. 4.4 Criterion: good human-animal relationship The basis for this Criterion is that animals should be handled well in all situations, i.e. handlers should promote good human-animal relationships (Welfare Quality Consortium, 2009). In order to carry out common management and husbandry practices, horses and donkeys must be handled daily and their level of confidence with humans not only influences their performance and behaviour, but their fear reactions, which could have detrimental effects on both their own safety and that of humans. Different human animal relationship tests (e.g. voluntary approach test, forced approach test, walking down side test, chin contact) have been identified in the literature and can be used to assess this Criterion. These measures are reported to be appropriate for evaluating the human animal relationship by assessing avoidance or friendliness towards a human (Burn et al., 2010; Maros et al., 2010; Popescu and Diugan, 2013; Pritchard et al., 2005; Søndergaard and Halekoh, 2003). The tests were assessed in both working and on-farm environments. In working environments (e.g. pack, driving, draught equines) the subject is restrained and the human approach tests are generally conducted in a series of steps. In the approach test, the assessor begins the test from a distance of three metres from the equine and, at a normal pace, approaches the animal and records its reaction (e.g. the animal is friendly or turns away from the assessor) (Burn et al., 2010; Popescu and Diugan, 2013; Pritchard et al., 2005). The assessor then performs the walk down side test walking from head to rear, then returning along the opposite side, taking note of signs of attention or interest. When the subject is a 59
63 Chapter 2 Overview on animal-based indicators donkey, they also look for signs of a tail-tuck (Burn et al., 2010; Popescu and Diugan, 2013). In working equines, the acceptance of chin contact in response to human contact has also given insight into the human animal bond (Burn et al., 2010; Popescu and Diugan, 2013; Pritchard et al., 2005). In an on-farm environment, the tests are usually performed where the subject is free to move in a paddock/arena. It should be noted that safety measures are paramount around free roaming horses to avoid any potentially aggressive incidents when unfamiliar people are performing behaviour tests. During the voluntary animal approach test (VAA), an unfamiliar person enters the paddock and walks to the middle of it; latency until a horse has its head within a distance of 1 m and latency until the horse touches the person is recorded (the maximum test time is 3 min) (Maros et al., 2010; Søndergaard and Halekoh, 2003). In the forced human approach test (FHA), an unfamiliar person approaches the horse slowly with approximately one step per second with hands hanging by the side. If the horse stands still when the person is within a 2 m range, the person slowly raised his hand and attempts to touch the neck of the horse, recording the reaction to be touched using a 4-point scale (Søndergaard and Halekoh, 2003). In working equines, the approach, walking down side and chin contact tests appear to be valid and repeatable measurements of human animal relationships (Burn et al., 2009, 2010; Popescu and Diugan, 2013; Pritchard et al., 2005). Inter-observer reliability seems to be moderate (Burn et al., 2009; Pritchard et al., 2005), but the use of a simple scoring system with clear definitions of scores and intensive training of assessors may help to improve this. However, because these tests require the farmer s involvement, this may be a problem for the on-farm environment where the farmer s time may be limited. 60
64 Chapter 2 Overview on animal-based indicators VAA seems to be a valid measurement (Maros et al., 2010); whilst validity of FHA has not been assessed. Good inter-observer reliability for both tests was reported when assessing single stabled horses (Dalla Costa et al., 2012a). On-farm feasibility has been reported for both VAA and FHA (Søndergaard and Halekoh, 2003) as they require a maximum of three minutes to conduct and minimal handling of the animals. For the same reasons, they both seem acceptable from the farmer s point of view. None of the human animal relationship tests described in the literature for any species studied are completely free from possible confounding factors. However, the avoidance distance and the voluntary approach tests were reported to be valid measures to assess human-animal relationship (Waiblinger et al., 2006). Human animal relationship tests can be used as animal-based indicators to assess the Criterion good human-animal relationship. Further studies are required to evaluate VAA and FHA repeatability, as well as feasibility and acceptance by farmers for the avoidance distance, walking down side and chin contact tests. Conclusions As the initial step in achieving the goals set out in the European AWIN research project, this review aimed to identify possible valid, reliable and feasible animalbased indicators applicable for an on-farm welfare assessment of horses and donkeys. Validity is a concept also associated with sensitivity (the indicator's ability to identify positive results) and specificity (the indicator s ability to identify negative results) (EFSA Panel on Animal Health and Welfare, 2012). However, both sensitivity and specificity for animal-based indicators have rarely been considered in welfare research. From the information reported above, the effort by researchers to find animal-based indicators which will assist the assessment of 61
65 Chapter 2 Overview on animal-based indicators equine welfare in difficult situations, such as those of working equines, is evident. Although some aspects of horse welfare have been thoroughly investigated and indicators seem ready for on-farm use (e.g. absence of prolonger hunger, absence of injuries and diseases), others highlight the lack of scientific research, particularly in terms of validity and reliability. Further research should address the development of indicators for the Criteria absence of prolonged thirst, comfort around resting, ease of movement, expression of social behaviour and expression of other behaviours. A thorough evaluation of the validity and reliability of indicators such as signs of cold stress, QBA and human animal relationship tests is needed, as well as other promising animal-based indicators such as the Horse Grimace Scale, which needs to be tested for on-farm feasibility. Consequently, AWIN research will focus on these important topics. A final, but no less important issue that deserves enhanced attention is the need for animal-based indicators to feasibly assess on-farm pain in donkeys: lack of research in this area is possibly a consequence of both a relatively lower interest in this species and our inability to interpret subtle changes in donkey behaviour. Animal welfare implications In working equines, research findings, derived from the development and application of a scientifically sound welfare assessment protocol have already contributed to welfare improvements. Development of a similar protocol for the on-farm environment could enable the improvement of equine welfare in this area too. Acknowledgments The authors wish to thank the EU VII Framework program (FP7-KBBE ) for financing the Animal Welfare Indicators (AWIN) project. We also 62
66 Chapter 2 Overview on animal-based indicators acknowledge all the involved experts for their large contribution during the process of reviewing papers, refining indicators list and valuable support of the study; Kate Byrne for her extensive and professional revisions of language and structure and Sara Barbieri for the help in the revision of the manuscript. 63
67 Chapter 2 Overview on animal-based indicators References Acock AC 2008 A gentle introduction to Stata. Stata Press, College Station, USA. Ashley FH Waterman-Pearson AE Whay HR 2005 Behavioural assessment of pain in horses and donkeys: application to clinical practice and future studies. Equine Veterinary Journal 37, Asknes F Mejdell C 2012 Back soreness is common among healthy riding horses. In: Proceedings of the 46th Congress of the International Society for Applied Ethology. Vienna, Austria, p Bachmann I Audigé L Stauffacher M 2003 Risk factors associated with behavioural disorders of crib-biting, weaving and box-walking in Swiss horses. Equine veterinary journal 35, Blokhuis HJ Veissier I Miele M Jones B 2010 The Welfare Quality project and beyond: safeguarding farm animal well-being. Acta Agriculturæ Scandinavica, Section A - Animal Science 60, Boe KE Faerevik G 2003 Grouping and social preferences in calves, heifers and cows. Applied Animal Behaviour 3, Boissy A Manteuffel G Jensen MB Moe RO Spruijt B Keeling LJ Winckler C Forkman B Dimitrov I Langbein J Bakken M Veissier I Aubert A 2007 Assessment of positive emotions in animals to improve their welfare. Physiology & behavior 92, Brambell FWR 1965 Report of the Technical Committee to Enquire into the Welfare of Animals Kept under Intensive Livestock Husbandry Systems. Broom DM 2011 A history of animal welfare science. Acta biotheoretica 59, Broom DM Kennedy M 1993 Stereotypies in horses: their relevance to welfare and causation. Equine Veterinary Education 5, Burden F 2012 Practical feeding and condition scoring for donkeys and mules. Equine Veterinary Education 24, Burkholder WJ 2000 Assessment of the provision of optimal nutrition. JAVMA 217, Burn C Pritchard J Whay H 2009 Observer reliability for working equine welfare assessment: problems with high prevalences of certain results. Animal Welfare 18, Burn CC Dennison TL Whay HR 2010 Relationships between behaviour and health in working horses, donkeys, and mules in developing countries. Applied Animal Behaviour Science 126, Bussières G Jacques C Lainay O Beauchamp G Leblond A Cadoré J-L Desmaizières L-M Cuvelliez SG Troncy E Desmaizie L 2008 Development 64
68 Chapter 2 Overview on animal-based indicators of a composite orthopaedic pain scale in horses. Research in veterinary science 85, Cappai MG Picciau M Pinna W 2013 An integrated approach towards the nutritional assessment of the Sardinian donkey: a tool for clinical nutritionists. Italian Journal of Animal Science 12, Carrol C Huntington P 1988 Body Condition Scoring and weight estimation of horses. Equine Veterinary Journal 20, Chaplin SJ Gretgrix L 2010 Effect of housing conditions on activity and lying behaviour of horses. Animal 4, Christensen JW Malmkvist J Nielsen BL Keeling LJ 2008 Effects of a calm companion on fear reactions in naïve test horses. Equine Veterinary Journal 40, Cooper J Albentosa M 2005 Behavioural adaptation in the domestic horse: potential role of apparently abnormal responses including stereotypic behaviour. Livestock Production Science 92, Cooper J Mason G 1998 The identification of abnormal behavior and behavioural problems in stabled horses and their relationship to horse welfare: a comparative review. Equine Veterinary Journal Suppl. 27, 5 9. Couëtil L Hoffman A 2007 Inflammatory airway disease of horses. Journal of veterinary Internal Medicine 21, Dalla Costa E Bonaita C Pedretti S Govoni E Guzzeloni A Canali E Minero M 2012a Inter-observer reliability of three human-horse relationship tests. In: 8th International Society of Equitation Science Conference. Edinburgh, United Kingdom, p. 94. Dalla Costa E Minero M Lebelt D Stucke D Canali E Leach M 2014 Development of the Horse Grimace Scale (HGS) as a pain assessment tool in horses undergoing routine castration. PloS one 9, e Dalla Costa E Rabolini A Scelsa A Ravasio G Pecile A Lazzaretti S Canali E Minero M 2012b Behavioural indicators of pain in horses undergoing surgical castration. In: Proceedings of the 46th Congress of the International Society for Applied Ethology. Vienna, Austria, p Dierendonck M van Goodwin D 2005 Social contact in horses: implications for human-horse interactions. In: Francien Henriëtte de Jonge (Ed.), The Human-Animal Relationship: Forever and a Day. Ruud van den Bos, Assen, The Netherlands, pp EFSA Panel on Animal Health and Welfare (AHAW) 2012 Statement on the use of animal-based measures to assess the welfare of animals. EFSA Journal 10, Ellis J Hollands T 1998 Accuracy of different methods of estimating the weight of horses. Veterinary Record 143,
69 Chapter 2 Overview on animal-based indicators Ellis J Hollands T 2002 Use of height-specific weigh tapes to estimate the bodyweight of horses. Veterinary Record 3, European Horse Network 2010 Key Figures. Faostat Farm Animal Welfare Council [WWW Document]. URL Feh C de Mazières J 1993 Grooming at a preferred site reduces heart rate in horses. Animal Behaviour 46, Fleming P Paisley C 2013 Application of Qualitative Behavioural Assessment to horses during an endurance ride. Animal Behaviour 144, Fraser D 2001 The new perception of animal agriculture: legless cows, featherless chickens, and a need for genuine analysis. Journal of Animal Science 79, Górecka-Bruzda A Jastrzębska E Sosnowska Z Jaworski Z Jezierski T Chruszczewski MH 2011 Reactivity to humans and fearfulness tests: Field validation in Polish Cold Blood Horses. Applied Animal Behaviour Science 133, Graubner C Gerber V Doherr M Spadavecchia C 2011 Clinical application and reliability of a post abdominal surgery pain assessment scale (PASPAS) in horses. Veterinary Journal 188, Harewood E McGowan C 2005 Behavioral and physiological responses to stabling in naive horses. Journal of Equine Veterinary Science 25, Heleski CR Murtazashvili I 2010 Daytime shelter-seeking behavior in domestic horses. Journal of Veterinary Behavior: Clinical Applications and Research 5, Heleski CR Shelle AC Nielsen BD Zanella AJ 2002 Influence of housing on weanling horse behavior and subsequent welfare. Applied Animal Behaviour Science 78, Henneke DR Potter GD Kreider JL Yeates BF 1983 Relationship between condition score, physical measurements and body fat percentage in mares. Equine Veterinary Journal 15, Henry S Hemery D Richard M -a. Hausberger M 2005 Human mare relationships and behaviour of foals toward humans. Applied Animal Behaviour Science 93, Holcomb K Tucker C Stull C 2013 Do horses benefit from provision of shade in hot, sunny weather, and do they prefer it? In: 9th International Equitation Science Conference. Newark, USA, p. 45. Hothersall B Casey R 2012 Undesired behaviour in horses: A review of their development, prevention, management and association with welfare. Equine Veterinary Education 24,
70 Chapter 2 Overview on animal-based indicators Kamphaus RW Frick PJ 2005 Clinical Assessment of Child and Adolescent Personality and Behavior, 2nd ed. ed. Springer, New York, NY. Keating SCJ Thomas A a Flecknell P a Leach MC 2012 Evaluation of EMLA cream for preventing pain during tattooing of rabbits: changes in physiological, behavioural and facial expression responses. PloS one 7, e Knierim U Winckler C 2009 On-farm welfare assessment in cattle: validity, reliability and feasibility issues and future perspectives with special regard to the Welfare Quality approach. Animal Welfare 18, Knubben JM Furst A Gygax L Stauffacher M 2008 Bite and kick injuries in horses: prevalence, risk factors and prevention. Equine veterinary journal 40, Kutasi O Balogh N Lajos Z Nagy K Szenci O 2011 Diagnostic Approaches for the Assessment of Equine Chronic Pulmonary Disorders. Journal of Equine Veterinary Science 31, Langford DJ Bailey AL Chanda ML Clarke SE Drummond TE Echols S Glick S Ingrao J Klassen-Ross T Lacroix-Fralish ML Matsumiya L Sorge RE Sotocinal SG Tabaka JM Wong D van den Maagdenberg AMJM Ferrari MD Craig KD Mogil JS 2010 Coding of facial expressions of pain in the laboratory mouse. Nature methods 7, Lansade L Bouissou M Erhard H 2008a Reactivity to isolation and association with conspecifics: A temperament trait stable across time and situations. Applied Animal Behaviour Science 115, Lansade L Bouissou M Erhard HW 2008b Fearfulness in horses: A temperament trait stable across time and situations. Applied Animal Behaviour Science 115, Le Scolan N Hausberger M Wolff A 1997 Stability over situations in temperamental traits of horses as revealed by experimental and scoring approaches. Behavioural processes 41, Leeb C Henstridge C Dewhurst K Bazeley K 2003 Welfare assessment of working donkeys: assessment of the impact of an animal healthcare project in West Kenya. Animal Welfare 12, Leiner L Fendt M 2011 Behavioural fear and heart rate responses of horses after exposure to novel objects: Effects of habituation. Applied Animal Behaviour Science 131, Maros K Boross B Kubinyi E 2010 Approach and follow behaviour possible indicators of the human horse relationship. Interaction Studies 3, Martin P Bateson P 2007 Measuring Behaviour: An Introductory Guide, 3rd ed. ed. Cambridge University Press, Cambridge, Massachusetts, USA. Mason G 1991 Stereotypies: a critical review. Animal Behaviour 41,
71 Chapter 2 Overview on animal-based indicators Mason G Mendl M 1993 Why is there no simple way of measuring animal welfare? Animal welfare 2, McBride S Hemmings A 2009 A Neurologic Perspective of Equine Stereotypy. Journal of Equine Veterinary Science 29, McDonnell S 2002 Behaviour of horses. In: Jensen P. The Ethology of Domestic Animals. CABI publishing, New York, USA, pp McGreevy PD Cripps PJ French NP Green LE Nicol C Management factors associated with stereotypic and redirected behaviour in the Thoroughbred horse. Equine Veterinary Journal 27, Mejdell C Bøe K 2005 Responses to climatic variables of horses housed outdoors under Nordic winter conditions. Canadian Journal of Animal Science 85, Mekuria S Abebe R 2010 Observation on major welfare problems of equine in Meskan district, Southern Ethiopia. Livestock Research for Rural Development 22, Article #48. Mendl M Burman OHP Paul ES 2010 An integrative and functional framework for the study of animal emotion and mood. Proceedings. Biological sciences / The Royal Society 277, Mills DS Riezebos M 2005 The role of the image of a conspecific in the regulation of stereotypic head movements in the horse. Applied Animal Behaviour Science 91, Minero M Dalla Costa E Lebelt D Stucke D Canali E Leach M 2013 Development of a facial expressions pain scale in horses undergoing routine castration. In: 9th International Equitation Science Conference. Delaware, USA, p. 36. Minero M Tosi MV Canali E Wemelsfelder F 2009 Quantitative and qualitative assessment of the response of foals to the presence of an unfamiliar human. Applied Animal Behaviour Science 116, Minka NS Ayo JO 2007 Effects of Shade Provision on Some Physiological Parameters, Behavior and Performance of Pack Donkeys (Equinus asinus) during the Hot-Dry Season. Journal of Equine Science 18, Momozawa Y Ono T Sato F Kikusui T Takeuchi Y Mori Y Kusunose R 2003 Assessment of equine temperament by a questionnaire survey to caretakers and evaluation of its reliability by simultaneous behavior test. Applied Animal Behaviour Science 84, Murray LMA Byrne K D Eath RB 2013 Pair-bonding and companion recognition in domestic donkeys, Equus asinus. Applied Animal Behaviour Science 143, Napolitano F De Rosa G Braghieri A Grasso F Bordi A Wemelsfelder F 2008 The qualitative assessment of responsiveness to environmental challenge in horses and ponies. Applied Animal Behaviour Science 109,
72 Chapter 2 Overview on animal-based indicators Neijenhuis F De Graaf-Roelfsema E Wesselink H Van Reenen C Visser EK 2011 Towards a welfare monitoring system for horses in the Netherlands: prevalence of several healh matters. In: van Dierendonck, M., de Cocq, P., Visser, E. (Eds.), 7th International Equitation Science Conference - Equitation Science: Principles and Practice Science at Work. Hooge Mierde, The Netherlands, p. 80. Ninomiya S Kusunose R 2004 Effects of feeding methods on eating frustration in stabled horses. Animal Science Journal 75, Ninomiya S Sato S Kusunose R 2007a Short communication A note on a behavioural indicator of satisfaction in stabled horses. Applied Animal Behaviour Science 106, Ninomiya S Sato S Sugawara K 2007b Weaving in stabled horses and its relationship to other behavioural traits. Applied Animal Behaviour Science 106, Olmos G Burden F Gregory N 2010 An innovative approach for better understanding the signs of pain in donkeys: the associations of pain-related pathology with clinical and behavioural indicators. In: The 6th International Colloquium on Working Equids: Learning from Others. New Delhi, India, p Patterson-Kane E Hunt M Harper D 2002 Rats demand social contact. Animal Welfare 11, Pearson RA Ouassat M 1996 Estimation of the liveweight and body condition of working donkeys in Morocco. Veterinary Record 138, Pedersen GR Ladewig J 2004 The Influence of Bedding on the time horses spend recumbent. Journal of Equine Veterinary Science 24, Pedersen LJ Jensen MB Hansen SW Munksgaard L Ladewig J Matthews L 2002 Social isolation affects the motivation to work for food and straw in pigs as measured by operant conditioning techniques. Applied Animal Behaviour Science 77, Pond W Bazer F Rollin B 2011 Animal Welfare in Animal Agriculture: Husbandry, Stewardship, and sustainability in animal production, 1st ed. CRC Press, Boca Raton, USA. Popescu S Diugan E-A 2013 The Relationship Between Behavioral and Other Welfare Indicators of Working Horses. Journal of Equine Veterinary Science 33, Pritchard J Barr A Whay H 2007 Repeatability of a skin tent test for dehydration in working horses and donkeys. Animal Welfare 16, Pritchard J Barr ARS Whay HR 2006 Validity of a behavioural measure of heat stress and a skin tent test for dehydration in working horses and donkeys. Equine veterinary journal 38,
73 Chapter 2 Overview on animal-based indicators Pritchard J Burn C Barr A Whay H 2008 Validity of indicators of dehydration in working horses: a longitudinal study of changes in skin tent duration, mucous membrane dryness and drinking behaviour. Equine Veterinary Journal 40, Pritchard JC Lindberg AC Main DCJ Whay HR 2005 Assessment of the welfare of working horses, mules and donkeys, using health and behaviour parameters. Preventive Veterinary Medicine 69, Raabymagle P Ladewig J 2006 Lying Behavior in Horses in Relation to Box Size. Journal of Equine Veterinary Science 25, Rault J-L 2012 Friends with benefits: Social support and its relevance for farm animal welfare. Applied Animal Behaviour Science 136, Reavell D 1999 Measuring and estimating the weight of horses with tapes, formulae and by visual assessment. Equine Veterinary Education 11, Ross M Dyson S 2010 Diagnosis and management of lameness in the horse, 2nd ed. Elsevier Saunders, Missouri, USA. Rushen J Butterworth A Swanson JC 2011 Animal behavior and well-being symposium. Farm animal welfare assurance: science and application. Journal of Animal Science 89, Rutherford KMD Donald RD Lawrence AB Wemelsfelder F 2012 Qualitative Behavioural Assessment of emotionality in pigs. Applied Animal Behaviour Science 139, Sarrafchi A Blokhuis HJ 2013 Equine stereotypic behaviors: Causation, occurrence, and prevention. Journal of Veterinary Behavior: Clinical Applications and Research 8, 1 9. Seaman S Davidson H Waran N 2002 How reliable is temperament assessment in the domestic horse (Equus caballus)? Applied Animal Behaviour Science 78, Søndergaard E Halekoh U 2003 Young horses reactions to humans in relation to handling and social environment. Applied Animal Behaviour Science 84, Sotocinal SG Sorge RE Zaloum A Tuttle AH Martin LJ Wieskopf JS Mapplebeck JCS Wei P Zhan S Zhang S McDougall JJ King OD Mogil JS 2011 The Rat Grimace Scale: a partially automated method for quantifying pain in the laboratory rat via facial expressions. Molecular Pain 7, 55. Taylor PM Pascoe PJ Mama KR 2002 Diagnosing and treating pain in the horse. Where are we today? The Veterinary Clinics of North America. Equine Practice 18, Van Loon J Back W Hellebrekers LJ van Weeren PR Loon JPAM Van Weeren V 2010 Application of a Composite Pain Scale to Objectively Monitor Horses 70
74 Chapter 2 Overview on animal-based indicators with Somatic and Visceral Pain under Hospital Conditions. Journal of Equine Veterinary Science 30, Vervaecke H Boydens M De Nil M Laevens H 2011 Pilot study on the occurrence of pressure marks on the body and mouth lesions in riding horses in Flanders. In: van Dierendonck, M., de Cocq, P., Visser, E. (Eds.), 7th International Equitation Science Conference - Equitation Science: Principles and Practice Science at Work. Hooge Mierde, The Netherlands, p. 37. Viñuela-Fernández I Jones E Chase-Topping ME Price J 2011 Comparison of subjective scoring systems used to evaluate equine laminitis. Veterinary Journal 188, Visser EK Reenen CG Van Hopster H Schilder MBH Knaap JH Barneveld A Blokhuis HJ 2001 Quantifying aspects of young horses temperament: consistency of behavioural variables. Applied Animal Behaviour Science 74, Visser EK Reenen CG Van Werf JTN Van Der Schilder MBH Knaap JH 2002 Heart rate and heart rate variability during a novel object test and a handling test in young horses. Physiology & Behavior 76, Waiblinger S Boivin X Pedersen V Tosi M-V Janczak AM Visser EK Jones RB 2006 Assessing the human animal relationship in farmed species: A critical review. Applied Animal Behaviour Science 101, Welfare Quality Consortium 2009 Welfare Quality assessment protocol for cattle. Wemelsfelder F 2007 How animals communicate quality of life: the qualitative assessment of behaviour. Animal Welfare 16, Wemelsfelder F 2012 Assessing pig body language: Agreement and consistency between pig farmers, veterinarians, and animal activists. Journal of Animal Science 90, Wickens CL Heleski CR 2010 Crib-biting behavior in horses: A review. Applied Animal Behaviour Science 128, 1 9. Wolff A Hausberger M Le Scolan N 1997 Experimental tests to assess emotionality in horses. Behavioural Processes 40,

75 CHAPTER 3 - HORSES 72
76 Chapter 3 Horses DEVELOPMENT OF THE HORSE GRIMACE SCALE (HGS) AS A PAIN ASSESSMENT TOOL IN HORSES UNDERGOING ROUTINE CASTRATION Emanuela Dalla Costa 1, Michela Minero 1, Dirk Lebelt 2, Diana Stucke 2, Elisabetta Canali 1, Matthew C. Leach 3 1 Università degli Studi di Milano, Dipartimento di Scienze Veterinarie e Sanità Pubblica, Milan, Italy 2 Pferdeklinik Havelland / Havelland Equine Hospital, Beetzsee-Brielow, Germany 3 Newcastle University, School of Agriculture, Food & Rural Development, Newcastle Upon Tyne, United Kingdom Published in: PLoS ONE 9(3): e92281 Abstract The assessment of pain is critical for the welfare of horses, in particular when pain is induced by common management procedures such as castration. Existing pain assessment methods have several limitations, which reduce the applicability in everyday life. Assessment of facial expression changes, as a novel means of pain scoring, may offer numerous advantages and overcome some of these limitations. The objective of this study was to develop and validate a standardised pain scale based on facial expressions in horses (Horse Grimace Scale [HGS]). Forty stallions were assigned to one of two treatments and all animals underwent routine surgical castration under general anaesthesia. Group A (n= 19) received a single injection of Flunixin immediately before anaesthesia. Group B (n= 21) 73
77 Chapter 3 Horses received Flunixin immediately before anaesthesia and then again, as an oral administration, six hours after the surgery. In addition, six horses were used as anaesthesia controls (C). These animals underwent non-invasive, indolent procedures, received the same treatment as group A, but did not undergo surgical procedures that could be accompanied with surgical pain. Changes in behaviour, composite pain scale (CPS) scores and horse grimace scale (HGS) scores were assessed before and 8-hours post-procedure. Only horses undergoing castration (Groups A and B) showed significantly greater HGS and CPS scores at 8-hours post compared to pre operatively. Further, maintenance behaviours such as explorative behaviour and alertness were also reduced. No difference was observed between the two analgesic treatment groups. The Horse Grimace Scale potentially offers an effective and reliable method of assessing pain following routine castration in horses. However, auxiliary studies are required to evaluate different painful conditions and analgesic schedules. 74
78 Chapter 3 Horses Introduction The recognition and alleviation of pain is critical for the welfare of horses. Although considerable progress has been made in understanding physiology and treatment of pain in animals over the past 20 years, the assessment of pain in horses undergoing management procedures, such as branding, pin firing and castration, remains difficult and frequently suboptimal [1 4]. Equine castration is a husbandry practice routinely performed to: avoid undesired mating, facilitate handling, and reduce aggression and other undesirable behaviours. Annually, it is estimated that 240,000 horses are castrated in Europe [5]. Studies in other species demonstrate that animals experience pain and discomfort both acutely and chronically following castration [6,7]. Despite the limited research in horses, castration has been shown to be associated with some degree of pain that can persist for several days and, therefore, requires adequate analgesic treatment [2 4,8]. Price et al. [1] reported that only 36.9% of horses received analgesics for post operative pain, with one perioperative administration of Flunixin appearing to be one of the most common analgesic procedure provided following castration [9]: one possible explanation for this is the difficulty in assessing and quantifying pain in this species [2,10]. For example, even though castration of horses is a common procedure, no gold standard for pain assessment is available to date. As in other animal species, pain in horses is difficult to assess because of their inability to communicate with humans in a meaningful manner. This could be further compounded by horses potentially suppressing the exhibition of obvious signs of pain in the presence of possible predators (i.e. humans) as is suggested with other prey species. Several behaviour-based assessments of pain in horses already exist [11 17]. The Post Abdominal Surgery Pain Assessment Scale (PASPAS) is a multidimensional scale that can be used to quantify pain after laparotomy [14]. The Composite Pain Scale (CPS) focuses on the presence of pain-related behaviours 75
79 Chapter 3 Horses and the change in the frequency of normal behaviour patterns and physiological parameters [16] and has been successfully applied following both surgery (e.g. castration), injury and disease (e.g. laminitis, colic) [16,17]. However, behaviourbased assessments of pain are not without limitations that constrain their routine application. These include the need for trained and experienced observers [8,16,17], prolonged observation periods [18], particularly in conditions inducing only mild pain, and the palpation of the painful area in some cases [14,16,17]. Furthermore, many of the pain related behaviours described so far have been identified in response to what are perceived to be severely painful conditions (e.g. colic, laminitis [14,16]), rather than those that are perceived to be mildly to moderately painful conditions (e.g. identification procedures [19]). Recently, a new approach to pain assessment has been developed in rodents and rabbits utilising the assessment of facial expressions [20 23]. Facial expressions are commonly used to assess pain and other emotional states in humans, particularly in those who are unable to communicate coherently with their clinicians (e.g. those with cognitive impairment and neonates [24,25]). In humans, facial expressions are routinely scored both manually [25] and automatically [26] using the Facial Action Coding System (FACS), which is considered as an accurate and reliable method that describes the changes to the surface appearance of the face resulting from individual or combinations of muscle actions, referred to as action units [27]. Action units relating to pain have been identified in rodents and rabbits and incorporated into species-specific grimace scales [20 23]. These grimace scales are considered to give a number of advantages over other routinely used methods of assessing pain in animals. Firstly, grimace scales are less time consuming to carry out [20 23]. Secondly, observers can easily and rapidly be trained to use them [20 23]. Thirdly, grimace scales may utilise our potential tendency to focus on the face when scoring pain [28,29]. Fourthly, they can be used to effectively 76
80 Chapter 3 Horses assess a range of painful conditions, from mild to severe pain [20]. Finally, it can increase the safety of the observer when assessing pain in large animals, as grimace scales do not require the observer to approach the subject and palpate the painful area for the assessment. Therefore the Horse Grimace Scale (HGS) may offer an effective and practical method of identifying painful conditions and the efficacy of the methods we use to ameliorate pain in horses (i.e. analgesia administration). Furthermore, it can be applied in association with other behaviour-based methods to enhance the assessment of pain in horses and could be implemented in practice by owners and stable managers as an effective on farm early warning system. The objectives of this study were to develop and validate a standardised pain scale based on facial expressions in horses (Horse Grimace Scale) using routine castration, and to investigate whether the HGS could be successfully implemented with minimal training, enabling the development of an on-farm pain assessment tool. Castration was considered a suitable model for the development of HGS because it is amongst the most common management procedures carried out in veterinary practice. In addition, utilising animals that are undergoing routine castration for husbandry reasons allows the researchers to avoid carrying out a surgical procedure solely for the evaluation of a method of assessing postprocedural pain. Materials and methods Ethics statement Castration is a routinely conducted husbandry procedure that was carried out in compliance with the European Communities Council Directive of 24 November 1986 (No. 86/609/EEC). This study was registered as an animal experiment at the Brandenburg State Veterinary Authority (V A ). Horses involved 77
81 Chapter 3 Horses in this study underwent routine veterinary procedures for health or husbandry purposes at the request of their owner on a voluntary basis. Consequently, no animals underwent anaesthesia or surgery or were directly used in order to record data for the purposes of this study. Verbal informed consent was gained from each participant prior to taking part in this research. Written consent was deemed unnecessary as no personal details of the participants were recorded. No animals received less than the standard analgesic regimen for the purposes of the study. This study employed a strict rescue analgesia policy: if any animal was deemed to be in greater than mild pain (assessed live by an independent veterinarian), then additional, pain relieving medication would immediately be administered and the animal removed from the study. The choice of medication and dosage would be based on the severity of pain identified thorough the clinical examination of the individual horse. Animals and Husbandry Forty stallions of different breeds, coat colour and aged between 1 and 5 years (mean age 2.3 years) underwent routine castration (see Table 1 for details). In addition, six horses of mixed age and gender that were undergoing general anaesthesia for different non-invasive and indolent procedures were used as a control group (see Table 2 for details). 78
82 Chapter 3 Horses Group (N) Breed (N) Age (Mean) Treatment A (19) Arabian horse (1) 2 German Warmblood (3) 2.6 Friesian (3) 1.7 Iceland pony (5) 2.6 Irish draught horse (1) 2 Polo horse (1) 2 Quarter horse (3) 2 Mini-Shetland pony (1) 2 Tennessee Walker horse (1) 2 Treatment B (21) German Warmblood (4) 2.5 Edles Warmblood (1) 1 Friesian (3) 1.7 Iceland pony (6) 2.5 Irish draught horse (1) 1 Polo horse (2) 1.5 Quarter horse (2) 2 Mini-Shetland pony (1) 4 Trakehner (1) 5 Table 1. Breed and mean age of the stallions of the two treatment groups. Sex Breed Age Procedure Mare Polo horse 7 control X-ray pelvis Mare German warmblood 14 control X-ray cervical Gelding Haflinger 3 hoof correction Gelding Haflinger 3 hoof correction Gelding Haflinger 4 teeth rasping Gelding Haflinger 2 hoof correction Table 2. Details of the horses of the control group. All animals were recruited from the hospital s clinical cases. In order to be included in this study, all the subjects had to be deemed healthy and without signs of cryptorchidism by an equine veterinarian after physical examination and behavioural evaluation. All horses were hospitalised in a veterinary clinic for 5 days to undergo castration or anaesthesia alone. In order to control for any possible 79

83 Chapter 3 Horses effect of stress related to being in a novel environment and separated from their peers, all the subjects were allowed to acclimatise to their new environment, clinicians and video cameras for 2 days prior to the beginning of the study. In order to control for any possible differences in behaviour between stallions, geldings and mares, the acclimation period before starting with data collection was the same for all the horses. All subjects were kept in the same housing and management conditions: they were housed in standard single horse boxes (4 x 3 m with an outside window, see Figure 1) on wood shavings (German Horse Span Classic, German Horse Pellets, Wismar, Germany), and in visual contact with other conspecifics. They were fed twice a day with hay (approx. 3 kg/100kg body weight per day) and water was provided ad libitum by automatic drinkers. Food was withheld from all horses for 8-hours before and 5 hours after anaesthesia (standard protocol for general anaesthesia [30]). In order to collect videos and images without disturbing the behaviour of the horses, two digital video cameras (Panasonic, HDC-SD99, Panasonic, Japan) were positioned on the top of the grate section on opposite sides of the box (see Figure 1). Figure 1. Video cameras position. The drawing in the middle (b) shows the position of the two HD cameras. Pictures on the left (a) and on the right (c) show frames grabbed from Cam1 and Cam2 respectively. Surgery and Analgesic Treatment Groups 80
84 Chapter 3 Horses Horses undergoing castration were divided into two breed-matched treatment groups using a blocked randomization process. Group A (N=19) received a single perioperative injection of Flunixin (1.1 mg/kg i.v., Flunixin 5%, medistar, Aschberg, Germany) approximately 5 minutes prior to anaesthesia immediately after administration of sedative drug. Group B (N=21) received a perioperative injection of Flunixin (1.1 mg/kg i.v.) as for group A and a subsequent oral application of Flunixin (Flunidol 5%, cp-pharma, Burgdorf, Germany, 1.1 mg/kg p.o.) 6 hours after castration. All the medications were administered by a veterinary nurse who was aware of group allocation; the veterinarians responsible for pain assessment were blinded to treatment group. Horses underwent routine surgery castration with closed technique through a scrotal approach without primary closure of the wound in dorsal recumbency under general anaesthesia [9], as recommended by the National Equine Welfare Council (NEWC) and the Canadian Veterinary Medical Association [31,32]. The surgeries were all carried out by one of two equally experienced veterinary surgeons. To investigate the impact of general anaesthesia on the HGS, a control group (C) of horses was recruited. The control horses (N=6) underwent the same general anaesthesia protocol as horses in groups A and B and received a single perioperative injection of Flunixin (1.1 mg/kg i.v.) 5 minutes prior to anaesthesia. All castrated horses also received antibiotic treatment for three days starting at the morning before surgery (Synutrim 72% Pulver, Vétoquinol, Ravensburg, Germany), 2-4 mg Trimethoprim and 12 mg Sulfadiazin /Kg p.os every 12h. Prior to the first drug application the weight of each horse was estimated with a weight tape in order for the correct drug doses to be administrated. The anaesthesia protocol was the same for all the subjects: pre-medication with Romifidine (Sedivet, Boehriger Ingelheim Vetmedica, Ingelheim, Germany, 80 micrograms Romifidinehydrochloride/Kg), induction with Diazepam (Diazepam-ratiopharm, Ratiopharm, Ulm, Germany,
85 Chapter 3 Horses mg/kg) and Ketamine (Ketamin 10%, medistar, Ascheberg, Germany, 2.2 mg/kg) intravenously via a jugular catheter. When necessary, general anaesthesia was maintained by another injection of Ketamine (1.1 mg/kg). Twenty-six out of 40 castrated horses (65%) and 2 out of 6 control horses (33.3%) needed a second injection of Ketamine to maintain an appropriate level of anaesthesia in order to complete the surgery or the non-invasive procedure; the duration of anaesthesia was comparable long all the subjects. Surgery lasted min, following which horses were moved to a recovery box; then, as soon as they were able to walk (20-60 minutes after anaesthesia), returned to their home box. Recovery from anaesthesia is the time that a horse need to stand up; it strongly depends on individual differences and it does not necessarily reflect the duration of previous anaesthesia. Horses recovered from anaesthesia without assistance inside the recovery box under visual supervision of a veterinary nurse. No intra-operative complications were reported and all horses recovered from anaesthesia fully and uneventfully prior to the first data collection post-procedure. All surgeries/general anaesthesia were carried out between 9 and 11am. Pain Assessment At each time interval an overall pain assessment was conducted by two trained veterinarians blinded to treatment group using a Composite Pain Scale (CPS) (see Table S1) based on the one developed by Bussieres and colleagues [16,17] and adapted according to Søndergaard and Halekoh [33]. 82
86 Chapter 3 Horses Data Criteria Score Behaviour Posture Normal movements, stands quietly with equal weight distribution 0 among all four legs or stand-resting with weight distribution among only three legs Occasional weight shift, temporarily showing discharge positions, 1 slight muscle tremors Non-weight bearing, abnormal weight distribution 2 Analgesic posture (attempts to urinate), prostration, muscle tremors 3 Sweating No obvious signs of sweat 0 Damp to the touch 1 Wet to the touch, beads of sweat are apparent over the horse s body 2 Excessive sweating, beads of water running off the animal 3 Kicking at Quietly standing, no kicking 0 abdomen Occasional kicking at abdomen (1 2 times/5 min) 1 Frequent kicking at abdomen (3 4 times/5 min) 2 Excessive kicking at abdomen (>5 times/5 min), intermittent attempts 3 Pawing on the floor to lie down Quietly standing, no pawing 0 Occasional pawing (1 2 times/5 min) 1 Frequent pawing (3 4 times/5 min) 2 Excessive pawing (>5 times/5 min) 3 Movement Stands relaxed or quiet movement 0 Reduced movement or mild agitation 1 Reluctance to move or moderate agitation 2 Refusal of movement or uncontrollable forwards movement 3 Head Natural head movements, head straight ahead for the most part 0 movement / Intermittent head movements laterally or vertically, looking at flanks 1 Notable gesture (1 2/5 min), lip curling (1 2/5 min) Intermittent and rapid head movements laterally or vertically, 2 frequent looking at flank (3 4/5 min), lip curling (3 4/5 min) Continuous head movements, excessively looking at flank (>5 times/5 min), lip curling (>5 times/5 min) Appetite Eats hay readily or is not allowed to eat hay 0 Hesitates to eat hay 1 Shows little interest in hay, eats very little or takes hay in mouth but 2 does not chew or swallow Neither shows interest in nor eats hay
87 Chapter 3 Horses Auditory Pays attention to people and noises 0 stimulus Exaggerated response to auditory stimulus 1 (click one s Excessive-to-aggressive response to auditory stimulus 2 tongue) Stupor, prostration, no response to auditory stimulus 3 Touch response Contacting, no defence reaction to touch 0 Mild defence reaction to touch 1 Resistance to touch 2 Violent defence reaction to touch 3 Physiology Heart rate bpm bpm bpm 2 > 60 bpm 3 Respiratory rate 8-13 breaths pm breaths pm breaths pm 2 > 18 breaths pm 3 Digestive Normal 0 sounds Decreased motility 1 No motility 2 Hypermotility 3 Rectal 36,9 38,5 C 0 temperature 36,4 36,9 C or 38,5 39,0 C 1 35,9 36,4 C or 39,0 39,5 C 2 35,4 35,9 C or 39,5 40,0 C 3 Table S1. Composite Pain Scale (CPS) based on the one developed by Bussieres and colleagues [16,17] used in this study to score pain. Video Recording Thirty-minute video sequences were recorded using 2 High Definition Cameras with a 28mm wide angle objective lens (Panasonic, HDC-SD99, Panasonic, Japan), the videos were recorded one day before procedure in the evening (baseline observation, pre-procedure) and at similar time 8-hours following procedure (8h post-procedure). The cameras were positioned at opposite sides of the box, on the 84
88 Chapter 3 Horses top of the grate section. This arrangement gave the highest probability of capturing the behaviour and face of the horse during filming without interfering with their normal behaviour (see Figure 1). Behavioural Recording Behaviour of horses undergoing castration was evaluated. For each video, the last 15 minutes were analysed. A focal animal continuous recording method [34] was used to describe the horse s activity. The frequency and duration of thirty categories of behaviour (see Table S2) was continuously recorded using Solomon Coder (beta , copyright by András Péter) by two trained treatment and session blind observers. Behaviours recorded as states (movement, licking and chewing, alertness, agitation, investigative behaviour, drinking, eating, lowered head carriage, head orientation, grooming) were reported as durations, and those recorded as events (weight-shifting, pawing, kicking, flank watching, rolling, yawning, masturbating, vocalization, urinating, defecating, tail swishing, flehmen) were reported as frequency of occurrence. Duration of maintenance behaviours showing the same pattern were added to form the composite maintenance behaviour score, comprising exploration, alertness and grooming. 85
89 Chapter 3 Horses Behaviour Description Movement Stand Standing up on all four feet or with one hind leg relaxed Walk Walking in the box Trot Trotting a few steps Back up Walking backwards Not visible Horse is not visible (or it is not possible describe what is doing) Activity Alert Paying attention to environmental stimuli (e.g. looking at, moving ears) Agitation Continuous and frantic movement (e.g. back and forth or in circle) Investigative behaviour Sniffing, licking, biting an object (e.g. box door, window) Grooming Self-grooming (e.g. rubbing and/or scratching) Masturbating Flexing its erected penis repeatedly upwards against his belly and maybe makes pelvic thrusts Eating Eating Drink Drinking Urinate Urinating Defecate Defecating Vocalize Whinny, scream and/or snort Yawning Deep, long inhalation with mouth widely opened, with jaws either directly opposed or moved from side to side Licking and chewing Pulling the tongue back and forth alternately with chewing Pain-related behaviours Weight-shifting Shifting weight from one hind leg to the other. Feet may not actually leave the ground One foreleg is lifted from the ground slightly, and then extended quickly in a Pawing the floor forward direction, followed by movement backward dragging the toe against the ground in a digging motion Kicking the abdomen Evident raising a hind leg and moving it towards the abdomen (it may reach it or not) Flank watching Turning head and neck to one flank; not always associated with touching the flank Lowered head The head is held below a virtual line passing through the withers, the horse is carriage not eating. Rolling Dropping from standing to sternal recumbency, then rotating from sternal to dorsal recumbency, tucking the legs against the body Tail swishing Quick swish of the tail Flehmen With the head and neck stretched upwards, the horse curls the upper lip back until the inside of the lip, the gums and the upper incisors are bared Head orientation Window Head is directed towards the window Neighbour box Head is directed towards the neighbour box Corner Head is directed towards the corner Alley Head is directed towards the alley Not oriented Head is not directed towards something Not visible Head is not visible Table S2. Ethogram of horse for manual behaviour analysis. 86
90 Chapter 3 Horses Horse Grimace Scale (HGS) Recording The HGS was created following the methods developed by Langford et al. [20] and Sotocinal et al. [21] for rodents and Keating et al [23] for rabbits. Changes in horse behaviour and facial expressions were identified using a pilot study [8] following eight stallions undergoing surgical castration with the same anaesthetic and analgesic protocol as used in the main study. According to the published literature [2,4] and pilot study results [8], 8-hours post-castration was deemed the appropriate time interval between observations as this was when the most of the pain related behaviours were observed. Furthermore, the estimated duration of sedation from pre-medication drugs and anaesthetics used in this study should have subsided at 8-hours post-intervention [35 37]. Still images were extracted from each video sequences whenever the horse was found in a position with the head and face clearly visible. This enabled a number of clear and high quality images to be extracted. Each image was then cropped so that only the head of the horse was visible to prevent observers from being biased by the body of the animal when looking at each image. Images of each subject before and 8-hours after surgery were compared to identify changes in facial expressions associated with these procedures by a trained treatment blind observer experienced in assessing facial expressions in other species (MCL). Based on these comparisons, the Horse Grimace Scale (HGS) was developed, and comprises six facial action units (FAUs): stiffly backwards ears, orbital tightening, tension above the eye area, prominent strained chewing muscles, mouth strained and pronounced chin, strained nostrils and flattening of the profile (see Figure 2). 87
.")
91 Chapter 3 Horses Figure 2. Horse Grimace Pain Scale (HGS). The Horse Grimace Pain Scale with images and explanations for each of the 6 facial action units (FAUs). Each FAU is scored according to whether it is not present (score of 0), moderately present (score of 1) and obliviously present (score of 2). 88
92 Chapter 3 Horses One hundred and twenty six images were randomly selected by a non-participating assistant with no experience of assessing pain in horses for further scoring (63 pre and 63 post procedure images). In order to maintain a balanced design for the statistical analysis, the image set comprised 1 or 2 pictures of each horse pre and 8- hours post procedure (e.g. lateral images pre and post and frontal images pre and post). The 126 images were then scored in a random order using the Horse Grimace Scale by five treatment and session (pre or post-surgery) blind observers. A detailed hand out with the description of the six identified FAUs and the scoring system was distributed to the observers (see Figure 2). Briefly, for each image each observer was asked to give a score for each of FAU using a 3-point scale (0 = not present, 1 = moderately present, 2= obviously present). If the participant was unable to score a particular FAU clearly, they were asked to score it as I don t know. The Horse Grimace Scale (HGS) score was determined by adding the individual scores for each of the six action units identified (stiffly backwards ears, orbital tightening, tension above the eye area, prominent strained chewing muscles, mouth strained and pronounced chin and strained nostrils and flattening of the profile) in each image. Consequently, the maximum possible HGS score was 12 (i.e. a score of 2 for each of the 6 FAUs). In addition, the observers were asked to make a global pain judgment for each picture (no pain vs. pain) based upon their own clinical experience. If they deemed the individual to be in pain, then they were asked to score the intensity of that pain (mild, moderate or severe). In order to explore the effect of time (pre vs. post-procedure) and treatment (analgesia and surgery), the mean HGS scores were calculated for each image across all participants. 89
93 Chapter 3 Horses Observer selection Five observers were selected as they had expertise either with horses or scoring facial expressions. The observers had diverse backgrounds including horse welfare researchers, veterinary surgeons, research scientists and veterinary students. Statistical analysis All statistical analyses were conducted using SPSS 19 (SPSS Inc., Chicago, USA). Differences were considered to be statistically significant if P The data were tested for normality and homogeneity of variance using Kolmogorov-Smirnov and Levene test, respectively. CPS and HGS scores were not normally distributed and therefore the scores were transformed using square root transformation. Repeated Measures General Linear Model (RGLM) was used to analyse the data with the time points (pre and 8-hours post-procedure) as the within-subjects factor and the treatment group as the between-subjects factor. Any treatment effects were further investigated using analysis of variance (ANOVA) with data from the separate time periods forming the dependent variables and treatment as the fixed effect. Post-hoc analysis of treatment group effects was conducted using Bonferroni post-hoc test. The reliability of HGS scale was determined using inter-class correlation coefficient (ICC) to compare mean scores for each of the facial action units across all the participants. Accuracy was determined by comparing the global pain and no pain judgement made by the treatment and period blind observers with actual pain state of the horse in each photograph. The reliability of the Composite Pain Scale scores were analysed using an inter-class correlation coefficient (ICC). Reliability of the manual behaviour analysis was assessed by means of independent parallel coding of a random sample of videotaped sessions (5 clips) using percentage agreement. Wilcoxon test was conducted to determine differences in behaviour 90
94 Chapter 3 Horses shown before and 8 hour after procedure. Spearman correlation coefficients were calculated to investigate the relationship between the CPS, HGS and behaviour. Results During this study, no horses required the administration of rescue analgesia or had to be removed from the study due to adverse events. Horse Grimace Scale (HGS) Time, treatment and time*treatment interaction had significant effects on HGS score (RGLM, P=0.000, P=0.007 and P=0.000, respectively; 2 =0.03). In the preprocedure period there was no significant difference between the three treatments (ANOVA, P=0.84; 2 =0.00). At eight-hours post-procedure the HGS score was significantly different between the three treatments (ANOVA, P=0.000; 2 =0.11), with the HGS score being significantly higher in horses undergoing routine castration (Groups A and B) compared to the control group (Group C) (Bonferroni post-hoc, P=0.000 for both comparisons). No significant differences were found between groups with the single (A) or multiple (B) Flunixin administration (Bonferroni post-hoc, P=1.000) (see Figure 3). Example images and associated HGS scores of horses in groups undergoing castration compared to control are shown in Figure 4. 91
 for horses undergoing routine castration (A and B), and anaesthesia control group (C) with the pre and 8-hours post-procedure recordings on the x-axis")
95 Chapter 3 Horses Figure 3. Mean Horse Grimace Scale (HGS) scores pre and 8-hours post-procedure. HGS scores are presented on the y-axis (± 1 SE) for horses undergoing routine castration (A and B), and anaesthesia control group (C) with the pre and 8-hours post-procedure recordings on the x-axis (** P=0.000). Figure 4. Example images and HGS scores. Example images and associated HGS scores of the same horse pre (a; c) and 8-hours post-procedure (b; d). Images a and b underwent castration; c and d were control animals. Total observation time was approximately 40 minutes for scoring all the pictures. The average accuracy of global pain judgement was 73.3%, with false positives 92
96 Chapter 3 Horses being slightly more prevalent (17.0%) than misses (false negatives) (9.8%). Individual accuracy of participants varied from 67.5% to 77.8%. The Horse Grimace Scale demonstrated high inter observer reliability with an overall Intraclass Correlation Coefficient (ICC) value of The individual action units comprising the HGS also showed high ICC values of: 0.97 for stiffly backwards ears, 0.83 for orbital tightening, 0.86 for tension above the eye area, 0.88 for prominent strained chewing muscles, and 0.72 for mouth strained and pronounced chin. The only exception was for strained nostrils and flattening of the profile (ICC = 0.58). On average, all the six facial action units (FAUs) were assessed easily by all the participants, as shown by the percentage of not able to score ranging from 0% for ear position to 21% for the tension above eye and strained mouth and pronounced chin (see Table 3). Front-view images were more difficult to score than profile view images, in particular for the evaluation of prominent strained chewing muscles and mouth strained and pronounced chin (46% and 81% respectively of not able to score ). In profile view images, horses with darkbrown or black coats were more difficult to score than grey and light brown coat, especially for the orbital tightening and prominent strained chewing muscles (12% and 16% respectively). Facial Action Units (FAUs) Not able to score (%) Stiffly backwards ears 0 Orbital tightening 9 Tension above the eye area 21 Prominent strained chewing muscles 15 Mouth strained and pronounced chin 21 Strained nostrils and flattening of the profile 8 Table 3. The percentage of not able to score for each Facial Action Unit identified. Composite Pain Scale (CPS) 93
97 Chapter 3 Horses Time, treatment and time*treatment interaction had significant effects on CPS score (RGLM, P=0.002, P=0.002 and P=0.050, respectively; 2 =0.28). In the preprocedure period there was no significant difference between the treatments (ANOVA, P=0.65; 2 =0.02). At eight-hours post-procedure the CPS score was significantly different between the three treatments (ANOVA, P=0.000; 2 =0.41), with the CPS score being significantly higher in horses undergoing routine castration (Groups A and B) compared to the control group (Group C) (Bonferroni post-hoc, P=0.000 for both comparisons). No significant differences were found between groups with the single (A) or multiple (B) Flunixin administration (Bonferroni post-hoc, P=1.000) (see Figure 5). The CPS demonstrated good inter observer reliability between the two analgesic treatment blind observers with an overall ICC of Figure 5. Mean Composite Pain Scale (CPS) scores pre and 8-hours post-procedure. CPS scores are presented on the y-axis (± 1 SE) for horses undergoing routine castration (A and B), and anaesthesia control group (C) with the pre and 8-hours post-procedure recordings on the x-axis (** P=0.000). 94
98 Chapter 3 Horses Behaviour analysis Percentage agreement between the 2 observers was more than 80% for all the behaviours. Many of the pain related behaviours were observed too infrequently to be meaningfully analysed. Low head carriage showed a tendency to increase in duration at 8-hours after castration (Wilcoxon, P=0.068) compared to baseline. Duration of exploration and alertness significantly decreased at 8-hours postcastration (Wilcoxon, P=0.000 and P=0.008, respectively) compared to baseline. The composite maintenance behaviour score (comprising the sum of the duration of exploration, alertness and grooming) significantly decreased at 8-hours postsurgery (148.1±21.7 sec) compared to pre (363.5±36.4 sec) (Wilcoxon, P=0.000). There was no significant effect of treatment A or B on either maintenance or pain related behaviours. Total observation time needed to analyse all the videos was approximately 20 hours. Relationship between behaviour, CPS and HGS The HGS score was correlated positively with the CPS score (Spearman correlation, r=0.580, P=0.000) and negatively with duration of explorative behaviour (Spearman correlation, r=-0.461, P=0.002). The HGS score was negatively correlated with the composite maintenance behaviour score (Spearman correlation, r=0.508, P=0.001). Discussion Despite the severity of pain associated with routine castration in horses being contentious [10,38,39], the findings of previous studies [2 4,40] have demonstrated that this procedure is associated with some degree of pain. An untreated control group undergoing castration without any analgesic treatment was 95
99 Chapter 3 Horses not included in this study for both ethical and welfare reasons, as pain can cause a long lasting welfare issue in horses [40]. Although better balanced control group would be preferable, the control group used in this study to evaluate the effect of general anaesthesia on HGS was similar (in size, age, sex, and clinical conditions) to control groups presented in other scientific studies on the assessment of pain in horses [14,17]. As general anaesthesia for horses is not without risks for health and welfare [41], recruit more horses or healthy stallions to have a more homogenous control group would be questionable for both ethical and welfare reasons. This study has identified changes in facial expressions in horses undergoing surgical castration that appear to be similar to those previously described in other species [20 23], with some subtle variation due to differences in the species subjected to a variety of painful conditions. Changes in ear position, orbital tightening and some tension in the chewing muscles are largely similar to those described in other grimace scales [20 23]. In this study, differences in Horse Grimace Scale scores were observed following a routine surgical castration, with an increase in scores from pre to 8-hours post-procedure. Importantly, no differences in the HGS scores were found in control horses, undergoing general anaesthesia for non-invasive procedures, demonstrating that general anaesthesia has no effect on the HGS. Pain related behaviours and physiological parameters assessed using the Composite Pain Scale [16,17] showed a similar pattern to that of the HGS, with only horses undergoing routine castration exhibiting differences in score between the pre and 8-hours post-surgery periods. Low mean CPS scores in relation to the maximum possible score were likely due to the fact that an analgesic treatment was administrated to all the castrated horses and that the CPS was originally developed for a broad spectrum of pain intensities (e.g. orthopaedic pain). Our results confirm the findings of other authors [4] that duration of exploration and alertness decreased in horses between pre and 8-hours post-surgical procedure. The horses 96
100 Chapter 3 Horses showing high HGS scores also exhibited high Composite Pain Scale scores and low duration of explorative behaviour, alertness and grooming 8-hours postsurgery. Differently from other species (e.g. dogs, mice), grooming in horses was never reported to be linked to stress or suffering; whilst several authors reported that, in healthy horses, a considerable portion of the daily time budget can be consumed with grooming [42,43]. It has been clearly demonstrated previously that pain in horses can be expressed through the exhibition of general non-specific indicators such as decrease in normal activity, lowered head carriage, fixed stare, rigid stance and reluctance to move [4,15]. In a preliminary study on castration pain in horses, Eager and colleagues also found that grooming decreased six hours post-operatively[44]. In the present study horses undergoing routine castration showed the tendency to keep their head in a lower position 8-hours post-surgery. Although non-specific behavioural indicators of pain in equids are considered not to correlate strictly with severity of pain [15], the tendency to carry the head below the withers is of relevance because several authors reported that lower head carriage is shown in case of chronic or severe pain [18,45]. The results of this study demonstrate that the HGS is a potentially effective method of assessing castration related pain in horses. Horse Grimace Scale scores significantly increased from pre to post castration and were unaffected by anaesthesia alone indicating that the action units relate directly to post procedure pain and/or distress. As there was no difference in the HGS between the two analgesic treatment groups, we are unable to fully differentiate between post-procedure pain and distress in this study. However, the significant difference between control and treatment groups and correlation between HGS, CPS and some non-specific behavioural indicators of pain suggest that the action units comprising the HGS are likely to change in response to pain. There are two potential explanations for lack of difference in HGS scores between those horses receiving a single pre-operative 97
101 Chapter 3 Horses administration (Group A) and those receiving a pre and post-operative administrations (Group B) of Flunixin. It is possible that both the HGS and CPS were insufficiently sensitive to discriminate between effects of the analgesic schedules used. Alternatively, the two administrations of 1.1 mg/kg of Flunixin 6 hours apart (i.e. pre and post operatively) may not provide greater pain relief than a single pre-operative administration. Duration of pain relief of Flunixin is contradictory, Johnson et al. [46] found that additional Flunixin was needed 12,8±4,3h after surgery, for this reason we decided to give a second dose of Flunixin before the 8-hour measurement (12,8-4,3 = 8,5 h minus time for oral absorption of Flunixin). As we did not include untreated control group undergoing castration without any analgesic treatment in this study for ethical and welfare reasons we are unable to provide insight into which explanation is correct. Therefore, further studies investigating the HGS, CPS and behavioural indicators of pain as well as the efficacy of 1.1 mg/kg of Flunixin and other analgesics with routine castration are needed to answer the above question. The overall accuracy of the HGS (73.3%) was slightly lower than that of the other grimace scales (97% for the mouse grimace scale [20], 82% for the rat grimace scale [21], and 84% for the rabbit grimace scale [23]). The most likely explanation for this, is a combination of a slightly lower quality for some of the images used compared to those scored in other grimace scales and considerable variation in coat colour of the horses observed. Coat colour of the horse combined with the quality of some of the images meant that dark horses were often more difficult to score than those with lighter coats, especially if the background was dark. This issue has already been observed in mice [20,47] where the higher the quality of the images and a contrasting background allowed the observers to more accurately score the images. Four out of six control horses had a light coat which allowed easier scoring 98
102 Chapter 3 Horses meaning that the finding that the control horses did not present any differences in HGS before and after anaesthesia is highly reliable. The inter observer reliability (as measured by inter-class correlation coefficients [ICC]) of the overall HGS and its component action units was similar to those of the mouse grimace scale (0.90) [20], rat grimace scale (0.90) [21] and rabbit grimace scale (0.91) [23]. As with other grimace scales applied to animals (e.g. rodents & rabbits), the observers in this study gave images of the horses in a nonpainful state (e.g. pre-procedure) low but not zero scores which is inevitable when using a scale that is a composite of six individual action units. In a non-painful state these action units can be observed occasionally in isolation at a low intensity (score of 1 rather than 2), for example if an image is taken of a horse as it blinks, then an observer may give orbital tightening a score of 1 or 2 but it is likely that they will score 0 for all the other action units. It is unlikely that HGS scores lower than two were due to stress related to being in a novel environment as all the horses were acclimated to the new environment. Using the Horse Grimace Scale to score horses live rather than from images will help to solve this issue. The use of Horse Grimace Scale for scoring post-operative pain has distinct advantages over that of manual behaviour analysis, which can be complex due to the a greater number of behaviours that potentially need to be scored. Behaviour-based assessments appear to be more time-consuming to conduct (analysis time was 20 hours for behavioural based assessment compared to 40 minutes for the HGS). Furthermore, changes in facial expressions in the horses were detectable, without the need of approaching the subject, and by observers with differing expertise with only the HGS manual for guidance. The HGS requires some further validation for assessing post castration pain (for instance in horse with administration of flunixin compared to horses with flunixin associated with an opioid post-surgery, considering longer follow up intervals) and 99
103 Chapter 3 Horses could be further developed for other potentially painful procedures before it can be considered fully validated. Further studies could also be conducted to identify facial action units associated with other states such as fear and anxiety so that we are able to differentiate pain from these other states. Among the limitations of other routinely used methods of assessing pain in horses, there is considerable concern that prey species have evolved the ability to mask obvious signs of pain under specific circumstances (i.e. the presence of a predator such as humans). In humans it has been demonstrated pain related facial expressions cannot be completely suppressed by voluntary control [28] and in another prey species, for example the rabbit, it has been demonstrated that facial expressions are an easy and reliable cage-side method of assessing acute pain associated with ear tattooing in the presence of an observer [23]. It has been shown that humans tend to focus on head and face when assessing pain in humans [28] and rabbits [29] therefore this method could represent a reliable and feasible method that utilises the natural human instinct. Furthermore, HGS could be used as an animal-based indicator of spontaneously emitted pain, and it may provide insights into the experience of pain in horses in their own environment, and so be a useful tool in the assessment of horse welfare on-farm. Even though further evaluation of the HGS is required, the present results suggests that HGS may offer a reliable tool for assessing postcastration pain than other routinely used methods. Acknowledgements The authors would like to thank Dr Dario Polli, Dr Alessandra Torraco and Dr Giulia Borino for assistance with video analysis, the 5 observers for their help and assistance in scoring the pictures, and Miss Mareile Große Ruse, University of Lund, Sweden, for her assistance in statistical analysis. 100
104 Chapter 3 Horses The authors also would like to thank horse owners, the colleagues and the personnel of the clinics who patiently helped us with horses during the experiments. 101
105 Chapter 3 Horses References 1. Price J, Eager RA, Welsh EM, Waran NK (2005) Current practice relating to equine castration in the UK. Research in Veterinary Science 78: Love EJ, Taylor PM, Clark C, Whay HR, Murrell J (2009) Analgesic effect of butorphanol in ponies following castration. Equine Veterinary Journal 41: Maassen E, Gerhards H (2009) Equine castration: comparison of treatment with phenylbutazon, Traumeel and control group. Pferdeheilkunde 25: Sanz MG, Sellon DC, Cary JA, Hines MT, Farnsworth KD (2009) Analgesic effects of butorphanol tartrate and phenylbutazone administred alone and in combination in young horses undergoing routine castration. JAVMA 235: European Horse Network (2010) Key Figures. Available: 6. Molony V, Kent J (1997) Assessment of acute pain in farm animals using behavioral and physiological measurements. Journal of animal science: Available: Accessed 30 January Llamas Moya S, Boyle LA, Lynch PB, Arkins S (2008) Effect of surgical castration on the behavioural and acute phase responses of 5-day-old piglets. Applied Animal Behaviour Science 111: doi: /j.applanim Dalla Costa E, Rabolini A, Scelsa A, Ravasio G, Pecile A, et al. (2010) Behavioural indicators of pain in horses undergoing surgical castration. Proceedings of the 46th Congress of the International Society for Applied Ethology. Vienna, Austria. p Searle D, Dart AJ, Dart CM, Hodgson DR (1999) Equine castration: review of anatomy, approaches, techniques and complications in normal, cryptorchid and monorchid horses. Australian Veterinary Journal 77: Flecknell P, Raptopoulous D, Gasthuys F, Clarke K, Johnston G, et al. (2001) Castration of horses and analgesia. Veterinary Record 149: Viñuela-Fernández I, Jones E, Chase-Topping ME, Price J (2011) Comparison of subjective scoring systems used to evaluate equine laminitis. Veterinary Journal 188:
106 Chapter 3 Horses 12. Pritchett L, Ulibarri C (2003) Identification of potential physiological and behavioral indicators of postoperative pain in horses after exploratory celiotomy for colic. Applied Animal Behaviour Science 80: Love EJ (2009) Assessment and management of pain in horses. Equine Veterinary Education 21: Graubner C, Gerber V, Doherr M, Spadavecchia C (2011) Clinical application and reliability of a post abdominal surgery pain assessment scale (PASPAS) in horses. Veterinary Journal 188: Ashley FH, Waterman-Pearson AE, Whay HR (2005) Behavioural assessment of pain in horses and donkeys: application to clinical practice and future studies. Equine Veterinary Journal 37: Bussières G, Jacques C, Lainay O, Beauchamp G, Leblond A, et al. (2008) Development of a composite orthopaedic pain scale in horses. Research in veterinary science 85: Van Loon J, Back W, Hellebrekers LJ, van Weeren PR, Loon JPAM Van, et al. (2010) Application of a Composite Pain Scale to Objectively Monitor Horses with Somatic and Visceral Pain under Hospital Conditions. Journal of Equine Veterinary Science 30: Price J, Catriona S, Welsh EM, Waran NK (2003) Preliminary evaluation of a behaviour-based system for assessment of post-operative pain in horses following arthroscopic surgery. Veterinary anaesthesia and analgesia 30: Erber R, Wulf M, Becker-Birck M, Kaps S, Aurich JE, et al. (2012) Physiological and behavioural responses of young horses to hot iron branding and microchip implantation. Veterinary Journal 191: Langford DJ, Bailey AL, Chanda ML, Clarke SE, Drummond TE, et al. (2010) Coding of facial expressions of pain in the laboratory mouse. Nature methods 7: Sotocinal SG, Sorge RE, Zaloum A, Tuttle AH, Martin LJ, et al. (2011) The Rat Grimace Scale: a partially automated method for quantifying pain in the laboratory rat via facial expressions. Molecular Pain 7: 55. Available: Accessed 7 November Leach MC, Klaus K, Miller AL, Scotto di Perrotolo M, Sotocinal SG, et al. (2012) The assessment of post-vasectomy pain in mice using behaviour and the Mouse Grimace Scale. PloS one 7: e Available: Accessed 31 January Keating SCJ, Thomas A a, Flecknell P a, Leach MC (2012) Evaluation of EMLA cream for preventing pain during tattooing of rabbits: changes in physiological, behavioural and facial expression responses. PloS one 7: 103
107 Chapter 3 Horses e Available: Accessed 31 January Grunau R, Craig K (1987) Pain expression in neonates: facial action and cry. Pain 28: Jordan A, Hughes J, Pakresi M, Hepburn S, O Brien JT (2011) The utility of PAINAD in assessing pain in a UK population with severe dementia. International journal of geriatric psychiatry 26: Ashraf AB, Lucey S, Cohn JF, Chen T, Ambadar Z, et al. (2009) The Painful Face - Pain Expression Recognition Using Active Appearance Models. Image and vision computing 27: Ekman P, Friesen W (1978) Facial action coding system: a tecnique for the measurament of facial action. Consulting. Palo Alto. 28. Williams ACDC (2002) Facial expression of pain: an evolutionary account. The Behavioral and brain sciences 25: Leach MC, Coulter CA, Richardson CA, Flecknell PA (2011) Are we looking in the wrong place? Implications for behavioural-based pain assessment in rabbits (Oryctolagus cuniculi) and beyond? PloS one 6: e Available: Accessed 4 July Hall CW, Clarke KW (1983) Veterinary anesthesia, 8th edition. 31. Canadian Veterinary Medical Association (2006) Castration of horses, donkeys, and mules - Position statement. Available: National Equine Welfare Council, (NEWC) (2009) Equine Industry Welfare Guidelines Compendium for Horses, Ponies and Donkeys. Available: Brochure-09.pdf. 33. Søndergaard E, Halekoh U (2003) Young horses reactions to humans in relation to handling and social environment. Applied Animal Behaviour Science 84: doi: /j.applanim Martin P, Bateson P (2007) Measuring Behaviour: An Introductory Guide. 3rd ed. Cambridge University Press, Cambridge, Massachusetts, USA. 35. England GCW, Clarke KW (1996) Alpha2 adrenoceptor agonists in the horse A review. British Veterinary Journal 152: Figueiredo J, Muir W (2005) Sedative and analgesic effects of romifidine in horses. International Journal of Applied Research in Veterinary Medicine 3:
108 Chapter 3 Horses 37. Muir WW, Sams R a, Huffman RH, Noonan JS (1982) Pharmacodynamic and pharmacokinetic properties of diazepam in horses. American journal of veterinary research 43: Capner C (2001) Castration of horses and analgesia. Veterinary Record 149: Jones R (2001) Castration of horses and analgesia. Veterinary Record 149: Heleski MC, Cinq-Mars D, Merkies K (2012) Code of practice for the care and handling of equines: review of scientific research on priority issues. Available: Accessed 29 January Bidwell L a, Bramlage LR, Rood W a (2007) Equine perioperative fatalities associated with general anaesthesia at a private practice--a retrospective case series. Veterinary anaesthesia and analgesia 34: Available: Accessed 10 February Mcdonnell SM (2003) A practical field guide to horse behavior. The Equid Ethogram. Eclipse Press. 43. McGreevy P (2004) Equine Behaviour. Saunders, London, UK. 44. Eager R (2002) Preliminary investigations of behavioural and physiological responses to castration in horses University of Edinburgh. 45. Taylor PM, Pascoe PJ, Mama KR (2002) Diagnosing and treating pain in the horse. Where are we today? The Veterinary Clinics of North America Equine Practice 18: Johnson C, Taylor P, Young S, Brearley J (1993) Postoperative analgesia using phenylbutazone, flunixin or carprofen in horses. Veterinary Record 133: doi:doi: /vr Scotto di Perrotolo M, Miller A, Leach M, Flecknell P (2010) Mesure de la fiabilité et de la précision des expressions faciales pour évaluer la douleur chez la souris. Sciences & Techniques de l Animal de Laboratoire (STAL) 36:
109 Chapter 3 Horses VALIDATION OF A FEAR TEST IN SPORT HORSES USING INFRARED THERMOGRAPHY Dai Francesca 1*, Cogi Nathalie Hélène 1, Heinzl Eugenio Ugo Luigi 1, Dalla Costa Emanuela 1, Canali Elisabetta 1, Minero Michela 1 1 Dipartimento di Scienze Veterinarie e Sanità Pubblica, Università degli Studi di Milano, Via Celoria 10, Milano, Italy Submitted to: Journal of Veterinary Behavior (accepted with minor revisions) Abstract The aim of our research was to assess feasibility and validity of a fear test in adult sport horses and to investigate whether the exposure to a fearful stimulus induces a change in eye temperature. Fifty horses aged 14±6 years of different breed and gender entered the study. For each horse, a caretaker was asked to fill in a validated temperament questionnaire. A novel object fear test (NOT), has been selected from literature to examine fearfulness. Temperature of the lacrimal caruncle was measured pre-test and post-test on 22 horses, representative of the whole sample. In order to assess discriminant validity of the NOT three humananimal relationship tests were performed on the same horses. Data were analyzed with descriptive, non-parametric and multivariate statistic methods. No significant differences were found between female and geldings for any of the measured variables. Horses that were described by caretakers as more prone to panic, 106
110 Chapter 3 Horses vigilant, excitable, skittish and nervous (p < 0.001), needed significantly longer time to re-approach the novel object (p < 0.01). Eye temperature was significantly higher after the NOT compared to basal (p < 0.01), with subjects who did not reapproach the novel object tending to present larger increases (p < 0.10). Horses showing more fear related responses to the NOT did not show more negative reactions to humans during the human-animal tests. These results suggest that, to some extent, the NOT predicts horses behaviour in real on-farm situations. Our findings reject the hypothesis that reactivity to humans and general fearfulness belong to the same basic feature of temperament. Importantly, infrared thermography proved to be useful in assessing physiological reactions of fear in horses. Keywords: fear test, horse, infrared thermography, validity, welfare 107
111 Chapter 3 Horses Introduction Fear in domestic animals has been defined by Boissy (1998) as a reaction of the perception of actual danger. Fear responses are characterized by behavioral and physiological modifications (Forkman et al., 2007): active defense (attack, menace), active flight (hiding, escape) and passive avoidance (freezing) are some of the behaviors that are frequently related to an underlying emotion of fear in animals (Erhard and Mendl, 1999). When experiencing fear, cardiovascular changes occur in different parts of the body with the ultimate effect of increasing perfusion pressure and redirecting blood follow to the Central Nervous System and skeletal musculature. Farm horses may be subject to different fearful events, for example, being transported and competing in different environments with novel stimuli and sounds (McGreevy and McLean, 2010), being approached by unfamiliar people or undergoing many diverse handling and management procedures. Horses, as prey animals, have a tendency to escape from frightening stimuli and may show flight reactions which can be dangerous for both horse and man (Christensen et al., 2008, 2005; McGreevy and McLean, 2010): Keeling (1999) demonstrated that in equitation sports, many serious human injuries occur as a result of unexpected horse fear reactions. Because owners often misunderstand the reason for the development of such behaviors in their horses, attempts at correcting them often involve suppression or punishment based approaches (Hothersall and Casey, 2012). Although repeated subjugation of undesirable fear responses may ultimately appear to solve the overt behavioral reaction, this method can cause short- or long-term stress (McGreevy and McLean, 2010) and can worsen the problem or lead to the development of alternative avoidance strategies such as abnormal behaviors (Hothersall and Casey, 2012). Besides possible problems caused by inappropriate human reactions to fear displays, a long-term negative emotional state related to fear can per se cause chronic stress and reduced 108
112 Chapter 3 Horses welfare (Dantzer and Mormede, 1983; Désiré et al., 2006; Minch et al., 2008; Willner et al., 1992). Due to the aforementioned reasons, it is blatantly obvious that fear in horses plays an important role in their welfare, and thus it is important that it is recognized and assessed accordingly. Various fear tests have been used to determine temperament characteristics in horses: novel object (e.g. Anderson et al., 1999; Christensen et al., 2008, 2005; Seaman et al., 2002; Visser et al., 2003b, 2002; Wolff et al., 1997a), novel arena (e.g. Le Scolan et al., 1997; Seaman et al., 2002; Wolff et al., 1997a), restraint and human fear tests (e.g. Le Scolan et al., 1997; Visser et al., 2003b, 2001; Wolff et al., 1997a). The novel object test (NOT) is an experimental situation where the animal is exposed to an unknown stimulus to provoke a fear reaction. Although it is not possible to attribute a given measure to any single emotion, time to approach the new stimulus appears to be one of the most appropriate indicators of fearfulness (Górecka-Bruzda et al., 2011; Wolff et al., 1997b). Feasibility under field conditions and ease and duration of fear tests are important characteristics for them to be applied as well as reliability and validity (Górecka-Bruzda et al., 2011). Validity means the degree to which a test measures what it purports to measure (Martin and Bateson, 1993; Weiblinger et al., 2006). Predictive validity measures the ability of an indicator to predict some later criterion (Cronbach and Meehl, 1955). In order to assess predictive validity of fear tests, different studies investigated their correlation with surveys via questionnaires which aimed to detect those characteristics of temperament in horses that influence their habitual behavior (e.g. Anderson et al., 1999; Le Scolan et al., 1997; Momozawa et al., 2007, 2003; Morris et al., 2002a, 2002b). Respondents were generally caretakers or riding teachers who were familiar with horses, thus their responses were based on long-term observation and were not influenced by a 109
113 Chapter 3 Horses temporary change in equine behavior, which may occur in behavioral tests (Momozawa et al., 2005). Discriminant validity analyzes the divergence between measures of conceptually unrelated concepts, for instance fear and human-animal relationship, and has seldom been evaluated for fear tests (Górecka-Bruzda et al., 2011; Visser et al., 2003b). Convergent validity regards the relationships between independent measures of the same conceptually related construct (Weiblinger et al., 2006). Assessment of convergent validity of fear tests usually considers whether their outcome is related to physiological changes due to fear. Some of the most frequently used physiological indicators are heart rate (e.g. Christensen et al., 2008; Momozawa et al., 2003), heart rate variability (e.g. Rietmann et al., 2004; Stewart et al., 2008c; Visser et al., 2002; von Borell et al., 2007), cortisol concentration (e.g. Anderson et al., 1999; Cook et al., 2001; Flauger et al., 2010; Stewart et al., 2008a) and Infrared Thermography (IRT). Infrared Thermography can be used to detect changes in peripheral blood flow (which causes changes in body heat) as a response to fear induced stress. Studies in different animal species have revealed that after a stressing event, the small areas around the posterior border of the eyelid and the caruncula lacrimalis change temperature; this area has rich capillary beds innervated by the sympathetic system (e.g. McGreevy et al., 2012; Stewart et al., 2009, 2007) and thus represents an ideal place for measuring local changes in blood flow resulting from tuning of the Autonomic Nervous System. Stewart et al. (2007) measured an increase in eye temperature in cows after intramuscular injection of ACTH, CRH and epinephrine. Research done on different species correlated increased eye temperature with cortisol concentrations in response to pain (Stewart et al., 2008b, 2008c), stress (Ludwig et al., 2007; Stewart et al., 2007; Valera et al., 2012) and fear (Stewart et al., 2008a). In a study on horses undergoing stressful situations Valera et al. (2012) found that the eye 110
114 Chapter 3 Horses temperature increased as a consequence of stress. Similar results were found by Hall et al. (2001) who found a higher eye temperature in horses lunged with the Pessoa Training Aid (held responsible for increasing the psychological stress during training) than horses without. Bartolomé et al. (2013), were able to demonstrate a correlation between an increase in heart rate and eye temperature after jumping competitions. Cook et al. (2001) investigated the underlying causes of increase in eye temperature in horses and found that it was correlated to activation of the HPA axis. To our knowledge changes in superficial temperature during fear exposure have never been studied before in horses. This study aims to assess the feasibility and predictive, convergent, discriminant validity of a fear test in adult sport horses and investigates whether the exposure to a fearful stimulus induces a thermographic change in eye temperature. Methods This study was conducted in agreement with ISAE ethical guidelines (ISAE Ethics Committee, 2002) on adult non-pregnant horses and no animals underwent more than minimal distress. In addition, if horses displayed any hyper-reactive behaviour that could compromise the horse or the assessors safety, the test was immediately stopped and the observer left the box (this was recorded as a result). 2.1 Animals Experiments took place from January to May 2013 at six different farms in North of Italy. A total of 50 adult riding horses (mean age 14±6 years) of different sex (30 geldings, 16 mares, 4 stallions) were used in the study. Horse breeds were variously distributed and comprised warmblood horses, draft horses and 111
115 Chapter 3 Horses thoroughbreds. All horses were stabled in single boxes with daily access to group paddocks for one-10 hours. Straw bedding was used on two farms, whereas horses were kept on wood shavings on the remaining three farms. Horses were fed three times a day with hay and concentrated industrial feed, depending on the type of activity they carried out. Water was provided ad libitum. 2.2 Questionnaire survey For each horse, a caretaker was asked to fill out a questionnaire developed and validated by Momozawa et al. (2005), containing 20 questions regarding horse temperament (table 2.1). The responses were ranked on a scale from one to nine, with one being the lowest rank for each item. 112
116 Chapter 3 Horses Items Description (This horse tends to...) 1-9 Nervousness become nervous about insects, noises, Calm Nervous etc. Concentration be trainable and undisturbed by the Poor Excellent environment Self-reliance be at ease if left alone away from the Restless At ease herd Trainability be trained easily and promptly Poor Excellent Excitability get excited easily Not excitable Excitable Friendliness be never aggressive or fearful Unfriendly Friendly toward people Curiosity be interested in novel objects and Rarely Frequently approach them Memory memorize what it learned or was trained Poor Excellent Panic get excited to an abnormal extent Never Frequently Cooperation be cooperative with a caretaker when Never Always handled Inconsistent emotionality Consistent Inconsistent be unpredictable from day to day Stubbornness be obstinate once it resists a command Obedient Stubborn Docility be docile in general Active Docile Vigilance be vigilant about surroundings Never Always Perseverance be patient with various stimuli Impatient Patient Friendliness interact with other horses in a friendly Unfriendly Friendly toward horses manner Competitiven be dominant in antagonistic encounters Subordinate Dominant ess with other horses Skittishness get surprised easily Not skittish Skittish Timidity be timid in a novel environment Audacious Timid Trailer entrance go easily through the trailer door Rarely Always Table Questionnaire items from Momozawa et al Behavioral tests Four behavior tests were chosen and are described in paragraphs to All tests were conducted on the same day and in the same housing conditions. Horses were tested at least one hour before work and between meals to avoid possible distractions and confounding food motivation. A map of the facility was drawn 113
117 Chapter 3 Horses before testing the horses in order to facilitate the randomization of the testing order. To avoid habituation, horses kept in adjacent boxes were not tested consecutively. The test order was designed to firstly measure reactivity to a human, followed by the fear test. Two female experimenters (aged 24-28yrs), experienced in the field of animal welfare (one a veterinarian and researcher in the field of applied ethology, the other a final year student of animal welfare) conducted the tests. The first assessor performed the tests, while the second assessor scored the reactions of the horse to the different tests (from a distance, without interfering with the test performance). To maintain consistency, the assessors always wore the same type and color of clothing at all the farms, including appropriate safety clothing (e.g. accident prevention shoes) to reduce the risk of injury. Preventive safety measures always included making sure that there were no obvious physical hazards in the environment. Prior to the first assessment, both assessors familiarized themselves with the tests by researching relevant scientific literature and performing preliminary practical trials with a trainer known to the horses and familiar with the experimental procedures Fear Test (NOT) For the fear test (NOT) an object which was not familiar to the horses was used. The procedure was derived and adapted from the work conducted by Górecka- Bruzda et al. (2011). A green, 1.5 l, plastic bottle, filled with small stones and attached by a 4 m cord, was placed at the box entrance and the cord was hung over the box door to keep the bottle at a height of approximately 1.5 m. In the original test the plastic container was placed next to the feeding bucket. The latency time to explore (sniffing, touching) the novel object was measured (first latency). When the horse approached, or after 300 seconds, the experimenter released the cord allowing the bottle to drop, thus emitting an unexpected, muffled noise. Latency to 114
118 Chapter 3 Horses re-approach the bottle was then measured (second latency). The test was considered finished when the horse re-approached the bottle or after 300 seconds Avoidance Distance Test (AD) At a distance of 2 m from the door of the horse-box, the observer waited until the horse s attention was directed towards them, and then slowly began to approach the horse at approximately one step per second. The observer never made direct eye contact with the horse; conversely they kept their eyes focused on the muzzle and an arm raised in front of them at an angle of 45⁰, with the palm facing downwards. The test terminated at any point when the horse showed an avoidance reaction (taking steps away from the observer or turning of the head). In such instances, a score of 0 was assigned. If the horse remained stationary and accepted being touched by the observer, a score of 1 was recorded Voluntary Animal Approach Test (VAA) The assessor stood in front of the horse-box with their body at an angle of approximately 45, and placed one hand on the box door whilst remaining motionless for 20 seconds. The latency until the horse approached and touched the hand was measured. If the horse did not approach the experimenter, a score of more than 20 seconds was given. The behavior of the horse was also recorded on a three-point scale: 0 was given when the horse was aggressive (ears back, trying to kick, trying to bite, rearing); 1 when the horse showed no interest in human presence; 2 when the horse was interested and friendly (sniffing, turning the head toward the observer, approaching) Forced Human Approach Test (FHA) Once the horse had touched the experimenter or after a period of 20 seconds had passed with no signs of aggression shown, the assessor entered the box and 115
119 Chapter 3 Horses approached the horse. Remaining approximately 0.5 m from the animal, the assessor placed a hand on the horse s neck and walked slowly to the rear of the horse maintaining contact with the horse. The behavior toward the observer was recorder on a three-point scale: 0 was given when the horse did not allow the observer to touch them; 1 when the horse allowed the observer to touch them but then tried to move away; 2 when the horse allowed the touch and was interested and friendly. 2.4 Infrared Thermography On a group of subjects (N=22) from 3 farms and representative of the whole sample, eye temperature pre-test and post-test was evaluated. This group was composed of horses of different breed and gender (10 mares, four stallions and eight geldings), aged between three and 27 years (mean=13). An infrared camera (NEC AVIO TVS500, Nippon Avionics Co., LTD, Tokyo, Japan) with standard optic system was used to record the temperature ( C) of the lacrimal caruncle. The thermographic infrared images were captured by a certified technician (E.H.). Lacrimal caruncle was chosen as target area based on information derived from (Bartolomé et al., 2013; Cook et al., 2001; McGreevy et al., 2012; Stewart et al., 2009) and because its temperature is not influenced by the presence of hair. In our study it was not possible to regulate room temperature and humidity but they were relatively stable across all situations. To optimize the accuracy of the thermographic image and to reduce sources of noise, before every work session the same image of a Lambert surface was taken to define the radiance emission and to nullify the effect of surface reflections on tested animals (Mallick et al., 2005). Only images perfectly on focus were used. To determine the caruncle temperature, Grayess IRT analyzer 6.0 software (Grayess, 2007) was used and the maximum temperature ( C) within a circular area traced 116
120 Chapter 3 Horses around the area was measured. This maximum value was used for subsequent analysis. All the horses undergoing this procedure were accustomed to being restrained with head collar and a loose rope. In order to collect sharp images without using potentially stressful restraint methods, all the thermographic images were taken while the subject was gently restrained by holding the lead rope fixed to the head collar, allowing enough movement away from the approaching observer should the horse want to retreat. All horses were scanned from the same angle (90 ) and distance (approximately 0.5 m) inside their own box. Five images were taken before and five images immediately after the test. All thermographic data were analyzed with Grayess-IRTAnalyzer (GRAYESS Inc., Bradenton, FL, USA) software. 2.5 Statistics Data was entered into Microsoft Excel (Microsoft Corporation 2010) and then analyzed with SPPS statistical package (IBM SPSS Statistic 21). Descriptive statistics including relative proportions, minimum and maximum values, median, mean and standard deviations were calculated. The data was tested for normality using the Kolmogorov-Smirnov test. The U Mann-Withney test was used to verify if the gender of the horses affected the questionnaire scores or the test outcomes. Differences were considered to be statistically significant if p Factor analysis was performed using the principle factor method for factor extraction, to evaluate any relationship between questionnaire items. A correlation matrix with varimax rotation was used, and factor scores were calculated for horses when the factor s Eigen value was greater than 1. A TwoStep Cluster analysis with automatic determination of the number of clusters was performed on questionnaire items relating to fearfulness/anxiety (as determined by Factor analysis) and 117
121 Chapter 3 Horses outcomes of the NOT, in order to identify groups of horses that are similar to each other for the considered variables. The TwoStep clustering algorithm handles both continuous and categorical variables, continuous variables are z-standardized by default in order to make them comparable. The U Mann-Withney test was used to verify if horses assigned to different clusters significantly differed for the considered variables. A match-paired Wilcoxon s test was used to compare thermographic data before and after the test and analysis of variance ANOVA was used to compare thermographic variations between horses who did or did not approach the novel object. The Kruskall Wallis ANOVA test was used to evaluate if horses showing more intense fear reactions to the NOT also showed higher reactivity to human-animal tests. Results and discussion The startling novel object test chosen as a reference (Górecka-Bruzda et al., 2011) and further refined in this study was selected because it is used in horses for measuring fear and its validity has been confirmed in previous scientific work (Górecka-Bruzda et al., 2011), although only in cold blood horses. It was also promising in terms of feasibility as it is of simple execution, it can be performed in the horse home box and its lead time is relatively short. However, prior to considering implementation in an on-farm welfare assessment protocol, refinement of the original test was deemed necessary to avoid possible conflicting motivations initially caused by proximity of the novel object to the food bucket. Our results revealed that the NOT was feasible under field conditions in sport horses. No safety issues were encountered, no tests had to be interrupted because of dangerous reactions of horses and all owners showed good acceptability of the procedure adopted to test the animals. Total time required to perform the test revealed 118
122 Chapter 3 Horses substantial individual variability, ranging from 0 to 600 sec (mean 141±177 sec), mean latency time to first approach the bottle was 23±45 sec, and horses needed 27±34 sec to re-approach the bottle after it had been dropped in the box. Six caretakers completed a questionnaire for each of the 50 tested horses. Table 3.1 reports the scores (min, max, median and standard deviation) of each questionnaire item. Horses were prevalently described by their caretakers as trainable, friendly towards people, with a good memory, cooperative, docile and were easy to get onto the trailer, as attested by high scores in these descriptors. Items Min - Max Median SD Nervousness Concentration Self-Reliance Trainability Excitability Friendliness Toward People Curiosity Memory Panic Cooperation Inconsistent emotionality Stubbornness Docility Vigilance Perseverance Friendliness Toward Horses Competitiveness Skittishness Timidity Trailer Table Descriptive results of horse scores on the different questionnaire items. 119
123 Chapter 3 Horses No significant differences were found in questionnaire scores or NOT results between females and geldings (U Mann-Whitney p > 0.05). This finding is consistent with what was found by several authors (Bartolomé et al., 2013; Kędzierski and Janczarek, 2009; Rietmann et al., 2004; Seaman et al., 2002; Visser et al., 2002; Wolff et al., 1997b) but is in contrast to studies by Momozawa et al. (2007) and Maros et al. (2010) who found differences between sexes in the response to a behavioral isolation test (Momozawa et al., 2007) and in the behavior following a response to familiar humans (Maros et al., 2010). These dissimilarities between researches may be attributed to the diverse temperamental traits investigated using different experimental settings. Results of this study confirm that horse gender does not affect fearfulness: most of the differences between subjects seem to relate to individual behavioral differences. 3.1 Predictive validity In order to assess predictive validity of the NOT, the correlation with a validated questionnaire (Momozawa et al., 2005) was investigated. Most results concerning predictive validity are similar to those obtained by Górecka-Bruzda et al. (2011) in cold blood horses. Table 3.2 shows the outcomes of the PCA performed on the scores of the questionnaire items. The analysis identified four main factors with Eigenvectors greater than 1, which together explain 61.9% of the variation between horses. Figure 3.1 represents the PCA loadings on the first two factors. The first factor, accounting for 31.3% of the total variance, shows high negative loadings for nervousness, excitability, panic, inconsistent emotionality, skittishness, suggesting that horses registering high negative scores on this factor can be described as more fearful/anxious than horses with high positive scores. The second factor accounts for 13.6% of the total variance and shows high positive loadings for trainability, memory and vigilance, suggesting that horses 120
124 Chapter 3 Horses scoring high on this factor can be described as more trainable. The meaning of the other two factors, accounting for 10.2% and 6.6% of the total variance respectively, seems more elusive. The third factor shows high loadings for curiosity and stubbornness. Only competitiveness belongs to factor four, so this factor retains the name competitiveness. The results of two questionnaire items - stubbornness and friendliness toward horses - are difficult to explain unambiguously as they appear not to be meaningfully associated with the others. One possible explanation is that the owners interpreted these questions differently. 121
125 Chapter 3 Horses Factor Eigen Value % Of Variance Cumulative Variance Explained Explained PC1 6,264 31,319 31,319 PC2 2,734 13,671 44,990 PC3 2,047 10,234 55,224 PC4 1,338 6,688 61,912 Items PC1 PC2 PC3 PC4 Nervousness -,706,007,170,016 Concentration,641,403 -,238 -,303 Self-Reliance,627,238 -,243,249 Trainability,544,547,305,029 Excitability -,702,428 -,023,287 Friendliness Toward People,510 -,418,072,504 Curiosity,263 -,188 -,688,164 Memory,457,564 -,098 -,150 Panic -,717,262 -,081,243 Cooperation,558,070,340,304 Inconsistent emotionality -,752 -,168 -,023,034 Stubbornness -,451 -,428 -,628 -,155 Docility,594 -,182,315,170 Vigilance -,390,599,192,209 Perseverance,631,129,213 -,056 Friendliness Toward Horses,107 -,735,252,068 Competitiveness -,187,301 -,356,571 Skittishness -,798,145,234,194 Timidity -,463 -,227,613 -,103 Trailer,488 -,328,030,420 Table Outcomes of the PCA of the recorded questionnaire items. 122
126 Chapter 3 Horses Figure PCA loading plot of the questionnaire items on the first two factors. A TwoStep Cluster analysis was performed on questionnaire items relating to fearfulness/anxiety (negative loadings on the first factor) and latency to approach and re-approach the bottle in the fear test, in order to identify groups of horses that are similar to each other for the considered variables. Two clusters were found based on the seven input variables selected. Seventy-seven percent (N=26) of the horses were assigned to the first cluster and 48% (N=24) to the second. Horses in cluster 2 needed significantly more time to approach the bottle after it was dropped (U Mann-Whitney p < 0.01) and were described by their caretakers as more prone 123
127 Chapter 3 Horses to panic, vigilant, excitable, skittish and nervous (U Mann-Whitney p < 0.001) (Figure 3.2). However, they did not differ in the latency time to approach the bottle when it was first placed at the box entrance (U Mann-Whitney p > 0.05). The bottle, when used as a static novel object, probably did not possess features that induced a clear reaction of fear enabling the differentiation of horses with various levels of fearfulness. Other studies revealed a moderate correlation between behavior test outcomes and subjective evaluations of horse temperament provided by caretakers (Flentje, 2008; McCall et al., 2006; Visser et al., 2003b), i.e. Momozawa et al. (2007, 2003) found comparable results in studies investigating correlations between the caretakers responses about ordinary behaviors, heart rate, behavior and latency times recorded during a Balloon Reaction Test or an isolation stress test. Although questionnaire surveys have the advantage of being based on long-term observation, they have the flaw of being subject to bias based on respondents personal beliefs and temperament. Moreover, they should be carried out solely among those who are familiar with the behaviour of horses under different circumstances, as was the case in this study. When feasible and valid, behavior tests represent a preferable asset to people who deal with horse temperament evaluation in a broad range of facilities. Relationships between results of the NOT and evaluation of caretakers suggest that, to some extent, the NOT outcomes represent a fearfulness trait which is relatively stable over time allowing us to validate the test. 124

128 Chapter 3 Horses *U Mann-Whitney p < Cluster 1=26 horses, Cluster 2=24 horses Figure Proportion of horses with different questionnaire scores in the two clusters. 3.2 Convergent validity Convergent validity of the NOT was evaluated by examining relations between the test outcomes and variation of lacrimal caruncle temperature. This study shows for the first time that lacrimal caruncle temperature of horses undergoing the NOT was significantly higher (Wilcoxon s p < 0.01) after the test compared to basal, indicating the presence of a physiological response to the test. Examples of thermographic pictures taken before and after the NOT are presented in Figure 3.3 (columns B and C, respectively). As shown in the figure, the temperature of the caruncle was higher in the post-test period (yellow and white areas), whereas it was relatively low before the NOT (orange areas). 125
 detected transient increases in temperature in the eye regions of four macachi resus (Macaca mulatta) during the stimulation of a potentially threatening person.")
129 Chapter 3 Horses Figure An example of changes in caruncle temperature of three horses. A. Visible photographs B. Thermographic images before the NOT. C. Thermographic images after the NOT. Also Nakayama et al. (2005) detected transient increases in temperature in the eye regions of four macachi resus (Macaca mulatta) during the stimulation of a potentially threatening person. Increased caruncle temperature was described by Stewart et al. (2007) in dairy cows injected with ACTH, CRH and epinephrine; although, the same authors reported contradictory findings in cattle undergoing fear-eliciting (being hit with a plastic tube on the rump, being startled by the 126
130 Chapter 3 Horses sudden waving of a plastic bag, restraint, electric prod, startled accompanied by shouting) (Stewart et al., 2008a) or painful stimuli (disbudding with or without local anesthetic) (Stewart et al., 2008b). A possible reason for discrepancy between these studies may be due to the nature of the fear stimuli used, as some of them might have caused pain besides fear. The magnitude of temperature variation was related to the intensity of reaction to the NOT: subjects who did not re-approach the bottle after it had been dropped in the box had a higher increase in lacrimal caruncle temperature (ANOVA p < 0.1) (Figure 3.4). These results confirm that horses who experienced intense negative emotions during the fear test presented more evident behavioral signs related to fear (they do not re-approach the bottle) and higher variation in lacrimal caruncle temperature. Analogously to Vianna and Carrive (2005), who investigated changes in laboratory rats undergoing a conditioned fear response to footshock chambers and who found that tail temperature was sensitive to the level of arousal, the findings of the present study suggest that the stronger the arousal, the stronger the physiological response. 127

131 Chapter 3 Horses * ANOVA p < 0.1 Figure Caruncle temperature variation after fear test. 3.3 Discriminant validity Discriminant validity of the NOT was studied by examining the possible relationship with fear of people. Table 3.3 shows descriptive results of the three human-animal relationship tests. Fifty-six percent of the horses did not show any avoidance behavior when approached by the assessor in the AD test. In VAA and FHA tests, only 6.1 % of the horses displayed negative reactions. The horses which had shown avoidance reactions during the AD test or negative reactions to the FHA test did not need more time to re-approach the novel object compared to horses that had expressed an amicable behavior towards humans during humananimal relationship tests (ANOVA Kruskal-Wallis p > 0.05). 128
132 Chapter 3 Horses These results suggest that fear reactions shown in the NOT are not related to the responses of horses towards unfamiliar humans. Other research failed to prove that different behavior tests effectively distinguish between fear of people and a more general fearfulness trait (Górecka-Bruzda et al., 2011). In this study, similarly to Visser et al. (2003a), we managed to demonstrate that the NOT is specifically informative of the general fearfulness trait. These results reject the hypothesis that reactivity to humans and general fearfulness belong to the same basic feature of temperament. Test Score/time Proportion/Mean ±SD Avoidance distance 0 22,9% 1 77,1% Voluntary Animal Approach (latency) sec 5,3 ± 6,7 Voluntary Animal Approach (behavior) 0 6,1% 1 28,6% 2 65,3% Forced Human Approach 0 6,1% 1 46,9% 2 47,0% Table Descriptive results of human-animal relationship tests Conclusion and future directions The fear test originally developed by Górecka-Bruzda et al. (2011), refined and adapted by the authors of this study to horses of different breeds and to different conditions, proved to be a valid measure of general fearfulness of horses and could be easily implemented for use in an on-farm welfare assessment protocol. The relatively limited number of subjects on which the thermographic measures were performed (N=22) constitutes a limiting factor for the generalization of the results of the present study. In any case, our results are valid indication for a relationship 129
133 Chapter 3 Horses between superficial eye temperature and fear emotion. This study provides a new angle on mechanisms regulating interaction between horse emotions and behavior. Future studies should consider a larger sample of horses in order to substantiate the results and to measure time to return to baseline eye temperature after the fear stimulus. Acknowledgments The authors would like to thank the EU VII Framework program (FP7-KBBE ) for financing the Animal Welfare Indicators (AWIN) project. We are grateful to the riding school owners who allowed us to use their horses. A special thanks goes to Dr Francesco Tozzi who patiently helped us in recruiting horse facilities. The authors would like to thank Leigh Anne Margaret Murray and Kirk Ford for their extensive and professional revisions of language and structure. 130
134 Chapter 3 Horses References Anderson, M., Friend, T., Evans, J., Burshong, D., Behavioral assessment of horses in therapeutic riding programs. Appl. Anim. Behav. Sci. 63, Bartolomé, E., Sánchez, M., Molina, A., Schaefer, A., Cervantes, I., Valera, M., Using eye temperature and heart rate for stress assessment in young horses competing in jumping competitions and its possible influence on sport performance. Animal 7, Boissy, A., Fear and fearfulness in determining behavior, in: Grandin, T. (Ed.), Genetics and the Behaviour of Domestic Animals. Academic Press, San Diego, USA, pp Christensen, J.W., Keeling, L.J., Nielsen, B.L., Responses of horses to novel visual, olfactory and auditory stimuli. Appl. Anim. Behav. Sci. 93, Christensen, J.W., Malmkvist, J., Nielsen, B.L., Keeling, L.J., Effects of a calm companion on fear reactions in naive test horses. Equine Vet. J. 40, Cook, N., Schaefer, A., Warren, L., Burwash, L., Anderson, M., Baron, V., Adrenocortical and metabolic responses to ACTH injection in horses: an assessment by salivary cortisol and infrared thermography of the eye. Can J Anim Sci 81, 621. Cronbach, L.J., Meehl, P.E., Construct validity for psycological tests. Psycol. Bull. 52, Dantzer, R., Mormede, P., Stress in farm animals - a need for reevaluation. J. Anim. Sci. 57, Désiré, L., Veissier, I., Despres, G., Delval, E., Toporenko, G., Boissy, A., Appraisal process in sheep (Ovis aries): interactive effect of suddenness and unfamiliarity on cardiac and behavioral responses. J. Comp. Psychol. 120, Erhard, H., Mendl, M., Tonic immobility and emergence time in pigs - more evidence for behavioural strategies. Appl. Anim. Behav. Sci. 61, Flauger, B., Krueger, K., Gerhards, H., Möstl, E., Simplified method to measure glucocorticoid metabolites in faeces of horses. Vet. Res. Commun. 34, Flentje, R., How reliable are standardised behaviour tests and are they valid in predicting the suitability for use in police horses? MSc dissertation, University of Liverpool. Forkman, B., Boissy, A., Meunier-Salaün, M., Canali, E., Jones, R., A critical review of fear tests used on cattle, pigs, sheep, poultry and horses. Physiol. Behav. 92,
135 Chapter 3 Horses Górecka-Bruzda, A., Jastrzębska, E., Sosnowska, Z., Jaworski, Z., Jezierski, T., Chruszczewski, M.H., Reactivity to humans and fearfulness tests: Field validation in Polish Cold Blood Horses. Appl. Anim. Behav. Sci. 133, Grayess, IRT analyser users manual. Hall, C., Burton, K., Maycock, E., Wragg, E., A preliminary study into the use of infrared thermography as a means of assessing the horse s response to different training methods, in: Hartmann, E., Blokhuis, M., Fransson, C., Dalin, G. (Eds.), 6th International Equitation Science Symposium. Uppsala, Sweden, p. 64. Hothersall, B., Casey, R., Undesired behaviour in horses: A review of their development, prevention, management and association with welfare. Equine Vet. Educ. 24, ISAE Ethics Committee, Ethical Treatment of Animals in Applied Animal Behaviour Research. URL (accessed ). Kędzierski, W., Janczarek, I., Sex-related effect of early training on stress in young trotters as expressed by heart rate. Anim. Sci. Pap. reports 27, Keeling, L., Blomberg, A., Ladewig, J., Horse-riding accidents: when the human animal relationship goes wrong!, in: 33rd International Congress of the International Society for Applied Ethology. Lillehammer, Norway, p. 86. Le Scolan, N., Hausberger, M., Wolff, A., Stability over situations in temperamental traits of horses as revealed by experimental and scoring approaches. Behav Process. 41, Ludwig, N., Gargano, M., Luzi, F., Carenzi, C., Verga, M., Technical note: Applicability of infrared thermography as a non invasive measurement of stress in rabbit. World Rabbit Sci. 15, Mallick, S.P., Zickler, T.E., Kriegman, D.J., Belhumeur, P.N., Beyond Lambert: Reconstructing Specular Surfaces Using Color, in: IEEE Computer Society Conference on Computer Vision and Pattern Recognition (CVPR 05). Ieee, pp Maros, K., Boross, B., Kubinyi, E.E., Approach and follow behaviour possible indicators of the human horse relationship. Interact. Stud. 11, Martin, P., Bateson, P., Measuring Behaviour: An Introductory Guide. Cambridge University Press, Cambridge. McCall, C., Hall, S., McElhenney, W., Cummins, K., Evaluation and comparison of four methods of ranking horses based on reactivity. Appl. Anim. Behav. Sci. 96, McGreevy, P., McLean, A., Equitation science. Wiley-Blackwell, Chichester, West Sussex, UK. 132
136 Chapter 3 Horses McGreevy, P., Warren-Smith, A., Guisard, Y., The effect of double bridles and jaw-clamping crank nosebands on temperature of eyes and facial skin of horses. J. Vet. Behav. Clin. Appl. Res. 7, Minch, H., Berghaus, R., Harvey, S., Reeves, D., Crowell-Davis, S.L., A novel method for lifting weanling research pigs. J. Vet. Behav. Clin. Appl. Res. 3, Momozawa, Y., Kusunose, R., Kikusui, T., Takeuchi, Y., Mori, Y., Assessment of equine temperament questionnaire by comparing factor structure between two separate surveys. Appl. Anim. Behav. Sci. 92, Momozawa, Y., Ono, T., Sato, F., Kikusui, T., Takeuchi, Y., Mori, Y., Kusunose, R., Assessment of equine temperament by a questionnaire survey to caretakers and evaluation of its reliability by simultaneous behavior test. Appl. Anim. Behav. Sci. 84, Momozawa, Y., Terada, M., Sato, F., Kikusui, T., Takeuchi, Y., Kusunose, R., Mori, Y., Assessing equine anxiety-related parameters using an isolation test in combination with a questionnaire survey. J. Vet. Med. Sci. 69, Morris, P.H., Gale, A., Duffy, K., 2002a. Can judges agree on the personality of horses? Pers. Individ. Dif. 33, Morris, P.H., Gale, A., Howe, S., 2002b. The factor structure of horse personality. Anthrozoos A Multidiscip. J. Interact. People Anim. 15, Nakayama, K., Goto, S., Kuraoka, K., Nakamura, K., Decrease in nasal temperature of rhesus monkeys (Macaca mulatta) in negative emotional state. Physiol. Behav. 84, Rietmann, T., Stuart, A., Bernasconi, P., Stauffacher, M., Auer, J., Weishaupt, M., Assessment of mental stress in warmblood horses: heart rate variability in comparison to heart rate and selected behavioural parameters. Appl. Anim. Behav. Sci. 88, Seaman, S.C., Davidson, H.P.B., Waran, N.K., How reliable is temperament assessment in the domestic horse (Equus caballus)? Appl. Anim. Behav. Sci. 78, Stewart, M., Schaefer, A.L., Haley, D.B., Colyn, J., Cook, N.J., Stafford, K.J., Webster, J.R., 2008a. Infrared thermography as a non-invasive method for detecting fear-related responses of cattle to handling procedures. Anim. Welf. 17, Stewart, M., Stafford, K.J., Dowling, S.K., Schaefer, a L., Webster, J.R., 2008b. Eye temperature and heart rate variability of calves disbudded with or without local anaesthetic. Physiol. Behav. 93, Stewart, M., Stookey, J., Stafford, K., Tucker, C., Rogers, A., Dowling, S., Verkerk, G., Schaefer, A., Webster, J., Effects of local anesthetic and a 133
137 Chapter 3 Horses nonsteroidal antiinflammatory drug on pain responses of dairy calves to hotiron dehorning. J. Dairy Sci. 92, Stewart, M., Webster, J., Schaefer, A., Stafford, K., 2008c. Infrared thermography and heart rate variability for non-invasive assessment of animal welfare. ANZCCART News 21, 1 4. Stewart, M., Webster, J., Verkerk, G., Schaefer, A., Colyn, J., Stafford, K., Non-invasive measurement of stress in dairy cows using infrared thermography. Physiol. Behav. 92, Valera, M., Bartolomé, E., Sánchez, M.J., Molina, A., Cook, N., Schaefer, A., Changes in Eye Temperature and Stress Assessment in Horses During Show Jumping Competitions. J. Equine Vet. Sci. 32, Vianna, D.D.M.L., Carrive, P., Changes in cutaneous and body temperature during and after conditioned fear to context in the rat. Eur J Neurosci 21, Visser, E.K., Van Reenen, C.G., Engel, B., Schilder, M.B.H., Barneveld, A., Blokhuis, H.J., 2003a. The association between performance in showjumping and personality traits earlier in life. Appl. Anim. Behav. Sci. 82, Visser, E.K., van Reenen, C.G., Hopster, H., Schilder, M.B.H., Knaap, J.H., Barneveld, A., Blokhuis, H.J., Quantifying aspects of young horses temperament: consistency of behavioural variables. Appl. Anim. Behav. Sci. 74, Visser, E.K., van Reenen, C.G., Rundgren, M., Zatterqvist, M., Morgan, K., Blokhuis, H.J., 2003b. Responses of horses in behavioural tests correlate with temperament assessed by riders. Equine Vet. J. 35, Visser, E.K., van Reenen, C.G., van der Werf, J.T.N., Schilder, M.B.H., Knaap, J.H., Barneveld, A., Blokhuis, H.J., Heart rate and heart rate variability during a novel object test and a handling test in young horses. Physiol. Behav. 76, Von Borell, E., Langbein, J., Després, G., Hansen, S., Leterrier, C., Marchant- Forde, J., Marchant-Forde, R., Minero, M., Mohr, E., Prunier, A., Valance, D., Veissier, I., Heart rate variability as a measure of autonomic regulation of cardiac activity for assessing stress and welfare in farm animals - A review. Physiol. Behav. 92, Weiblinger, S., Boivin, X., Pedersen, V., Tosi, M.V., Janczak, A.M., Visser, E.K., Jones, R.B., Assessing the human-animal relationship in farmed species: a critical review. Appl. Anim. Behav. Sci. 101, Willner, P., Muscat, R., Papp, M., Chronic mild stress-induced anhedonia: a realistic animal model of depression. Neurosci. Biobehav. Rev. 16, Wolff, A., Hausberger, M., Le Scolan, N., 1997a. Experimental tests to assess emotionality in horses. Behav Process. 40,
138 Chapter 3 Horses Wolff, A., Hausberger, M., Le Scolan, N., 1997b. Experimental tests to assess emotionality in horses. Behav. Processes 40,

139 CHAPTER 4 - DONKEYS 136
140 Chapter 4 Donkeys A STUDY ON VALIDITY AND RELIABILITY OF ON-FARM TESTS TO MEASURE HUMAN-ANIMAL RELATIONSHIP IN HORSES AND DONKEYS Emanuela Dalla Costa 1, Francesca Dai 1, Leigh Anne Margaret Murray 1, Stefano Guazzetti 2, Elisabetta Canali 1, Michela Minero 1 1 Università degli Studi di Milano, Dipartimento di Scienze Veterinarie e Sanità Pubblica, Milano, Italy 2 Azienda Unità Sanitaria Locale, Dipartimento di Sanità Pubblica Veterinaria, Reggio Emilia, Italy Submitted to: Applied Animal Behaviour Science Abstract The development and maintenance of a positive human horse/donkey relationship is essential in order to decrease accidents and reduce negative states of equine welfare. In many animal species the reaction of animals to humans during specific behavioural tests is influenced by their past interaction and is linked to the level of fear felt in the presence of a human. The present research aims to assess whether a set of on-farm behavioural tests allow differentiation between horse facilities with good or sub-optimal human-animal relationship. Furthermore, we evaluated midterm repeatability (3 month intervals), inter-observer reliability and on-farm feasibility of these behavioural tests in single stabled horses and in group housed donkeys. Eleven horse and eight donkey facilities (N = 313 adult horses; N = 47 adult donkeys) were visited twice at three month intervals. Horse facilities were 137
141 Chapter 4 Donkeys selected on the basis of reports of inspections on animal welfare conducted by competent local authorities; they were classified as good (N = 5) and suboptimal (N = 6). Four observers with no experience in assessing equine welfare were trained to perform and score standardized human-equine behavioural tests: Avoidance Distance test (AD), Voluntary Animal Approach test (VAA), Forced Human Approach test (FHA), Walking Down Side and Tail Tuck. All the behavioural tests carried out proved to be feasible in an on-farm environment. In spite of the fact that the reactions of horses were largely positive, those kept in facilities with sub-optimal relationship showed avoidance and aggressive behaviours more often when approached (GLMM P < 0.05). As for donkeys, less than 30% of the animals exhibited negative behaviour towards the assessor. Observer s agreement of AD, VAA, FHA, WDS and Tail Tuck scoring was consistent for both species (Percentage Agreement ranged between 67.7 to 93.3%). Repeatability of tests was good for all the tests and no significant differences were found between two repetitions at 3-month intervals. Our results support the findings described for working donkeys and show that, also on-farm, the assessment of donkeys reactions to an unknown human during standardized tests could prove useful in evaluating the quality of their relationship with humans. Further research is needed to verify if our findings can be generalised for different husbandry conditions and different breeds of horses. Keywords: horses, donkeys, human-animal relationship, on-farm welfare assessment 138
142 Chapter 4 Donkeys Introduction The human-animal relationship is a continually changing process that can be defined as the mutual perception that develops and expresses itself in the mutual behaviour (Estep and Hetts, 1992). This relationship is based on repeated interaction, defines each subject s expectation during the encounters that follow (Fureix et al., 2009; Hausberger and Muller, 2002; Ligout et al., 2008; Waiblinger et al., 2006) and is, in addition, linked to the level of fear felt in the presence of a human (Hemsworth et al., 1993; Rushen et al., 1999). The quantity and quality of interaction influences the emotional, cognitive and productive behaviour of the animal (Hemsworth, 2003; Mendl et al., 2010). In horses several factors can affect the relationship, such as early experience and training (Henry et al., 2006; Sankey et al., 2010), breed and temperament (Hausberger and Muller, 2002; Lesimple et al., 2011), and even chronic discomfort (Fureix et al., 2010). The relationship will range from confidence to fear, implying different emotion involved, in accordance with the perceived importance of the interactions (positive/negative) (Hemsworth et al., 1993; Lansade et al., 2008; Søndergaard and Halekoh, 2003). Different studies were carried out to evaluate the human-animal relationship where the animal-based measures used to assess this relationship are based on how they react to humans (for a review on horses see (Hausberger et al., 2008). Broadly speaking, tests designed to test the reaction of equines to people take into consideration the measurement of: reaction to a standing human (Table 1), reaction to a moving person (Table 2) or the reaction to a particular handling (Table 3) (for review, see Waiblinger et al., 2006). 139
143 Chapter 4 Donkeys Variables Sp b References Procedures and other factors a P walks to centre of paddock Latency to touch human H Fureix et al., 2009; and stands still Søndergaard and P appears suddenly at door (closed) of box and notes horse s first reaction A is left alone in arena (phase 1, 3 min), P enters and stands still next to wall (phase 2, 3 min), A is left alone (phase 3, 3 min), A is caught P enters the pen, stands stationary opposite the door A left alone in test box for 3 min, P stands in front of box for 3 min, then enters box and holds horse for 3 min A released in paddock and left alone for 3 min. First reaction score A E (friendly indifferent very aggressive) Restlessness, exploration, vocalising, standing alert. Latencies to first contact, of contacts. Time taken to capture; heart rate: mean, deviation from baseline Time spent in certain squares, of immobilisation. Latencies to first neigh, to sniffing P. Mean duration sniffing. Number sniffs, glances at P, neighs, defecations, squares entered Latencies to first pawing. Frequencies of restless behaviour (pawing, rearing, striking, head shaking). Locomotion; heart rate: mean, variability Behaviour scored in four situations (catching, led away, hooves picked up, approached). Ease of manipulation score 1 5 (1=not executed, 5=executed very easily), sum of scores=total behavioural score; mean HR Halekoh, 2003 H Hausberger and Muller, 2002 H Søndergaard and Halekoh, 2003 H Lansade et al., 2004 H Visser et al., 2002, 2001 H Jezierski et al.,
144 Chapter 4 Donkeys P stood in the centre of the 10 m circle, with shoulders rounded and head down, without looking directly at the horse; P stood with head up and shoulders back in an erect, rigid posture and direct eye contact was maintained with the horse. P stood motionless, quiet, and looking down in the middle of the test arena for 3 minutes. If A did not approach P voluntarily within three minutes, P called the horse A P standing next to each other in the circle a P = person; A = animal. b H = Horse D = Donkey Times to enter each circle and approach the person (maximum of 10 min.). Behavioural responses H Seaman et al., 2002 The latency to approach P H Maros et al., 2010 The total time the horse spent beside P without walking away from him H Maros et al., 2010 Table 1 - Test for reactions to stationary human. 141
145 Chapter 4 Donkeys Procedures and other Variables Sp b References factors a P enters paddock and approaches horse/horses slowly (1 step/s, hands at sides); P attempts to touch horse s neck A released in paddock and left alone for 3 min. P approachs the animal s head from 3 to 5 m away, at angle of approximately 45. P walks down side of animal s body at distance of 30 cm from its side, turning at tail and walking back to head. P made the horse follow him along a predetermined route in the arena a P = person; A = animal. b H = Horse D = Donkey Score 1 4 (1 = horse moves away, 4 =person could touch the horse) Behaviour scored in four situations (catching, led away, hooves picked up, approached) Ease of manipulation scored 1 5 (1=not executed, 5=executed very easily), sum of scores=total behavioural score (TBS); mean heart rate Friendly approach: animal turns head towards observer. Avoidance/aggression: animal does one or more of following: turns head away, moves away, flattens ears, H Fureix et al., 2009; Søndergaard and Halekoh, 2003 H Jezierski et al., 1999 H, D Burn et al., 2010; Popescu and Diugan, 2013; Pritchard et al., 2005 attempts to bite or kick. Any acknowledgment of H, Burn et al., 2010; observer s presence, e.g. ear D Popescu and turn, head turn, move away, Diugan, 2013; kick. Pritchard et al., Tail tuck (donkeys only) Total time of following P H Maros et al., 2010 Table 2 - Test for reactions to moving human. 142
146 Chapter 4 Donkeys Procedures and other Variables Sp b References factors a P enters stall, quietly approaches A and attempts to stroke it for 1.5 min. Horses were equipped with ECG telemetry transmitters P lead horse around predetermined course P tries to lead horse across a bridge (maximum three attempts) P stroke horses for 90 s. Horses were equipped with wireless ECG monitor recordings P approaches the foal in test pen, halters, picks up feet, leads A through corridor A left alone in test box for 3 min, P stands in front of box for 3 min, then enters box and holds horse for 3 min A is left alone in arena (phase 1, 3 min), P enters and stands still next to wall (phase 2, 3 min), A is left alone (phase 3, 3 min), A is caught Heart rate H McCann et al., 1988 Head position, ear movements and position, resistance Attempts to cross bridge, reluctance behaviour (pawing, rearing, striking, head shaking, walking sideways, pulling backwards), locomotion; heart rate: mean, variability H Chamove et al., 2002 H Visser et al., 2002, 2001 ECG H Hama et al., 1996 Time taken to fit with halter, pick up feet, walk ratio, defences Latencies to first pawing. Frequencies of restless behaviour (pawing, rearing, striking, head shaking). Locomotion; heart rate: mean, variability Restlessness, exploration, vocalising, standing alert. Latencies to first contact, of contacts. Time taken to capture; heart rate: mean, deviation from baseline H Lansade et al., 2004 H Visser et al., 2002, 2001 H Søndergaard and Halekoh,
147 Chapter 4 Donkeys A released in paddock and left alone for 3 min. P tries to lead horse across a bridge (wooden planks on the ground) Behaviour scored in four situations (catching, led away, hooves picked up, approached) Ease of manipulation scored 1 5 (1 = not executed, 5 = executed very easily), sum of scores = total behavioural score (TBS); mean heart rate Total time to cross bridge, retreat, jumping. Standing still P tries to touch the chin. Proportion of animals avoiding contact or withdrawing head when hand was placed lightly under the chin. a P = person; A = animal. b H = Horse D = Donkey H Jezierski et al., 1999 H Wolff et al., 1997 H, D Burn et al., 2010; Popescu and Diugan, 2013; Pritchard et al., 2005 Table 3 - Reaction to handling. 144
148 Chapter 4 Donkeys Normally the tests are very simple but when drafting them it is vital to assess their validity and reliability. To gague the predictive validity of a human-horse/donkey test - a measure of the efficiency of a test to predict results (Acock, 2008; Cronbach and Meehl, 1955) - the selection of the facilities to be assessed is crucial and must be carefully performed in order to ensure coherence with the predetermined level of quality in the human-animal relationship. One option is to take into consideration previous assessments performed by competent local authorities operating in the area of control of animal welfare. A peculiar aspect of horse management is that, within the same facility, each horse can have a different owner; therefore, the quality of interactions with both owner and groom is reflected in how the animal reacts to unknown humans. As already demonstrated in past research (Chamove et al., 2002; Hemsworth and Coleman, 1998; Waiblinger et al., 2006; Windschnurer et al., 2009), attitude and behaviour of the stockman/groom are themselves an indication of the quality of the relationship with the animal concerned. In practice, attitude is difficult to measure directly and it is usually pinpointed through a questionnaire. However, an important disadvantage of questionnaires aimed at evaluating personal traits is the tendency for people to present a favourable image of themselves. This bias, called socially desirable responding, confounds research results by creating false relationships between variables (van de Mortel, 2008). The observer is considered the measurer of behaviour and as is the case with any measuring instrument, his or her measurement can be distorted or imprecise. An observer s reliability is defined by the repeatability of their results. Inter-observer reliability measures the agreement between different assessors and the agreement between observations on the same individual on at least two different occasions (test-retest reliability) is used to verify whether the measure remains the same (Acock, 2008). Other factors that can affect the reliability of the results are tied to 145
149 Chapter 4 Donkeys the nature of the behaviour itself and the technique applied for its measurement. For example, pain can make a horse more unwilling to approach a human or even aggressive (Fureix et al., 2010). Furthermore, a motivation, such as hunger, makes it difficult to assess how willing the animal is to approach a human because there is a built in positive aspect perceived or because the human is associated with satisfying the specific motivation (Hausberger and Muller, 2002). If the test is carried out in a place that is unfamiliar to the animal or that is not the animal s usual environment, another confounding factor can be behavioural inhibition brought on by the physical and social novelty of the surroundings (Søndergaard and Halekoh, 2003). If correctly carried out, observer training is the best weapon for guaranteeing coherence of measurements and bias control. The concepts related to validity and reliability of the above mentioned behavioural tests are the subject of this research paper aimed at investigating the relationship between humans and horses and donkeys in an on-farm environment. At present, there is no research available which evaluates the validity of these on-farm tests on horses, whereas research on working donkeys can be found in specific literature (Burn et al., 2009). The objectives of the present research were to assess whether the tests of Avoidance Distance, Voluntary Animal Approach and Forced Human Approach are a suitable means of differentiating between horse facilities with good or sub-optimal human-animal relationship. Furthermore, we evaluated mid-term repeatability (3 month intervals), inter-observer reliability and on-farm feasibility of the above mentioned behavioural tests and donkey behavioural tests in single stabled horses and in group housed donkeys. 146
150 Chapter 4 Donkeys Material and methods 2.1. Horses Subjects Eleven horse facilities, for a total of 313 horses, were visited. The facilities took part in the study voluntarily. Riding schools, sport and leisure horse stables were selected on the basis of reports of inspections on animal welfare conducted by competent local authorities. Reports of either good or sub-optimal human-horse relationship evaluated by public health veterinarians were considered (Atto C18, art. 3 e 4 Dir. 1998/58/CE D.Lgs. n. 146 del 26 marzo 2001). Only questions relevant to the human-animal relationship were taken into account: - Horses are cared for by a suitable number of stable grooms; - Staff possess the appropriate ability, advanced and updated knowledge and professional competence; - Staff attend to specific training regarding the welfare of horses; - All animals are inspected several times a day; - In the case of extraordinary management procedures, which are likely to cause suffering to any of the animals, all the precautions to avoid any pain/distress are adopted; - Positive interaction (e.g. behaving and talking calmly, stroking) with the horse during routine handling procedures. According to official veterinarian reports, the horse facilities were classified as good (N = 5; a total of 139 horses) and sub-optimal (N = 6; a total of 174 horses). All the facilities classified as good scored positively in all the questions related to the human-animal relationship, whilst facilities considered sub-optimal scored negatively in at least 3 out of 6 questions. Further criteria for horse facilities to be included were: horses were primarily managed by stable grooms; preferably 20 horses or more per facility and all horses being stabled indoors in single boxes 147
151 Chapter 4 Donkeys for at least half of the day. The average farm size was 53 horses (varying from 33 to 180 per farm). All the horses were warmblood sport and leisure horses, aged between 5 and 35 years (mean = 10.04±6.8 yrs). The gender split was 44% mares, 54% geldings, 2% stallions. All, or at least 70% of the adult horses (> 5 yrs) in the facilities were tested. In order to minimize the effect of familiarization and so that it could be reasonably assumed that the horses did not see or hear the experimenter before being tested, the assessors tested horses in parts of the stable separated by some distance and never tested horses in adjoining boxes. To allow inter-observer reliability to be tested, assessors worked in pairs with one performing the tests and the other observing from a distance. They tested 90 horses kept in three horse facilities. To allow repeatability to be tested, one assessor repeated the assessment on all the horses three months after their initial assessment. To assess the on-farm feasibility, single box was chosen as at the moment it is the most common housing systems for horses in Europe Behavioural tests All the behavioural tests were performed on horses not restrained in their home box. A scoring system for each test was developed. Data were collected during regular working days and only healthy horses were tested between meals, at least one hour before being put to work, in order to avoid confounding food motivation and any possible distractions. Assessors were requested not to talk or discuss their findings during on-farm assessments. Three behavioural tests were performed sequentially as follows (Figure 1): 148
 and has already been used on cows (Windschnurer et al., 2008), sheep (Napolitano et al., 2011) and goats (Mattiello et al., 2010).")
152 Chapter 4 Donkeys Figure 1 - Example of human-horse relationship tests: A) Avoidance Distance; B) Voluntary Animal Approach; C) Forced Human Approach Avoidance Distance test (AD): this test was developed by Waiblinger et al. (2003) and has already been used on cows (Windschnurer et al., 2008), sheep (Napolitano et al., 2011) and goats (Mattiello et al., 2010). The assessor waited for the horse to be attentive to his/her presence before approaching the animal. If the horse didn t take any notice of the assessor, the assessor attracted its attention by clicking their tongue three times. Horses were approached by the test person in a standardised manner, starting from a distance of 2 m, walking at measured pace of one step per second, looking at the horse s chest without staring at it, and keeping the right arm raised 45 in front of the body, the back of the hand facing upwards (Figure 1, A). The test ended as soon as the horse showed any avoidance behaviour (e.g. moving away, turning its head away). Avoidance distance was estimated at the moment of horse withdrawal as the distance between the observer s hand and the animal s head with a resolution of 10 cm. A distance of 0 cm was assigned when the horse did not show any avoidance behaviour. Voluntary Animal Approach test (VAA): this test was originally developed by Søndergaard and Halekoh (2003) on horses kept in paddocks and in this study it has been adapted to single housed horses. The assessor stood still outside the box with their hand on the door latch and their body at an angle of 45 from the box 149
153 Chapter 4 Donkeys door (Figure 1, B). The maximum test time was 20 seconds. The latency time in seconds until the horse had its nose/mouth within a distance of 2 cm from the assessor s hand was recorded. Furthermore, the horse s reaction to the presence of the assessor was scored from 0 to 2: - Score 0: the horse moved or turned its head away from the assessor, the horse showed signs of aggression (i.e. ears laid backwards, bite attempts); - Score 1: the horse did not show any interest in the presence of the assessor and didn t stop whatever it was doing (e.g. standing still in a corner of the box); - Score 2: the horse was positively interested in the presence of the assessor and sniffed their hand. Forced Human Approach test (FHA): this test, too, was adapted from the study done by Søndergaard and Halekoh (2003) on horses kept in a paddock. The assessor opened the box door and observed the horse s reaction for 5 seconds, then entered the box and approached the horse slowly at approximately one step per second with their hands by their side. If the horse stood still calmly, the assessor slowly raised their hand, touched the withers and moved their hand along the back of the subject. For safety reasons, one is advised to remain 30 cm away from the horse body (Figure 1, C). The horse s reaction was scored from 0 to 2 on the following scale: - Score 0: the horse showed an aggressive behaviour (e.g. tried to bite or kick); - Score 1: the horse moved away from the person as soon as he/she touched the withers; - Score 2: the horse stood still calmly for the entire duration of the test or showed positive signs of interest (i.e. sniffing or staying in contact with the assessor). 150
154 Chapter 4 Donkeys 2.2. Donkeys Subjects Eight donkey facilities, ranging in size from five to 60 animals per farm (mean 20 donkeys per farm), were visited twice at three month intervals. A total of 47 donkeys (two geldings, eight stallions, 37 jennies), aged between one and 18 years old (mean = 7.85±3.9 yrs) were assessed. The donkeys were of different breed and attitude companion animals, rescue animals, assisted therapy, tourist trekking, and dairy production. All, or at least 70% of the adult donkeys in the facilities, were tested. Private practitioner veterinarians were consulted as to their knowledge of donkey farmers in the area that might have been interested in taking part in the research. All those involved participated voluntarily. To allow inter-observer reliability to be tested, assessors worked in pairs with one performing the tests and the other observing from a distance. They tested 47 donkeys kept on seven farms. To allow repeatability to be tested, one assessor repeated the assessment on all the donkeys three months after their initial assessment. To assess the on-farm feasibility, group housing was chosen as it is the most common housing system for keeping donkeys in Europe Behavioural tests The methodology developed and validated by Burn et al. (2009) on working equines was adapted to reflect farming conditions of donkeys in Western European Countries to assess the reactions of donkeys towards humans. Data were collected during regular working days. Healthy donkeys were tested between meals, at least one hour before being put to work, in order to avoid confounding food motivation and any possible distractions. The assessors worked in pairs and one carried out and scored the tests, while the other scored the reactions of the donkeys from a distance, without interfering with the test performance. For tests to remain 151

155 Chapter 4 Donkeys consistent, assessors always wore the same type and color of clothing during all farm visits, which included appropriate safety clothing (e.g. accident prevention shoes) to reduce the risk of injury. Assessors were requested not to talk or discuss their findings during on-farm assessments. Two behavioural tests were performed consecutively as follows (Figure 2): Figure 2 - Example of human-donkey relationship tests: A) Avoidance Distance; B) Walking Down Side Avoidance Distance test (AD): each test donkey was chosen at random from a paddock and brought to a quiet area of the farm by the stockperson, who restrained the donkey by holding the lead rope fixed to the head collar, allowing enough movement away from the approaching observer should the donkey want to retreat. Observers ensured that each test donkey was within visual and auditory reach of the other donkeys to prevent/minimise separation-related behaviours. Donkeys were approached by the observer in a standardised way, directly from the front, starting at a distance of 3 m. The test began when the donkey noticed he observer. If the donkey didn t pay any attention to the observer, the observer would attract their attention by clicking their tongue three times. Once the donkey s attention 152
156 Chapter 4 Donkeys was gained, the observer walked calmly at a measured pace (one step per second), with their arm raised 45 from their chest and the back of their hand facing upwards (Figure 2, A). The test ended as soon as the donkey exhibited any avoidance behaviour (e.g. moving away, turning the head), after which, the distance (cm) between the tip of the assessor s fingers and the head of the donkey was recorded (with a resolution of 10 cm). A distance of 0 cm was assigned when the donkey did not show any avoidance behaviour. Walk Down Side test (WDS) and Tail-Tuck: to walk down the side of a donkey whilst touching it can be seen as a positive interaction with a human or a negative one, depending of course, on the perception of the donkey. Immediately following the AD test, the observer began by standing on the left side of the donkey, maintaining a distance of approximately 30 cm from its body and gently placed a hand on the donkey s withers. The observer proceeded to walk down the left side of the body towards the rear of donkey, stopping for a few seconds to note whether a tail-tuck is present, then continued to walk along the right side of the donkey towards the head, removing their hand and terminating the test at the withers (Figure 2, B). The observer recorded any signs of the donkey being alert to their presence during WDS. A two-point scale (0/1) was used to evaluate the donkey s reaction to the WDS test, as follows: - Score 0: If the donkey showed any negative reaction to the movement of the observer during WDS test (ears flat back, trying to flee, attempting to kick, defecation); - Score 1: If the donkey showed no interest or if the donkey showed any positive reaction to the movement of the observer during WDS test (remained calm and stationary, ear rotation towards observer, maintaining contact with observer, sniffing). A two-point scale (0/1) was also used to evaluate tail-tuck: 153
157 Chapter 4 Donkeys - Score 0: If the donkey tucked in or clamped down its tail and/or tucked in or tensed its hindquarters during the WDS test (negative); - Score 1: If the donkey did not tuck in or clamp down its tail and/or tuck in or tense its hindquarters during the WDS test (positive/neutral). 2.3 Training of assessors Horse assessments were carried out by four, third- year undergraduate Animal Welfare students with a good knowledge of horse behaviour but no previous experience in assessing equine welfare. None of the assessors were acquainted with the horse facilities classification. Donkey assessments were conducted by four experimenters, all experienced in the field of animal welfare and applied ethology. Prior to training, all assessors familiarized themselves with the human-animalrelationship tests from relevant scientific literature. The assessors were trained to perform and score the tests by a senior veterinarian with over 10 years experience in assessing horse welfare (silver standard). Assessor training procedures required one day per species and were comprised of two phases: theoretical training and practical assessment on-farm. During the theoretical phase, assessors were taught how to perform and score the tests with the use of a written training guide and pictorial and audio-visual presentations containing detailed explanations of each test, scoring systems and test videos. The assessors were also instructed to take the necessary precautions when handling the animals to minimize the risk of injuries. Exhibition of any behaviour that could compromise the animals or the assessors safety resulted in immediate termination of the test. On-farm training was then performed in order to achieve the skills necessary to perform and score the tests accurately on farm. In pairs with a senior veterinarian, assessors conducted live assessments of horses/donkeys until each assessor had performed a minimum of five consecutively accurate assessments. The training was considered completed 154
158 Chapter 4 Donkeys when the assessors achieved 80% agreement with the silver standard, on both video and live scoring Data collection and statistical analysis Data analysis was performed using the statistical software package IBM SPSS Statistics 21 (IBM Corp., 2012). We assessed the probability that horses showed negative reactions to the human-animal tests using a Generalised Linear Mixed Model (Wald-like test). The farm was considered as random-effect to account for multiple horses stabled in the same facility. Fixed effects of farm classification (good or sub-optimal) and observer (two levels) were also included in the model. Inter-observer reliability was evaluated by comparing individual scores recorded by the two assessors independently and simultaneously. Prevalence indices for all the categories of the test scores were calculated. The prevalence index is the absolute difference between the agreed numbers for the two categories, divided by the total number of animals: Prevalence index= a-d /n Where a is the number of agreed-upon animals in one of the categories and d is the number of agreed-upon animals for the other categories; n is the total number of possible agreements, i.e. the number of animals. A prevalence index of 0 indicates a completely balanced population, while an index of 1 would be a homogenous population in which only one of the categories is represented (Burn et al., 2009). Inter-observer reliability was analysed by calculating, according to the type of variable (categorical, scale), percentage agreement (the proportion of ratings where the raters agree), Kappa values, Kendall s coefficient of concordance (W) and Interclass Correlation Coefficient (ICC). McNemar s and Wilcoxon s tests were performed in order to assess test repeatability by comparing results of the first and the second assessment. P values < 0.05 were considered statistically significant. 155
159 Chapter 4 Donkeys Results 3.1. Horses The behavioural tests used in this study proved to be feasible under field conditions in horses stabled in single boxes. No safety issues were encountered. All the owners showed good acceptability of the procedure adopted to test the animals. Total time required to perform all the tests on each horse varied from 90 to 180 seconds. Results of the three tests are reported in Table 4. In the Avoidance Distance test, most of the horses did not show any sign of avoidance (53.7%). In 38% of the subjects this test was not applicable (NA) because the horse did not take any notice of the assessor (e.g. the horse was looking out of the window or nibbling the floor looking for hay). In the VAA and FHA tests, positive reactions were displayed by most of the subjects whereas aggressiveness had the lowest prevalence in both tests. For safety reasons, horses that showed an aggressive reaction in the VAA test were not tested with the FHA (13.4%). Voluntary Animal Approach and Forced Human Approach tests were not applicable in very few cases, 18.8% and 13.4% respectively. 156
160 Chapter 4 Donkeys Species a Behavioural test Response Proportion of responses (%) H Avoidance Distance Avoidance (0) 8.3 (AD) No avoidance (1) 53.7 H Voluntary Animal Approach (VAA) H Forced Human Approach (FHA) D Avoidance Distance (AD) D Walking Down Side (WDS) NA Aggressive (0) Not interested (1) Positive (2) NA Aggressive (0) Avoidance (1) Neutral/Positive (2) Not tested (aggressive at VAA) NA Avoidance (0) No avoidance (1) Aggressive/Avoidance (0) Neutral/Positive (1) D Tail tuck Presence (0) Absence (1) a H = Horse D = Donkey 38., , Table 4 - Behavioural responses expressed as proportion (%) among the 313 horses (11 horse facilities) and 49 donkeys (8 farms). In the Avoidance Distance test measurements > 0 cm were combined in the category avoidance Validity There is no indication that the horses reactions to humans during the tests varied as consequence of a random farm effect (negligible variance) or because of different observers performing the tests (Avoidance Distance GLMM, P = 0.662; Voluntary Animal Approach GLMM, P = 0.687; Forced Human Approach GLMM, P = 0.065). Only being housed in a facility classified as having a good or sub-optimal human-horse relationship significantly affected the reactions of horses to the tests (Avoidance Distance GLMM, P = 0.005; Voluntary Animal Approach 157
161 Chapter 4 Donkeys GLMM, P = 0.035; Forced Human Approach GLMM, P = 0.01). In the Avoidance Distance test, only 1.4% of horses showed avoidance reaction on the farms classified as good, whilst in sub-optimal farms 13.8% of the subjects avoided the assessor when approached (see Figure 3). In the Voluntary Approach test, horses on good farms approached the assessor in 3±3 seconds, whilst they needed 6±7 seconds on sub-optimal farms. Furthermore, on farms classified as sub-optimal horses more often showed aggressive behaviour compared to good farms, with 6.9% and 0.7%, respectively (see Figure 3). 10.3% of horses from sub-optimal farms reacted in an aggressive way when approached, whereas only 5.8% of subjects belonging to good farms showed the same behaviour (see Figure 3). Figure 3 - Percentage of negative behaviours (avoidance and aggressive) showed during the three test (Mean ± 1DS). 158
162 Chapter 4 Donkeys Inter-observer reliability Observers agreement of the Avoidance Distance test scoring was consistent (Cohen s Kappa = 0.89; Percentage Agreement = 93.3%; Prevalence Index = 0.52), Voluntary Animal Approach test (Latencies: Spearman s Rho = 0.85; Behaviour: Cohen s Kappa = 0.40; Percentage Agreement = 67.7%; Prevalence Index = 0.57) and Forced Human Approach test (Cohen s Kappa = 0.75; Percentage Agreement = 85.5%; Prevalence Index = 0.58) Test re-test reliability Repeatability of tests was good for all the tests and no significant differences were found between two repetitions at three month intervals (Avoidance Distance test: McNemar P = 0.61; Voluntary Animal Approach test and Forced Human Approach test Wilcoxon P = 0.60 and P = 0.56 respectively) Donkeys The behavioural tests, developed for working equines, proved to be feasible for onfarm use as well. As all the donkeys were restrained, no safety issues were encountered. Most of the owners showed good acceptability of the procedure adopted to test the animals and in addition all owners were very willing to help in collecting and restraining the animals. Total time required to perform all the tests in each donkey varied from 60 to 90 seconds. Descriptive results of the three tests are presented in Table 1. In the Avoidance Distance test, most of the donkeys did not show any sign of avoidance (75.0%). In the Walking Down Side test, aggressive/avoidance behaviour as well as tail tuck was displayed rarely, 27.3% and 13.6% respectively. Most of the donkeys showed neutral or positive reaction when approached by the assessor (72.7%). All the tests were always feasible, due 159
163 Chapter 4 Donkeys to the fact that all the donkeys were restrained. However, test feasibility could be impaired in conditions where the donkeys cannot be restrained Inter-observer reliability Observers agreement of the Avoidance Distance test scoring was consistent (Cohen s Kappa = 0.54; Percentage Agreement = 81%; Prevalence Index = 0.43), Walking down side (Cohen s Kappa = 0.67; Percentage Agreement = 86%; Prevalence Index = 0.39), Tail tuck (Cohen s Kappa = 0.83; Percentage agreement = 95.3%; Prevalence Index = 0.70) Test re-test reliability Repeatability of tests was good for all the tests and no significant differences were found between two repetitions at three month intervals (Avoidance Distance test: McNemar P = 1.00; Walking down side and Tail Tuck tests McNemar P = 0.77 and P = 0.12, respectively). Discussion One of the most important results of the present research was that all the behavioural tests performed made it possible to differentiate between horse facilities with good or sub-optimal human-animal relationship, as previously evaluated by official veterinarians. It is to be noted that the human-horse relationship tests were performed by assessors unaware of the farm classification; thus they were not biased in their evaluation. In spite of the fact that the reactions of horses were largely positive, those kept in facilities with sub-optimal relationship showed avoidance and aggressive behaviours more often when approached. They also needed more time to approach the assessor voluntarily. We 160
164 Chapter 4 Donkeys propose that these measurements at farm level are sensitive and allow even relatively minor differences to be detected between farms. Human-animal relationship has an important impact on equine welfare as horses are handled on a daily basis. The presence of negative responses of equines to humans as an increased avoidance distance can be linked to the lack of confidence and/or fear of humans and suggests a variation in this relationship. Such negative responses can furthermore lead to flight reactions which can be dangerous for both horse and man. Our results are compatible with previous experimental studies showing that horses kept on farms where the management is focused on enhancing the relationship with horse and reducing their level of stress around humans, improve their reaction when they are facing a novel encounter with an unknown person (Fureix et al., 2009; Popescu and Diugan, 2013; Sankey et al., 2010; Søndergaard and Halekoh, 2003). Furthermore, the results of the present study provide evidence as to what extent the day to day behaviour of humans with horses can influence their reactions to simple on-farm behaviour tests. In fact, in facilities where horses are primarily managed by stable grooms, who possess an advanced and updated knowledge of welfare of horses, are inspected several times a day, and where positive interactions during routine handling procedures are enhanced, the horses showed more positive behaviours towards the assessors and they seemed to be more confident when approached by humans. In the present study, the possible confounding factors taken into account for assessing the validity of these behavioural tests were: the presence of pain, the underlying motivation of the horse and the context. Different studies showed that the presence of pain can fundamentally affect the behaviour of horses (Ashley et al., 2005; Fureix et al., 2010; Pritchett and Ulibarri, 2003). Indeed, one of the possible parameters taken into account when scoring pain in horses is how they react to the approach of an unknown human (Bussières et al., 2008; van Loon et al., 2010). Therefore, in the 161
165 Chapter 4 Donkeys present study only healthy horses were assessed. The underlying motivation of the horse can also affect how they react to human presence; for example, hungry horses can be more prone to approach a human if they have already identified the person as a source of food. To avoid this possible confounding factor we tested horses between meals, when no food was around. Horses are prey species and Søndergaard and Halekoh (2003) described that an unfamiliar and less spatial environment can affect their reaction to an unknown human during behavioural tests. It is for this reason that for the purposes of our research, all the horses were tested in their home box. It would be possible to argue that the avoidance distance could be influenced simply by habituation. That means, interacting more frequently with horses in their box may make them more used to the presence of humans in the box but not result in a general reduction of responsiveness towards humans in other situations. However, to some extent there might be an integrative effect of habituation and positive interaction as regards the effect of context. We report that in dairy cattle it was shown that the avoidance distance is not context specific, i.e., avoidance behaviour of animals under different test conditions is significantly related (Waiblinger et al., 2003; Windschnurer et al., 2008). Moreover, avoidance distances of dairy cows were shown to be related to milkers behaviour during milking (Waiblinger et al., 2003). In the home environment, it is desirable to have horses that are easy to approach. Studies to date reported that breed and age of the horse can also play an important role in how they react to humans (Fureix et al., 2009; Górecka-Bruzda et al., 2011; Søndergaard and Halekoh, 2003). In the present study all the subjects were adult warmblood sport and leisure horses. Further studies, with appropriate experimental designs, should verify whether differences in response to these tests, ascribable to the effect of breed, are narrower than the differences caused by the human-animal relationship. Given the findings of Søndergaard and Ladewig (2004) that young foals deprived of social contact 162
166 Chapter 4 Donkeys with other horses may be more inclined to seek human contact, it would be interesting/useful to evaluate this effect on the reaction to the above mentioned behavioural tests. Søndergaard and Halekoh (2003) found that age can affect the reaction to humans in VAA and FHA tests, but in their study all the horses were young (less than 2 years). The same authors described that the way their horses responded during these tests from 12 months of age onwards was no different to that of a horse 24 months of age. Therefore, they concluded that the effect of age in the human and animal approach tests may be an effect of familiarity to humans due to them being fed daily by people but it could also be an effect of the psychological development that horses undergo with age. We tested only adult horses, routinely handled on a daily basis and therefore both fully grown and used to human presence. As for donkeys, in the present study most of the donkeys exhibited positive behaviour towards the assessor with no signs of avoidance during the AD test, no aggressive/avoidance reaction during the WDS, and no tail tuck display. Our results support the findings described by other authors in working donkeys (Burn et al., 2009; Popescu and Diugan, 2013; Pritchard et al., 2005), moreover, they show that, not only in a working environment, but also on-farm, the assessment of donkeys reactions to an unknown human during standardized tests could prove useful in evaluating the quality of their relationship. The accuracy of the assessment of the human-animal relationship is crucial, mostly when different observers in different countries perform this assessment as a decision support tool in animal welfare valuation. In the present study, agreement among different assessors was good (Cohen s Kappa > 0.60) in both species for most of the human-animal relationship tests. The Voluntary Animal Approach test in horses and the Avoidance Distance in donkeys were the tests with the lowest agreement among observers. This may be due to the position of the observer while 163
167 Chapter 4 Donkeys the assessor was performing the test. Indeed, position is crucial when observing the reaction of the animal, most especially because the reaction is sometimes rapid and not so obvious. When evaluating inter-observer reliability, scientists should always take into account the prevalence of the different scores in the population assessed. As already pointed out by Burn and colleagues (2009), the prevalence of certain observations reduces the reliability ratings. In the present study, the prevalence was unbalanced - with a certain score more present compared to others - only for Avoidance Distance in horses and Tail Tuck in donkeys. Therefore, reliability for these tests was difficult to prove. This limitation was already described in similar studies carried out on working equines (Burn et al., 2009). For both horses and donkeys, all the tests performed to assess human-animal relationship were proved feasible in an on-farm environment. Little time was required to perform them (maximum of three minutes per animal), the step by step procedure guaranteed the safety of the animals and people involved, and they required minimal handling of the subjects. Among the horses behavioural tests, the Avoidance Distance and Voluntary Animal Approach tests can be performed without entering the box, and therefore can be carried out even though the owner is not available to help and without interfering in any way with the daily routine of the horses. For the same reasons, all the behavioural tests were well accepted by horse and donkey owners. Given the subjective nature of the scoring process, training should be considered as a key issue so that the achievement of consistent evaluation by different assessors is obtained. In the present study, training of assessors was both theoretical and practical. Working both through videos, as a class or an on-line exercise, and onfarm paired with a silver standard assessor on a purposely selected population (where the scores of the studied variable vary) proved vital in targeting good interobserver reliability. 164
168 Chapter 4 Donkeys As far as mid-term repeatability is concerned, the results of the present study showed that the behavioural reactions of both horses and donkeys to unknown assessors did not change in a three-month interval. These findings confirmed that the relationship between horses and humans, based on repeated interactions, reflects each subject s expectations during the encounters that follow. Thus, if the animals are kept in the same management conditions, the behavioural reaction to standardized human-animal relationship tests does not significantly change over time. Conclusion The Avoidance Distance, Voluntary Animal Approach and the Forced Human Approach tests proved useful to assess the human-horse relationship at farm level due to their feasibility, reliability, 3-months interval repeatability and ability to identify differences between horse facilities. Our results concerning the ability of these tests to reflect horses previous experience with humans and their expectations on future interactions are encouraging. Moreover, our findings reveal that horses, kept in facilities where they are cared for by grooms with not only professional competence, but also advanced and updated knowledge on welfare of horses, react in a more positive way when approached by an unknown person. However, further studies are needed to determine to what extent responses to these tests are ascribable to the effect of breed and deprivation of social contact with other horses. We suggest that future work should investigate specifically these factors and assess the reliability of these tests on group housed horses. Given the relatively higher proportion of horses where the Avoidance Distance test was not applicable and the unbalanced prevalence of certain scores, this test should be 165
169 Chapter 4 Donkeys considered as the preferred choice only as a first step in the assessment of the human-horse relationship and when the forced human approach test is not feasible. As for donkeys, our findings show that the Avoidance Distance, Walking Down Side and Tail Tuck tests are feasible and reliable measurements in a typical Western Countries farm environment. The prevalence of tail tuck was unbalanced; therefore, we suggest taking into account this possible limitation during the training of assessors. In general our results support the findings in other species (Waiblinger et al., 2006, 2003; Windschnurer et al., 2009) that good human-animal relationship can be identified through looking at the reaction of the animal in a standardized interaction with an unknown assessor and underlines the importance of human behavior in the interaction. Further research is needed to increase the number of equine farms, under different husbandry conditions and with different breeds. Acknowledgements The authors wish to thank the EU VII Framework program (FP7-KBBE ) for financing the Animal Welfare Indicators (AWIN) project. The authors would like to thank Chantal Bonaita, Sara Pedretti, Alessandra Guzzeloni, Elisa Govoni, Alessandra Meazza, for their help in assessing the animals; we also acknowledge Kirk Ford for his extensive and professional revisions of language and structure. 166
170 Chapter 4 Donkeys References Acock, A.C., A gentle introduction to Stata. Stata Press, College Station, USA. Ashley, F.H., Waterman-Pearson, A.E., Whay, H.R., Behavioural assessment of pain in horses and donkeys: application to clinical practice and future studies. Equine Vet. J. 37, Burn, C.C., Pritchard, J.C., Whay, H.R., Observer reliability for working equine welfare assessment : problems with high prevalences of certain results. Anim. Welf. 18, Bussières, G., Jacques, C., Lainay, O., Beauchamp, G., Leblond, A., Cadoré, J.-L., Desmaizières, L.-M., Cuvelliez, S.G., Troncy, E., Desmaizie, L., Development of a composite orthopaedic pain scale in horses. Res. Vet. Sci. 85, Chamove, A., Crawley-Hartrick, O., Stafford, K., Horse reactions to human attitudes and behaviour. Anthrozoos A Multidiscip. J. Interact. People Anim. 15, Cronbach, L.J., Meehl, P.E., Construct validity for psycological tests. Psycol. Bull. 52, Estep, D., Hetts, S., Interactions, relationships and bonds: the conceptual basis for scientist-animal relations, in: Davis, H., Balfour, D. (Eds.), The Inevitable Bond: Examining Scientist-Animal Interactions. Cambridge University Press, Cambridge, UK, pp Fureix, C., Menguy, H., Hausberger, M., Partners with bad temper: reject or cure? A study of chronic pain and aggression in horses. PLoS One 5, e doi: /journal.pone Fureix, C., Pagès, M., Bon, R., Lassalle, J.-M., Kuntz, P., Gonzalez, G., A preliminary study of the effects of handling type on horses emotional reactivity and the human-horse relationship. Behav. Processes 82, doi: /j.beproc Górecka-Bruzda, A., Jastrzębska, E., Sosnowska, Z., Jaworski, Z., Jezierski, T., Chruszczewski, M.H., Reactivity to humans and fearfulness tests: Field validation in Polish Cold Blood Horses. Appl. Anim. Behav. Sci. 133, doi: /j.applanim Hausberger, M., Muller, C., Short communication A brief note on some possible factors involved in the reactions of horses to humans. Appl. Anim. Behav. Sci. 76, Hausberger, M., Roche, H., Henry, S., Visser, E.K., A review of the humanhorse relationship. Appl. Anim. Behav. Sci. doi: /j.applanim
171 Chapter 4 Donkeys Hemsworth, P., Coleman, G., Human-Livestock Interactions: The Stockperson and the Productivity and Welfare of Intensively Farmed Animals. CAB International, Oxon, UK. Hemsworth, P.., Human animal interactions in livestock production. Appl. Anim. Behav. Sci. 81, doi: /s (02) Hemsworth, P.H., Barnett, J.L., Coleman, G.J., The human-animal relationship in agriculture and its consequences for the animal. Anim. Welf. 2, Henry, S., Richard-Yris, M.A., Hausberger, M., Influence of various early human foal interferences on subsequent human foal relationship. Dev. Psychobiol. 48, IBM Corp., IBM SPSS Statistics for Windows. Lansade, L., Bouissou, M., Erhard, H., Fearfulness in horses: A temperament trait stable across time and situations. Appl. Anim. Behav. Sci. 115, doi: /j.applanim Lesimple, C., Fureix, C., LeScolan, N., Richard-Yris, M.A., Hausberger, M., Housing conditions and breed are associated with emotionality and cognitive abilities in riding school horses. Appl. Anim. Behav. Sci. 129, Ligout, S., Bouissou, M.-F., Boivin, X., Comparison of the effects of two different handling methods on the subsequent behaviour of Anglo-Arabian foals toward humans and handling. Appl. Anim. Behav. Sci. 113, doi: /j.applanim Mattiello, S., Battini, M., Andreoli, E., Minero, M., Barbieri, S., Canali, E., Avoidance distance test in goats: A comparison with its application in cows. Small Rumin. Res. 91, doi: /j.smallrumres Mendl, M., Burman, O.H.P., Paul, E.S., An integrative and functional framework for the study of animal emotion and mood. Proc. Biol. Sci. 277, doi: /rspb Napolitano, F., De Rosa, G., Girolami, A., Scavone, M., Braghieri, A., Avoidance distance in sheep: Test retest reliability and relationship with stockmen attitude. Small Rumin. Res. 99, doi: /j.smallrumres Popescu, S., Diugan, E.A., The Relationship Between Behavioral and Other Welfare Indicators of Working Horses. J. Equine Vet. Sci. 33, doi: /j.jevs Pritchard, J.C., Lindberg, A.C., Main, D.C.J., Whay, H.R., Assessment of the welfare of working horses, mules and donkeys, using health and behaviour parameters. Prev. Vet. Med. 69, doi: /j.prevetmed
172 Chapter 4 Donkeys Pritchett, L., Ulibarri, C., Identification of potential physiological and behavioral indicators of postoperative pain in horses after exploratory celiotomy for colic. Appl. Anim. Behav. Sci. 80, Sankey, C., Richard-Yris, M.-A., Leroy, H., Henry, S., Hausberger, M., Positive interactions lead to lasting positive memories in horses, Equus caballus. Anim. Behav. 79, doi: /j.anbehav Søndergaard, E., Halekoh, U., Young horses reactions to humans in relation to handling and social environment. Appl. Anim. Behav. Sci. 84, doi: /j.applanim Søndergaard, E., Ladewig, J., Group housing exerts a positive effect on the behaviour of young horses during training. Appl. Anim. Behav. Sci. 87, doi: /j.applanim Van de Mortel, T., Faking It: Social Desirability Response Bias in Selfreport Research. Aust. J. Adv. Nurs. 25, Van Loon, J., Back, W., Hellebrekers, L.J., van Weeren, P.R., Loon, J.P.A.M. Van, Weeren, V., Application of a Composite Pain Scale to Objectively Monitor Horses with Somatic and Visceral Pain under Hospital Conditions. J. Equine Vet. Sci. 30, Waiblinger, S., Boivin, X., Pedersen, V., Tosi, M.-V., Janczak, A.M., Visser, E.K., Jones, R.B., Assessing the human animal relationship in farmed species: A critical review. Appl. Anim. Behav. Sci. 101, doi: /j.applanim Waiblinger, S., Menke, C., Fölsch, D.., Influences on the avoidance and approach behaviour of dairy cows towards humans on 35 farms. Appl. Anim. Behav. Sci. 84, doi: /s (03) Windschnurer, I., Schmied, C., Boivin, X., Waiblinger, S., Reliability and inter-test relationship of tests for on-farm assessment of dairy cows relationship to humans. Appl. Anim. Behav. Sci. 114, doi: /j.applanim Windschnurer , I., Boivin, X., Waiblinger, S., Reliability of an avoidance distance test for the assessment of animals responsiveness to humans and a preliminary investigation of its association with farmers attitudes on bull fattening farms. Appl. Anim. Behav. Sci. 117,
173 Chapter 4 Donkeys USE OF QUALITATIVE BEHAVIOUR ASSESSMENT AS AN INDICATOR OF WELFARE IN DONKEYS Michela Minero 1, Emanuela Dalla Costa 1, Francesca Dai 1, Leigh Anne Margaret Murray 1, Elisabetta Canali 1, Francoise Wemelsfelder 2 1 Università degli Studi di Milano, Dipartimento di Scienze Veterinarie e Sanità Pubblica, Milano, Italy 2 Animal & Veterinary Sciences, SRUC, Roslin Institute Building, Easter Bush, United Kingdom In preparation Abstract One of the objectives of the AWIN project is to develop animal-based indicators to assess donkey welfare, including their emotional state. This study aimed to develop a fixed rating scale of Qualitative Behaviour Assessment for donkeys, to evaluate the inter-observer reliability when applied on-farm, and to assess whether the QBA outcomes correlate to other welfare measures. A fixed list of 16 descriptors was designed on the basis of a consultation in a focus group. The fixed list was then applied by four trained observers on nine videos and 11 donkey facilities representative of the most common type of donkey facilities in Western Europe. One experienced assessor collected different welfare measures on all the adult donkeys present on farm. The QBA scores and welfare measures were analyzed using Principal Component Analysis (PCA, correlation matrix, no rotation). Kendall s W and ANOVA were used to assess inter-observer reliability. 170
174 Chapter 4 Donkeys PCA revealed three main components explaining 79% of total variation between them. PC1 ranged from at ease/relaxed to aggressive/uncomfortable, suggesting that this Component is important in the description of the valence of donkeys affective states. PC2 was more related to the level of arousal of donkeys, ranging from apathetic to distressed/responsive. The four assessors showed a good level of agreement on either dimension of the PCA (Kendall s W varying from 0.61 and 0,90; ANOVA p>0.05) on both videos and on-farm. The PCA on QBA scores merged with the other welfare indicators revealed three main components explaining 71.79% of total variation between donkey farms. QBA descriptors were related to positive human-donkey welfare indicators (e.g. no avoidance distance or tail tuck). Other measures (e.g. hooves condition or lesions) were not linked with QBA descriptors. Our findings suggest that QBA is a suitable tool to identify the emotional state of donkeys on-farm. A fixed list of descriptors can be used consistently by different trained assessors as a valid addition to a number of animal welfare assessment indicators. Keywords: donkeys, Qualitative Behaviour Assessment, welfare assessment 171
175 Chapter 4 Donkeys Introduction Thanks to their adaptability to very different types of activity, e.g. cultivation, transport, trekking, onotherapy, education, garbage collection, from the year 2000 the number of donkeys in Europe was reported to be growing (Faostat, 2011) and their welfare has become a concern. Over the last decade a lot of effort was placed in developing valid and objective methods to assess animal welfare on-farm (EFSA Panel on Animal Health and Welfare, 2012; Knierim and Winckler, 2009; Visser et al., 2014). One of the aims of Animal Welfare Indicators (AWIN), an international animal welfare research project funded by EU FP7, is developing welfare indicators that are supported by scientific evidence for donkeys, among other species ( Animal Welfare Indicators project, 2012). These welfare indicators are largely animal based and reflect the animal s perception of its situation (EFSA Panel on Animal Health and Welfare, 2012). Positive welfare indicators consider the presence of positive emotions and present the advantage of enabling a better communication of the commitment to reach higher welfare standards in a more proactive manner. However, investigating affective states of animals might be a difficult task, especially when the evaluation has to be performed on-farm. Differently from humans, where verbal language helps to assess emotional experiences, in animals only behavioural and physiological measurements help to evaluate the emotions that are assumed to correspond to opportunity situations where the pleasure conferred by being able to perform a behaviour or enjoy a resource motivates the animal (Berns et al., 2012; Fraser and Duncan, 1998). Qualitative Behaviour Assessment (QBA) is a relatively new scientific method to evaluate the expressive quality of animal behaviour and emotions. It integrates and summarises the different aspects of an animal s dynamic style of interaction with the environment and can be used in addition to other welfare indicators or classical ethological measures (Wemelsfelder et al., 2000). The use of QBA enables the 172
176 Chapter 4 Donkeys identification of the main dimensions of mood states (Mendl et al., 2010) and facilitates bridging the gap that traditionally exists between subjective judgments and scientific measurement approaches (Minero et al., 2009; Wemelsfelder, 2007). This method relies on the ability of humans to integrate observed details of behaviour and to address the animal s experience through the expressive nature of its dynamic demeanour. In research, when using both quantitative and qualitative methods for assessing behaviour, it is essential to avoid anthropomorphism and possible observer bias; for this reason it is fundamental to know the animal species, in this case donkeys, well. Many studies proved that, when correctly applied, QBA shows good correlations to behavioural, physical and physiological measures, thus confirming the validity of the observers assessments (Brscic et al., 2010; Walker et al., 2010; Wemelsfelder et al., 2000). Importantly, QBA is reported to be a method that can either be applied retrospectively, e.g. to assess animals on video footage, or has the potential for immediate use, for example in on-farm welfare assessments (Fleming et al., 2013). QBA scoring uses a selected list of terms to describe the different elements of an animal s expressive repertoire (Wemelsfelder, 2007). These terms have an expressive, emotional connotation and can be individually generated by observers, as in the case of the Free-Choice-Profiling methodology (FCP), or they are chosen by researchers first from literature and then discussed in focus groups of experts and tested on-farm (Andreasen et al., 2013). FCP is unsuitable for on-farm welfare assessment, as it requires a minimum of 10 observers and extensive data analysis; hence, the second approach using a fixed list of terms is generally adopted for on-farm assessment. A growing body of research indicates that QBA can be rigorously applied to answer different research questions in horses (Fleming et al., 2013; Minero et al., 2009; Napolitano et al., 2008) and other farm animals (Bassler et al., 2013; Napolitano et al., 2012; Rousing and Wemelsfelder, 2006; Rutherford et al., 2012; Wemelsfelder, 2012; 173
177 Chapter 4 Donkeys Wemelsfelder et al., 2000). To date, no authors have yet published works where QBA has been applied to donkeys. QBA has the potential to indicate the positive aspects of the welfare, however most researchers agree that, with welfare being a complex multidimensional concept, no single indicator can be considered as an exhaustive system to evaluate the welfare of animals, and it is always preferable to integrate and cross-validate QBA with other measures of welfare. In fact, QBA cannot be used as a stand-alone welfare indicator, as it does not cover all the aspects of the welfare of the animal (Andreasen et al., 2013). The aim of the present study was to develop a fixed QBA rating scale for donkeys and to evaluate the inter-observer reliability of trained assessors using the fixed QBA rating scale from videos and on-farm. Furthermore, we aimed to assess if the QBA outcomes correlate to other measures of donkey health and welfare, taken at the same time on the same farms. Material and methods 2.1 Development of the rating scale A first selection of QBA descriptors was made from a list of terms derived from papers where qualitative terms were used to describe donkey behavior. The list contained 27 terms, given in English, that were then discussed during a focus group. 2.2 The focus group On February 7 th and 13 th 2013 a focus group on Qualitative Behaviour Assessment (QBA) in donkeys took place on-line, thanks to technical support offered by the University media technology department. An international group of seven people with different types of donkey experience (veterinarians, breeders, donkey welfare experts) participated in the focus group. Françoise Wemelsfelder explained how to 174
178 Chapter 4 Donkeys assess animal behaviour as expressive body language and introduced the QBA method. The participants discussed the list of 27 descriptors chosen from the literature on donkeys, and agreed on a brief general characterisation of each selected term. Participants were asked to give examples and describe situations in which different terms could be used, to be able to create term characterisations that were widely applicable. In a second round, they refined some of the term descriptions and removed 12 terms which they felt may be difficult to interpret, or may not be very relevant to the on-farm assessment of donkey welfare. Participants discussed the possible differences in the interpretation of descriptors between different languages; in order to overcome linguistic barriers, the use of English as well as bilingual dictionaries proved useful for reaching consensus among participants about the brief characterisations of the terms. As a practical exercise, the participants of the focus group then watched seven videos of donkeys, filmed individually or in groups for 1 min, and used QBA to score them using the list of descriptors. After this, one term was added to the list and was given a characterisation. It was agreed that this list of 16 terms (Table 1) would be used to score donkeys at 11 farms/facilities in Italy, with the understanding that following observations carried out on farms, it may be revised further. The rating scale to be tested was construed by putting each of the descriptors next to a continuous visual analogue scale of 125 mm length where the terms minimum (this expressive quality is absent) and maximum (this quality could not be present more strongly) represented the ends of the scale. 175
179 Chapter 4 Donkeys Aggressive Agitated Anxious Apathetic At ease Curious Distressed Fearful Friendly Happy Playful Pushy Relaxed Responsive Uncomfortable Withdrawn Behaving in an angry or rude way, fighting or attacking another donkey Restless, an animal can stand still and be agitated, fidgety, worried or upset, excited, disturbed, troubled Worried/tense, troubled, apprehensive, distressed Having or showing little or no emotion; indifferent In a relaxed attitude or frame of mind Eager to learn, inquisitive, wishing to investigate Much troubled, upset, afflicted, panicking Having fear, afraid, even not linked with something going on in the environment, flight response, look anxious, back up/away, not move further. On the same side; not hostile, showing positive feelings toward another animal or person/ the donkey approaches another animal/person and expressing grooming behaviour Feeling, showing or expressing joy, pleased Very active, happy, and wanting to have fun, mischievous Offensively assertive or forceful, bossy, dominant To make less tense or rigid Receptive, aware of the environment Not comfortable, not relaxed Secluded or remote, shy, not searching for contact with others Table 1 - List of descriptors and definitions agreed during the focus group. 2.3 Training of assessors The four assessors were all female, aged between 25 and 36 years, consisting of two veterinarians who were researchers in the field of applied ethology, and two zoologists. Before the first assessment, the four assessors, all experienced with donkeys, and skilled in assessing animal behaviour, were made familiar with the concept of QBA by reading relevant scientific literature and participating as auditors in the focus group. They then further discussed the meaning of descriptors 176
180 Chapter 4 Donkeys as a group, and familiarized themselves with the QBA procedures. To test interobserver reliability of the QBA term list, assessment was carried out from nine videos, each of 2 min duration, of groups of donkeys owned by six farms. The number of donkeys in each video varied from two to 20. Assessors scored the videos independently and without talking to each other during the entire procedure. 2.4 Farm visits Qualitative Behaviour Assessment QBA assessments were carried out on 11 donkey farms representative of the most common type of donkey facilities in Western Europe: four dairy donkey farms, three facilities where donkeys were used for Animal Assisted Activities, one donkey sanctuary and three farms where donkeys were kept as companion animals. The average number of animals per farm was 20 (min 10 max 150). The assessments were performed in the morning, in case of dairy donkey farms at least 2 h after milking. Straw or hay was always available to the animals. Assessors were expressly unaware of the different backgrounds of the farms, they have never entered them before and they did not have expectations about the outcome of the assessment. QBA took place immediately after entering the farms and letting the animals adapt to the observers presence. The four assessors were always dressed in the same type and color of clothes at all the farms. The assessment took place outside of the paddocks where animals were kept, without disturbing them. Observers assessed the same animals at the same time without talking to each other, observation sessions lasted from 10 to 15 minutes. Depending on how the farm was structured, observers needed to move in order to be able to observe all animals, so one or two points of observation per farm were used. After observing the donkeys, the assessors moved to a place where they were not visible to the animals and scored independently the animals on the 16 qualitative descriptors 177
181 Chapter 4 Donkeys using an Android application, specifically developed for QBA data collection. The assessors ticked the visual analogue scale next to each descriptor at the appropriate point. The score was automatically recorded as the measure of the distance in millimeters between the left minimum point of the scale and the point where the observer s thick crossed the line. Thus, for each observer and each farm, a data spreadsheet was automatically created containing the scores of observed donkeys on each of the 16 qualitative descriptors Welfare assessment A further welfare assessment was carried out after completing QBA scoring. One trained assessor scored on each farm all adult donkeys individually. Data was gathered on relevant animal based indicators selected or developed by AWIN researchers (Table 2 ), related to the four principles used in the Welfare Quality framework (Dalla Costa et al., 2014). 178
182 Chapter 4 Donkeys Measure Definition Score Aggregation at farm level Ear Ear position while Relaxed, Flat backaggressive Relaxed ears: position assessed by the observer proportion of donkeys with relaxed ears BCS Body Condition Score 1-5 according to BCS=3:Proportion of (Quaresma, Payan- donkeys with BCS Carreira, & Silva, score=3 2013) Skin lesions Presence of skin lesions (alopecia, superficial or Yes, no No lesions: proportion of donkeys with no Joint swellings Hoof condition deep wounds) Presence of joint swellings Presence of signs of neglecting e.g. hoof overgrowth skin lesions Yes, no No joint swellings: proportion of donkeys with no joint swellings No signs of neglecting, clear signs of overgrowth Good hooves condition: proportion of donkeys with no signs of neglecting of the hooves AD Presence of any Distance (cm) of the No AD: proportion of avoidance distance first avoidance donkeys with no behaviour while behaviour avoidance signs (0 cm) approached WDS Walking down the side Negative reaction, Positive WDS: of the donkey towards its neutral-positive proportion of donkeys tail and assess the with neutral/positive behaviour reaction Tail tuck Presence of tail tuck Yes; no No tail tuck: proportion of donkeys with no tail tuck Table 2 - List and definitions of animal based measures, their score and the aggregation at farm level 2.5 Statistical analysis When the video scoring and the farm visits had been completed, the QBA scores provided by the four assessors were automatically downloaded from the QBA App to an Excel file. The other animal based welfare measures collected on single donkeys during farm visits were aggregated at farm level as described in Table 2 179
183 Chapter 4 Donkeys and entered in an Excel file. IBM SPSS Statistics 21 software (IBM Corp., 2012) was used for statistical analysis. Data was tested for normality using Kolmogorov- Smirnov test. As variables were not normally distributed, the scores were transformed using x ij = log (1 + x ij ) transformation. To analyze QBA scores, a Principal Component Analysis (PCA, correlation matrix, no rotation) was conducted separately for every phase of the research (videos and on-farm assessment). The PC scores attributed to the animals on the observed farms on the first two main PCA components were then tested for inter-observer reliability, using Kendall Correlation Coefficient W. Kendall W values can vary from 0 (no agreement at all) to 1 (complete agreement), with values higher than 0.6 showing substantial agreement. In order to test whether there were any significant effects of observer on the PCA farm scores, a one-way analysis of variance was conducted on the PC1 and PC2 scores of the four observers (separately for videos and onfarm assessments), with observer as fixed effect and farm as random factor. Subsequently the inter-observer reliability for each descriptor separately was calculated using Kendall s W. To assess how Qualitative Behaviour Assessment related to the other animal-based welfare indicators, welfare measures aggregated at farm level and QBA scores were merged in a new file and analysed using a Principal Component Analysis (PCA, correlation matrix, no rotation). Results 3.1 Reliability testing Regarding the results on inter-observer reliability of QBA, Table 3 reports the variance explained by the first two Principal Components of PCA analysis (separate for videos and on-farm assessment), and the Kendall s W values for the four observer scores on these components. The assessors overall showed a good level of agreement for the first two PCA components, with W varying between 180
184 Chapter 4 Donkeys 0.61 and There was no significant effect of observer on mean QBA scores on either dimension (ANOVA PC1 F=2.22; p=0.11; ANOVA PC2 F=1.32; p=0.28), indicating that observers not only ranked the different donkey farms in similar ways, but also gave them similar scores on the rating scales. ANOVA indicated that there was a significant effect of the farm on both PC1 and PC2 (ANOVA PC1 F=10.68; p=0.00; ANOVA PC2 F=5.39; p=0.00, ANOVA PC3 F=2.48; p=0.02) indicating that donkeys housed in a given farm were perceived as in a different emotional state from donkeys in other farms. PCA Factor 1 PCA Factor 2 Videos % of variation explained 40% 16% Kendall s W (N=4, df=8) 0,90 0,66 On-farm assessment % of variation explained 45% 14% Kendall s W (N=4, df=10) 0,61 0,69 Table 3 - PCA outcomes and inter-observer reliability for the QBA rating scales Table 4 shows the Kendall s W values for each of the QBA donkey descriptors separately. For video assessments, the assessors showed good overall agreement with 13 out of 16 descriptors showing Kendall W values higher than 0.6. For onfarm assessment, the observers agreement in using single descriptors varied depending on whether all 11 farms visited were analyzed together (for seven out of 16 terms W>0.6), or only the last six farm (for 12 out of 16 terms W>0.6), indicating the importance of growing experience in reaching agreement on the use of single terms. Due to the good overall inter-observer reliability in using the QBA and considering also the increasing agreement in the observers scores for separate terms after some on-farm experience, in subsequent analysis we considered only the data of one observer scoring the 11 donkey farms visited. 181
185 Chapter 4 Donkeys Kendall s W Descriptor 11 donkey last 6 donkey videos facilities facilities entered Aggressive 0,36 0,70 0,86 Agitated 0,60 0,63 0,74 Anxious 0,56 0,31 0,22 Apathetic 0,67 0,42 0,58 At ease 0,84 0,51 0,76 Curious 0,85 0,65 0,84 Distressed 0,65 0,69 0,82 Fearful 0,55 0,39 0,33 Friendly 0,75 0,51 0,61 Happy 0,91 0,49 0,66 Playful 0,60 0,51 0,51 Pushy 0,71 0,60 0,74 Relaxed 0,79 0,51 0,71 Responsive 0,50 0,29 0,48 Uncomfortable 0,84 0,58 0,67 Withdrawn 0,63 0,70 0,82 Table 4 - Kendall s W correlation coefficients for all descriptors evaluated by 4 observers from videos and on-farm. Values larger than 0,6 (approximated to two decimal places) are bold typed. 3.2 Outcomes for QBA assessment of the farms Table 5 shows the outcomes of the PCA on QBA assessment of the 11 farms visited. The analysis identified five main factors with Eigen value greater than 1; the first three Components together explain 79.00% of variation between donkey farms. 182
186 Chapter 4 Donkeys PC1 PC2 PC3 Eingen value 6,9 3,5 2,0 % of variance explained 43,7 22,5 12,8 % cumulative variance explained 43,7 66,2 79,0 Descriptor PC1 PC2 PC3 Agitated -0,675-0,703-0,113 Aggressive -0,868 0,038-0,289 Apathetic -0,451 0,464 0,318 At ease 0,946-0,148-0,243 Anxious 0,172-0,464 0,587 Curious 0,455-0,114 0,022 Distressed -0,262-0,893-0,275 Fearful -0,775-0,156 0,486 Friendly 0,741-0,481 0,173 Happy 0,846-0,425-0,277 Playful -0,126-0,599-0,670 Pushy -0,858-0,255-0,265 Relaxed 0,977-0,055-0,032 Responsive 0,203-0,744 0,469 Uncomfortable -0,861-0,449 0,129 Withdrawn 0,159-0,469 0,520 Table 5 - The principal component analysis (PCA) of the QBA descriptors. The highest loadings for each factor are typed in bold. Figure 1 shows the distribution of the descriptors along the first two PCA factors. Component 2 counts for 22.49% of variance and seems to be more related to the level of arousal of donkeys ranging from apathetic to distressed/responsive. Many of the terms load on the first Principal Component accounting for 43.70% of the total variance and ranged from at ease/relaxed to aggressive/uncomfortable, 183
187 Chapter 4 Donkeys suggesting that this Component is important in the description of the valence of donkeys affective states. Animals with high positive scores on this Component can be described as in a more positive emotional state than donkeys with high negative scores. The third Component, counting for 12.80% of the total variance is characterized by anxious/withdrawn and playful with opposite signs. As play is certainly linked with a good relationship with other group mates and a positive emotional state, donkeys with high negative scores on the third Component can be described as much more in harmony with their mates and the environment they live in. Figure 1 Bi-plot of the descriptor loadings on the first and second Principal Components (PC1 and PC2). 184
188 Chapter 4 Donkeys 3.3 Relationship between QBA and other welfare indicators The Principal Component Analysis on QBA scores together with the other welfare indicators measures revealed three main components explaining 71.79% of total variation between donkey farms (Table 6). QBA descriptors appear to be correlated to some welfare measures: PC1 shows that QBA descriptors linked with positive emotional state (e.g. happy, friendly, at ease, relaxed) are associated with positive human-donkey welfare indicators (e.g. no AD, no tail tuck, positive WDS). On the other hand, other measures such as no joint swellings, good hooves condition, and no lesions weight more on the third Component and are not linked with QBA descriptors. 185
189 Chapter 4 Donkeys PC1 PC2 PC3 Eigen value 10,31 4,25 2,65 % of variance explained 43,00 17,75 11,04 % cumulative variance explained 43,00 60,75 71,79 Items PC1 PC2 PC3 Agitated -0,563 0,728-0,001 Aggressive -0,877 0,051 0,196 Apathetic -0,512-0,368-0,306 At ease 0,947 0,068 0,239 Curious 0,314 0,122 0,654 Fearful -0,792 0,229-0,207 Friendly 0,736 0,410 0,103 Happy 0,887 0,328 0,247 Playful -0,055 0,598 0,492 Pushy -0,815 0,341 0,137 Relaxed 0,992-0,038-0,021 Responsive 0,325 0,699-0,539 Uncomfortable -0,798 0,501-0,104 Anxious 0,129 0,489-0,096 Distressed -0,131 0,888 0,101 Withdrawn 0,161 0,522-0,414 Relaxed ears -0,452 0,554 0,033 No AD 0,846 0,085 0,085 Positive WDS 0,883 0,337 0,068 No Tail tuck 0,931 0,090 0,058 BCS=3-0,637 0,104 0,433 No joint swellings -0,435 0,306 0,510 Good hooves condition 0,247-0,056 0,591 No lesions -0,589-0,430 0,595 Table 6 - The principal component analysis (PCA) of the QBA descriptors and the welfare measures. The highest loading behaviours for each factor are typed in bold. Discussion The first objective of this research was to develop a fixed QBA rating scale for onfarm assessment of welfare of donkeys. A focus group consisting of seven 186
190 Chapter 4 Donkeys scientists experienced with donkeys generated a fixed list composed by seven positive and nine negative descriptors. There was great discussion on the differences in interpretation between different languages, with many analogies being used to convey particular descriptors. Participants in the focus group reported that the discussion was very useful and suggested that assessors take time to discuss the terms on a list in order to develop a common understanding of these terms. Therefore, as a result of the above mentioned discussion, a brief characterisations of each terms was created. To date, this was the first time that a comprehensive characterisations for each descriptor of a fixed list of QBA terms for a particular species was created as an aid for new assessors. The participants suggested that the fixed list generated could be adapted should assessors being interested in evaluating different conditions and or situations very dissimilar to the ones described in the present study. A central characteristic for any measurement tool is consistency in measurements when applied by different assessors (Martin and Bateson, 2007). According to our results, reached satisfactory agreement using each of the QBA descriptors when scoring videos, but they found more difficult to score some terms (i.e. friendly, happy, playful) in a similar way when on-farm. One possible explanation is that scoring live poses different challenges from scoring from videos and that more training and experience are needed on-farm in order to reach a better level of agreement. This supposition is confirmed by the results of the analysis performed on the last six farms visited, where the level of agreement, using single descriptors improved, with only three of them (anxious, fearful and responsive) showing a lower level of agreement and one (playful) showing a moderate level of agreement. These results are promising and highlight the importance of the use of a clear definition of descriptors and training in the use of a fixed list of QBA terms for onfarm welfare assessment (Bokkers et al., 2012; Meagher, 2009). To notice that our 187
191 Chapter 4 Donkeys findings underline that on-farm training of new assessors is paramount to reach a good reliability. Our results confirm that a fixed list of qualitative terms can be used consistently by trained assessors to evaluate the emotional state of animals in an on-farm environment (Napolitano et al., 2012; Phythian et al., 2013; Rutherford et al., 2012; Sant Anna and Paranhos da Costa, 2013). ANOVA further strengthens that the agreement among observers has been good. Therefore, the choice of assessors is a key element: it is necessary that they have a good experience in observing the behaviour of the species they are evaluating. As QBA works by relative comparison of samples and depends on contrasting expressions to anchor quantification of intermediate welfare values, it can be suggested that the more different samples are the better the method works. This is fundamental especially during on-farm training of assessors. In the present study, the voluntary participation of donkey facilities may have interfered with the variability and representativeness of the farm sample. In fact, it might be argued that only facilities achieving acceptable welfare of donkeys would intentionally take part in a study on welfare assessment. Previous QBA studies conducted on-farm report they also may have been limited by this factor (Andreasen et al., 2013). In future on-farm studies it would be preferable to enlarge the number of visited farms and to make sure that the selected sample of farms shows a sufficiently large spread in levels of welfare. In line with the findings of other QBA studies (Minero et al., 2009; Rutherford et al., 2012; Sant Anna and Paranhos da Costa, 2013), the assessors used the descriptors in a similar way to distinguish between expressions of positive and negative animal emotions. It is worth to notice that, in the present study, QBA was performed as the first evaluation on-farm, on undisturbed animals, before taking any other welfare measure. This means, for instance, that the donkeys were described as fearful or friendly before seeing their reaction to humans. A 188
192 Chapter 4 Donkeys peculiarity of the present study was that assessors were totally unaware of the farms welfare characteristics before starting the QBA. It is paramount that the evaluation of behaviour of animals took place as soon as the assessors enter the farm and without that they are influenced by the information collected on animals or on stockmen people. The relation found between QBA results and no avoidance distance, no tail tuck and positive reaction to the Walking Down Side test confirm was what previously highlighted in other species (Brscic et al., 2010; Ellingsen et al., 2014). Ellingsen and colleagues (2014) found that cows described as tense, fearful, scared and nervous were primarily handled by stockpersons aggressive/dominating or insecure/nervous. On the other hand, confident, calm and friendly cows were handled by calm/patient stockpersons and received more positive interactions (e.g. talking quietly, petting and touching). Welfare is a complex concept, that encompasses different aspects of physical and mental health of animals (Broom, 2011). These aspects are both very important and almost independent, this is the reason why welfare assessment cannot be summarized simply by just assessing one indicator, as suggested by Andreasen and collegues (2013). In fact, our results confirm that physical health indicators (no swellings and no lesions) are not significantly related to QBA descriptors. While the physical health of donkeys (and other farm animals) can be monitored during clinical evaluation, at the moment there are no other objective and feasible measures to assess their emotional state. An interesting aspect of QBA is that it mostly relies on long-standing engagement and experience with a particular species, rather than on particular professional qualifications or expertise, which gives it a relatively wide range of application. Thorough extensive training on the use of QBA can allow experienced animal stockpersons to reach a better level of agreement and to detect subtle shifts in demeanour that may be overlooked by isolating and quantifying 189
193 Chapter 4 Donkeys individual physical behaviours and that are important for welfare assessment (Meagher, 2009; Wemelsfelder, 2007). Conclusions In conclusion, our findings suggest that Qualitative Behaviour Assessment is a suitable tool to identify the emotional state of donkeys on-farm. A fixed list of descriptors can be used consistently by different trained assessors as a valid addition to a number of animal welfare assessment indicators. However, our results also indicate that it is important to invest time in training assessors, to ensure that both their interpretation of terms and their use of the visual analogue scales are properly aligned. As welfare is a complex concept, QBA should not be used as a stand-alone welfare indicator, but rather in combination with other relevant measures, to obtain a comprehensive evaluation of donkey welfare. The Qualitative Behaviour Assessment can help to evaluate positive aspects of welfare of donkeys, adding some information to the on-farm welfare assessment that, to date, cannot be evaluated by other feasible measures. Acknowledgements The authors wish to thank the EU VII Framework program (FP7-KBBE ) for financing the Animal Welfare Indicators (AWIN) project. The authors would like to thank Alessandra Meazza and Jacopo Aprico for their help in collecting on-farm data. 190
194 Chapter 4 Donkeys References Andreasen, S.N., Wemelsfelder, F., Sandøe, P., Forkman, B., The correlation of Qualitative Behavior Assessments with Welfare Quality protocol outcomes in on-farm welfare assessment of dairy cattle. Appl. Anim. Behav. Sci. 143, doi: /j.applanim Animal Welfare Indicators project, URL (accessed ). Bassler, A., Arnould, C., Butterworth, A., Potential risk factors associated with contact dermatitis, lameness, negative emotional state, and fear of humans in broiler chicken flocks. Poult. Sci Berns, G.S., Brooks, A.M., Spivak, M., Functional MRI in awake unrestrained dogs. PLoS One 7, e doi: /journal.pone Bokkers, E., de Vries, M., Antonissen, I., de Boer, I., Inter- and intraobserver reliability of experienced and inexperienced observers for the Qualitative Behaviour Assessment in dairy cattle. Anim. Welf. 21, doi: / Broom, D.M., A history of animal welfare science. Acta Biotheor. 59, doi: /s Brscic, M., Wemelsfelder, F., Tessitore, E., Gottardo, F., Cozzi, G., Van Reenen, C.G., Welfare assessment: correlations and integration between a Qualitative Behavioural Assessment and a clinical/ health protocol applied in veal calves farms. Ital. J. Anim. Sci. 8, doi: /ijas.2009.s2.601 Dalla Costa, E., Murray, L., Dai, F., Canali, E., Minero, M., Equine on-farm welfare assessment: a review of animal-based indicators. Anim. Welf. 23, doi: / EFSA Panel on Animal Health and Welfare, (AHAW), Statement on the use of animal-based measures to assess the welfare of animals. EFSA J. 10, doi: /j.efsa Ellingsen, K., Coleman, G.J., Lund, V., Mejdell, C.M., Using qualitative behaviour assessment to explore the link between stockperson behaviour and dairy calf behaviour. Appl. Anim. Behav. Sci. 153, doi: /j.applanim Faostat, URL (accessed ). Fleming, P., Paisley, C., Application of Qualitative Behavioural Assessment to horses during an endurance ride. Anim. Behav. 144, Fleming, P.A., Paisley, C.C.L., Barnes, A.L., Application of Qualitative Behavioural Assessment to horses during an endurance ride. Appl. Anim. Behav. Sci. 144,
195 Chapter 4 Donkeys Fraser, D., Duncan, I.J.H., Pleasures, pains and animal welfare: toward a natural history of affect. Anim. Welf IBM Corp., IBM SPSS Statistics for Windows. Knierim, U., Winckler, C., On-farm welfare assessment in cattle: validity, reliability and feasibility issues and future perspectives with special regard to the Welfare Quality approach. Anim. Welf. 18, Martin, P., Bateson, P., Measuring Behaviour: An Introductory Guide, 3rd ed. Cambridge University Press, Cambridge, Massachusetts, USA. Meagher, R.K., Observer ratings: Validity and value as a tool for animal welfare research. Appl. Anim. Behav. Sci. 119, doi: /j.applanim Mendl, M., Burman, O.H.P., Paul, E.S., An integrative and functional framework for the study of animal emotion and mood. Proc. Biol. Sci. 277, doi: /rspb Minero, M., Tosi, M.V., Canali, E., Wemelsfelder, F., Quantitative and qualitative assessment of the response of foals to the presence of an unfamiliar human. Appl. Anim. Behav. Sci. 116, doi: /j.applanim Napolitano, F., De Rosa, G., Braghieri, A., Grasso, F., Bordi, A., Wemelsfelder, F., The qualitative assessment of responsiveness to environmental challenge in horses and ponies. Appl. Anim. Behav. Sci. 109, doi: /j.applanim Napolitano, F., De Rosa, G., Grasso, F., Wemelsfelder, F., Qualitative behaviour assessment of dairy buffaloes (Bubalus bubalis). Appl. Anim. Behav. Sci. 141, doi: /j.applanim Phythian, C., Michalopoulou, E., Duncan, J., Wemelsfelder, F., Interobserver reliability of Qualitative Behavioural Assessments of sheep. Appl. Anim. Behav. Sci. 144, doi: /j.applanim Rousing, T., Wemelsfelder, F., Qualitative assessment of social behaviour of dairy cows housed in loose housing systems. Appl. Anim. Behav. Sci. 101, doi: /j.applanim Rutherford, K.M.D., Donald, R.D., Lawrence, A.B., Wemelsfelder, F., Qualitative Behavioural Assessment of emotionality in pigs. Appl. Anim. Behav. Sci. 139, doi: /j.applanim Sant Anna, A.C., Paranhos da Costa, M.J.R., Validity and feasibility of qualitative behavior assessment for the evaluation of Nellore cattle temperament. Livest. Sci. 157, doi: /j.livsci Visser, E., Neijenhuis, F., de Graaf-Roelfsema, E., Wesselink, H., de Boer, J., van Wijhe-Kiezebrink, M., Engel, B., van Reenen, C., Risk factors associated with health disorders in sport and leisure horses in the Netherlands. J. Anim. Sci. 92,
196 Chapter 4 Donkeys Walker, J., Dale, A., Waran, N., Clarke, N., Farnworth, M., Wemelsfelder, F., The assessment of emotional expression in dogs using a Free Choice. Anim. Welf. 19, Wemelsfelder, F., How animals communicate quality of life: the qualitative assessment of behaviour. Anim. Welf. 16, Wemelsfelder, F., Assessing pig body language: Agreement and consistency between pig farmers, veterinarians, and animal activists. J. Anim. Sci. 90, doi: /jas Wemelsfelder, F., Hunter, E., Mendl, M., Lawrence, A., The spontaneous qualitative assessment of behavioural expressions in pigs: first explorations of a novel methodology for integrative animal welfare measurement. Appl. Anim. Behav. Sci. 67,
197 CHAPTER 5 - TRAINING MATERIAL 194
198 Chapter 5 Training material LEARNING OBJECTS Nowadays, education and dissemination of scientific findings play a key role to increase the public awareness and to guarantee animal welfare. Undoubtedly, for researchers, publication in a peer-reviewed journal remains the most important way of disseminating a complete set of scientific results. However, in the last ten years, there was an increase of other web-based resources to share scientific results and ensure that they can be freely used not only by other researchers to extend knowledge, but also by other people interested in the topic. Once results are freely available, widely known and familiar to people that work with animals, they become a sort of common knowledge. In this way, researchers are rewarded by the recognition of their peers for making results public. The AWIN Work Package 4 was conceived in the frame to foster collaboration between WPs and together create the Global Hub for Research and Education in Animal Welfare, freely available for all the people interested in this topic (e.g. researcher, stakeholder, interested parties). AWIN scientists aim to develop, collect and freely share all the e-learning material available on the web. E-learning refers to education via internet, network, or standalone computer; it is essentially the network-enabled transfer of skills and knowledge. E-learning is specifically designed to be carried out remotely by using electronic communication; therefore is less expensive to support, is not constrained by geographic considerations, and offers opportunities in situations where traditional education has difficulty operating. E-learning technologies include: voice-centered technology (e.g. CD, webcast), video technology (e.g. DVD, interactive videoconference), and computer-centered technology (e.g. learning objects). The Institute of Electrical and Electronics Engineers (IEEE) defines a learning object (LO) as any entity, digital or non-digital, that may be used for learning, education or training (Lim and Chiew, 2014). Another definition was given by 195
199 Chapter 5 Training material Chiappe et al. (2007): A digital self-contained and reusable entity, with a clear educational purpose, with at least three internal and editable components: content, learning activities and elements of context. The learning objects must have an external structure of information to facilitate their identification, storage and retrieval: the metadata. Learning objects are a new way of thinking about learning content: they are small and web-based units of learning, typically ranging from 2 minutes to 15 minutes. The characteristics of a learning object are: Self-contained: each learning object can be taken independently; Reusable: a single learning object may be used in multiple contexts for multiple purposes; Can be aggregated: learning objects can be grouped into larger collections of content, including traditional course structures; Are tagged with metadata: every learning object has descriptive information allowing it to be easily found by a search. One of the key issues in using learning objects is their identification by search engines or content management systems (Lim and Chiew, 2014). This is usually facilitated by assigning descriptive learning object metadata. Just as a book in a library has a record in the card catalog, learning objects must also be tagged with metadata. The most important pieces of metadata typically associated with a learning object include: Objective: the educational goal the learning object is instructing; Prerequisites: the list of skills (typically represented as objectives) which the learner must know before viewing the learning object; Topic: typically represented in a taxonomy, the topic the learning object is instructing; Interactivity: the Interaction Model of the learning object; 196
200 Chapter 5 Training material Technology requirements: the required system requirements to view the learning object. Two new learning objects on equine pain assessment ( Facial expression of pain in horses: the Horse Grimace Scale and The HGS smartphone app ) were produced during the AWIN project, thanks to the collaboration among WP1, WP2 and WP4. Furthermore, in the frame of WP1 welfare assessment for horses and donkeys, online training material was developed for each welfare indicator with the aim to instruct new assessors, for a total of 44 LOs. 197
201 Chapter 5 Training material References Chiappe, A., Segovia, Y., Rincon, Y., Toward an instructional design model based on learning objects. In: Springer (Ed.), Educational Technology Research and Development. Springer, Boston, pp Lim, Y.C., Chiew, T.K., Creating reusable and interoperable learning objects for developing an e-learning system that supports remediation learning strategy. Comput. Appl. Eng. Educ. 22,
202 Chapter 5 Training material LO: FACIAL EXPRESSION OF PAIN IN HORSES: THE HORSE GRIMACE SCALE Emanuela Dalla Costa 1, Michela Minero 1, Dirk Lebelt 2, Diana Stucke 2, Andreia De Paula Vieira 3, Gary James 4, Jesse Fritz 4, Rob Malinowski 4 1 Università degli Studi di Milano, Dipartimento di Scienze Veterinarie e Sanità Pubblica, Milan, Italy 2 Pferdeklinik Havelland / Havelland Equine Hospital, Beetzsee-Brielow, Germany 3 Universidade Positivo, Curitiba, Brazil 4 College of Veterinary Medicine, Michigan State University, Michigan, USA Presented at: 3 rd AWIN Annual Conference Published in: Animal Welfare Science Hub Abstract Pain identification is important in order to avoid poor welfare of horses involved in sport, animal assisted therapy, leisure and companionship. However, pain has not been sufficiently addressed in previous welfare evaluation protocols for equine species. This learning object (LO) was developed collaboratively by UMIL, the Havelland Clinic and the Faculty of Veterinary Medicine at Michigan State University (MSU). The goal of this LO is to transfer knowledge about pain occurrence in horses, pain assessment and facial expressions of pain using the Horse Grimace Scale (HGS). The target audiences of this LO are veterinarians, students of Veterinary Medicine, horse owners and riders. In order to develop this LO, a storyboard was prepared with a detailed description of the development of 199
203 Chapter 5 Training material the LO with sections about previous scientific knowledge, made user-friendly, together with photos and a video collected during farm visits. An institutional video was also recorded to present to the public the AWIN researchers that validated the HGS. The LO was then processed by researchers at Michigan State University and converted to a web-based format using Adobe Presenter. The user navigates a menu comprising sections on Facial expression of pain, Assess your knowledge and Learn more about pain/recognizing a horse in pain. The section Facial expression of pain describes the background of the method, starting from the idea of Darwin on the expression of emotions in men and animals. It reports on the study carried out by AWIN researchers on the HGS. In the Assess your knowledge section, the user is asked to score pictures of horses with or without pain and can interact freely with the different sections of the LO. Learn more about pain/recognizing a horse in pain describes pain-related behaviour in horses with videos and pictures and other methods to assess pain in horses, e.g. the Composite Pain Scale. This LO will be freely available on the Animal Welfare Hub ( from May
204 Chapter 5 Training material Description The Facial expression of pain in horses: the Horse Grimace Scale is a learning object that enables the user to know more about horse pain, pain assessment and the use of the Horse Grimace Scale, a method to assess pain in horses developed by WP1 and WP2 AWIN researchers. This application was developed thanks to the collaboration between WP1, WP2 and WP4. This LO can be freely available and downloadable from the AWIN Animal Welfare Science Hub ( Overview of the Facial expression of pain in horses: the Horse Grimace Scale : 1. Educational objective: teaching the user to recognize pain related behaviour in horses and facial expressions of pain. 2. Target user: horse owners, people involved in horse management, veterinarians, vet nurses, vet and animal welfare students. 3. Relevance for the society, technological development, innovation and animal welfare: pain assessment is fundamental to guarantee a good welfare to equines, used both for working and sport purposes. 4. Technology requirements: Adobe Presenter. 201

 a brief introduction to the study of facial expressions of pain in animals; 2) the")


205 Chapter 5 Training material Introduction video The AWIN researchers explain what is pain, why is important to assess pain in horses and present their study on facial expressions of pain. Contents The contents are organized into three sections: -Facial expressions of pain: this section has: 1) a brief introduction to the study of facial expressions of pain in animals; 2) the description of the Horse Grimace Scale with definitions and drawings of each Action Unit. -Assess your knowledge: this section is interactive. The user can score some example pictures, previously scored by expert. The feedback is immediate. -Learn more about pain: this section contains more information on pain assessment in horses, such as pain-related behaviours and the use of the Composite Pain Scale. Facial expressions of pain 202


206 Chapter 5 Training material Assess your knowledge Learn more about pain 203
207 Chapter 5 Training material THE HGS SMARTPHONE APP Matheus V. de B. Santos 1, Pericles V. Gomes 1, Hugo M. Hulle 1, Jehnifer Rinaldin 1, Michele Farran 1, Rafael Dubiela 1, Michelle Aguiar 1,, Diana Stucke 2, Dirk Lebelt 2, Emanuella Dalla Costa 3, Michela Minero 3, Adroaldo J. Zanella 4, Fritha M. Langford 5, Donald M. Broom 6, Bjarne O. Braastad 7, Judit B. Vas 7, Andreia De Paula Vieira 1 1 Universidade Positivo, Curitiba, Brazil 2 Pferdeklinik Havelland / Havelland Equine Hospital, Beetzsee-Brielow, Germany 3 Università degli Studi di Milano, Dipartimento di Scienze Veterinarie e Sanità Pubblica, Milan, Italy 4 Universidade de São Paulo, São Paulo, Brazil 5 SRUC, Edinburgh, UK 6 University of Cambridge, Cambridge, UK 7 Norwegian University of Life Sciences, Ås, Norway Presented at: 3 rd AWIN Annual Conference Downloadable in: Google Play Store Abstract The recognition, assessment and management of painful conditions are paramount for good horse welfare. Surgical and other pain are quite commonly experienced by horses but, for appropriate pain relief to be provided it is crucial that veterinarians, farmers, horse owners, and riders are able to recognise pain in a reliable way. To meet this need, the Horse Grimace Scale Smartphone Application (HGS App), was developed by AWIN WP4 to teach users to recognize and then 204
208 Chapter 5 Training material assess pain in horses using facial expressions (scientifically validated by AWIN researchers: Dalla Costa et al., 2014). The user of the HGS App follows these three steps: 1) Via an introductory video, HGS App users are able to learn about the theoretical basis of the HGS: the definition of pain, the relevance of monitoring pain and the issue of measuring pain in animals; 2) After learning about the HGS concept, users are able to train themselves to properly score horses via pictures until they are confident enough to score pain in live horses; 3) After the training, users are able to obtain information from live horses and keep track of their facial expressions in the smartphone database. The HGS App is available for devices that use the Android operating system. The usability of the interface was tested, and testers were asked to interact with the interface and comment on the functioning of the software. According to Nielsen (1993), 90% of interface problems can be found with as few as 6 testers. All interactions were video recorded. In general, the HGS App was very well accepted and testers were able to use the interface and perform the task to be carried out. After the test, a list of 9 minor interface problems was generated from the usage observations. The test took about 20 minutes to be carried out, per tester. To allow testers to perform the scoring task, a picture of a standing horse with a grimacing face was presented. Most of the interface problems found by testers were related to 1) entering information for a new horse prior to scoring and 2) issues related to the graphic interpretation of the pain scale. After correcting interface issues, AWIN WP4 officially launched the HGS App in May We aim to test the App once more to validate it from an educational standpoint among users from all AWIN partnering countries. 205
209 Chapter 5 Training material Description The HGS app is an application for smartphone that enables the user to know how to apply in practice the Horse Grimace Scale, a method to assess pain in horses developed by the AWIN researchers. This application was developed in close collaboration with the WP2 and WP4. The HGS application can be freely downloaded from the AWIN Animal Welfare Science Hub or the Google Play market. Overview of the HGS app: 1. Educational objective: teaching the user how to apply systematically in practice the Horse Grimace Scale (HGS). 2. Target user: horse owners, veterinarians, vet nurses. 3. Relevance for the society, technological development, innovation and animal welfare: an easy way to assess pain in horses is to look at their facial expression. Our research will show how facial expression can be used in detail to assess and quantify pain. A systematical survey of the mimic will help to assess and monitor pain more objectively. 4. Technology requirements: Android System. 206


210 Chapter 5 Training material HGS app icon The icon to click to start the HGS app Main Menu The main menu is organized into different sections: -Intro: a video to introduce to the user the concept of pain in animals, pain assessment and the use of facial expression to evaluate pain in horses. -Training: this section is interactive. The user can find all the definitions of the Action Units and explicative drawings. Then, the user can score some example pictures, having an immediate feedback to see whether his score is right or wrong. -Scoring: this section enable the user to score live a horse present in the profile section. -Profile: this section enables the user to create a horse profile and monitor the pain assessment of this horse during time. -Contact us: contacts of the developers. -About us: information about the AWIN project. Intro 207


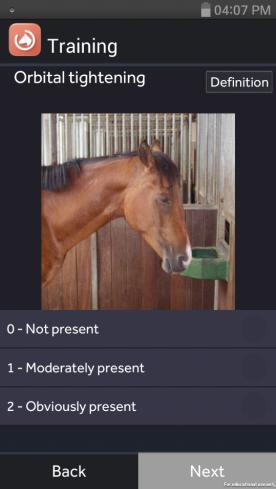
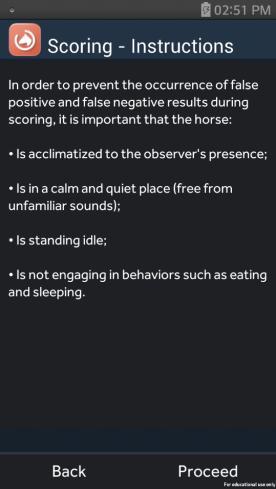
211 Chapter 5 Training material Training Scoring 208


212 Chapter 5 Training material Profile 209
213 Chapter 5 Training material WELFARE INDICATORS TRAINING MATERIAL Emanuela Dalla Costa 1, Francesca Dai 1, Leigh Murray 1, Michela Minero 1 1 Università degli Studi di Milano, Dipartimento di Scienze Veterinarie e Sanità Pubblica, Milan, Italy Published in May 2015: Animal Welfare Science Hub Description One of the most important objectives of WP1 was dissemination of scientific results achieved in the frame of the AWIN project through the training of new equine welfare assessors. The welfare indicators training material reflects this purpose. It is composed by 44 learning objects, one for each welfare measure introduced in the welfare assessment protocol for horses and donkeys (Table 1). 210
214 Chapter 5 Training material Welfare indicators for horses Body Condition Score Bucket test Water availability Bedding Signs of thermal stress Box measures Skin lesions Swellings Coat condition Discharges Dyspnoea Manure Hoof condition Lameness Horse Grimace Scale Pain related behaviours Lesions at mouth corners Social opportunities Fear test Human Animal relationship tests Stereotypies Qualitative Behaviour Assessment Welfare indicators for donkeys Body Condition Score Skin tent test Water availability Bedding Signs of thermal stress Shelter measures Skin lesions Swellings Coat condition Discharges Dyspnoea Dental abnormalities Refill time Hoof condition Lameness Ear position Signs of hot branding Avoidance Distance test Walking Down Side test Chin Contact Stereotypies Qualitative Behaviour Assessment Table 1 List of welfare indicators LOs for horses (left column) and donkeys (right column). The aims of these LOs are: 1) to have on-line material to introduce new welfare assessors with the welfare indicators; 2) to inform stakeholder why and how welfare indicators are evaluated by AWIN assessors. Furthermore, to check if e- learning was effective, the new welfare assessors were required to answer to an online questionnaire. To develop this training material pictures and videos were collected during onfarm assessments and then classified by trained AWIN welfare assessors. Assessors with 80% or more correct answers were then admitted to a 2-days on- 211

215 Chapter 5 Training material farm training. These LOs will be freely available and downloadable from the AWIN Animal Welfare Science Hub in May Overview of the Welfare indicators training material : 1. Educational objective: teaching the user how to assess, score and giving practical examples for each welfare indicator. 2. Target user: official veterinarians, welfare assessors, equine owners, people involved in equine management, animal welfare students. 3. Relevance for the society, technological development, innovation and animal welfare: welfare assessment is paramount to guarantee a good life to equines. Equine welfare assessors are needed to check welfare status of horses and donkeys kept on-farm. 4. Technology requirements: Microsoft Office Power Point. All the LOs were divided into 5 main sections identifiable by different colours: definition (light blue), how to assess (green), how to score (orange), examples (violet), assess your knowledge (purple). Here after the LO Body Condition Score for horses will be presented as example. Start The LO starts with a short video (AWIN theme) and the first slide contextualise the welfare indicator (e.g. Good feeding Absence of prolonged hunger). By clicking on start the user moves to the next section. 212


216 Chapter 5 Training material Contents The contents are organized into five sections: -Definition -How to assess -How to score -Examples -Self assess your knowledge! By clicking on text the user moves to the different sections. This section includes a brief introduction of the welfare indicator with the relevant scientific literature. Furthermore, it explains why this indicator is important for animal welfare. The colour associated is light blue. This section explains how to assess onfarm the indicator (e.g. visual inspection). The colour associated is green. 213


217 Chapter 5 Training material This section contains the scores description. The colour associated is orange. The section Examples gives to the user practical examples of on-farm situation with pictures and videos of the assement. The colour associated is violet. This section is interactive and enables the user to check their knowledge thanks to immediate feedback. The colour associated is purple. 214
Animal welfare assessment through smartphone applications. Challenges and opportunities Elisabetta Canali Department of Veterinary Medicine
 Animal welfare assessment through smartphone applications. Challenges and opportunities Elisabetta Canali Department of Veterinary Medicine University of Milan, Itally Animal welfare.an animal as being
Coordinated Global Strategies for Animal Welfare Research
 Coordinated Global Strategies for Animal Welfare Research Adroaldo José Zanella Department of Preventive Veterinary Medicine and Animal Health, School of Veterinary Medicine and Animal Science, University
3 rd International Conference of Ecosystems (ICE2013) Tirana, Albania, May 31 - June 5, 2013
 Tirana, Albania, May 31 - June 5, 2013") 3 rd International Conference of Ecosystems (ICE2013) Tirana, Albania, May 31 - June 5, 2013 ANIMAL WELFARE IN ALBANIA Prof. As. Dr. Ylli Biçoku* * Agricultural University of Tirana, Tirane, Albania Corresponding
3 rd International Conference of Ecosystems (ICE2013) Tirana, Albania, May 31 - June 5, 2013 ANIMAL WELFARE IN ALBANIA Prof. As. Dr. Ylli Biçoku* * Agricultural University of Tirana, Tirane, Albania Corresponding
European trends in animal welfare policies and research and their potential implications for US Agriculture
 European trends in animal welfare policies and research and their potential implications for US Agriculture Dr. Ed Pajor Associate Professor Director, Center for Animal Well-Being Department of Animal
OIE Regional seminar on animal welfare during long distance transport (Chapter 7.3 of the OIE terrestrial Animal Health Code)
") OIE Regional seminar on animal welfare during long distance transport (Chapter 7.3 of the OIE terrestrial Animal Health Code) 13-15 March 2018, Chisinau, Moldova Tomasz Grudnik OIE Sub-regional Representation
OIE Regional seminar on animal welfare during long distance transport (Chapter 7.3 of the OIE terrestrial Animal Health Code) 13-15 March 2018, Chisinau, Moldova Tomasz Grudnik OIE Sub-regional Representation
Franck Berthe Head of Animal Health and Welfare Unit (AHAW)
") EFSA s information meeting: identification of welfare indicators for monitoring procedures at slaughterhouses Parma, 30/01/2013 The role of EFSA in Animal Welfare Activities of the AHAW Unit Franck Berthe
EFSA s information meeting: identification of welfare indicators for monitoring procedures at slaughterhouses Parma, 30/01/2013 The role of EFSA in Animal Welfare Activities of the AHAW Unit Franck Berthe
Information document accompanying the EFSA Questionnaire on the main welfare problems for sheep for wool, meat and milk production
 EFSA Mandate for a Scientific Opinion on the main welfare risks related to the farming of sheep for wool, meat and milk production (M-2013-0197; EFSA-Q-2013-00580) Information document accompanying the
Animal Welfare Standards in the Dairy Sector Renée Bergeron, Ph.D., agr. Dairy Outlook Seminar 2013
 Animal Welfare Standards in the Dairy Sector Renée Bergeron, Ph.D., agr. Dairy Outlook Seminar 2013 Introduction The animal welfare movement has gained momentum since the beginning of the century The topic
Summary of the latest data on antibiotic consumption in the European Union
 Summary of the latest data on antibiotic consumption in the European Union ESAC-Net surveillance data November 2016 Provision of reliable and comparable national antimicrobial consumption data is a prerequisite
Companion Animal Welfare Student Activities
 Module 26 Companion Animal Welfare Questions 1. When a shelter with a no kill policy has adequate facilities and resources it can house a certain number of animals comfortably. If admissions to the shelter
Aerial view of the Faculty of Veterinary Medicine Utrecht
 Aerial view of the Faculty of Veterinary Medicine Utrecht The role of a veterinarian in the next 30 years Anton Pijpers Utrecht University Content What s happening around us In general Societal demands
Policy on the use of animals in research and education at SLU
 Only the Swedish version is the oficial version. GOVERNING DOCUMENT SLU ID: SLU.ua 2015.1.1.1-4840 Subject area: Research and doctoral education and Undergraduate and Master's education Document type:
Science Based Standards In A Changing World Canberra, Australia November 12 14, 2014
 Science Based Standards In A Changing World Canberra, Australia November 12 14, 2014 Dr. Brian Evans Deputy Director General Animal Health, Veterinary Public Health and International Standards SEMINAR
ANTIMICROBIAL RESISTANCE and causes of non-prudent use of antibiotics in human medicine in the EU
 ANTIMICROBIAL RESISTANCE and causes of non-prudent use of antibiotics in human medicine in the EU Health and Food Safety John Paget (NIVEL) Dominique Lescure (NIVEL) Ann Versporten (University of Antwerp)
funded by Reducing antibiotics in pig farming
 funded by Reducing antibiotics in pig farming The widespread use of antibiotics (also known as antibacterials) in human and animal medicine increases the level of resistant bacteria. This makes it more
Antimicrobial resistance (EARS-Net)
") SURVEILLANCE REPORT Annual Epidemiological Report for 2014 Antimicrobial resistance (EARS-Net) Key facts Over the last four years (2011 to 2014), the percentages of Klebsiella pneumoniae resistant to fluoroquinolones,
SURVEILLANCE REPORT Annual Epidemiological Report for 2014 Antimicrobial resistance (EARS-Net) Key facts Over the last four years (2011 to 2014), the percentages of Klebsiella pneumoniae resistant to fluoroquinolones,
DECLARATION of the First Conference on Animal Welfare in the Baltic Region RESPONSIBLE OWNERSHIP 5 to 6 May, 2011, Vilnius, Lithuania
 DECLARATION of the First Conference on Animal Welfare in the Baltic Region RESPONSIBLE OWNERSHIP 5 to 6 May, 2011, Vilnius, Lithuania Animal welfare is a complex and multi-faceted issue with an impact
European poultry industry trends
 European poultry industry trends November 5 th 2014, County Monaghan Dr. Aline Veauthier & Prof. Dr. H.-W. Windhorst (WING, University of Vechta) 1 Agenda The European Chicken Meat Market - The global
Welfare Conditions of Donkeys in Europe: Initial Outcomes from On-Farm Assessment
 animals Article Welfare Conditions of Donkeys in Europe: Initial Outcomes from On-Farm Assessment Francesca Dai *, Emanuela Dalla Costa, Leigh Margareth Anne Murray, Elisabetta Canali and Michela Minero
Welfare on farms: beyond the Five Freedoms. Christopher Wathes
 Welfare on farms: beyond the Five Freedoms Christopher Wathes Animals in the UK in 2009 Broiler chickens; 840 m Farmed salmon; ~80 m Lambs; 16 m from 15 m ewes Pigs; 9 m from 0.45 m sows CaBle; 2.6 m from
lasting compassion and
 Approved by the Board 26 June 2015 Po lasting compassion and DATE UPDATED POLICY HOLDER NEXT REVIEW DATE JUNE 2015 SENIOR WELFARE ADVISOR JUNE 2017 PURPOSE The Animal Welfare Policy describes the standard
Assessing the Welfare of Dairy Cows:
 Assessing the Welfare of Dairy Cows: Surveying UK Dairy Farmer and Cattle Vet Opinion This survey is part of a larger DairyCo-funded research project at the Royal Veterinary College Current on-farm welfare
Safeguarding farm animal welfare
 My background Safeguarding farm animal welfare Wageningen University and Research Centre The Netherlands, since 1979 Swedish University of Agricultural Sciences Uppsala, Sweden, since 2007 Harry Blokhuis
Jim Reynolds DVM, MPVM
 Colorado Livestock Association The Principles and Practice of Farm Animal Welfare An Introduction to Farm Welfare Jim Reynolds DVM, MPVM Western University College of Veterinary Medicine What is animal
The challenge of growing resistance
 EXECUTIVE SUMMARY Around 2.4 million people could die in Europe, North America and Australia between 2015-2050 due to superbug infections unless more is done to stem antibiotic resistance. However, three
Farm animal welfare assurance- science and its application.
 Farm animal welfare assurance- science and its application. J. Rushen and A. M. de Passillé, Agriculture and Agri-Food Canada, Agassiz, BC, Canada, Monday Tuesday Wednesday Thursday We use science News
Development of Council of Europe Conventions for Protection of Animals - ethics, democratic processes, and monitoring
 Joint COE EU TAIEX OIE WORKSHOP Development of Council of Europe Conventions for Protection of Animals - ethics, democratic processes, and monitoring David G. PRITCHARD Chairman T-AP Standing Committee
21st Conference of the OIE Regional Commission for Europe. Avila (Spain), 28 September 1 October 2004
, 28 September 1 October 2004") 21st Conference of the OIE Regional Commission for Europe Avila (Spain), 28 September 1 October 2004 Recommendation No. 1: Recommendation No. 2: Recommendation No. 3: Contingency planning and simulation
21st Conference of the OIE Regional Commission for Europe Avila (Spain), 28 September 1 October 2004 Recommendation No. 1: Recommendation No. 2: Recommendation No. 3: Contingency planning and simulation
OIE Standards for Animal Welfare
 1 OIE Standards for Animal Welfare 23 November 2010 Beyrouth, Lebanon Dr Mariela Varas International Trade Department OIE Outline 2 Standard setting work of the OIE Evolution of the OIE AW agenda A look
European Medicines Agency role and experience on antimicrobial resistance
 European Medicines Agency role and experience on antimicrobial resistance Regional Training Workshop on Antimicrobial Resistance (AMR) Responding to the global challenge of AMR threats: toward a one health
Future development of animal welfare science and use of new technologies
 Future development of animal welfare science and use of new technologies Jeremy N. Marchant-Forde USDA-ARS, Livestock Behavior Research Unit Trending topics - Focused Search Term Publications % change
Research Strategy Institute of Animal Welfare Science. (Institut für Tierschutzwissenschaften und Tierhaltung)
") Research Strategy 2019-2024 Institute of Animal Welfare Science (Institut für Tierschutzwissenschaften und Tierhaltung) Department for Farm Animals and Veterinary Public Health University of Veterinary
Research Strategy 2019-2024 Institute of Animal Welfare Science (Institut für Tierschutzwissenschaften und Tierhaltung) Department for Farm Animals and Veterinary Public Health University of Veterinary
LIVE ANIMAL TRANSPORT
 KEY RECCOMENDATIONS LIVE ANIMAL TRANSPORT A growing number of animals is transported alive across and from the European Union (EU). Despite scientific bodies and institutions have stressed on the detrimental
First OIE regional workshop on dog population management- Identifying the source of the problem and monitoring the stray dog population
 Bucharest 17-19 June 2014 First OIE regional workshop on dog population management- Identifying the source of the problem and monitoring the stray dog population Alexandra Hammond-Seaman RSPCA International
Firing (a mutilation) on working equine: A comparative ethnic practice in Delhi, Lucknow and Hyderabad city
 on working equine: A comparative ethnic practice in Delhi, Lucknow and Hyderabad city") Title Firing (a mutilation) on working equine: A comparative ethnic practice in Delhi, Lucknow and Hyderabad city Prakash Gogoi 1, Tania Denninson 2 1 The Brooke India, F-86, Preet Vihar, Delhi 110092
Title Firing (a mutilation) on working equine: A comparative ethnic practice in Delhi, Lucknow and Hyderabad city Prakash Gogoi 1, Tania Denninson 2 1 The Brooke India, F-86, Preet Vihar, Delhi 110092
Questions and Answers on the Community Animal Health Policy
 MEMO/07/365 Brussels, 19 September 2007 Questions and Answers on the Community Animal Health Policy 2007-13 Why has the Commission developed a new Community Animal Health Policy (CAHP)? The EU plays a
Stray Dog Population Control
 Stray Dog Population Control Terrestrial Animal Health Code Chapter 7.7. Tikiri Wijayathilaka, Regional Project Coordinator OIE RRAP, Tokyo, Japan AWFP Training, August 27, 2013, Seoul, RO Korea Presentation
Ed Pajor is a Professor of Animal Welfare at the University of Calgary Faculty of Veterinary Medicine, Department of Production Animal Health. Dr.
 Ed Pajor is a Professor of Animal Welfare at the University of Calgary Faculty of Veterinary Medicine, Department of Production Animal Health. Dr. Pajor provides scientific expertise to numerous organizations
THE DEVELOPMENT OF A RISK BASED MEAT INSPECTION SYSTEM SANCO / 4403 / 2000
 FEDERATION OF VETERINARIANS OF EUROPE FVE/01/034 Final THE DEVELOPMENT OF A RISK BASED MEAT INSPECTION SYSTEM SANCO / 4403 / 2000 Members FVE COMMENTS Austria Belgium Croatia Cyprus Czech Republic Denmark
and suitability aspects of food control. CAC and the OIE have Food safety is an issue of increasing concern world wide and
 forum Cooperation between the Codex Alimentarius Commission and the OIE on food safety throughout the food chain Information Document prepared by the OIE Working Group on Animal Production Food Safety
Development and improvement of diagnostics to improve use of antibiotics and alternatives to antibiotics
 Priority Topic B Diagnostics Development and improvement of diagnostics to improve use of antibiotics and alternatives to antibiotics The overarching goal of this priority topic is to stimulate the design,
European Association of Establishments for Veterinary Document approved by the Executive Committee on January Education
 Education European Association of Establishments for Veterinary Education and Training requirements for veterinarians in Laboratory animal science and medicine (LASM): Minimum requirements to guarantee
Changing patterns of poultry production in the European Union
 Chapter 2 Changing patterns of poultry production in the European Union H-W. Windhorst Abstract The EU (27) is one of the leading global regions in egg and poultry meat production. Production is, however,
Unit 3 Sustainability and interdependence Sub Topic 3.4: Animal welfare
 Unit 3 Sustainability and interdependence Sub Topic 3.4: Animal welfare Page 1 of 12 On completion of this topic I will be able to: Describe the costs, benefits and ethics of providing different levels
National Action Plan development support tools
 National Action Plan development support tools Sample Checklist This checklist was developed to be used by multidisciplinary teams in countries to assist with the development of their national action plan
EU Health Priorities. Jurate Svarcaite Secretary General PGEU
 EU Health Priorities Jurate Svarcaite Secretary General PGEU Members: Professional Bodies & Pharmacists Associations 2016: 33 Countries Austria Belgium Bulgaria Croatia Cyprus Czech Rep Denmark Estonia
BPC Antibiotic Stewardship Report
 BPC Antibiotic Stewardship Report JUNE 2017 BIG ACHIEVEMENTS OF THE POULTRY MEAT INDUSTRY STOPPED prophylactic use of antibiotics STOPPED use of Colistin NEW ANTIBIOTIC STANDARDS for Red Tractor Poultry
international news RECOMMENDATIONS
 The Third OIE Global Conference on Veterinary Education and the Role of the Veterinary Statutory Body was held in Foz do Iguaçu (Brazil) from 4 to 6 December 2013. The Conference addressed the need for
Draft ESVAC Vision and Strategy
 1 2 3 7 April 2016 EMA/326299/2015 Veterinary Medicines Division 4 5 6 Draft Agreed by the ESVAC network 29 March 2016 Adopted by ESVAC 31 March 2016 Start of public consultation 7 April 2016 End of consultation
EU Programmes for Animal Welfare in the European region
 EU Programmes for Animal Welfare in the European region Andrea Gavinelli Unit G3 Animal Welfare Directorate General Health and Consumers 1 FUNDAMENTALS Animal Welfare Definition as agreed by OIE members
ANNUAL DECLARATION OF INTERESTS (ADoI)
") ANNUAL DECLARATION OF INTERESTS (ADoI) (Please note that high quality of scientific expertise is by nature based on prior experience and that therefore having an interest does not necessarily mean having
ANNUAL DECLARATION OF INTERESTS (ADoI) (Please note that high quality of scientific expertise is by nature based on prior experience and that therefore having an interest does not necessarily mean having
Key considerations in the breeding of macaques and marmosets for scientific purposes
 Key considerations in the breeding of macaques and marmosets for scientific purposes Key considerations in the breeding of macaques and marmosets for scientific purposes Laboratory Animal Science Association
Tail docking in pigs: beyond animal welfare
 Tail docking in pigs: beyond animal welfare Prof dr Elsbeth Stassen chair: Animals and Society About the presentation: Upcoming discussion about animal interventions Tail docking as an example The underlying
of Conferences of OIE Regional Commissions organised since 1 June 2013 endorsed by the Assembly of the OIE on 29 May 2014
 of Conferences of OIE Regional Commissions organised since 1 June 2013 endorsed by the Assembly of the OIE on 29 May 2014 2 12 th Conference of the OIE Regional Commission for the Middle East Amman (Jordan),
Promoting One Health : the international perspective OIE
 Promoting One Health : the international perspective OIE Integrating Animal Health & Public Health: Antimicrobial Resistance SADC SPS Training Workshop (Animal Health) 29-31 January 2014 Gaborone, Botwana
Scientifically evaluating welfare in commercial breeding kennels: does high volume preclude good welfare?
 Scientifically evaluating welfare in commercial breeding kennels: does high volume preclude good welfare? 2018-10-27 What s the connection between CB welfare and detection dogs?!? Sources of detection
Overview LANCTB1. Observe, assess and respond to the behaviour of dogs. Observe, assess and respond to the behaviour of dogs
 Overview This standard covers observing, assessing and responding to the behaviour of dogs. The standard involves understanding the normal behaviour of the type of dog that you are working with and observing
Global animal production perspectives and correlated use of antimicrobial agents
 Global animal production perspectives and correlated use of antimicrobial agents Barbara Freischem Executive Director, International Federation for Animal Health (IFAH) General Overview Presentation overview
IMPORT HEALTH STANDARD FOR THE IMPORTATION INTO NEW ZEALAND OF RABBIT MEAT FOR HUMAN CONSUMPTION FROM THE EUROPEAN COMMUNITY
 IMPORT HEALTH STANDARD FOR THE IMPORTATION INTO NEW ZEALAND OF RABBIT MEAT FOR HUMAN CONSUMPTION FROM THE EUROPEAN COMMUNITY ANNEX A ASSIGNED NUMBERS (AN): 4C.2, 4D.1, 5C.2, 5D.1, 6C.1, 6D.2, Issued pursuant
EssayOnDeclawingCatsForStudents
 EssayOnDeclawingCatsForStudents In the 1960s many people in America started keeping their cats strictly indoors because the world outside was becoming more dangerous. The only problem was that cats need
Jim Reynolds DVM, MPVM Western University College of Veterinary Medicine
 NAVC Scientific Program January 16, 2011 Orlando, Florida Overview of Welfare Jim Reynolds DVM, MPVM Western University College of Veterinary Medicine An Overview of Animal Welfare What is welfare? Definition
The promise of aquaculture and the challenge of antimicrobial use
 The promise of aquaculture and the challenge of antimicrobial use This article is published in two parts. Part 1 identifies the promise of aquaculture and the challenge of antimicrobial use (please see
THE WELFARE OF ANIMALS IN PRODUCTION SYSTEMS
 THE WELFARE OF ANIMALS IN PRODUCTION SYSTEMS General Principles and Underlying Research David Fraser Animal Welfare Program University of British Columbia General principles for the welfare of animals
Bringing your Shelter into the 21st Century to Improve Animal Welfare and Achieve Capacity for Care Part One: The Basics
 Bringing your Shelter into the 21st Century to Improve Animal Welfare and Achieve Capacity for Care Part One: The Basics In so many animal care facilities, the crux of the problem is that there seem to
Scientific Opinion on the use of animal-based measures to assess welfare in pigs 1
 EFSA Journal 2012;10(1):2512 SCIENTIFIC OPINION Scientific Opinion on the use of animal-based measures to assess welfare in pigs 1 ABSTRACT EFSA Panel on Animal Health and Welfare (AHAW) 2, 3 European
EXTENSION PROGRAMMES
 EXTENSION PROGRAMMES DEDICATED TO THE ACTIVITIES OF THE VETERINARY SERVICES G. Khoury International Consultant 1 Original: English Summary: Extension programmes could be defined as the dissemination of
Long-distance Live Transport: Common problems and practical solutions
 Long-distance Live Transport: Common problems and practical solutions Over the last several years, investigations into long-distance live transport have identified ten frequently recurring yet preventable
REGIONAL WORKSHOP ON ANIMAL WELFARE IN TRANSPORT AND SLAUGHTER (RWAWTS)
") REGIONAL WORKSHOP ON ANIMAL WELFARE IN TRANSPORT AND SLAUGHTER (RWAWTS) RWAWTS To improve welfare of farm animals during transport and at the slaughterhouses in selected eligible member countries by tailored
REGIONAL WORKSHOP ON ANIMAL WELFARE IN TRANSPORT AND SLAUGHTER (RWAWTS) RWAWTS To improve welfare of farm animals during transport and at the slaughterhouses in selected eligible member countries by tailored
General Q&A New EU Regulation on transmissible animal diseases ("Animal Health Law") March 2016 Table of Contents
 March 2016 Table of Contents") General Q&A New EU Regulation on transmissible animal diseases ("Animal Health Law") March 2016 Table of Contents Scope of the Regulation on transmissible animal diseases (Animal Health Law)... 2 Entry
General Q&A New EU Regulation on transmissible animal diseases ("Animal Health Law") March 2016 Table of Contents Scope of the Regulation on transmissible animal diseases (Animal Health Law)... 2 Entry
MSc in Veterinary Education
 MSc in Veterinary Education The LIVE Centre is a globally unique powerhouse for research and development in veterinary education. As its name suggests, its vision is a fundamental transformation of the
OBJECTIVE: PROFILE OF THE APPLICANT:
 CENTER OF AGRICULTURAL SCIENCES Doctor in Veterinary Medicine OBJECTIVE: To train doctors in Veterinary Medicine and Animal Husbandry with a humane formation, reflective, socially responsible, and capable
WHO (HQ/MZCP) Intercountry EXPERT WORKSHOP ON DOG AND WILDLIFE RABIES CONTROL IN JORDAN AND THE MIDDLE EAST. 23/25 June, 2008, Amman, Jordan
 Intercountry EXPERT WORKSHOP ON DOG AND WILDLIFE RABIES CONTROL IN JORDAN AND THE MIDDLE EAST. 23/25 June, 2008, Amman, Jordan") WHO (HQ/MZCP) Intercountry EXPERT WORKSHOP ON DOG AND WILDLIFE RABIES CONTROL IN JORDAN AND THE MIDDLE EAST 23/25 June, 2008, Amman, Jordan Good practices in intersectoral rabies prevention and control
WHO (HQ/MZCP) Intercountry EXPERT WORKSHOP ON DOG AND WILDLIFE RABIES CONTROL IN JORDAN AND THE MIDDLE EAST 23/25 June, 2008, Amman, Jordan Good practices in intersectoral rabies prevention and control
Animal Welfare Management Programmes
 Animal Welfare Management Programmes TAIEX Belgrade 24-25 March 2010 Andrew Voas BVM&S MRCVS Scottish Government Veterinary Adviser Scotland in the UK Part of United Kingdom of Great Britain and Northern
World Organisation for Animal Health (OIE) Sub-Regional Representation for Southern Africa
 Sub-Regional Representation for Southern Africa") Dr Patrick Bastiaensen, Programme officer. World Organisation for Animal Health (OIE) Sub-Regional Representation for Southern Africa Global Veterinary Governance 1 Regional Training Seminar for OIE Focal
Dr Patrick Bastiaensen, Programme officer. World Organisation for Animal Health (OIE) Sub-Regional Representation for Southern Africa Global Veterinary Governance 1 Regional Training Seminar for OIE Focal
Strategy 2020 Final Report March 2017
 Strategy 2020 Final Report March 2017 THE COLLEGE OF VETERINARIANS OF ONTARIO Introduction This document outlines the current strategic platform of the College of Veterinarians of Ontario for the period
Better Training for Safer Food
 Better Training for Safer Food Initiative Susanne Münstermann Better Training for Safer Food is an initiative of the European Commission aimed at organising an EU training strategy in the areas of food
Resolution adopted by the General Assembly on 5 October [without reference to a Main Committee (A/71/L.2)]
![Resolution adopted by the General Assembly on 5 October [without reference to a Main Committee (A/71/L.2)]](/thumbs/93/113861770.jpg "Resolution adopted by the General Assembly on 5 October [without reference to a Main Committee (A/71/L.2)]") United Nations A/RES/71/3 General Assembly Distr.: General 19 October 2016 Seventy-first session Agenda item 127 Resolution adopted by the General Assembly on 5 October 2016 [without reference to a Main
United Nations A/RES/71/3 General Assembly Distr.: General 19 October 2016 Seventy-first session Agenda item 127 Resolution adopted by the General Assembly on 5 October 2016 [without reference to a Main
SCIENTIFIC REPORT. Analysis of the baseline survey on the prevalence of Salmonella in turkey flocks, in the EU,
 The EFSA Journal / EFSA Scientific Report (28) 198, 1-224 SCIENTIFIC REPORT Analysis of the baseline survey on the prevalence of Salmonella in turkey flocks, in the EU, 26-27 Part B: factors related to
There are very serious welfare issues in the breeding and intensive rearing of meat chickens:
 BACKGROUND Worldwide, a total of around 50 billion chickens are slaughtered annually for meat, including nine billion in the USA, over five billion in the EU27 and around 800 million in the UK. Commercial
Summary of the latest data on antibiotic consumption in the European Union
 Summary of the latest data on antibiotic consumption in the European Union November 2012 Highlights on antibiotic consumption Antibiotic use is one of the main factors responsible for the development and
CONTINUING EDUCATION AND INCORPORATION OF THE ONE HEALTH CONCEPT
 CONTINUING EDUCATION AND INCORPORATION OF THE ONE HEALTH CONCEPT M. Farnham 1, W. Hueston 2 Original: English Summary: Sixteen Members of the OIE Regional Commission for the Middle East responded to a
OECD WORK ON AMR: TACKLING THE NEGATIVE CONSEQUENCES OF ANTIBIOTIC RESISTANCE ON HUMAN HEALTH. Michele Cecchini OECD Health Division
 OECD WORK ON AMR: TACKLING THE NEGATIVE CONSEQUENCES OF ANTIBIOTIC RESISTANCE ON HUMAN HEALTH Michele Cecchini OECD Health Division Antimicrobial Resistance is a Global Threat Modern medicine and surgery
Recording of claw and foot disorders in dairy cattle: current role and prospects of the international harmonization initiative of ICAR
 Recording of claw and foot disorders in dairy cattle: current role and prospects of the international harmonization initiative of ICAR A.-M. Christen 1, C. Bergsten 2, J. Burgstaller 3, N. Capion 4, N.
GOOD GOVERNANCE OF VETERINARY SERVICES AND THE OIE PVS PATHWAY
 GOOD GOVERNANCE OF VETERINARY SERVICES AND THE OIE PVS PATHWAY Regional Information Seminar for Recently Appointed OIE Delegates 18 20 February 2014, Brussels, Belgium Dr Mara Gonzalez 1 OIE Regional Activities
RESPONSIBLE ANTIMICROBIAL USE
 RESPONSIBLE ANTIMICROBIAL USE IN THE CANADIAN CHICKEN AND TURKEY SECTORS VERSION 2.0 brought to you by: ANIMAL NUTRITION ASSOCIATION OF CANADA CANADIAN HATCHERY FEDERATION CANADIAN HATCHING EGG PRODUCERS
ANIMAL USE AND CARE RESEARCH ETHICS
 ANIMAL USE AND CARE RESEARCH ETHICS Laboratory animals or animals: Any vertebrate animal (i.e. traditional laboratory animals, agricultural animals, wildlife and aquatic species) produced for or used in
How do we assess for welfare of individuals? Can we have a generic welfare assessment? Will it work for all shelters?
 Welfare assessment How do we assess for welfare of individuals? Can we have a generic welfare assessment? Will it work for all shelters? There are a number of methods that have been used to assess welfare
COMMISSION OF THE EUROPEAN COMMUNITIES REPORT FROM THE COMMISSION TO THE EUROPEAN PARLIAMENT AND THE COUNCIL
 COMMISSION OF THE EUROPEAN COMMUNITIES Brussels, 8.10.2007 COM(2007) 578 final REPORT FROM THE COMMISSION TO THE EUROPEAN PARLIAMENT AND THE COUNCIL in connection with Article 23 of Regulation (EC) No
Animal Health and Welfare Best Practices. Claresholm Veterinary Services Ltd Dr. Ken Wright, DVM, BSc
 Animal Health and Welfare Best Practices Claresholm Veterinary Services Ltd Dr. Ken Wright, DVM, BSc Why is a local veterinarian talking about animal health and welfare at these seminars? a) Vets are experts
The welfare of laying hens
 The welfare of laying hens I.C. DE JONG* and H.J. BLOKHUIS Animal Sciences Group of Wageningen UR, Division of Animal Production, PO Box 65, 8200 AB Lelystad, The Netherlands. *Corresponding author: ingrid.dejong@wur.nl
OIE Reference Laboratory Reports Activities
 OIE Reference Laboratory Reports Activities Activities in 2017 This report has been submitted : 2018-01-24 10:31:11 Name of disease (or topic) for which you are a designated OIE Reference Laboratory: Classical
REPORT FROM THE COMMISSION TO THE EUROPEAN PARLIAMENT AND THE COUNCIL. on systems restraining bovine animals by inversion or any unnatural position
 EUROPEAN COMMISSION Brussels, 8.2.2016 COM(2016) 48 final REPORT FROM THE COMMISSION TO THE EUROPEAN PARLIAMENT AND THE COUNCIL on systems restraining bovine animals by inversion or any unnatural position
Professor David J Mellor Professor Kevin J Stafford Co-Directors
 Professor David J Mellor Professor Kevin J Stafford Co-Directors Collaborating Centre for Animal Welfare Science and Bioethical Analysis: Founding Partner http://animalwelfare.massey.ac.nz Evolving Veterinary
Companion Animal Management Student Activities
 Module 14 Companion Animal Management Questions 1. Humans keep companion, or pet animals, for social contact and pleasure. Identify and describe three of the most prevalent welfare problems that you will
Component Specification NFQ Level 5. Sheep Husbandry 5N Component Details. Sheep Husbandry. Level 5. Credit Value 10
 Component Specification NFQ Level 5 Sheep Husbandry 5N20385 1. Component Details Title Teideal as Gaeilge Award Type Code Sheep Husbandry Riar Caorach Minor 5N20385 Level 5 Credit Value 10 Purpose Learning
The role of the IZS A&M as OIE Collaborating Centre on veterinary training, epidemiology, food safety and animal welfare Barbara Alessandrini
 The role of the IZS A&M as OIE Collaborating Centre on veterinary training, epidemiology, food safety and animal welfare Barbara Alessandrini Istituto Zooprofilattico Sperimentale dell Abruzzo e del Molise
University Council on Animal Care
 Policy: Research Animal Procurement Category: Compliance Assurance Subject: Procurement of live animals used in animal-based science Approving Authority: University Council on Animal Care Responsible Office:
EFSA-EMA Joint Scientific Opinion
 EFSA-EMA Joint Scientific Opinion on the Reduction Of the Need to use Antimicrobials in Foodproducing Animals (RONAFA) Beatriz Guerra Copenhagen, 7 April 2017 FWD/EURL-AR Worshop SCIENTIFIC OPINION EC
SUPPORT TO THE EUROPEAN REGION. Paolo Dalla Villa, Giacomo Migliorati, Paolo Calistri, Barbara Alessandrini
 SUPPORT TO THE EUROPEAN REGION Paolo Dalla Villa, Giacomo Migliorati, Paolo Calistri, Barbara Alessandrini A 70 years story We are a public health Institution, founded in 1941, belonging to the National
Visual aids to increase the awareness of condition scoring of sheep - a model approach
 Visual aids to increase the awareness of condition scoring of sheep - a model approach Jonathan England Department of Agriculture and Food, 10 Doney St, Narrogin, Western Australia 6312 Email: jonathan.england@agric.wa.gov.au