Definition of Homologous Synteny Blocks (HSBs)
|
|
|
- Eric Davidson
- 6 years ago
- Views:
Transcription
1 Definition of Homologous Synteny Blocks (HSBs) The gene mapping data were derived from the following publications: mouse and rat GRIMM synteny blocks (Bourque et al. 2004), cat radiation hybrid map (Menotti- Raymond et al. 2003), cattle radiation hybrid map (Larkin et al. 2003; Everts van der Wind et al. 2004), dog radiation hybrid map (Guyon et al. 2003), pig radiation hybrid maps (Myers et al. in press; McCoard et al. 2002), horse radiation hybrid and cytogenetic maps (Chowdhary et al. 2003). Homologous synteny blocks (HSBs) were defined for each species with the human genome as a reference (NCBI Build 33), and required a minimum of two adjacent markers on the same chromosome in both species without interruption. Inversions were counted only if there were 3 or more perfectly consecutive markers, each >1 megabase pairs (Mbp) apart from their neighbor, and in opposite orientation from the human genome. RH markers that were binned were not used for defining three-marker rule HSBs. Because of the inherent resolution limitations of RH mapping, we allowed for single out-of-place markers to jump <2 Mbp into their expected position in the segment based on the order in the human genome; those markers that did not satisfy this criterion were classified as singletons. Markers (2 or more) were not allowed to jump into a new segment if they are surrounded by segments from other parts of the same or different human chromosomes. Singletons were included for interpretive purposes. Horse segments were defined in the same manner, and were allowed to span multiple linkage groups if supported by cytogenetic data. In addition, many FISH mapped markers were used to augment the horse data, but only if they were consistent with marker orders derived from the RH-based data (Chowdhary et al. 2003). The Evolution Highway Multispecies Genome Browser To facilitate our research activities, we utilized the D2K application environment created by the Automated Learning Group at the National Center for Supercomputing Applications at UIUC." This environment allows users to connect programming modules together to build data mining applications and supplies a core set of modules, application templates, and a standard API for software component development. All D2K components are written in Java for maximum flexibility and portability. Evolution Highway is a set of D2K components created to load, correlate and map chromosome and species data to a visual chromosome metaphor for comparative analysis. The Evolution Highway interface employs a zoomable user interface that allows the user to zoom in for detailed information and zoom out for an overview. Users can alter the reference genome (currently human or mouse), alter the visualization of centromeres, telomeres, ancestral chromosome HSBs or any user-defined custom track. The D2K framework enables the Evolution Highway to be a desktop application and a web service application ( and is freely available. Breakpoint Classification and Analysis An evolutionary chromosome breakpoint boundary (or breakpoint boundary ) was defined as a nucleotide position on a chromosome, identified by a human genome reference coordinate (NCBI Build 33), which is adjacent to a known evolutionary chromosome rearrangement as defined by a pair-wise comparison of gene maps or genome sequences. An evolutionary breakpoint region (or breakpoint region ) was 1
2 defined as a region between two homologous synteny blocks that is demarcated by an evolutionary chromosome breakpoint boundary on each side. An overlapping breakpoint region was defined as a region with one or both breakpoint boundaries that overlap with a breakpoint region in another genome. An overlapping breakpoint region must have at least one breakpoint boundary that is <500 Kbp from the orthologous breakpoint boundary in another species. A special case occurs when breakpoint boundaries overlap in multiple species, but specific breakpoint boundaries within the breakpoint region are >500 Kbp in one of the pair-wise comparisons. In such cases, each of the chained overlapping breakpoint regions was considered distinct, with the smallest overlapping breakpoint region for a pair-wise comparison being defined as the core. In such situations the breakpoint boundaries of the core served as the reference points for applying the 500 Kbp rule. In cases where a putative breakpoint region overlaps with multiple breakpoint regions in a second species, these are referred to as gaps. We classified each breakpoint region as follows: 1. A lineage-specific breakpoint region was defined as a breakpoint region unique to a single species that does not overlap and breakpoint region of any other species in the interval <1Mbp up- or downstream. 2. An order-specific breakpoint region was defined as a breakpoint region overlapping within the interval 1Mbp up- or downstream in two or more species from the same order (e.g. cat and dog; mouse and rat; cattle and pig) and do not overlap with breakpoint regions of any other species from other orders. 3. A superordinal breakpoint region must be an overlapping breakpoint region in all species from two or more orders with a recent common ancestor. 4. A reuse breakpoint region must have overlapping breakpoint regions in one or more, but not all species from different orders. Table 1. Classification of mammalian breakpoint regions (< 4 Mbp). Classification No. Breakpoints Superordinal 2 Order-specific Cetartiodactyla 10 Carnivora 9 Rodentia 150 Total 169 Lineage-specific (includes reuse breakpoints) a cat 12 dog 64 cattle 67 pig 46 human 34 mouse 36 rat 20 Total 279 a Because reuse breakpoint regions are represented in multiple species categories (see Fig. 3), the total breakpoint count (superordinal+ordinal+lineage specific) sums to 450 rather than
3 For the purposes of the present analysis, using the human genome as a reference, breakpoint regions overlapping in 5 or more non-human species were classified as primate-specific breakpoint regions. Primate-specific breakpoint regions were confirmed by pairwise comparison of all segments against at least two non-primate species as the reference species (e.g., using the mouse or pig genome as a reference). Producing multi-way homologous synteny blocks (HSBs) for genome rearrangement analyses. To make multi-way HSBs, pairwise HSBs were used for each human-species pair: human/cat, human/cattle, human/dog, human/pig, human/horse, human/mouse and human/rat. The latter two pairs were based on previously published, whole genome sequence-based, 1 Mbp synteny blocks (Bourque et al. 2004). To make int_7way (which excludes unsigned blocks; i.e., singletons): We find all combinations of blocks: b1: a human/mouse block b2: a human/rat block b3: a human/cat block b4: a human/cattle block b5: a human/dog block b6: a human/pig block for which the 6-way intersection of the human coordinates of b1,...,b6 is non-empty. Each such combination will result in one 7-way block, B, whose human coordinates are given by that 6-way intersection, and whose human sign is +1. The signs in the other species are inherited from b1,...,b6. The coordinates in the other species were determined by interpolation: in human coordinates, B is somewhere within b1. If it starts 0.3 of the way through b1 and ends 0.45 of the way through b1 in human coordinates, and if the mouse sign is positive, then the mouse coordinates of b1 were interpolated with those same fractions to get the coordinates in B. If the mouse sign of b1 was negative, then the complementary fractions =0.55 and 1-0.3=0.7 were used. This process was repeated for b2,...,b6 to get the rat/cat/.../pig coordinates of B. 4) To make the int_7wayu (which includes unsigned 2-way blocks) HSBs: a) We performed the same procedure described above for int_7way, except we included the unsigned 2-way blocks by treating their signs as +1. b) Each unsigned 2-way block was split into 0 or more 7-way blocks. If 0, then the process is complete. If there is 1 or more, then those blocks are consecutive and we have to decide on their overall sign being +1 (so they stay in the same 3
4 order) or -1 (so their order is reversed and their coordinates should be modified to reflect that). A parsimony criterion was used to determine the signs. Multiple Genome Rearrangement (MGR) scenario Starting from the 307 seven-way synteny blocks we first computed the rearrangement distance between each pair of genomes (Table 1). These distances highlight the varying rates of rearrangement across the different lineages. For example, the rearrangement distance between human and cat is less than half the rearrangement distance between human and mouse even though the divergence time is higher for cat than for mouse. Directly applying the neighbor-joining algorithm (Saitou and Nei, 1987) on the matrix of pairwise distances leads to the following tree: (((((Human,Cat),Pig),Dog),Cattle),(Mouse,Rat)) The tree is unrealistic as it contradicts many of the known mammalian clades (Springer et al. 2004). To circumvent this limitation but also to obtain a more descriptive rearrangement scenario that includes a description of the ancestral nodes, we used the MGR algorithm (Bourque and Pevzner, 2002). MGR uses different heuristics and seeks a most parsimonious rearrangement scenario that best explains the contemporary block arrangements. The rearrangements analyzed are inversions, translocations, fusions and fissions. For the current application, the MGR algorithm was adapted to look for a parsimonious rearrangement on a tree with a given topology (see Methods). In this case, the topology used was: ((Human,(Mouse,Rat)),((Cat,Dog),(Pig,Cow))). The final tree recovered requires a total of 487 rearrangements and is shown in Figure S2. In the process, MGR also generated the block arrangements of 5 putative ancestors: carnivore (cat+dog), cetartiodactyl (cattle+pig), ferungulate (carnivore+cetartiodactyl), murid rodent (mouse+rat), and human-mouse-rat. The minimum number of rearrangements required to convert between two adjacent genomes on the tree is shown at the top of Figure S2. For many of the ancestors, the ratio between the total number of rearrangements of the 3 incident edges and the number of common blocks was high. For this reason, it was possible to find alternative ancestors also minimizing the total number of rearrangement events on the evolutionary tree, which allows for distinguishing between weak and strong areas of the ancestral reconstructions. Specifically, we explored a wide range of alternative ancestors (see below), and we looked for adjacencies that are present in all of the observed alternative ancestors. We call these strong adjacencies. In contrast, adjacencies that were not conserved in at least one of the alternative ancestors are called weak adjacencies (black arrows in Figs. 2 & S2). The number of weak adjacencies identified in this way is actually a lower bound for the true number of weak adjacencies since we can only explore a subset of all the alternative solutions. We used this relatively stringent criterion (broken once implies weak) because otherwise we would need to characterize more precisely the proportion of explored alternative ancestors, and that is a computationally impractical task at this point in time. More than half of the 168 weak adjacencies were actually found at the end of the putative ancestral chromosomes and, in most cases, were associated with alternative inter-chromosomal rearrangements. Overall, 4
5 the total number of weak adjacencies represented about 10% of the predicted ancestral adjacencies. MGR only produces scenarios associated with unrooted trees. This implies that with no outgroup data it is impossible to directly extract the mammalian ancestor from the scenario displayed in Figure S2. But, by assuming comparable rates of rearrangement in the early lineages (see below), we generated a putative mammalian ancestor half way between the ferungulate and human-mouse-rat ancestors (see Figure 2, S2). By using the equally parsimonious alternative ancestors identified for both of these ancestors, we also generated alternative mammalian ancestors that allowed for identification of 49 weak adjacencies in the reconstruction (see below). Human Mouse Rat Cat Cattle Dog Pig Human Mouse Rat Cat Cattle Dog Pig Table 1. Rearrangement distance between each pair of genomes computed on the 307 seven-way synteny blocks. MGR with fixed topology The original MGR algorithm (Bourque and Pevzner 2002) works in two stages. Suppose we have m genomes: G 1, G 2,, G m. In the first stage, rearrangements in any of the starting genomes reducing the distance to all other starting genomes are identified and are carried out iteratively. These rearrangements are called good rearrangements. The process is repeated until no good rearrangement is left and we have m modified genomes: G 1, G 2 G m. In the second stage, the tree is initialized by using the 3 closest modified genomes and by computing their median genome. The remaining modified genomes are then added to the tree one at a time. Each remaining modified genome is added to the tree by splitting the existing edge such that the increase in the total number of rearrangements is minimized. If the topology of the tree is given, MGR is modified to work as follows. The procedure to identify and carry on good rearrangements in the first stage remains unchanged. But, in the second stage, the closest pair (in terms of the rearrangement distance) of topological neighbor is identified (G i and G j ). Next, the closest topological reference genome that is also the closest in terms of the rearrangement distance is identified (G k ). Finally, the pair (G i and G j ) is replaced by the solution of the median problem for these 3 genomes and the procedure is repeated until all ancestors have been found. 5
6 Optimizing a rearrangement scenario Given an unrooted binary tree with m genomes (leaves) and m-2 ancestors (internal nodes) found after running the first two stages of MGR, the internal nodes are reoptimized as follows. The approach implemented iterates between a top-down and a bottom-up traversal of the internal nodes and in this sense relates to the Fitch-Hartigan algorithm for character-based parsimony (Fitch, 1971; Hartigan, 1973). For each internal node, we solve the median problem associated with the 3 adjacent nodes and we replace the internal node by the new median if the score is better. We iterate the process until no new internal node is found in a given top-down or bottom-up pass. For the data set with 307 blocks, the first scenario recovered required a total of 505 rearrangements. Reoptimizing the internal nodes allowed us to find a scenario with 499 rearrangements. Finding alternative ancestors We find alternative ancestors in a way very similar to how we optimize a scenario. Once again, given a tree with genomes and ancestors, we traversed the ancestors by alternating between a top-down and bottom-up approach. For each ancestor, instead of solving the median problem associated with this ancestor, we looked for a rearrangement that could be applied to this ancestor such that the total distance to its 3 adjacent nodes does not increase. When the distances to the neighbors are large, we can typically obtain a list of such rearrangements. Associated to each of these rearrangements is an alternative ancestor in the sense that an equally good solution (in terms of the number of rearrangements) could be obtained by replacing the current ancestor with this new one. For every list of potential alternative ancestors, we only recorded the alternative ancestor that maximized the distance to the original ancestor associated with this node. We also required that this alternative ancestor was not recorded previously. The purpose of these two rules was to maximize the range of alternative solutions explored. Finally, we replaced the internal node with the new alternative ancestor identified and we continued traversing the tree. We alternated between top-down and bottom-up traversals until either no new alternative ancestor was found or, more probably, we reached the maximum number of traversals (set to 3000). The large number of potential alternative ancestors can typically by explained by the combinatorial explosion associated with different optimal configurations of just a few breakpoints (weak adjacencies). While generating the list of alternative ancestors, it is sometimes possible to identify a new ancestor that decreases the overall total number of rearrangements. When that is the case, we use the new ancestor but we do not reset the lists of alternative ancestors to avoid restricting the procedure to a limited set of alternative ancestors. For the data set with 307 blocks, we started from a scenario with 499 rearrangements. The procedure of modifying ancestors and looking for better or equally good ancestors actually allowed the identification of a scenario with 487 rearrangements that is displayed in Figure S2. The scenario was found in the 1603rd traversal. After 3000 traversals, we recorded 694, 2018, 3000, 50 and 3000 alternative ancestors for the mouse-rat, cetartiodactyl, carnivore, ferungulate, and human-mouse-rat ancestors, respectively. The 6
7 small number of alternative ancestors found for the ferungulate ancestor relates to the short edges incident to that node. Estimating the Boreoeutherian ancestor The two oldest ancestors reconstructed using the current data set are the ancestor of catdog-pig-cow (cetartiodactyl-carnivore ancestor) and the ancestor of human-mouse-rat. In the solution displayed in Figure S2, these two ancestors are only 14 rearrangements away from each other. Under the parsimonious assumption, the mammalian ancestor should reside somewhere on the path between the cetartiodactyl-carnivore ancestor (A10) and the human-rodent ancestor (A11), but outgroup data from an additional mammalian genome would be required to identify its exact position unambiguously. To circumvent this limitation, we make the further assumption that the rearrangement rates were comparable in these early branches, and we looked for the putative mammalian ancestor at the midpoint between the ferungulate ancestor and the human-mouse-rat ancestor. Unfortunately these two ancestors, and the path in between them, are not unique. Instead of generating a single prediction for the mammalian ancestor, we generated one prediction for each pair of alternative ancestors (A10, A11) by selecting the ancestral configuration half way on one of the paths between this particular A10 and this particular A11. The result of the prediction made from the A10 and A11 displayed in Figure 2 and S2. All the other predictions are used to identify strong and weak adjacencies as before. For each pair (A10, A11), we note that the distance between the two ancestors is not always equal to 14 and, moreover, that each pair is not necessarily associated with an optimal scenario of 487 rearrangements. Nevertheless, we find the mammalian ancestors to be relatively stable. Starting from the 50 alternative ferungulate ancestors and the first 100 alternative human-mouse-rat ancestors, we generated 5000 pairs of ferungulate/human-mouse-rat ancestors, and hence 5000 alternative mammalian ancestors. This leads to 45 weak adjacencies that include 22 weak chromosome endpoints. Using the first 1000 alternative ancestors for human-mouse-rat, provides alternative mammalian ancestors but only increased the number of weak adjacencies to 49 (and 23 weak chromosome endpoints). Those are the weak adjacencies displayed in Figures 2 and S2. Gene Density at Evolutionary Breakpoints Analysis To determine gene density in classified evolutionary breakpoints (<4Mbp), we defined the narrowest breakpoint region interval between flanking HSBs, relative to the human sequence coordinates, as the core breakpoint, and determined its midpoint. In cases where the breakpoint was shared by multiple species, a consensus breakpoint boundary was defined in the human genome, with the left and right ends defined as the most distant boundaries of the overlapping breakpoint region. In cases where the consensus breakpoint interval included an evolutionary breakpoint region in one or more species that is defined by boundaries that are 500 Kbp from the core, then the midpoint was calculated as half the distance from the most proximal boundaries of the core and the breakpoint region (as defined in a second species). Given the coordinates of that midpoint in the human genome, we then created discrete intervals of 0.5 Mbp windows surrounding the midpoint and counted the number of unique RefSeq and predicted genes (NCBI Build 33) in those windows, extending to 2 Mbp total on each side of the midpoint. Initial analyses showed 7
8 no significant difference in gene number between the innermost 0.5 Mbp windows on either side of the midpoint and the adjacent 0.5 Mbp windows, so these were combined and compared to the number of RefSeq and predicted genes in chromosome regions outside of the breakpoint regions. The horse genome is excluded from the analysis of gene content because the data set as a whole produces artificially large consensus breakpoint intervals. Segmental Duplications in Primate-Specific Chromosomes. We examined the segmental duplication content of each primate specific breakpoint using the 1Mbp surrounding the midpoint of the core breakpoint, as previously defined. Primate-specific breakpoints were defined as described above under breakpoint classification. These data were tabulated using the coordinates in Table S4 and the segmental duplication data track in the UCSC web browser (April 2003 build). We counted the number of segmental duplications in each 1 Mbp breakpoint region, determined what frequency mapped to other intrachromosomal sites, and how many either mapped back to the same breakpoint region, or to breakpoint regions flanking HSBs that were rearranged (inverted) relative to the outgroup mammalian species. Centromere/Telomere Analysis The positions of the centromeres and telomeres in each species (except horse due to the relatively low resolution of its comparative map) were assigned to human-species homologous synteny blocks (HSBs). The acrocentric centromere and telomere locations in HSBs were defined based on the position of the marker on the RH comparative map most proximal to the centromere or telomere in the species chromosomes. In total, the position of 108 acrocentric centromeres and 233 telomeres were assigned to the HSBs. Due to inconsistency between the rat genome sequence centromere assignments between the NCBI and the UCSC, the 13 rat metacentric centromeres were excluded from our analysis. Of the 50 metacentric centromeres assigned, 22 were found on the boundaries of HSBs. These were split in half, and placed on each of two boundary HSBs. We excluded 5 metacentric centromeres and 4 telomeres from the analysis of centromere/telomere positional conservation because their positions could not be unambiguously determined. Cross-species positional conservation was defined as centromeres/telomeres located in HSBs in more than one species within 2.5 Mbp on the same human chromosome. An exception was made for the centromeres/telomeres located proximal to the human telomeric regions. Conservation of such centromeres/telomeres was accounted for even when centromeres/telomeres were located >2.5 human-mbp, while the other representative of the same order showed contiguous homologous synteny with the human genome in this area. Acrocentric centromeres were classified into three distinct groups 1) centromeres, (if the location of an acrocentric centromere in a human/species HSB visualized on human chromosomes was supported by conservation with the location of a metacentric centromere in another species HSB on the same human chromosome) 2) telomeres (if the location of the acrocentric centromere in a human/species HSB demonstrated conservation with the location of a telomere in another species HSB) and 3) acrocentric centromere, (if there was no conservation with either a metacentric centromere or 8
9 telomere location in human-species HSB at the position of the acrocentric centromere visualized on human chromosome (Fig S2)). When acrocentric centromere positions showed conservation with both metacentric centromere(s) and telomere(s) positions the acrocentric centromere was classified using the classification of the closest relative of the species analyzed. For this analysis 85 centromeres were used, including 50 metacentric centromeres, 22 metacentric centromeres at evolutionary breakpoints that were divided in half, 18 acrocentric centromeres categorized as centromeres (minus five excluded centromeres). For the same analysis 254 telomeres were used: 233 telomeres plus 25 acrocentric centromeres categorized as telomeres minus four excluded telomeres. A second analysis was performed to examine the association between centromere/telomere positions and evolutionary breakpoints. Of the original 414 centromere/telomere locations, 78 were excluded because they were placed to HSBs at the boundary of a gap (evolutionary breakpoint region >4 human-mbp), 92 were excluded because they were located at human telomeric regions (not classified as breakpoint regions), 10 metacentric centromeres were excluded because they were located inside HSBs and finally all 64 human centromeres/telomeres were excluded, because the reference genome (human) HSBs were not defined. A Chi-square test was done to test if there was an association between the remaining 170 centromere/telomere locations and evolutionary breakpoint types. Cancer Breakpoint Analysis The Mitelman database (NCBI, version build 33) was used as a source of the positions for cancer-related chromosome abnormalities in the human genome. The cytogenetic positions of cancer-associated breakpoints were translated into human sequence coordinates using coordinates of the genes associated with each of cancer abnormality in the database. Of 1,647 cancer chromosomal abnormalities, human sequence coordinates could be obtained for 650 cases. The cases were sorted by gene names; a total of 112 unique genes were identified in the dataset. The number of occurrences for each gene was summed from all cancer cases involving the same gene. Of these, 61 genes had >10 documented occurrences, and 51 had between 2 and 9 occurrences. These two datasets were independently tested for co-occurrence and location within 0.4 human-mbp from the 367 evolutionary breakpoints (<4 human-mbp; average breakpoint size = 1.2 Mbp) identified from the multispecies genome comparison. Sixty-one cases were separately tested for co-occurrence with mouse, rat, and rodent-specific breakpoints (N=206; average breakpoint size = 274 Kbp) References G. Bourque, P. A. Pevzner. Genome Res. 12, 26 (2002). G. Bourque, P. A. Pevzner, G. Tesler, Genome Res. 14, 507 (2004). B. P. Chowdhary et al., Genome Res. 13, 742 (2003). A. Everts-van der Wind et al., Genome Res. 14, 1424 (2004). 9
10 W. Fitch. Systematic Zool., 20, (1971). R. Guyon et al., Proc. Natl. Acad. Sci. U.S.A. 100, 5269 (2003). J. A. Hartigan. Biometrics, 29, 53 (1973). D. M. Larkin et al., Genome Res. 13, 1966 (2003). S. A. McCoard et al. Animal Genet. 33, 178 (2002). M. Menotti-Raymond et al., Cytogenet Genome Res. 102, 272 (2003). S. N. Meyers et al. Genomics in press (2005). N. Saitou, M. Nei. Mol. Biol. Evol. 4, 406 (1987). M. S. Springer, O. Madsen, W. W. de Jong, M. J. Stanhope, Trends Ecol. Evol. 19, 430 (2004). 10
11 Figure S1. Homologous synteny blocks (HSBs) between horse, cat, dog, cattle, pig, rat, mouse, and human genomes visualized on each human chromosome (scale to the left is in Mbp, based on NCBI Build 33). Human centromeres are indicated in black, and heterochromatin is indicated with stippled markings. Gray bars correspond to HSBs, with the species chromosome number indicated inside the bars. Lower case letters inside the segments indicate the order of the blocks in that species chromosome (in alphabetical order). The position of telomeres and centromeres in each species (for those that could be accurately determined) are indicated with the dark gray rectangles, and ovals respectively. Black ovals correspond to metacentric centromeres; gray ovals to acrocentric centromeres. Split ovals show the positions of metacentric centromeres involved in evolutionary rearrangements. Telomere (T)/centromere (C) clusterings are indicated with red arrowheads. Positions of human genes associated with cancer chromosome aberrations (37) with occurrences between 2 and 9 are shown with numbered black arrowheads. Those are indicated by green numbered arrowheads have >10 occurences. Blue arrowheads labeled RB indicate reuse breakpoints. Colored blocks on the right side of the human chromosome ideograms indicate the homologous segment in the boreoeutherian ancestor (Fig. 2) (with ancestral chromosome number and block depicted inside).
12
13
14
15
16
17
18
19
20
21
22
23
24
25
26
27
28
29
30
31
32
33
34
35 Figure S2. Genome architecture of seven mammalian species, and the ancestors of the three mammalian lineages, computed by MGR from the seven starting genomes, and compared to the human genome (far right). Each human chromosome is assigned a unique color, and is divided into 7-way, multispecies homolgous synteny blocks (MHSBs). The blocks are proportional to their length in the human genome. Diagonal lines within each block (from top left to bottom right) indicate the relative order and orientation of genes within the block. The number above each colored block refers to the corresponding human chromosome homologue. Gaps in multispecies coverage are shown in white. Gray hashed lines indicate heterochromatic/telomeric regions of human chromosome. Species chromosome designations are listed to the left of each chromosome, and the blocks are numbered above to indicate their homologous human chromosome. Four ancestral genomes are depicted in between the seven species genomes, and the boreoeutherian genome shown to the far right. The ferungulate ancestor is the ancestor of Carnivora+Cetartiodactyla. At the top of the figure, the phylogram indicates the number of rearrangements required to convert one genome into the other. Black arrows on the ancestral chromosomes indicate that the two adjacent MHSBs separated by the arrow were not found in every one of the most parsimonious solutions: these are considered weak adjacencies.
36 cattle cetartiodactyl anc. pig dog carnivore anc. cat ferungulate anc. rat murid rodent anc. mouse human/mouse/rat anc. human boreoeutherian anc A A2 A B1 B2 B3 B C C D D2 D3 D4 E E E3 F F X X X X X X X X X X X X X 24 X 24 X X X X X
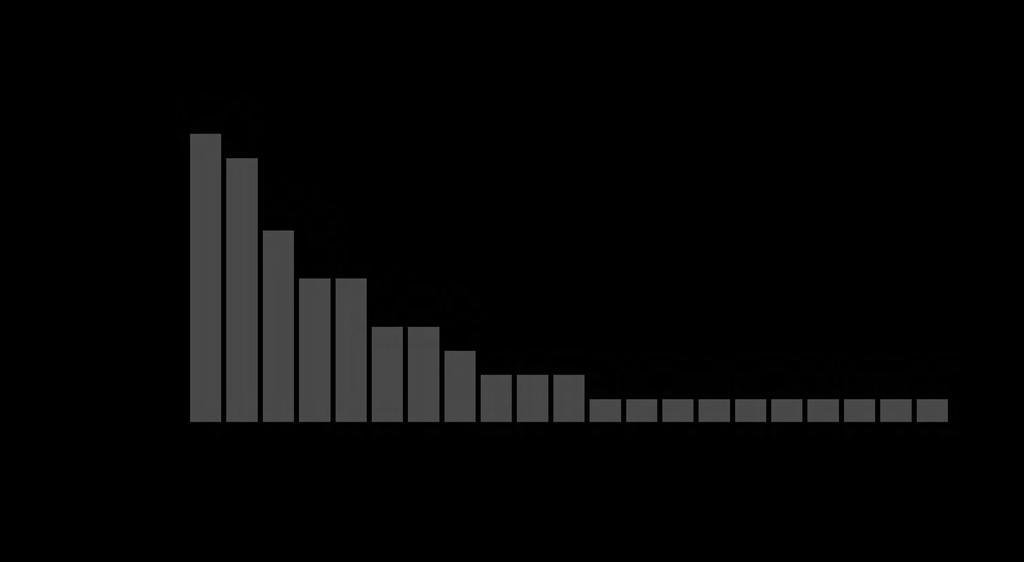
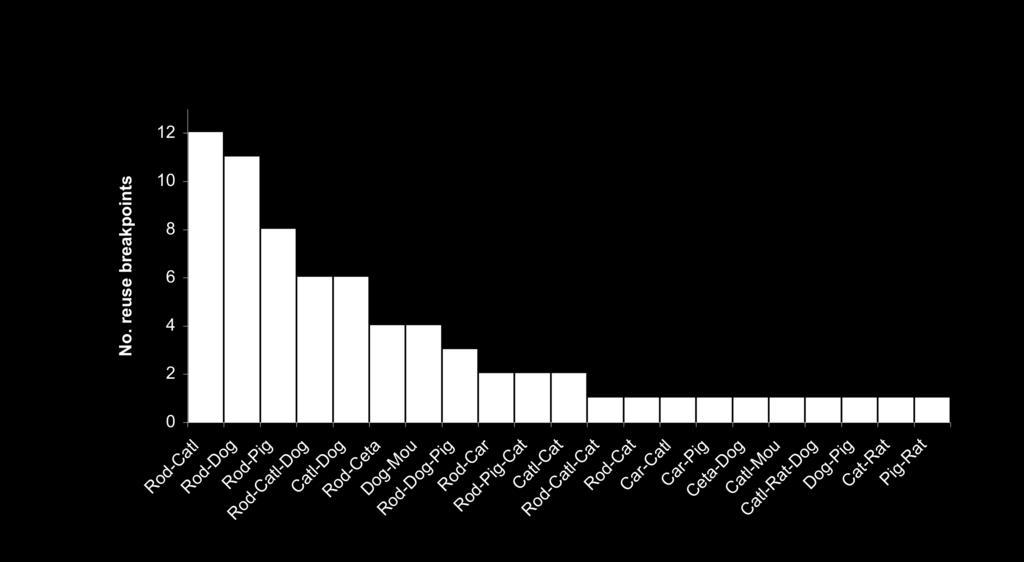
37 Fig. S3. The distribution of evolutionary reuse breakpoints in mammalian genomes. The chart shows the number of reuse breakpoints found between individual species from different orders, and between orders (see Fig. S1 for labeled reuse breakpoints). Abbreviations are as follows: Rod=Rodentia, Catl=Cattle, Ceta=Cetartiodactyla, Mou=Mouse, Car=Carnivora.
38
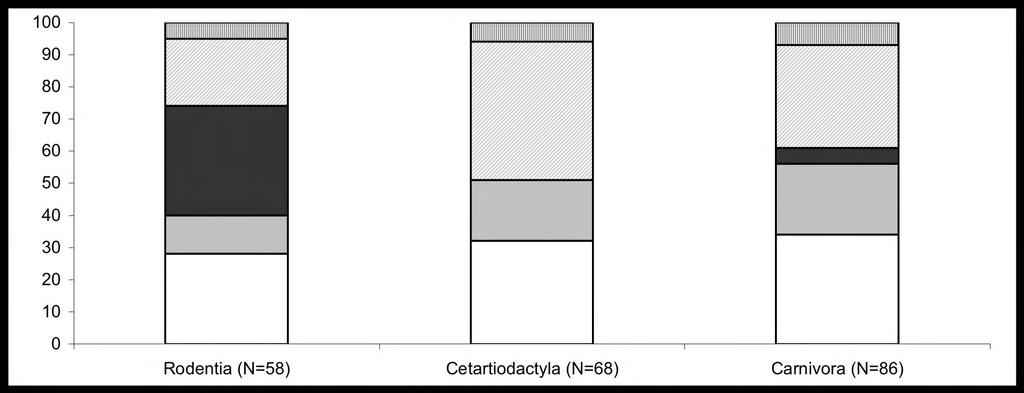
39 Fig. S4. Conservation of telomeres within and between mammalian orders. Blocks from bottom to top indicate: no conservation (white), conservation between single species from different orders (gray), conservation within a single order (dark gray), conservation within an order and at least a single species from a different order (light gray), conservation within two orders and at least a single species from a third or fourth order (gray stripes). 2
40 frequency
41 Figure S5: Human cancer breakpoint occurrences and their correspondence with evolutionary breakpoint regions Within +/- 0.4 Mbp > 0.4 Mbp % within +/- 0.4Mbp % >0.4 Mbp 2-10 occurences N= >9 occurences N= >2 occurences N= Cancer Breakpoints Compared To Evolutionary Breakpoint Regions Number of Cancer Aberration Breakpoints Within +/- 0.4 Mbp > 0.4 Mbp Distance of Cancer Aberration Breakpoints to Evolutionary Breakpoint Regions 2-10 occurences N=51 >9 occurences N=61
42 Table S1. Pairwise Homologous Synteny Blocks Human Chromosome Segment Start/Human Genome Segment End/Human Genome Species Chromosome/Segment Order Segment Start/Species Genome Segment End/Species Genome Segment Orientation Species Segment # Comment A1a cat A1b cat 2 singleton A1c cat 3 singleton A1d cat 4 singleton A1e cat A1f cat A1g cat A1h cat A1i cat A1j cat A1k cat A1l cat A1m cat A2a cat A2b cat A2c cat 16 singleton A2d cat A2e cat 18 singleton A2f cat A2g cat 20 singleton A2h cat A2i cat A2j cat A2k cat A3a cat A3b cat A3c cat A3d cat A3e cat A3f cat 30 singleton A3g cat B1a cat B1b cat B1c cat B1d cat B2a cat B2b cat B2c cat B3a cat B3b cat B3c cat 41 singleton B3d cat 42 singleton B3e cat B3f cat 44 singleton_within B3g cat B3h cat 46 singleton_within B4a cat B4b cat B4c cat B4d cat B4e cat B4f cat B4g cat B4h cat B4i cat C1a cat C1b cat C1c cat C1d cat C2a cat C2b cat C2c cat C2d cat C2e cat C2f cat D1a cat D1b cat D1c cat D1d cat D1e cat D1f cat D1g cat D2a cat D2b cat D2c cat 75
43 D2d cat D2e cat D2f cat D2g cat D3a cat D3b cat D3c cat D3d cat D3e cat 84 singleton_within D3f cat D3g cat 86 singleton_within D4a cat D4b cat D4c cat E1a cat E1b cat E1c cat E1d cat E1e cat E1f cat E1g cat E2a cat E2b cat E2c cat 99 singleton_within E2d cat E3a cat 101 singleton E3b cat E3c cat E3d cat F1a cat F1b cat F1c cat F1d cat 108 singleton F1e cat 109 singleton F2a cat 110 X Xa cat a cattle b cattle c cattle d cattle e cattle f cattle 6 singleton g cattle h cattle 8 singleton_within i cattle 9 singleton a cattle 10 singleton b cattle 11 singleton c cattle 12 singleton d cattle e cattle 14 singleton f cattle 15 singleton g cattle 16 singleton h cattle i cattle 18 singleton_within j cattle k cattle l cattle m cattle n cattle o cattle 24 singleton_within p cattle a cattle b cattle 27 singleton_within c cattle d cattle e cattle a cattle b cattle 32 singleton_within c cattle 33 singleton_within d cattle e cattle f cattle 36 singleton g cattle h cattle 38 singleton_within i cattle 39 singleton j cattle k cattle 41 singleton_within a cattle b cattle c cattle d cattle 45
44 e cattle f cattle g cattle 48 singleton_within h cattle 49 singleton_within i cattle 50 singleton j cattle a cattle b cattle c cattle d cattle a cattle b cattle c cattle d cattle e cattle 60 singleton f cattle g cattle 62 singleton h cattle i cattle 64 singleton j cattle k cattle l cattle m cattle a cattle b cattle c cattle d cattle e cattle f cattle 74 singleton g cattle h cattle a cattle b cattle c cattle d cattle a cattle 81 singleton b cattle c cattle d cattle e cattle 85 singleton f cattle g cattle h cattle 88 singleton a cattle b cattle c cattle d cattle e cattle f cattle g cattle h cattle i cattle 97 singleton j cattle k cattle l cattle 100 singleton m cattle n cattle o cattle p cattle a cattle b cattle c cattle 107 singleton_within d cattle 108 singleton_within a cattle b cattle c cattle d cattle e cattle f cattle g cattle h cattle i cattle j cattle k cattle a cattle b cattle 121 singleton c cattle d cattle e cattle f cattle g cattle 126 singleton
45 h cattle i cattle j cattle 129 singleton k cattle 130 singleton l cattle a cattle b cattle c cattle 134 singleton_within d cattle e cattle f cattle a cattle 138 singleton b cattle c cattle 140 singleton d cattle e cattle 142 singleton f cattle g cattle h cattle i cattle j cattle k cattle l cattle 149 singleton m cattle a cattle b cattle c cattle d cattle e cattle a cattle 156 singleton b cattle c cattle d cattle e cattle f cattle a cattle b cattle c cattle d cattle 165 singleton_within e cattle f cattle g cattle 168 singleton h cattle i cattle a cattle b cattle a cattle b cattle c cattle d cattle e cattle f cattle a cattle b cattle 180 singleton c cattle d cattle 182 singleton e cattle f cattle g cattle h cattle 186 singleton i cattle a cattle b cattle c cattle a cattle b cattle 192 singleton c cattle d cattle e cattle f cattle 196 singleton g cattle h cattle i cattle a cattle b cattle 201 singleton c cattle d cattle 203 singleton_within e cattle f cattle g cattle a cattle 207
46 b cattle c cattle 209 singleton_within d cattle e cattle 211 singleton a cattle 212 singleton b cattle c cattle d cattle e cattle f cattle 217 singleton g cattle 218 singleton a cattle b cattle c cattle d cattle a cattle b cattle c cattle d cattle e cattle f cattle g cattle 229 X Xa cattle 230 X Xb cattle 231 X Xc cattle a dog b dog c dog 3 singleton_within d dog e dog f dog g dog 7 singleton_within h dog i dog j dog k dog 11 singleton_within a dog 12 singleton b dog c dog d dog e dog f dog g dog h dog i dog 20 singleton_within j dog a dog b dog 23 singleton c dog d dog e dog f dog g dog 28 singleton h dog i dog j dog a dog b dog c dog d dog e dog f dog g dog a dog b dog c dog d dog e dog f dog g dog a dog 46 singleton b dog c dog d dog e dog f dog g dog h dog i dog a dog b dog 56
CLADISTICS Student Packet SUMMARY Phylogeny Phylogenetic trees/cladograms
 CLADISTICS Student Packet SUMMARY PHYLOGENETIC TREES AND CLADOGRAMS ARE MODELS OF EVOLUTIONARY HISTORY THAT CAN BE TESTED Phylogeny is the history of descent of organisms from their common ancestor. Phylogenetic
Introduction to phylogenetic trees and tree-thinking Copyright 2005, D. A. Baum (Free use for non-commercial educational pruposes)
") Introduction to phylogenetic trees and tree-thinking Copyright 2005, D. A. Baum (Free use for non-commercial educational pruposes) Phylogenetics is the study of the relationships of organisms to each other.
Introduction to phylogenetic trees and tree-thinking Copyright 2005, D. A. Baum (Free use for non-commercial educational pruposes) Phylogenetics is the study of the relationships of organisms to each other.
LABORATORY EXERCISE 7: CLADISTICS I
 Biology 4415/5415 Evolution LABORATORY EXERCISE 7: CLADISTICS I Take a group of organisms. Let s use five: a lungfish, a frog, a crocodile, a flamingo, and a human. How to reconstruct their relationships?
Do the traits of organisms provide evidence for evolution?
 PhyloStrat Tutorial Do the traits of organisms provide evidence for evolution? Consider two hypotheses about where Earth s organisms came from. The first hypothesis is from John Ray, an influential British
LABORATORY EXERCISE 6: CLADISTICS I
 Biology 4415/5415 Evolution LABORATORY EXERCISE 6: CLADISTICS I Take a group of organisms. Let s use five: a lungfish, a frog, a crocodile, a flamingo, and a human. How to reconstruct their relationships?
2013 Holiday Lectures on Science Medicine in the Genomic Era
 INTRODUCTION Figure 1. Tasha. Scientists sequenced the first canine genome using DNA from a boxer named Tasha. Meet Tasha, a boxer dog (Figure 1). In 2005, scientists obtained the first complete dog genome
Phylogeny Reconstruction
 Phylogeny Reconstruction Trees, Methods and Characters Reading: Gregory, 2008. Understanding Evolutionary Trees (Polly, 2006) Lab tomorrow Meet in Geology GY522 Bring computers if you have them (they will
Lecture 11 Wednesday, September 19, 2012
 Lecture 11 Wednesday, September 19, 2012 Phylogenetic tree (phylogeny) Darwin and classification: In the Origin, Darwin said that descent from a common ancestral species could explain why the Linnaean
Modern Evolutionary Classification. Lesson Overview. Lesson Overview Modern Evolutionary Classification
 Lesson Overview 18.2 Modern Evolutionary Classification THINK ABOUT IT Darwin s ideas about a tree of life suggested a new way to classify organisms not just based on similarities and differences, but
INQUIRY & INVESTIGATION
 INQUIRY & INVESTIGTION Phylogenies & Tree-Thinking D VID. UM SUSN OFFNER character a trait or feature that varies among a set of taxa (e.g., hair color) character-state a variant of a character that occurs
Geo 302D: Age of Dinosaurs LAB 4: Systematics Part 1
 Geo 302D: Age of Dinosaurs LAB 4: Systematics Part 1 Systematics is the comparative study of biological diversity with the intent of determining the relationships between organisms. Humankind has always
COMPARING DNA SEQUENCES TO UNDERSTAND EVOLUTIONARY RELATIONSHIPS WITH BLAST
 Big Idea 1 Evolution INVESTIGATION 3 COMPARING DNA SEQUENCES TO UNDERSTAND EVOLUTIONARY RELATIONSHIPS WITH BLAST How can bioinformatics be used as a tool to determine evolutionary relationships and to
History of Lineages. Chapter 11. Jamie Oaks 1. April 11, Kincaid Hall 524. c 2007 Boris Kulikov boris-kulikov.blogspot.
 History of Lineages Chapter 11 Jamie Oaks 1 1 Kincaid Hall 524 joaks1@gmail.com April 11, 2014 c 2007 Boris Kulikov boris-kulikov.blogspot.com History of Lineages J. Oaks, University of Washington 1/46
Supporting Online Material
 Supporting Online Material Supporting Text: Rapprochement in dating the early branching of modern mammals It is important to distinguish the meaning of nodes in the tree (Fig. S1): successive branching
Species: Panthera pardus Genus: Panthera Family: Felidae Order: Carnivora Class: Mammalia Phylum: Chordata
 CHAPTER 6: PHYLOGENY AND THE TREE OF LIFE AP Biology 3 PHYLOGENY AND SYSTEMATICS Phylogeny - evolutionary history of a species or group of related species Systematics - analytical approach to understanding
Bi156 Lecture 1/13/12. Dog Genetics
 Bi156 Lecture 1/13/12 Dog Genetics The radiation of the family Canidae occurred about 100 million years ago. Dogs are most closely related to wolves, from which they diverged through domestication about
Representation, Visualization and Querying of Sea Turtle Migrations Using the MLPQ Constraint Database System
 Representation, Visualization and Querying of Sea Turtle Migrations Using the MLPQ Constraint Database System SEMERE WOLDEMARIAM and PETER Z. REVESZ Department of Computer Science and Engineering University
muscles (enhancing biting strength). Possible states: none, one, or two.
. Possible states: none, one, or two.") Reconstructing Evolutionary Relationships S-1 Practice Exercise: Phylogeny of Terrestrial Vertebrates In this example we will construct a phylogenetic hypothesis of the relationships between seven taxa
Reconstructing Evolutionary Relationships S-1 Practice Exercise: Phylogeny of Terrestrial Vertebrates In this example we will construct a phylogenetic hypothesis of the relationships between seven taxa
TOPIC CLADISTICS
 TOPIC 5.4 - CLADISTICS 5.4 A Clades & Cladograms https://upload.wikimedia.org/wikipedia/commons/thumb/4/46/clade-grade_ii.svg IB BIO 5.4 3 U1: A clade is a group of organisms that have evolved from a common
Subdomain Entry Vocabulary Modules Evaluation
 Subdomain Entry Vocabulary Modules Evaluation Technical Report Vivien Petras August 11, 2000 Abstract: Subdomain entry vocabulary modules represent a way to provide a more specialized retrieval vocabulary
COMPARING DNA SEQUENCES TO UNDERSTAND EVOLUTIONARY RELATIONSHIPS WITH BLAST
 COMPARING DNA SEQUENCES TO UNDERSTAND EVOLUTIONARY RELATIONSHIPS WITH BLAST In this laboratory investigation, you will use BLAST to compare several genes, and then use the information to construct a cladogram.
Comparing DNA Sequences Cladogram Practice
 Name Period Assignment # See lecture questions 75, 122-123, 127, 137 Comparing DNA Sequences Cladogram Practice BACKGROUND Between 1990 2003, scientists working on an international research project known
Introduction to Cladistic Analysis
 3.0 Copyright 2008 by Department of Integrative Biology, University of California-Berkeley Introduction to Cladistic Analysis tunicate lamprey Cladoselache trout lungfish frog four jaws swimbladder or
Patterns of heredity can be predicted.
 Page of 6 KEY CONCEPT Patterns of heredity can be predicted. BEFORE, you learned Genes are passed from parents to offspring Offspring inherit genes in predictable patterns NOW, you will learn How Punnett
Epigenetic regulation of Plasmodium falciparum clonally. variant gene expression during development in An. gambiae
 Epigenetic regulation of Plasmodium falciparum clonally variant gene expression during development in An. gambiae Elena Gómez-Díaz, Rakiswendé S. Yerbanga, Thierry Lefèvre, Anna Cohuet, M. Jordan Rowley,
The City School. Learn Create Program
 Learn Create Program What is Scratch? Scratch is a free programmable toolkit that enables kids to create their own games, animated stories, and interactive art share their creations with one another over
What are taxonomy, classification, and systematics?
 Topic 2: Comparative Method o Taxonomy, classification, systematics o Importance of phylogenies o A closer look at systematics o Some key concepts o Parts of a cladogram o Groups and characters o Homology
Ch 1.2 Determining How Species Are Related.notebook February 06, 2018
 Name 3 "Big Ideas" from our last notebook lecture: * * * 1 WDYR? Of the following organisms, which is the closest relative of the "Snowy Owl" (Bubo scandiacus)? a) barn owl (Tyto alba) b) saw whet owl
A SPATIAL ANALYSIS OF SEA TURTLE AND HUMAN INTERACTION IN KAHALU U BAY, HI. By Nathan D. Stewart
 A SPATIAL ANALYSIS OF SEA TURTLE AND HUMAN INTERACTION IN KAHALU U BAY, HI By Nathan D. Stewart USC/SSCI 586 Spring 2015 1. INTRODUCTION Currently, sea turtles are an endangered species. This project looks
Mendelian Genetics Using Drosophila melanogaster Biology 12, Investigation 1
 Mendelian Genetics Using Drosophila melanogaster Biology 12, Investigation 1 Learning the rules of inheritance is at the core of all biologists training. These rules allow geneticists to predict the patterns
UNIT III A. Descent with Modification(Ch19) B. Phylogeny (Ch20) C. Evolution of Populations (Ch21) D. Origin of Species or Speciation (Ch22)
 B. Phylogeny (Ch20) C. Evolution of Populations (Ch21) D. Origin of Species or Speciation (Ch22)") UNIT III A. Descent with Modification(Ch9) B. Phylogeny (Ch2) C. Evolution of Populations (Ch2) D. Origin of Species or Speciation (Ch22) Classification in broad term simply means putting things in classes
UNIT III A. Descent with Modification(Ch9) B. Phylogeny (Ch2) C. Evolution of Populations (Ch2) D. Origin of Species or Speciation (Ch22) Classification in broad term simply means putting things in classes
National Unit Specification: general information. UNIT Animal Care: Breeding (SCQF level 5) CODE F6SS 11 SUMMARY OUTCOMES RECOMMENDED ENTRY
 CODE F6SS 11 SUMMARY OUTCOMES RECOMMENDED ENTRY") National Unit Specification: general information CODE F6SS 11 SUMMARY The candidate will acquire and apply knowledge of the breeding of small animals. The Unit is aimed at those who wish to develop skills
National Unit Specification: general information CODE F6SS 11 SUMMARY The candidate will acquire and apply knowledge of the breeding of small animals. The Unit is aimed at those who wish to develop skills
Building Concepts: Mean as Fair Share
 Lesson Overview This lesson introduces students to mean as a way to describe the center of a set of data. Often called the average, the mean can also be visualized as leveling out the data in the sense
Your web browser (Safari 7) is out of date. For more security, comfort and the best experience on this site: Update your browser Ignore
 is out of date. For more security, comfort and the best experience on this site: Update your browser Ignore") Your web browser (Safari 7) is out of date. For more security, comfort and the best experience on this site: Update your browser Ignore Activitydevelop EXPLO RING VERTEBRATE CL ASSIFICATIO N What criteria
Your web browser (Safari 7) is out of date. For more security, comfort and the best experience on this site: Update your browser Ignore Activitydevelop EXPLO RING VERTEBRATE CL ASSIFICATIO N What criteria
Cladistics (reading and making of cladograms)
") Cladistics (reading and making of cladograms) Definitions Systematics The branch of biological sciences concerned with classifying organisms Taxon (pl: taxa) Any unit of biological diversity (eg. Animalia,
Cladistics (reading and making of cladograms) Definitions Systematics The branch of biological sciences concerned with classifying organisms Taxon (pl: taxa) Any unit of biological diversity (eg. Animalia,
Comparing DNA Sequences to Understand Evolutionary Relationships with BLAST
 Comparing DNA Sequences to Understand Evolutionary Relationships with BLAST INVESTIGATION 3 BIG IDEA 1 Lab Investigation 3: BLAST Pre-Lab Essential Question: How can bioinformatics be used as a tool to
Evolution in dogs. Megan Elmore CS374 11/16/2010. (thanks to Dan Newburger for many slides' content)
") Evolution in dogs Megan Elmore CS374 11/16/2010 (thanks to Dan Newburger for many slides' content) Papers for today Vonholdt BM et al (2010). Genome-wide SNP and haplotype analyses reveal a rich history
Evolution in dogs Megan Elmore CS374 11/16/2010 (thanks to Dan Newburger for many slides' content) Papers for today Vonholdt BM et al (2010). Genome-wide SNP and haplotype analyses reveal a rich history
1 EEB 2245/2245W Spring 2014: exercises working with phylogenetic trees and characters
 1 EEB 2245/2245W Spring 2014: exercises working with phylogenetic trees and characters 1. Answer questions a through i below using the tree provided below. a. The sister group of J. K b. The sister group
ALL ENTRIES MUST BE DONE ONLINE NO PAPER ENTRIES WILL BE ACCEPTED RABBITS & CAVIES - Department 17
 ALL ENTRIES MUST BE DONE ONLINE NO PAPER ENTRIES WILL BE ACCEPTED RABBITS & CAVIES - Department 17 CLASS CHANGES Superintendent: Richard Hare Phone: Agriculture Office 716-649-3900 Ext. 6480 or 6488 ARBA
Muppet Genetics Lab. Due: Introduction
 Name: Block: Muppet Genetics Lab Due: _ Introduction Much is known about the genetics of Sesamus muppetis. Karyotyping reveals that Sesame Street characters have eight chromosomes: three homologous pairs
The melanocortin 1 receptor (mc1r) is a gene that has been implicated in the wide
 is a gene that has been implicated in the wide") Introduction The melanocortin 1 receptor (mc1r) is a gene that has been implicated in the wide variety of colors that exist in nature. It is responsible for hair and skin color in humans and the various
Introduction The melanocortin 1 receptor (mc1r) is a gene that has been implicated in the wide variety of colors that exist in nature. It is responsible for hair and skin color in humans and the various
A Column Generation Algorithm to Solve a Synchronized Log-Truck Scheduling Problem
 A Column Generation Algorithm to Solve a Synchronized Log-Truck Scheduling Problem Odysseus 2012 Greg Rix 12 Louis-Martin Rousseau 12 Gilles Pesant 13 1 Interuniversity Research Centre on Enterprise Networks,
Machine Learning.! A completely different way to have an. agent acquire the appropriate abilities to solve a particular goal is via machine learning.
 Machine Learning! A completely different way to have an agent acquire the appropriate abilities to solve a particular goal is via machine learning. Machine Learning! What is Machine Learning? " Programs
Effective Vaccine Management Initiative
 Effective Vaccine Management Initiative Background Version v1.7 Sep.2010 Effective Vaccine Management Initiative EVM setting a standard for the vaccine supply chain Contents 1. Background...3 2. VMA and
If you take the time to follow the directions below, you will be able to solve most genetics problems.
 Genetics Worksheet Part 1 Introduction: 1. Describe the genotypes given (use your notes). The first two are already done. A. DD homozygous, dominant D. ss B. Dd _heterozygous E. Yy C. dd F. WW 2. In humans,
Section: 101 (2pm-3pm) 102 (3pm-4pm)
 102 (3pm-4pm)") Stat 20 Midterm Exam Instructor: Tessa Childers-Day 12 July 2012 Please write your name and student ID below, and circle your section With your signature, you certify that you have not observed poor or
Stat 20 Midterm Exam Instructor: Tessa Childers-Day 12 July 2012 Please write your name and student ID below, and circle your section With your signature, you certify that you have not observed poor or
INHERITANCE OF BODY WEIGHT IN DOMESTIC FOWL. Single Comb White Leghorn breeds of fowl and in their hybrids.
 440 GENETICS: N. F. WATERS PROC. N. A. S. and genetical behavior of this form is not incompatible with the segmental interchange theory of circle formation in Oenothera. Summary.-It is impossible for the
Mendelian Genetics SI
 Name Mendelian Genetics SI Date 1. In sheep, eye color is controlled by a single gene with two alleles. When a homozygous brown-eyed sheep is crossed with a homozygous green-eyed sheep, blue-eyed offspring
Identity Management with Petname Systems. Md. Sadek Ferdous 28th May, 2009
 Identity Management with Petname Systems Md. Sadek Ferdous 28th May, 2009 Overview Entity, Identity, Identity Management History and Rationales Components and Properties Application Domain of Petname Systems
Your web browser (Safari 7) is out of date. For more security, comfort and the best experience on this site: Update your browser Ignore
 is out of date. For more security, comfort and the best experience on this site: Update your browser Ignore") Your web browser (Safari 7) is out of date. For more security, comfort and the best experience on this site: Update your browser Ignore Activityapply ADAPTIVE RADIATIO N How do species respond to environmental
Your web browser (Safari 7) is out of date. For more security, comfort and the best experience on this site: Update your browser Ignore Activityapply ADAPTIVE RADIATIO N How do species respond to environmental
Title: Phylogenetic Methods and Vertebrate Phylogeny
 Title: Phylogenetic Methods and Vertebrate Phylogeny Central Question: How can evolutionary relationships be determined objectively? Sub-questions: 1. What affect does the selection of the outgroup have
GEODIS 2.0 DOCUMENTATION
 GEODIS.0 DOCUMENTATION 1999-000 David Posada and Alan Templeton Contact: David Posada, Department of Zoology, 574 WIDB, Provo, UT 8460-555, USA Fax: (801) 78 74 e-mail: dp47@email.byu.edu 1. INTRODUCTION
Fig Phylogeny & Systematics
 Fig. 26- Phylogeny & Systematics Tree of Life phylogenetic relationship for 3 clades (http://evolution.berkeley.edu Fig. 26-2 Phylogenetic tree Figure 26.3 Taxonomy Taxon Carolus Linnaeus Species: Panthera
Evaluating the quality of evidence from a network meta-analysis
 Evaluating the quality of evidence from a network meta-analysis Julian Higgins 1 with Cinzia Del Giovane, Anna Chaimani 3, Deborah Caldwell 1, Georgia Salanti 3 1 School of Social and Community Medicine,
Phenotype Observed Expected (O-E) 2 (O-E) 2 /E dotted yellow solid yellow dotted blue solid blue
 2 (O-E) 2 /E dotted yellow solid yellow dotted blue solid blue") 1. (30 pts) A tropical fish breeder for the local pet store is interested in creating a new type of fancy tropical fish. She observes consistent patterns of inheritance for the following traits: P 1 :
1. (30 pts) A tropical fish breeder for the local pet store is interested in creating a new type of fancy tropical fish. She observes consistent patterns of inheritance for the following traits: P 1 :
Different versions of a single gene are called allleles, and one can be dominant over the other(s).
.") Answer KEY 1 Different versions of a single gene are called allleles, and one can be dominant over the other(s). 2 Describe genotype and phenotype in your own words. A genotype is the genetic makeup of
Answer KEY 1 Different versions of a single gene are called allleles, and one can be dominant over the other(s). 2 Describe genotype and phenotype in your own words. A genotype is the genetic makeup of
Workbook. Version 3. Created by G. Mullin and D. Carty
 Workbook Version 3 Created by G. Mullin and D. Carty Introduction... 3 Task 1. Load Scratch... 3 Task 2. Get familiar with the Scratch Interface... 3 Task 3. Changing the name of a Sprite... 5 Task 4.
Plating the PANAMAs of the Fourth Panama Carmine Narrow-Bar Stamps of the C.Z. Third Series
 Plating the PANAMAs of the Fourth Panama Carmine Narrow-Bar Stamps of the C.Z. Third Series by Geoffrey Brewster The purpose of this work is to facilitate the plating of CZSG Nos. 12.Aa, 12.Ab, 13.A, 14.Aa,
Background and Plan of Analysis
 ENTEROCOCCI Background and Plan of Analysis UR-11 (2017) was sent to API participants as a simulated urine culture for recognition of a significant pathogen colony count, to perform the identification
These small issues are easily addressed by small changes in wording, and should in no way delay publication of this first- rate paper.
 Reviewers' comments: Reviewer #1 (Remarks to the Author): This paper reports on a highly significant discovery and associated analysis that are likely to be of broad interest to the scientific community.
Bioinformatics: Investigating Molecular/Biochemical Evidence for Evolution
 Bioinformatics: Investigating Molecular/Biochemical Evidence for Evolution Background How does an evolutionary biologist decide how closely related two different species are? The simplest way is to compare
Effective Vaccine Management (EVM) Global Data Analysis
 Global Data Analysis") Effective Vaccine Management (EVM) Global Data Analysis 2009-2014 EVM setting a standard for the vaccine supply chain Update: WHO EVM database, December 2015 1 The Effective Vaccine Management (EVM) Assessmentg
Effective Vaccine Management (EVM) Global Data Analysis 2009-2014 EVM setting a standard for the vaccine supply chain Update: WHO EVM database, December 2015 1 The Effective Vaccine Management (EVM) Assessmentg
Basic Terminology and Eyeband Colors
 Color Genetics of the Dwarf Hotot Amy Hinkle, M.S. Printed in the 2011 ADHRC Guidebook, Free to use and distribute WITH ATTRIBUTION: Hinkle, Amy. "Color Genetics of the Dwarf Hotot." American Dwarf Hotot
Let s Build a Cladogram!
 Name Let s Build a Cladogram! Date Introduction: Cladistics is one of the newest trends in the modern classification of organisms. This method shows the relationship between different organisms based on
Approximating the position of a hidden agent in a graph
 Approximating the position of a hidden agent in a graph Hannah Guggiari, Alexander Roberts, Alex Scott May 13, 018 Abstract A cat and mouse play a pursuit and evasion game on a connected graph G with n
Testing Phylogenetic Hypotheses with Molecular Data 1
 Testing Phylogenetic Hypotheses with Molecular Data 1 How does an evolutionary biologist quantify the timing and pathways for diversification (speciation)? If we observe diversification today, the processes
Biology 201 (Genetics) Exam #1 120 points 22 September 2006
 Exam #1 120 points 22 September 2006") Name KEY Section Biology 201 (Genetics) Exam #1 120 points 22 September 2006 Read the question carefully before answering. Think before you write. You will have up to 50 minutes to take this exam. After
Name KEY Section Biology 201 (Genetics) Exam #1 120 points 22 September 2006 Read the question carefully before answering. Think before you write. You will have up to 50 minutes to take this exam. After
HTML COLOUR CODE CHART
 HTML COLOUR CODE CHART COLOR NAME CODE COLOR Black #000000 Black Gray0 #150517 Gray0 Gray18 #250517 Gray18 Gray21 #2B1B17 Gray21 Gray23 #302217 Gray23 Gray24 #302226 Gray24 Gray25 #342826 Gray25 Gray26
LINKAGE OF ALBINO ALLELOMORPHS IN RATS AND MICE'
 LINKAGE OF ALBINO ALLELOMORPHS IN RATS AND MICE' HORACE W. FELDMAN Bussey Inslitutim, Harvard Univwsity, Forest Hills, Boston, Massachusetts Received June 4, 1924 Present concepts of some phenomena of
Bio 1B Lecture Outline (please print and bring along) Fall, 2006
 Fall, 2006") Bio 1B Lecture Outline (please print and bring along) Fall, 2006 B.D. Mishler, Dept. of Integrative Biology 2-6810, bmishler@berkeley.edu Evolution lecture #4 -- Phylogenetic Analysis (Cladistics) -- Oct.
Bio 1B Lecture Outline (please print and bring along) Fall, 2006 B.D. Mishler, Dept. of Integrative Biology 2-6810, bmishler@berkeley.edu Evolution lecture #4 -- Phylogenetic Analysis (Cladistics) -- Oct.
Controllability of Complex Networks. Yang-Yu Liu, Jean-Jacques Slotine, Albert-Laszlo Barbasi Presented By Arindam Bhattacharya
 Controllability of Complex Networks Yang-Yu Liu, Jean-Jacques Slotine, Albert-Laszlo Barbasi Presented By Arindam Bhattacharya Index Overview Network Controllability Controllability of real networks An
Inferring Ancestor-Descendant Relationships in the Fossil Record
 Inferring Ancestor-Descendant Relationships in the Fossil Record (With Statistics) David Bapst, Melanie Hopkins, April Wright, Nick Matzke & Graeme Lloyd GSA 2016 T151 Wednesday Sept 28 th, 9:15 AM Feel
Name: Period: Student Exploration: Mouse Genetics (One Trait)
") Directions: 1) Go to Explorelearning.com; 2) Login using your assigned user name and password. USER NAME: 1C772 PASSWORD: RAIN515 3) Find the MOUSE GENETICS ONE TRAIT Gizmo and click Launch Gizmo Name:
Directions: 1) Go to Explorelearning.com; 2) Login using your assigned user name and password. USER NAME: 1C772 PASSWORD: RAIN515 3) Find the MOUSE GENETICS ONE TRAIT Gizmo and click Launch Gizmo Name:
Multiclass and Multi-label Classification
 Multiclass and Multi-label Classification INFO-4604, Applied Machine Learning University of Colorado Boulder September 21, 2017 Prof. Michael Paul Today Beyond binary classification All classifiers we
Inheritance of Livershunt in Irish Wolfhounds By Maura Lyons PhD
 Inheritance of Livershunt in Irish Wolfhounds By Maura Lyons PhD Glossary Gene = A piece of DNA that provides the 'recipe' for an enzyme or a protein. Gene locus = The position of a gene on a chromosome.
UK HOUSE MARTIN SURVEY 2015
 UK HOUSE MARTIN SURVEY 2015 FULL INSTRUCTIONS A one-page summary of these instructions is available from www.bto.org/house-martin-resources SECTION 1: INTRODUCTION & GETTING STARTED The House Martin (Delichon
In the first half of the 20th century, Dr. Guido Fanconi published detailed clinical descriptions of several heritable human diseases.
 In the first half of the 20th century, Dr. Guido Fanconi published detailed clinical descriptions of several heritable human diseases. Two disease syndromes were named after him: Fanconi Anemia and Fanconi
Econometric Analysis Dr. Sobel
 Econometric Analysis Dr. Sobel Econometrics Session 1: 1. Building a data set Which software - usually best to use Microsoft Excel (XLS format) but CSV is also okay Variable names (first row only, 15 character
Biology 164 Laboratory
 Biology 164 Laboratory CATLAB: Computer Model for Inheritance of Coat and Tail Characteristics in Domestic Cats (Based on simulation developed by Judith Kinnear, University of Sydney, NSW, Australia) Introduction
Comparing DNA Sequence to Understand
 Comparing DNA Sequence to Understand Evolutionary Relationships with BLAST Name: Big Idea 1: Evolution Pre-Reading In order to understand the purposes and learning objectives of this investigation, you
Re: Sample ID: Letzty [ ref:_00di0ijjl._500i06g6gf:ref ] 1 message
![Re: Sample ID: Letzty [ ref:_00di0ijjl._500i06g6gf:ref ] 1 message](/thumbs/83/88920145.jpg "Re: Sample ID: Letzty [ ref:_00di0ijjl._500i06g6gf:ref ] 1 message") Geoffrey Marsh Re: Sample ID: 3503305 - Letzty [ ref:_00di0ijjl._500i06g6gf:ref ] 1 message Customer Care Support Email To: "gdotmarsh@gmail.com"
Geoffrey Marsh Re: Sample ID: 3503305 - Letzty [ ref:_00di0ijjl._500i06g6gf:ref ] 1 message Customer Care Support Email To: "gdotmarsh@gmail.com"
Comparison of different methods to validate a dataset with producer-recorded health events
 Miglior et al. Comparison of different methods to validate a dataset with producer-recorded health events F. Miglior 1,, A. Koeck 3, D. F. Kelton 4 and F. S. Schenkel 3 1 Guelph Food Research Centre, Agriculture
NOR association in Canis familiaris
 NOR association in Canis familiaris M Rønne, BS Poulsen, Y Shibasaki Odense University, Institute of Medical Biology, Department of Anatomy and Cytology, Campusvej 55, DK-5230 Odense M, Denmark (Proceedings
HEREDITARY STUDENT PACKET # 5
 HEREDITARY STUDENT PACKET # 5 Name: Date: Big Idea 16: Heredity and Reproduction Benchmark: SC.7.L.16.1: Understand and explain that every organism requires a set of instructions that specifies its traits,
Analysis of CR1 repeats in the zebra finch genome
 Analysis of CR1 repeats in the zebra finch genome George E. Liu, Yali Hou* and Twain Brown Bovine Functional Genomics Laboratory, ANRI, ARS, USDA, Beltsville, Maryland 20705, USA *Also affiliated with
Pet Selective Automated Food Dispenser
 Pet Selective Automated Food Dispenser By Advika Battini Ali Yaqoob Vibhu Vanjari TA: Yuchen He Team Number: 46 Proposal for ECE 445, Senior Design, Spring 2018, University of Illinois Urbana Champaign
Release note Chesar 3 (and migration tool)
") 14/06/2016 Release note Chesar 3 (and migration tool) Contents 1. KNOWN ISSUES... 2 1.1. HELPTEXT... 2 1.2. IMPORT FROM IUCLID... 2 1.3. EXPOSURE ASSESSMENT WORKERS... 2 1.4. ENVIRONMENTAL ASSESSMENT...
14/06/2016 Release note Chesar 3 (and migration tool) Contents 1. KNOWN ISSUES... 2 1.1. HELPTEXT... 2 1.2. IMPORT FROM IUCLID... 2 1.3. EXPOSURE ASSESSMENT WORKERS... 2 1.4. ENVIRONMENTAL ASSESSMENT...
Optimizing Phylogenetic Supertrees Using Answer Set Programming
 Optimizing Phylogenetic Supertrees Using Answer Set Programming Laura Koponen 1, Emilia Oikarinen 1, Tomi Janhunen 1, and Laura Säilä 2 1 HIIT / Dept. Computer Science, Aalto University 2 Dept. Geosciences
Response to SERO sea turtle density analysis from 2007 aerial surveys of the eastern Gulf of Mexico: June 9, 2009
 Response to SERO sea turtle density analysis from 27 aerial surveys of the eastern Gulf of Mexico: June 9, 29 Lance P. Garrison Protected Species and Biodiversity Division Southeast Fisheries Science Center
Systematics, Taxonomy and Conservation. Part I: Build a phylogenetic tree Part II: Apply a phylogenetic tree to a conservation problem
 Systematics, Taxonomy and Conservation Part I: Build a phylogenetic tree Part II: Apply a phylogenetic tree to a conservation problem What is expected of you? Part I: develop and print the cladogram there
Department 7 Poultry Project Number 20501, 20502, 20503, 20504, 20505, 20506, Superintendents: Keith Schardt, Debbie Krueger
 Department 7 Poultry Project Number 20501, 20502, 20503, 20504, 20505, 20506, 20507 Superintendents: Keith Schardt, Debbie Krueger Entry Day 1 p.m. 8 p.m. Thursday of the fair. Entry tags must be attached
Darwin and the Family Tree of Animals
 Darwin and the Family Tree of Animals Note: These links do not work. Use the links within the outline to access the images in the popup windows. This text is the same as the scrolling text in the popup
Implementation and Estimation of Delay, Power and Area for Parallel Prefix Adders
 International Journal for Modern Trends in Science and Technology Volume: 02, Issue No: 11, November 2016 http://www.ijmtst.com ISSN: 2455-3778 Implementation and Estimation of Delay, Power and Area for
Informed search algorithms
 Revised by Hankui Zhuo, March 12, 2018 Informed search algorithms Chapter 4 Chapter 4 1 Outline Best-first search A search Heuristics Hill-climbing Simulated annealing Genetic algorithms (briefly) Local
Effective Vaccine Management (EVM) Global Data Analysis
 Global Data Analysis") Effective Vaccine Management (EVM) Global Data Analysis 2010-2013 EVM setting a standard for the vaccine supply chain Update: WHO EVM database, December 2014 1 The Effective Vaccine Management (EVM) Assessmentg
Effective Vaccine Management (EVM) Global Data Analysis 2010-2013 EVM setting a standard for the vaccine supply chain Update: WHO EVM database, December 2014 1 The Effective Vaccine Management (EVM) Assessmentg
Genetics Lab #4: Review of Mendelian Genetics
 Genetics Lab #4: Review of Mendelian Genetics Objectives In today s lab you will explore some of the simpler principles of Mendelian genetics using a computer program called CATLAB. By the end of this
1. For each genotype, indicate whether it is heterozygous (HE) or homozygous (HO) Ii Jj kk Ll
 or homozygous (HO) Ii Jj kk Ll") Simple Genetics Practice Problems 1. For each genotype, indicate whether it is heterozygous (HE) or homozygous (HO) AA Bb Cc Dd Ee ff GG HH Ii Jj kk Ll Mm nn OO Pp 2. For each of the genotypes below, determine
Simple Genetics Practice Problems 1. For each genotype, indicate whether it is heterozygous (HE) or homozygous (HO) AA Bb Cc Dd Ee ff GG HH Ii Jj kk Ll Mm nn OO Pp 2. For each of the genotypes below, determine
Management. of genetic variation in local breeds. Asko Mäki-Tanila. Reykjavik 30/4/2009. Embryocentre Ltd
 Management Embryocentre Ltd of genetic variation in local breeds Asko Mäki-Tanila Reykjavik 30/4/2009 based on collaboration with T Meuwissen, J Fernandez and M Toro within EURECA project Approach in two
Mexican Gray Wolf Reintroduction
 Mexican Gray Wolf Reintroduction New Mexico Supercomputing Challenge Final Report April 2, 2014 Team Number 24 Centennial High School Team Members: Andrew Phillips Teacher: Ms. Hagaman Project Mentor:
Nathan A. Thompson, Ph.D. Adjunct Faculty, University of Cincinnati Vice President, Assessment Systems Corporation
 An Introduction to Computerized Adaptive Testing Nathan A. Thompson, Ph.D. Adjunct Faculty, University of Cincinnati Vice President, Assessment Systems Corporation Welcome! CAT: tests that adapt to each