Copyright is owned by the Author of the thesis. Permission is given for a copy to be downloaded by an individual for the purpose of research and
|
|
|
- Elizabeth Lawson
- 6 years ago
- Views:
Transcription
1 Copyright is owned by the Author of the thesis. Permission is given for a copy to be downloaded by an individual for the purpose of research and private study only. The thesis may not be reproduced elsewhere without the permission of the Author.
2 I Epidemiology of coccidiosis in calves and control of coccidiosis using toltazuril at the time of weaning. This thesis is presented in partial fulfilment of the requirements for the degree of Master of Philosophy in Veterinary Parasitology at Massey University, Palmerston North, New Zealand. Mary Jones Gaddam 25
3 I Abstract: Two separate studies were conducted to investigate the impact of coccidiosis in young calves. In one study calves were reared to weaning (1 OOkg liveweight) by feeding meal with or without monensin added. The oocyst counts were low in both groups up to weaning and there was no statistically significant (p<.5) improvement in terms of body weight or a decline in oocyst counts in the monensintreated group At weaning a single dose of toltrazuril (2mg/kg) was given to half the calves in both groups. A similar treatment regime was given in a second study where calves had been raised to weaning by commercial calf rearers. Half of these were treated with toltrazuril (2mg/kg) and half not. In both studies there was a statistically significant (p<.1 ) reduction in oocyst counts in treated calves which remained very low for 45 weeks post treatment. The treatment also significantly increased (p<.1) weight gains in treated calves by 35kgs at 56 weeks post treatment. The coccidial status of other calves on a variety of farms were also monitored including a group of organic beef farms. High oocyst counts were noted on occasions where calves were not on anticoccidial treatment. Low oocyst counts were noted in adult cows where they were examined. The two most prevalent species overall were Eimeria zuernii (95%) and E. bovis (87%) followed by E. auburnensis (62%), E. cylindrica (42%), E. canadensis (3 1 %), E. wyomingensis (23%), E. bukidnonensis (36%), E. ellipsoidalis (24 %) E. a/abamensis (12%), E. brasiliensis (1 2%), and E. subspherica (27%). The most predominant species, measured as the most numerous oocysts overall, were E. bovis (31 %) followed by E. zuernii (27%), E. auburnensis (13%), E. bukidnonensis (7%), E. cylindrica (6%), E. wyomingensis (5.3%), E. canadensis (4.4%), E. ellipsoidalis (3.3%), E. brasiliensis (1.9%), E. subspherica (1.5%), and E. alabamensis (1 %). The most prevalent species were also the most pathogenic species. On many occasions calves were infected with more than one species, sometimes as many as 56 Eimeria species. A redescription of the 11 species of Eimeria in cattle identified from New Zealand Farms was made.
4 Acknowledgements From the inner depths of my heart I give all glory and praises to the god almighty for this work has been accomplished by his ever lasting mercy and abundant compassion. I take this opportunity to extend my deep sense of gratitude to my supervisor Dr. Bill Pomroy, Associate Professor, IVABS, Massey University, for his academic guidance interns of constructive criticism, valuable suggestions, patience and inspiration of ideas in bringing the thesis into a final shape. I am immensely grateful to Gosupervisor, Dr. fan Scott, Senior Lecturer, Parasitology, IVABS, Massey University for his valuable suggestions, and support given in prosecution of these studies. I am pleased to record my sincere thanks to, Professor Keith Thompson, Pathobiology, IVABS, Massey for his encouragement to join this programme. lt gives me pleasure to acknowledge the elderly guidance and love given by Assistant professor Maurice Alley and wife Dorothy, and Senior Lecturer Mark G Collett and wife Jenny Collett. I take it as a privilege to express my heartfelt thanks to Dr. Nicolas Lopez Villalobos, Statistician, IVABS, and Massey for timely help in analysis of data. Sincere thanks are due to technicians Barbara Adlington, Anne Tunnicliffe and Dianne Knight who created pleasant friendly atmosphere in the lab and their prompt help every time. Special thanks to Brian Devantier AgResearch, who helped in procuring samples from organic farms. I wish to place on my record my feelings, heartfelt affection to my friends and well wishers Chioma, Kalyani, Rao & Ka vitha,angraj&lavanya,ravi& V alii, Sushanthi & Arun, Ruth, Sharma, Dipti, Lyla, Quais, Jerusha & Kiran, Satya, Yi, Martin, Stuart, Mike, Pat, Evelyn and friends from church Edith, Ramsay, Kerry for their encouragement given to me. I hereby acknowledge my sister Myna and Willy and daughter Kiwiana for their affection and help. I heartly express my earnest gratitude to my beloved Husband Jacob, parents and my daughters Annie, Jhansi and Margarette for their lasting love, care and who have constantly been a great source of encouragement in my life. At last it will be incomplete if I say no thanks to Purchasing officer Peter Wildbore and computer staff Quentin, Andrew, and Andrea for their help. The financial support provided through FRST by the Department of education, New Zealand and Bayer's Ud is greatly acknowledged. I thank ONE and ALL that made their contribution for my research work.
5 IJ LIST OF CONTENTS ABSTRACT:... ACKNOWLEDGEMENTS... I LIST OF CONTENTS LIST OF TABLES... VIII LIST OF FIGURES... X LIST OF PLATES... XII ABREVIATIONS... XIV CHAPTER 1: REVIEW OF LITERATURE Introduction: Taxonomy: Life cycle of Eimeria: Asexual cycle: Sexual generation: Sporulation: Factors affecting the life cycle of Eimeria species: Pathogenicity: Faecal consistency and oocyst numbers: Environmental factors: : Rate of sporulation and survival of oocyst: Hygiene: Stress: Animal Factors : Adult cattle serve as a source of infection: Age and immune status of calves: Control of coccidiosis: Anticoccidial Drugs: Sulpha drugs: lonophores: Monensin: Toltrazuril: Single dose treatment of toltrazuril: Toltrazuril treatment and immunity: Toltrazuril and weight gains: Immunity to coccidia: Role of maternal antibodies : Role of sexual stages in development of immunity: Immunity to E. bovis: Dose of inoculum: Immunity to other species: E. zuernii: a. Site of immune reaction: b. Immune mechanism: Duration of immunity: Cell mediated immunity: Components of humoral immunity: Estimation of immunity: a. Neutralization and precipitation test: b. Indirect Immunofluorescent Antibody test (IFAT): I
6 c. ELISA: d. Western blotting: Western blotting using E. bovis: Tissue culture: Prevalence of Eimeria species in cattle: Age prevalence: The effect of climate on the disease prevalence: World wide prevalence: Prevalence in New Zealand: Multiple species in one sample: Species Descriptions: Eimeria species without micropylar cap: a. Eimeria subspherica: b. Eimeria ellipsoidalis: c. Eimeria zuernii (Rivolta 1878) Martin, d. Eimeria cylindricawilson, 1961 : e. Eimeria alabamensis: Eimeria species with micropylar cap: a. Eimeria bovis: b. Eimeria canadensis: c. Eimeria auburnensis (Christensen and Porter, 1939): d. Eimeria bukidnonensis: e. Eimeria wyomingensis (Huizinga and Winger, 1942): f. Eimeria brasiliensis: Cryptosporidium: CHAPTER 2: IDENTIFICATION OF EIMERIA SPECIES IN SEVERAL STUDIES AND A REDESCRIPTION OF THEIR OOCYST MORPHOLOGY Results: Prevalence and predominance of species identified at Massey No.4 Farm Prevalence and predominance of Eimeria species identified at Tuapaka Farm (See Chapter 4): Prevalence and Predominance of Species identified in studies on other farms (see Chapter 5): Prevalence and Predominance over the 3 studies Species Description: E. alabamensis, Christensen, E. auburnensis, Christensen and Porter, E. bovis: (Zublin, 198), Fiebiger, E. brasiliensis: Torres and Ramos, E. bukidnonensis, Tabangui, E. canadensis, Bruce, E. cylindrica, Wilson, E. ellipsoidalis, Becker, Frye, E. subspherica, Christensen, E. wyomingensis, Huizinga and Winger, E. zuernii, (Rivolta, 1878) Martin, CHAPTER 3. STUDY AT MASSEY NUMBER 4 DAIRY FARM Introduction: Materials and Methods: Paddock preparation and sub division:... 7 m
7 Husbandry practices : Sample collection: Examination of individual samples: Statistical analysis: Faecal oocyst counts: Live weight: Combined effect of two anticoccidial treatments on oocyst counts up to weaning: Results:.. : Oocyst counts up to weaning: Oocyst counts after weaning : Live weight of the calves up to weaning: Live weights after weaning: Cryptosporidium and Giardia results: Discussion: CHAPTER 4: EXPERIMENT AT TUAPAKA : Introduction: Materials and Methods: Farm and Animals Experimental Schedule: Oocyst counts: Species prevalence: Faecal consistency: Statistical analysis of faecal oocyst counts: Statistical analysis of Live Weights: Statistical analysis of faecal consistency: Results Faecal oocyst counts: Liveweights of calves: Faecal consistency and oocyst counts: Discussion: CHAPTER 5: STUDY OF COCCIDIOSIS AND OOCYST SHEDDING ON VARIOUS BEEF FARMS Introduction: Materials and methods: Massey University calves: Organic Beef Farms Commercial Calf Rearers and Farmers: : Statistical Analysis: Prevalence and species identification: Results: Massey University Farm: Study of Organic Beef Farms: Commercial Calf Rearers and Farmers : (a) Apiti commercial calf rearer: (b) Stafford commercial farm: (c) Alley commercial farm: Prevalence Species identified on other farms: Discussion: Conclusions: CHAPTER 6: WESTERN BLOTTING: IV
8 6.1. Introduction: Materials and methods: Parasites: Production of parasite antigens: French press: Vortexing with glass beads: Freezing and thawing: Combination of vortexing with glass beads, freezing and thawing, and sonication: Tissue culturing: Western Blotting: Results: French press cell: Vortexing with glass beads: Freeze thaw Combination of Vortexing, freeze thawing, and sonication Tissue culturing: Discussion: CHAPTER 7: FINAL DISCUSSION : Pattern of oocyst shedding and monensin treatment: Weight up to Weaning: Single oral treatment at weaning and oocyst shedding after treatment: Weight gain with toltrazuril: Stress around weaning: Management on farm : Prevalence and Predominance of Eimeria species: Western Blotting: V
9 LIST OF APPENDICES Appendix Oocyst Counts: Appendix Method Of Identification Of Species: Appendix Table Showing Multiple Species Present In Calves: Note: Numbers Followed By T Are Animal No.S Appendix Species Measurements : Note: L=Length, W=Width, R= Ratio Of L /W Appendix Oocysts Identified To Species From The Study On Massey University No. 4 Dairy Farm Appendix Oocyst Identification From Calves From Tuapaka Farm. In Total 23 Faecal Samples Were Examined Appendix 3.1. Calf Treatment : Appendix 3.1.A. Calf Performance 2% Pellets Appendix 3.1. B. Baycox (Toltrazuril) Specifications: Appendix 3.2. Feeding Schedule Of The Calves Appendix 3.3. Sops: Appendix ocyst Counting: Appendix Separation Of Oocysts For Sporulation For Samples > 1 Opg: Appendix Recovery Of Sporulated Oocysts: Appendix Staining Of Cryptosporidium Oocysts By A Modified Zeihl Neilson Technique: Appendix Merifluor (Meridian Diagnostics) Cryptosporidium/ Giardia, Direct Immunofluorescent Detection Procedure For The Simultaneous Detection Of Cryptosporidium Oocysts And Giardia Cysts In Faecal Material Appendix Oocyst Counts Up To Weaning: Appendix Weekly Average Oocyst Counts Of Calves Up To Weaning (Group Wise): Appendix Statistical Analysis For Group Wise Oocyst Counts Up To Weaning : Appendix Oocyst Counts Up To Weaning (Treatment Wise): Appendix Oocyst Counts After Weaning Showing The Status Of Two (AntiCoccidials Treatment): Appendix Weekly Average Weights After Weaning Appendix 3.5.3: Statistical Analysis Of Oocyst Counts After Weaning: Appendix Statistical Analysis Of Oocyst Counts With Two Anti Coccidials: Appendix Live Weights Of Individual Calves Up To Weaning (Group Wise): Appendix Group Mean Weekly Live Weights Up To Weaning: VI
10 Appendix Statistical Analysis Of Live Weights Up To Weaning (Treatment Wise): Appendix Statistical Analysis Of Weight Group Wise Up To Weaning :.178 Appendix Weight Of Calves After Weaning: Appendix Weekly Average Weights After Weaning Appendix Statistical Analysis Adjusted Live Weights: Appendix 3.7. Comparison Of Monensin Concentration Of Feed Actually Recquired (1 /Kg Feed) And Supplied Based On The Weekly Average Weights Of The Animals Appendix : Oocysts Counts Of Calves: Be Means Treated With Toltrazuril And Nbc Means Not Treated With Toltrazuril Appendix Statistical Analysis Of Oocyst Counts: Appendix Live Weights Of Calves: Appendix Average Weekly Weight Of Calves: Appendix Statistical Analysis Of Liveweights: Appendix Live Weights Of Calves Treated With Toltrazuril At Weaning : Appendix Average Weekly Weight Of Calves: Appendix Statistical Analysis Of Live Weights: Appendix 4.3. Faecal Consistency And Oocyst Counts: Appendix 4.4.Statistical Analysis Of Faecal Consistency:... 2 Appendix. 5.1 : Oocyst Counts From Ballantrae Hill Country Research Station Appendix 5.2: Table Showing The Details Of Combined No Chemicals (Nc1 +Nc2 And Combined Conventional (Co1 +Co2) Of Calves And Dams At Ball antrae: Appendix 5.3: Statistical Analysis Of Ballantrae Farm: Appendix 6.1. Cleaning Of Oocysts: Appendix 6.2. Vortexing: Appendix 6.3.Western Blotting: Appendix 6.4.Tissue Culture Technique For Eimeria REFERENCES: vn
11 vm LIST OF TABLES 1.5. Factors influencing the epidemiology:... 9 Table1.1 : Life cycle of different bovine Eimeria species: Note: LG=Iow Grade, HG= High Grade, PP= Prepatent Period Table 1.2: A summary of some experiments investigating the pathophysiology of different bovine Eimeria species: Table 1.3 : Summary of trials where monensin has been used to control coccidia Table 1.4: Summary of various reports on the development of immunity to E. bovis Table 1.5: summary of various reports on the Percent prevalence of bovine Eimeria species Table 1.6: Morphological characteristics of oocysts of Eimeria species of cattle. Range L=length, W=width range, mean of length x width, Shape index =ratio of length and width, N= Number of oocysts measured Table 4. 1: Type 3 tests of fixed effects of time series analysis for oocyst counts for calves from Group A and B treated or not treated at weaning with toltrazuril. Week = week of experiment, Treat = toltrazuril treatment and Group = Group A or B Table 4. 2: The repeated analysis variance of live weights of calves adjusted for initial liveweight (liveweight week ) showing the effect of treatment with toltrazuril ('treat"), "group" (Group A and Group B), time by week post treatment ("week") and the interaction of group, treatment and week ("group*treat*week) on the live weight Figure 4. 6: Comparison of arithmetic mean live weights of Group A calves either treated with toltrazuril at weaning (AT) or not treated with toltrazuril (ANT). Each group comprised 15 animals Table 4. 3: Faecal consistency and the oocyst counts of the calves Table 4. 4: Correlation coefficients of faecal oocyst counts. Note: Fe faecal consistency, Foc=Faecal oocyst counts, Sr = Square root, P=Probability Table 4. 5: Comparison of faecal consistency and faecal oocyst counts Figure 4. 1: Comparison of faecal consistency solid (1 ), semi solid (2) and fluid (3) and oocyst counts of 127 calves Table 5. 1 a: Counts (oocysts/g) of conventional calves (n=1 ) on Massey University Dairy Research Unit Table 5. 1 b: Oocyst counts (oocysts/g) of conventional calves (n=1) and cows (n=1) on Massey No. 4.Dairy Farm Table 5.2: Oocyst counts of calves (n=16) raised organically at Massey University Dairy Research Unit Table 5. 3 : Oocyst counts oocysts/g of calves, their dams and autumn born bull calves estimated on up to 3 occasions on Farm B. Note: '' means no sample is obtained Table 5. 3 : Oocyst counts oocysts/g of calves, their dams and autumn born bull calves estimated on up to 3 occasions on Farm B. Note: '' means no sample is obtained (b) Ballantrae Hill Country Research Station: Table 5.4: Arithmetic Mean oocyst counts (ocysts/g)of No Chemical organic calves(ncc), their dams (NCO) and Conventional calves (COC), and
12 their dams (COD) from farmlets at Ballantrae Hill Country Research Station Table 5.5: Type 3 tests of fixed effects of time series analysis for oocyst Table 5.6: Type 3 tests of fixed effects of time series analysis for oocyst counts of cows on Ballantrae farm Table 5.7: Oocyst counts (oocysts/g) of calves on Stafford commercial farm.117 Table 5.8: Oocyst counts (oocysts/g) of calves from Alley Table 5.9: Total Counts of species identified from different animals on different farms. Note: B=Farm B, Baii=Ballantrae IX
13 X LIST OF FIGURES Figure 3. 1: Comparison of arithmetic mean oocyst counts of groups of calves up to weaning fed meal containing monensin (M) and calves fed meal without monensin (NM). Each group (G13) comprising 4 calves Figure 3. 2: Comparison of least square mean oocyst counts of groups of calves up to weaning fed meal containing monensin (M) and calves fed meal without monensin (NM). Each group (G1 3) comprising 4 calves Figure 3. 3: Comparison of arithmetic mean oocyst counts of calves up to weaning fed meal containing monensin (M) and calves fed meal without monensin (NM) by sampling occasion. Calves were sampled twice a week for the first 3 weeks and then once a week. Each group consisted of 12 animals Figure 3. 4: Comparison of least square mean oocyst counts of calves up to weaning either fed meal containing monensin (M) or fed meal without monensin (NM). Each group consisted of 12 animals. The error bars represent the standard error Figure 3. 5: Monensin consumption (mg/kg feed) compared to required consumption by calves preweaning based on their weekly average live weights Figure 3. 6: Arithmetic mean of oocyst counts for calves after weaning either treated with toltrazuril 2 mg/kg body weight or not treated with toltrazuril, each group consisting 12 animals. Treatment on Week Zero Figure 3. 7: Least square mean oocyst counts for calves after weaning, either treated with toltrazuril or not treated with toltrazuril, each group consisting of 12 animals. Note : Treatment given at Week Figure 3. 8: Comparison of the arithmetic mean oocyst counts of 4 groups treated with both anticoccidials ( toltrazuril+ monensin = T +M), not treated with either drugs (NM +NT), treated with only one anticoccidial at least (NM+ T) = treated with toltrazuril only; treated with monensin only( M+NT) Figure 3. 9: Comparison of arithmetic mean live weights of calves fed pellets containing monensin (MG1, MG2, and MG3) and calves fed pellets without monensin (NMG1, NMG2, NMG3). Each group comprised 4 calves Figure 3. 1: Comparison of Least square mean live weights of calves (Error bars represent SE) either fed pellets containing monensin (M) or fed pellets without (NM). Each treatment consisting of 12 animals Figure 3. 11: Arithmetic mean live weights of calves after weaning either treated with toltrazuril 2mg /kg at the time of weaning (T) or not treated (NT). Each group consisted of 12 animals Figure 3. 12: Least square mean weights for a ccomparison of 2 groups of calves either treated at weaning with toltrazuril (T) or not treated with toltrazuril (NT) with live weights adjusted for initial weights. Each group consisted of 12 animals Figure 3. 13: Status of Cryptosporidium infections in calves up to 5 weeks of observation Figure 4. 1: Comparison of arithmetic mean oocyst counts of Group A calves treated at weaning (Week ) with toltrazuril 2mg/kg body weight (AT) or not treated with toltrazuril (ANT). Each group comprised 15 calves
14 Figure 4. 2: Comparison of arithmetic mean oocyst counts of Group B calves treated at weaning (week ) with toltrazuril (BT) or not treated with toltrazuril (BNT). Each group comprised15 calves Figure 4. 3: Comparison of Means of Group A treated with toltrazuril (AT), Group A not treated with toltrazuril (ANT), Group B treated with toltrazuril (BT) or Group B not treated with toltrazuril (BNT) and Group C not treated with toltrazuril (CNT) Each group comprised 15 animals except group C of 21 calves Figure 4. 4: Comparison of Least Square Mean oocyst count (+/) of Group A treated with toltrazuril (AT), Group A not treated with toltrazuril (ANT). Each group comprised 15 animals. Error bars represent Standard Error Figure 4. 5: Comparison of Least Square Mean oocyst count (+/) of Group B treated with toltrazuril (BT) or Group B not treated with toltrazuril (BNT). Each group comprised 15 animals. Error bars represent Standard Error.1 Figure 4. 6: Comparison of arithmetic mean live weights of Group A calves either treated with toltrazuril at weaning (AT) or not treated with toltrazuril (ANT). Each group comprised 15 animals Figure 4. 7: Comparison of live weights of group B calves treated with toltrazuril (BT) or not treated with toltrazuril (BNT). Each group comprised of 15 animals Figure 4. 8: Comparison of LSM live weights, of Group A calves treated with toltrazuril (AT) and not treated with toltrazuril (ANT). Each group comprised 15 animals Figure 4. 9: Comparison of LSM live weights, of Group B calves not treated with toltrazuril (BNT) and treated with toltrazuril (BT). Each group comprised 15 animals. Error bars represent SE Figure 4. 1: Comparison of faecal consistency solid (1 ), semi solid (2) and fluid (3) and oocyst counts of 127 calves Figure 5. 1: Comparison of Mean oocyst counts of No Chemical organic calves (NCC), their dams(ncd) and Conventional calves( COC), their dams(cod) on 3 sampling occasions (1Sep, 2Dec, 3Mar) Figure 5. 2 :Comparison of logtransformed oocyst counts of No Chemical organic calves (NCC), their dams (NCD) and Conventional calves ( CO C), their dams (COD) on 3 sampling occasions (1Sep, 2Dec, 3Mar). Note:Foc=Faecal oocyst count, Ln =log Figure 6. 1: Silver stained SOSPAGE gels. Lanes 13 contain proteins from MDBK culture containing Eimeria proteins loaded at volumes of 5 1, 1 1 and 2 1 per lane. Lanes 46 contain proteins from uninfected MDBK cultures at the same respective volumes Figure 6. 2:.1% Coomassie stained SOSPAGE gels. Lanes 24 contain proteins from MDBK culture containing Eimeria proteins loaded at volumes of 2 1, 1 1 and 5 1 per lane. Lanes 57 contain proteins from uninfected MDBK cultures at the same respective volumes Figure 6. 3: Different antigenic proteins of Eimeria on Nitrocellulose membrane from cell culture grown parasites after transfer from SOSPAGE gels, stained with.2% Ponceau S XI
15 XII LIST OF PLATES Plate1. 1. A structutre of Sporulated Eimeria oocyst Plate Species with Micropyle 1: 1. E. auburnensis Page E. auburnensis 3. E. auburnensis 4. E. auburnensis 5. E. bovis 6. E. bovis Plate2. 2. Species with Micropyle 2: 7. E. canadensis 8. E. canadensis 9. E. canadensis 1. E. wyomingensis E. wyomingensis Plate Species with Micropyle 3: 12. E. bukidnonensis (1 x) 13. E. bukidnonensis 14. E. bukidnonensis 15. E. bukidnonensis Plate Species with Micropyle 4: 16. E. brasiliensis 17. E. brasiliensis 18. E. brasiliensis 19. E. brasiliensis Plate Species with out Micropyle 1 : 2. E. cylindrica 21. E. cylindrica 22. E. cylindrica 23. E. cylindrica 24. E. ellipsoidalis 25. E. ellipsoidalis 26. E. ellipsoidalis 27. E. ellipsoidalis
16 XIll 28. E. subspherica 29. E.subspherica 3. E.subspherica 31. E. subspherica Plate Species with out Micropyle 2: 32. E. zuernii 33. E. zuernii 34. E.zuernii 35. E.zuernii 36. E. alabamensis 37. E. alabamensis 38. E. alabamensis 39. E. alabamensis page 66 & 67
17 XIV Abreviations Sr Square root IFAT Indirect fluorescent antibody Test DAI Days After Infection LG Low grade HG High grade S.l. small intestine P.I. Post infection PP pre patent L.A lasalocid DEC Decoquinate MDBK MadinDarby Bovine Kidney SOS Sodium Dodecyl Sulphate ELISA Enzyme linked immunosorbant assay PAGE polyacrylamide gel electrophoresis PVDFPolyvinylidene Fluoride FOC Faecal oocyst count PBL Peripheral blood Leucocytes PMN Peripheral mononuclear Cells NK Natural killer cells IEL Intra Epethelial Lymphocytes CMI Cell mediated Immunity lgg, lga, lgm Immunoglobulin G, A, M etc. KDa KiloDalton Fe Faecal Consistency SE Standard Error VERO African Monkey Kidney Cells ANOVA Analysis of variance CO Conventional NC No Chemical IELs lntraepithelial Lymphocytes P Probability LSM Least square mean SRT square root transformation
18 XV
19 CHAPTER 1 : Review of Literature. 1. Introduction: 1.1. Taxonomy: Protozoa are unicellular organisms with a complex structure and are the most abundant of all living things. Protozoa can be found in the lumen of the intestine, blood plasma, blood cells and other tissues, and even in the nuclei of cells. Some protozoa cause disease. Protozoa form a subkingdom of the Kingdom Protista. There are about 65, named species, about half of which are fossils. In its latest classification 'The Society of Protozoologists' recognized seven phyla. Two are very small and so far relatively unimportant (Levine et al., 1985). The seven phyla are 1. Labryinthomorpha. 2. Aceptospora. 3. Microspora 4. Myxozoa. 5. Sarcomastigophora 6. Ciliophora. 7. Apicomplexa. The protozoa of the Apicomplexa contain an apical complex at some stage of development and many of these are parasitic. The Phylum Apicomplexa is subdivided into two classes: Sporozoasida and Piroplasmasida. The class Sporozoasida produce oocysts or spores. They are further divided into two subclasses of Gregarinasina and Coccidiasina. The members of the Coccidiasina are intestinal parasites of vertebrates, marine annelids and are further categorized into four suborders. Out of four suborders, three suborders (Adeleorina, Haemospororina, and Piroplasmorina) are haemoparasites of vertebrates and the Suborder Eimeriorina contains mainly intestinal parasites, and has 9 families, one is Eimeriidae. Among 24 genera in the family Eimeriidae, two, Eimeria and Isospora, are commonly referred as the "coccidia". The Coccidia are generally highly host specific (Levine, 1985, Andrews, 198) and cattle are only infected by species of Eimeria Life cycle of Eimeria: The life cycle of Eimeria is monoxenous (one host) and each phase in the life cycle occurs in a particular site (stenoxenous). The general eimerian life cycle can be divided into 3 stages: Sporogony, schizogony (asexual development) and gametogony (sexual development). All stages of the organism are haploid except the zygote (Hammond, 1973). These parasites generally have a high
20 degree of site specificity. For example, the very large first generation schizonts of E. bovis are found in the posterior half of the small intestine, second generation schizonts are seen in the endothelial cells of the crypt epithelial cells of the large intestine and gametogony occurs in the surface epithelial cells of the large intestine, caecum and colon (Levine, 1985). Not all the life cycles of eimerian species infecting cattle are known. From experiments, the life cycles of E. bovis, E. zuernii, E. ellipsoidalis, E. auburnensis and E. alabamensis have been elucidated, but the life cycles of E. cylindrica, E. illinoisensis, E. canadensis, E. pellita, and E. brasiliensis remain unknown (Ernst and Benz 1986). 2 There are two endogenous phases of development (schizogony and gametogony) which occur mostly in the intestines, sometimes, in the liver and mesenteric lymph nodes (Lindsay and Dubey, 199; Lima, 1979), whilst sporulation (sporogony) occurs outside the host (exogenous) (Fayer, 198). Oocysts are passed in the faeces and contain a single sporont. Sporulated oocysts contain four sporocysts and each sporocyst contains two sporozoites. Sporulation is strictly aerobic (Hammond, 1973) and takes 1 or more days depending on the species and temperatures. The fully sporulated oocyst is infective Asexual cycle: When infective oocysts are ingested by ruminants, the sporozoites escape from the oocysts due to stimulation by carbon dioxide, trypsin and bile. This process is called "excystation" (Jackson, 1962; Hibbert, 1969; Landers Jr. 1959; Lotz and Leek, 196). Individual sporozoites then penetrate into specific cells in specific locations. After entering the cell, the sporozoite becomes a round structure which is called a trophozoite. By multiple fission, a first generation schizont is formed in which numerous, often hundreds, of merozoites are developed which each contains one nucleus. The mature merozoites escape from the schizonts and penetrate another host cell and start another generation (second generation of schizogony). The Eimeria species of ruminants have two schizont stages, a giant first generation schizont and smaller secondgeneration
21 schizont. For example in E. bovis, there is a giant schizont (approximately 3!lm diameter) containing 12, merozoites in the first generation and a smaller second generation schizonts of 8.9 x1 11 containing 336 merozoites (Hammond et al., 1946 and 1963) Sexual generation: After the second generation of schizogony the merozoites enter new host cells and initiate gametogony, the sexual phase of the cycle. Most merozoites develop into macrogamonts 'female' gametes and some into microgamontsnormally considered equivalent to 'male' gamonts (Levine, 1985; Ernst and Benz, 1986). Macrogamonts have a large central nucleus with a prominent nucleolus. In each microgamont a large number of dark blue staining peripherally arranged nuclei develop and these mature into hundreds of comma shaped microgametes. The flagellated male gamete migrates to and fertilizes the macrogamete and the fertilized macrogamete then forms an oocyst wall. The oocysts leave the host cell and enter the intestinal lumen and are shed in the faeces (Fayer, 198; Ernst and Benz, 1986). The time from ingestion of sporulated oocysts to the appearance of oocysts in the faeces varies from about 13 weeks depending upon the species of Eimeria Sporulation: The oocysts sporulate outside the body ( exogenously) under aerobic conditions (Fayer, 198). At the proper temperature and humidity the Eimeria oocyst cytoplasm divides to form four sporocysts, each with two sporozoites. This process is called sporogony (Ernst and Benz, 1985). The life cycle of different Eimeria species infecting cattle is reviewed and presented in Table Factors affecting the life cycle of Eimeria species: The life cycle and endogenous development of eimerian parasites is not fixed. Sometimes the life cycle may be shorter when they have fewer generations of schizogony and smaller and faster maturing schizonts. Host factors such as genetic makeup, strain, and immunity are important in influencing the endogenous development of the parasite (Levine, 1985). Some anticoccidial
22 drugs arrest the development of the sporozoites, resulting in abnormal sporulation of the oocysts (Levine, 1985). 4 Factors affecting the number of oocysts produced vary from the inherent potential of each species to reproduce in a nonimmune host; immunity developed by the host; crowding factors; competition with other species; other concurrent infectious agents; nutrition of the host; and strain differences of the host and parasite. In addition, use of anticoccidial drugs is also a factor for the number of oocysts produced (Fayer, 198) Pathogenicity: Not all eimerian species are equally pathogenic. The most pathogenic species infecting cattle are E. bovis and E. zuernii, which are usually associated with clinical disease in cattle (Ernst and Benz, 1986). In contrast E. wyomingensis and E. subspherica are considered nonpathogenic. Others, though such as E. alabamensis, E. auburnensis, and E. ellipsoidalis, that are also considered nonpathogenic, may cause diarrhoea when large numbers of oocysts are given. For example, E. alabamensis, E. wyomingensis, E. subspherica and E. auburnensis required 1714 million, 4 million, 1 million and 8 sporulated oocysts to be given to calves to produce clinical infection (Davis et al., 1955; Ernst and Benz, 1986; Oda and Nishida, 199; Christensen et al., 199). The pathogenicity of E. pellita and E. brasiliensis is not known. The pathophysiology of Eimeria species infecting cattle reported by several authors is shown in Table 1.2. The economical loss due to coccidiosis includes death of animals with the disease, weight loss in others, treatment expenses and impaired future performance of the herds (Ouigley, 21 ; Niilo, 197) Faecal consistency and oocyst numbers: Little relationship has been noted between faecal consistency and the number of oocysts present in the sample. Many faecal samples with normal consistency had relatively large oocyst numbers and many diarrhoeic samples had low numbers (Ernst et al., 1987; Oda and Nishida, 199). However, these findings relate to mixed infections involving both pathogenic and nonpathogenic species.
23 5 Species I Infective dose I Asexual Phase Sexual phase lo..; Cb.t: ft.q :::J Cl) uj.!!? ::...Q uj.!!? ::...Q uj.!!? Cl) c: Cb E.Q uj 1x1 6 1x x1 6.51x1 merozoites into caecum 64, Posterior part of the S.l, rarely in caecum and colon. As white structure in endothelial cells of central lacteal towards the tip. Size 281 x23)lm with 12, merozoites. 1617days after infection Caecum and colon. Epithelial cells of intestinal glands at the base and few in sub mucosa. Second generation schizonts Gametocytes at 18hrs on epithelial cells of the caecum (336 I and colon. after 6 to 36hrs. Size8.9x1 O)lm merozoites) Schizonts on 12 days at 2,6, 12,16,24,36 a feet anterior to the ileocaecal valve. In the reticular connective tissue between the crypts of Iieberkuhn mostly in the lamina propria close to the muscularis mucosa. Micro gamete at days Size:79.5x1 25.5(mean size 92x1 39.9)lm) I I Min Patency I Author ppp (days) (days) (2.9) I I Oda and Nishida, 1991 Hammond et al., 1946 Hammond et al., 1963 Davis et al., 1962
24 6 236x1 6 Excystation at 29 hrs Gametogony in lower SI, (21 Davis, et al., Immature shcizonts seen on 4th caecum and colon. (8.6) days 1945 day at 1\3 of SI, intranuclear Microgamete 12x9.1 11m infection Davis, et al., (I) c:: scion in the apical cell in the tip Macrogamete 15.6 x m 1955 Cl) E of the villi Lower ileum 6 days after 113. size:at 6 days (9x ) infection (72 day Smith and But by the time they matured infection Davis, 1965) LLi 4.4x1.4 with bent rounded tips in ) lumen to intestines at crypts of Lieberkuhn 9 days 14 million LG Davis, et al., (I) c:: and challenge Cl) E with 1 Or (4.6) 4million HG.. 13 LLi (7.2). 1 x1 o Soekardono, (I) c:: Cl) 8x1 6 et al., 1975 and challenge E with 1 x1 6. LLi..2 1 x days Ernst and (I) c:: days (3.6) Benz, 198 Cl) ) (14.2).s E LLi
25 7. (/) s::.s E uj 'e Q) uj 'e I'll uj 1 x1 5 oocysts 5, 5x1 6 to First generation schizont 3m of SI, greatest concentration at 2nd meter from ileocaecal junction on 16 th day PI size: x22!lm781J.m In the lamina propria or close to muscularis mucosa. Mean no. of merozoites 32 Asexual stages seen as early as 2 days to 19 days PI. Mature schizonts seen upper, middle and lower S.l. and in the caecum and colon. Size9.6x13.2 IJ.m Merozoites size 5.6x12.2!lm in S.l., caecum, colon, and rectum. Seen on 12th day PI in the lamina propria of the villi in the distal 5m of SI. Infected cells clustered beneath tips of the villi and distal 1\3 of the villi. Microgamete 52.8 x 43. Macrogamete 24.6 x19.3!j. m numerous wall forming bodies (3.8!lm) Colon and caecum on days PI in the epithelial cells Size:114x13.51J.m Gametogony in the caecum and colon on days PI with a mean size of 14.4 x12.941lm Seen in SI and large intestines (Caecum, colon, and rectum) at 12 to 19 days PI. Size9.7 llm Macrogamete, size1.6 seen at 15 to 19 days. And immature oocysts seen on 12 th day in colon, caecum, S.l. Lindsay al., 1988 Stockdale, 1977 et Davis and Bowman, 1957
26 8.!!? Cl) c:: Cl> " LLi 8, 9 1 5days I Christensen, 1939.!!? Cl) c:: Cl> E :::l.q :::l LLi 1, 75, With a size of x66.5!lm I 18 in the mesodermal cells, in the lamina propria of the villi in lower intestines. Macrogamete seen on 16 days PI with a size of 17.9 on 18 th days. 27 I Hammond, 1961.!!? Cl) c:: Cl> E :::l.q :::l LLi.!!? Cl) c:: Cl> E :::l.q :::l LLi 64, oocysts. Trophozoites and immature schizonts of the second generation seen on 1 to 12 days PI Schizonts are seen in the middle and lower side of the small intestines. After days PI. 92 x 39.9!lm. in lamina propria. J Second generation schizonts and gametocytes seen in sub epithelial cells, mesodermal origin in the distal portion of the villi. Microgamete size 91 x 287.5!lm. Hammond and Chobtar, 1969 Davis and Bowman, 1962 Table1.1 : Life cycle of different bovine Eimeria species: Note: LG=Iow Grade, HG= High Grade, PP= Prepatent Period
27 Factors influencing the epidemiology: A number of factors influence the epidemiology of coccidiosis in cattle Environmental factors : : Rate of sporulation and survival of oocyst: Moisture, temperature and the availability of oxygen affect sporulation (Fayer 198). The optimum temperature for sporulation is 25 to 27C and for all bovine eimerian species temperature of >35 C causes permanent damage the unsporulated oocysts though sporulation is rapid at this temperature (Marquardt, 196). At colder temperatures, the rate of sporulation is slow; however, it increases as the temperature increases (Fayer 198). In general, unsporulated oocysts survive well at low temperatures. Storage at 3 C for 24hrs and 5 C for 6 days did not alter the viability of the oocysts (Landers, 1953) which is consistent with the observations that oocysts survived over winter in Wyoming (Landers, 1953). Relative humidity has been shown to affect survival and at a relative humidity of 9%, oocysts remained viable for 49 to 6 days, whereas at 61%, oocysts remained viable for only 32 days (Fayer, 198). A small number of E. zuernii oocysts in calves could still sporulate in dry dusty conditions (Parker et al., 1984) Hygiene: Coccidiosis is a particular problem when groups of young calves are raised together. lt is principally a factor of contamination of a small area then reinfection of each other. Poor hygiene in the calf rearing area provides a favorable microclimate that allows oocysts to sporulate and survive longer in the environment (Niilo, 197b; Palvaseck, 1984; Chibunda et al., 1996). Improved hygiene of calf pens reduced stocking density and prophylactic medication have been shown to contribute to reduced disease prevalence. A lower prevalence of coccidiosis was seen with low stocking rates and less environmental contamination (Niilo, 197b). For example when beef calves are widely spread on the pastures, they may not be exposed to a sufficient infective dose but keeping them in corrals and feed lots is reported to be a factor in the occurrence of severe winter coccidiosis in calves (Niilo, 197b).
28 In one study, farms with a high stocking density, water contaminated with oocysts and animals not supplied with anticoccidials in feed, had prevalences of infection up to 7882%. However, the use of cages, water troughs and lower stocking densities reduced the prevalence of infection to 49% (Matjila and Penzhorn, 21 ) Stress: Stress factors such as a change in diet, climatic conditions (Fitzerald, 1961 ), weaning (Marsh, 1938), dry dusty conditions and challenge with other infectious agents (Parker, 1984) further contribute to infection, which is already present in the host. Stress due to harsh winter conditions was considered as one of the factors for winter coccidiosis in Canada (Niilo, 197c; Radostits and Stockdale, 198). Stress at weaning is acknowledged to reduce the limited immune response that has developed in calves by this age and this may result in the clinical disease outbreaks in calves (Fitzgerald, 1961 ; Niilo, 197c) Animal Factors: Adult cattle serve as a source of infection: Adult cows have been observed to shed low number of oocysts in several studies, (Svensson, 1993; Faber, 22; Marquardt 1961 ; Balconi, 1963; Fitzgerald, 1961 ) and this is likely to produce the initial low level of contamination for calves. A peripartum rise in oocyst count especially for E. bovis has also been observed (Faber et al., 22), which may further contribute to the initial infection in calves. The infection of the adult herd serves as the source of coccidiosis (Marsh, 1938; Boughton, 1944) and within 26 weeks, clinical coccidiosis may be seen in young animals and the severity in turn depends on the number of oocysts ingested (Boughton, 1944) Age and immune status of calves: Unexposed calves may develop severe disease after their first exposure and the severity of the disease depends on the level of infection. Previous exposure builds up resistance to the disease (Fitzgerald, 1967; Niilo, 1969). This resistance protects the calves for further infections (Niilo, 1969; Soekardono, 1975). Exposure of neonatal calves to the infection at a young age (3hrs
29 4hrs) resulted in a poor immune response and these calves may then become a source of infection (Niilo, 1969). Further evidence of host immunity is the ability to modify this by using immunosuppressive drugs like dexamethazone (Niilo, 197a). Host resistance to infection can be seen in terms of no clinical signs and discharging fewer oocysts following infection. A low dose infection with 15 oocysts/day for 11 days proved to be sufficient to stimulate immunity (Fitzgerald, 1967). The effect of lowlevel infection (premunisation) and treatment with a coccidiostat to control the disease was investigated in calves. Calves were infected with 2, Eimeria bovis oocysts/day for 5 days, whilst being treated with a coccidiostat and later challenged with 2, oocysts. They did not develop diarrhoea when they were on medication but when the drug was withdrawn the calves developed diarrhoea and had oocysts in their faeces. Premunisation without a coccidiostat could not prevent the disease when large numbers of Eimeria bovis oocysts were fed to calves (Foreyt, 1984) Control of coccidiosis: The control of coccidiosis depends on good hygiene practices such as clean dry stalls (wire or slatted floors), feeding from bunks (Schillhorn, 1986), treatment of clinically affected animals (Fox, 1985) and use of preventive anticoccidial drugs (Pritchard, 1983). lt is difficult to treat the environment (pasture or feedlots) as the oocysts are ubiquitous and are resistant to many chemicals. Control can be achieved without drugs by taking precautions such as reducing stock densities, pasture rotation, avoidance of suspected contaminated pasture, feeding colostrum, using clean utensils and maintaining dry bedding.
 given massive doses small intestines, massive 1957.")

30 Species Dose (oocysts) Clinical Signs Lesions Author E. alabamensis Up to 2 billion Deaths in 2 out of 5 calves Enteritis in the lower half of the Davis et al., (2x1 9 ) given massive doses small intestines, massive destruction of the epithelium, leucocytic infiltration and villous oedema, tufts of swollen villi which are macroscopically seen and sandy in texture. E. alabamensis 1 4x1 6 Slight diarrhoea in 2 Hooshmandrad month old bull calves and et al., calves developed watery diarrhoea, had poor appetite,depression which affected the growth rates. E. alabamensis 1 7x1 6 sporulated 4 calves out of 5 Davis et al., oocysts and twice developed clinical 1955 this number oocysts infection. of other species. 1 4x1 6 sporulated oocysts in clinical infection continuous days. E. subspherica 1 x1 ob to 1 x1 7 No clinical disease but few Oda and sporulated oocysts oocysts were passed Nishida, 199. E. auburnensis 64, Diarrhoea on 6 tn, tn and Schizonts in the middle and lower Davis and 1 ih day after inoculation third of small intestine and ranges Bowman, from 75 to in lamina propria near the muscularis mucosa. E. auburnensis 8 sporulated Clinical infection in a two Christensen et oocysts week old calf which al., 199 N


31 showed greenish water diarrhoea and discharged 31 9, oocysts on 24th day of infection. E. wyomingensis.21 x 1 Diarrhoea seen in all No pathologic lesions Ernst and Benz sporulated oocysts/ calves, Patent infection 198 sporocysts from 1 seen in 32 out of 5 million sporulated calves. oocysts and Calves excreted 1 dexamethasone 3,3 oocysts for 24 days. No observable blood or sloughed mucosa passed. no relation between the oocyst number passed and oocyst no.given E. wyomingensis 1 x1 sporulated No clinical signs Sexual stages in lamina propria Lindsay et al., oocysts of the villi in the terminal small 1988 intestines, Infected cells had nuclear and cytoplasmic hypertrophy E. wyomingensis 12x1 r Diarrhoea in 3 calves. Courtney et al., oocysts Diarrhoea with flecks of 1976 blood in 2 calves Discharge of oocysts E. zuernii.6x1 6 and 6mg Consistent clinical infection Niilo, 1976 dexamethazone E. zuernii 3, sporulated Stockdale and oocysts Niilo, 1969 w

32 E. bovis Sporulated oocysts Produced bloody at different levels diarrhoea, 2 deaths and 5 from 1 to 15, 25, oocysts in controls for 62 days and challenge with 3 to 5, oocysts on day 47 or 49 day. E. bovis 51 calves 1 to 2 6 Diarrhoea when first oocysts are passed. Severe infections bloody diarrhoea with tenesmus. Congestion, haemorrhage, destruction of the intestinal glands of mucosa and formation of membrane in caecum, colon. Symptoms and pathological changes are associated with sexual stages. Schizonts occupied lumens of endothelial ceils of central lacteals. Hammond et al., Table 1.2: A summary of some experiments investigating the pathophysiology of different bovine Eimeria species: 1946.j::>.
33 Anticoccidial Drugs: Two terms are commonly used in relation to anticoccidial medication. Coccidiostat: coccidiostats cause stasis of infection/life cycle; they do not sterilise the infection but allow premunition and thus an immune response with subsequent infections. Coccidiocide: coccidiocidal drugs do result in a sterilising effect, killing some or all of the parasite stages and are suited for treatment of acute coccidiosis. A variety of different types of drugs, have been and are being, used for coccidiosis in cattle. The commonly used coccidiostats in cattle are amprolium, decoquinate, lasalocid, monensin, and sulphonamides Sulpha drugs: During 196 to 197, various sulfonamide compounds such as sulfamethazine, sulfaquinoxilone and combinations of the various sulfonamides were used for treating cattle coccidiosis lonophores: lonophores are antibiotics used to control coccidia. The term ionophore is derived from the drug's ability to bind and transport ions and biogenic amines through biological membranes (Pressman, 1973). lonophores selectively affect certain microorganisms by altering the passage of cations through pores in their outer cell membrane. The ionophore antibiotics are produced by filamentous branching bacteria of the order Actinomycetales and commercially, different types of Streptomyces bacteria are used to produce them (Hall, 2). lonophores are hydrophobic molecules that selectively bind to a given metal ion and increase its cell permeability to cross the cell membrane. The inner part of the ionophore is made of polar groups forming a tetra or octahedral geometry that fits and encloses a specific ion. lonophores change the primary ion concentration of the cells and can release sequestered intracellular ions thus altering intracellular ph and damaging cell organelles (Hall, 2). In addition to activity on parasitic parasite protozoa, ionophores are also antibiotics that affect the rumen bacteria, protozoa and can suppress rumen fungi.
34 Monensin: Monensin is an ionophore which is a fermentation product of Streptomyces cinnamonensis with a spectrum of activity which includes Eimeria infections in cattle and poultry; monensin is also used as growth promotant a. Mode of action: Monensin forms soluble complexes with monovalent cations such as Na +, K+ in both host and parasite enabling them to cross plasma membranes which then draws excess water into the cell. The ion preference of monensin to different ions is Na + >K +. Monensin is toxic for many species and each individual species differ in their tolerability for monensin. For example 2.5mg/kg is lethal to horses whereas trout can take up to 1,OOOmg /kg. Skeletal muscles are most prone to be affected by toxicity (Todd, 1984). Monensin is a weak antibiotic against grampositive bacteria b. Monensin in a coccidiostatic role: Monensin acts as a coccidiostat and reduces the clinical signs of coccidiosis in ruminants. Whether it can be regarded as a true coccidiostat or a coccidiocide is not clear. Some authors refer to it as a coccidiostat and others do not. Several experiments have been conducted on monensin treatment of calves and lambs infected with coccidia (Stromberg et al., 1986; Genchi et al., 1989; Fitzgerald, 1984; Stockdale, 1981) (see summary in Table 1.3). Treatment with monensin 23 days prior to infection and 31 days after infection not only prevented clinical disease but also reduced oocyst numbers by 6% (McDougald, 1978; Fitzgerald and Mansfield 1979; Stromberg et al., 1986) and in another study monensin feeding at 1 mg/kg body weight reduced the incidence of clinical coccidiosis in calves (Stockdale, 1981 ) c. Stages affected by Monensin: Monensin treated sporozoites showed reduced penetration into cells and also inhibition of asexual stages in vitro (Smith, 1981 ). The damage is observed in terms of swelling, vacuolation and irregular cell surface. The damage to sporozoites was parallel to the dose of monensin administrated (Smith et al., 1979, 1981 ).
35 Monensin increases the intracellular sodium and stimulates the activity of the sodium pump which is supported by amylopectin of sporozoites. The increased energy consumption by the sporozoites to counteract the effect of the monensin reduces the ability of the parasite to penetrate the host cell (Stockdale, 1981 ) d. Dosage of Monensin: Monensin has a dose related response to coccidia. When given in feed at 5ppm it was observed that lambs excreted excessive oocysts as the result of infection and suffered decreased weight gains. At 1 ppm, lambs passed fewer oocysts whilst at 2ppm the oocyst production in lambs was completely reduced (McDougald, 1978) over controls. Similar experiments with calves showed reductions in clinical signs at 1 mg/kg weight (Fitzgerald, 1984; Stromberg et al., 1986). The summary of several reports on the use of monensin as an anticoccidial treatment is detailed in Table e. Effect of monensin on weight gains: In previous studies, Monensin has had mixed effects on weight gains. In some trials monensin did increase daily weight gains (up to %) and increased feed conversion efficiency (by 15%) in lambs (Fitzgerald 1978 ; Foreyt and Wescott, 1979; Calhoun et al., 1979; McDougald, 1978) and calves (Wagner et al., 1984; Rouquette et al., 198; Potter et al., 1986). However, in other studies monensin reduced feed intake and improved feed conversion efficiency but had no effect on average daily gain (Potter et al., 1985; Zinn, 1966; McDougald, 1978). Similarly, feeding of lambs 17 to 33 mg/kg of monensin for 35 days after inoculation with Eimeria had no effect on average daily weight gains (Horton and Stockdale, 1981 ; Gregory et al., 1982) f. Monensin regularly added to the feed as rumen modifier: Monensin given in feed (Stockdale et al., 1982) or as an intraruminal bolus (Parker et al., 1986) not only prevents coccidiosis but also acts as a rumen modifier and increases the efficiency of utilization of the feed in both grain and forage fed cattle. Monensin stimulates the production of propionic acid as a result of monensin selecting for certain bacteria, such as Bacteroides species and Selemonaas ruminatium. These bacteria convert decarboxylate succinate
36 to propionic acid thus increasing production of propionic acid in the rumen (Stockdale, 1981 ; Calhoun et al., 1979; Hall, 2; Oscar et al., 1987; Muntfering et al., 198). As a consequence, monensin increases the feed conversion efficiency in calves up to 15% (Stockdale, 1981, McDougald, 1978, Horton and Stockdale, 1981 ). In one trial, monensintreated cattle grew 1.6% faster, consumed 6.4% less feed and required 7.5% less feed/1 OOkg than controls (Goodrich, 1984). Monensin improved the utilization of feed energy by directly or indirectly influencing the metabolism of carbohydrates (Ritcher et al., 1984). Monensin improves the digestibility of drymatter by 72 to 75%, (Goodrich et al., 1983, 1984), reduces lactic acid and methane production by 26% (Wedegaertner et al., 1983, Oscar et al., 1987) and controls bloat in ruminants. 18
37 19 species Infective Age at Monensin dose dose challenge rate Oocysts (weeks) E. bovis+ E. zuernii 3, 4.5mg/kg body and others weight, 1 mg/kg, 3mg/kg, 3 pre and 3 days post infection. E. bovis 1, calves 1 mg/kg body weight given 1 Odays after the infection E. zuernii 1, calves 1 mg/kg body weight given 1 2days after infection Clinical signs in treated No clinical signs in treated calves but 3mg was effective Improved weight gains Few oocysts passed. 2 out of 6 treated passed many oocysts. Developed resistance to challenge. Better weight gains supressed the clinical signs prevented weight reduction Clinical signs in controls Deaths Loss of weight Clinical disease Weight loss Authors Fitzgerald and Mansfield, 1979 Stockdale, 1981 Stockdale, 1981 E. bovis or 25, 7 (bulls) 1 Ogms/ E. zuernii 2gms/ 3gms/in 96kgs feed E. bovis or 5, 4 (bulls) Monensin E. zuernii and/or 2mg on 1,2,3g ton both 12, 15,16 1 3days prior to E. bovis + PI inoculation and E. zuernii dexa up to 3 days PI methasone 15, or 25, 2n d time 5, + 3, mixed Natural steers 252 monensin infection 255 kqs 14mq/ton feed Fewer clinical signs Less no. of oocysts discharged Significant weight gains in 2 to 3gms received calves The calves treated with 2 to 3gnon reduced the oocy numbers following the challenge Day 1 counts were 1,1 4 but at 4 days were 5 opg, and 1 Clinical disease with calves with increased number of oocysts passed in faeces Calves inoculated with E. bovis and the calves had both species exhibited more severe signs compared to E.zuernii which was difficult to establish 1 day 495 opg 4 day 275opg Fitzgerald and Mansfield, 1984 Stromberg et al., 1986 Berger et al., 1981
38 3g/ton feed to 12 days they were 1 12 day 71 5 opg opg.with 3g, Day1 163 opg oocysts counts and 4day to 12 opg. were high on day No significant weight gains and 1 742, feed intake but feed efficiency increased by 8.2% Reduced feed intake seen 8months 25mg/kg Myocardial degeneration first Ryley beef 7mg/kg for and myocardial necrosis by 4 to et al., 1983?days 11 days E. bovis 5x1 5 4 (bull) 1 mg/kg from 1 Peak oocyst production on 21st Deaths, clinical Stockdale and re infected to 2 days PI day, reduced oocyst numbers. coccidiosis, peak Sheard, 1982 after 35 Significant weight gains. oocysts on day 25. days Resisted second infection Resisted second infection E. bovis+ 25, Monensin Lower oocyst counts up 46 Clinical coccidiosis Foreyt et al., E. zuernii 33mg/kg body days with high oocyst 1986 weiqht No effect on weiqht qains counts E. crandallis, Natural 6 weeks Monensin No periparturent peak in ewes Diarrhoea around Gregory et al., E. ovinoidalis, infection age 18mg/day and low diarrhoea during lambing and high E. ovina. before lambing lambing. Oocyst output oocyst out put for 6 weeks. reduced in all animals < 26/g Lambs..3 to Drier faeces and no significant.6 mg/lamb for weight gains 1 weeks. E. ninakolinakimove Natural Lambs 5,1, 2 ppm 1 and 2 ppm had no clinical Anorexia diarrhoea McDougald, E. ahsata. infection. signs. Oocyst passage was not 3%mortality, loss reduced. of weight, and 5ppm lambs had no deaths but oocyst counts were decreased weight gains and 169 to 298x1 6. excessive oocyst counts up to 1 x1 6 per day. 2ppm no oocyst seen even after the withdrawal of the drug and 1 Oppm lambs had counts of less than 1 Ox1 6 on 15th 2
39 day of withdrawal of drug. E. ninakohlyakimove Natural Monensin No acute clinical signs Horton et al., E. ahsata infection in Lambs 2mg/kg body Average oocyst count reduced lambs weight, or to 1x1 6 by 7th day. 31.9mg/day. Feed consumption reduced by From day 4 to 7% and no weight gain seen 12 days. and feed efficiency increased by?%. Eimeria poultry. Natural 12g/ton Monensin reduced coccidiosis, 34% of deaths, Shumard and infection. reduced caecal lesions,reduced faecal scours were Callender, 8g/ton (7 number of oocysts passed, and high, Poultry days) improved feed efficiency 53 days treatment 1 OOg/ton feed conversion was low, loss of (7 days) weight. 5 Eimeria species 24, at Lambs 17 to 33mg/kg. Highly effective more than 99% Had higher oocyst Foreyt, and mg up to 24 in eliminating the oocysts. count 24,133 opg days. days, 17mg Lambs gained 6kgs more than Blood tinged from 25th day to the controls and consumed less diarrohae 14 days 1 OOth day. feed of.5kg for each kg after inoculation. weight gained. Diarrhoea lasted for 6 to 1 days. Reduction in weight between 36 to 52 days. Bacteria. Monensin.38, Inhibited lactate producing Dennis et al.,.75, 1.5, 3., rumen bacteria , 9., 12., Succinate production not 24., 48.mg/kg inhibited. None of lactate weight. fermenters were inhibited. 21 Table 1.3 : Summary of trials where monensin has been used to control coccidia
40 Toltrazuril: Anticoccidial activity: Toltrazuril is a symmetrical triazinone and chemically unrelated to other conventional anticoccidial agents currently in the market. lt has coccidiocidal activity which damages all the intracellular developmental stages during the schizogony cycles and of the gametogony phase (Haberkorn 1996; Froyman and Grief, 22; Haberkorn and Stoltefuss 1987; Alaksandra, 21 ). Toltrazuril is effective against all coccidial species of poultry (Haberkorn 1996) and all the coccidia of mammals studied until now. For example, ducks (Reynaud, 1999), Lambs (Aiaksandra, 21 ), puppies (Daugshies et al., 2), goats (McKenna, 1988) and rabbits (Peter and Geeroms, 1986) Mode of action: The exact mode of action is stull unclear. Toltrazuril directly affects the nucleus and mitochondria which in turn influence the ion exchange of the parasite. In the macrogamete it affects the wall forming bodies this in turn results in the vacuolation of intracellular development stages (Haberkorn, 1996) Stages of life cycle affected by toltrazuril: Toltrazuril does not affect the extra cellular stages such as sporozoites (Froyman and Grief, 22). lt does not affect the host tissue cells (Froyman and Grief, 22) as seen on light, electron microscopic studies where all the microgametes, macrogametes and schizonts were damaged without causing any damage to the host cells (Haberkorn and Stoltefuss 1987). Treatment during early at the beginning of endogenous cycle completely eliminates the parasite (Reynaud et al., 1999) Single dose treatment of toltrazuril: A dose of 1 2 mg/kg as a single dose or 1 Omg/kg on 2 separate days prevented coccidiosis in lambs (Gjerde and Helle 1986; Taylor and Kenny 1988; Stafford et al., 1994; Alaksandra 1998), goats (McKenna, 1988), rabbits (Peters and Geeroms, 1986) and poultry (Haberkorn, 1996). Toltrazuril at the same dose is effective in treating clinical coccidiosis in calves (Emanuel et al., 1988), cystoisoporosis in puppies (Daugschies et al., 2), neosporosis in mice and calves (Gottstein et al., 22; Kritzner et al.,, 22). Faecal oocyst counts were
41 reduced for 23 weeks after treatment in lambs (Gjerde and Helle 1986, Taylor and Kenny, 1988) and puppies (Daugschies et al., 2). 23 In another study on rabbits, different Eimeria species required different dose levels of toltrazuril to have the same effect (Peters and Geeroms, 1986). In poultry 5ppm was enough to reduce mortality, but a dose of 1 1 5ppm was more effective (Haberkorn and Stoltefuss, 1987). In ducks, treatment in the earlier days of infection prevented disease but given later it only had a curative effect (Reuynard et al., 1999). In poultry, drinking water medication found to be more effective than per oral (Gottestein et al., 21 ) Toltrazuril treatment and immunity: it has been suggested that toltrazuril not only prevents the disease but may also help in the development of immunity in lambs (Gjerde and Helle 1986) and poultry (Grief, 2, 21 ). The anticoccidial drugs prevent the multiplication of parasite by acting on different stages of coccidia and these damaged stages stay a long time in the host cell and make the antigen available for the development of acquired immunity (Chapman, 1999) Toltrazuril and weight gains: Toltrazuril use has been shown to improve weight gains but it is variable in different species (lambs Gjerde and Helle 1986; Stafford, 1994; Alaksandra 1998, 21 ; Taylor and Kenny, 1988; GoatsMcKenna, 1988) Immunity to coccidia: Immunity to coccidia is development of resistance to a challenge infection with a homologous Eimeria species. Immunity is measured in terms of reduced pathogenic effects, reduced size of visible lesions, decrease in the number of parasite stages and improved weight gains (Chapman, 1999) Role of maternal antibodies: Maternal antibodies transferred through colostrum protect calves during the first 3 weeks against many diseases. According to Faber (22), antibody levels in the sera of cows and their corresponding colostrum were the same and
42 significant negative correlations were seen between oocyst excretion and serum antibody levels against E. bovis antigen Role of sexual stages in development of immunity: The antibodies produced against the sexual stages of development potentially inhibit the development of the oocysts and provide a block in parasite development. This principle has been used by Wallach (1997) who isolated and characterised three major gametocyte antigens (23kDa, 82kDa and 56/54 kda) of Eimeria maxima and used them them to immunise laying hens which could transfer transmissionblocking maternal antibodies to chicks via the yolk sac Immunity to E. bovis: Several experiments have been done using E. bovis to study the development of immunity in calves. Table 1.4, summarises the experiments on immunity produced by E. bovis Dose of inoculum: As can be seen in Table 1.4, it would appear there is an interaction between dose and magnitude of the immune response (Niilo 1969; Anderson et al., 1965; Hammond et al., 1963; Senger, 1959; Fitzgerald, 1967). Larger doses (5 sporulated oocysts and above) always elicit better immunity compared to lower doses, but multiple lower doses (1 1 oocysts) are effective in developing good immune responses that would protect the calves from severe infection (Fitzgerald, 1967). Multiple infections of E. bovis with a dose of 1, each on 5 consecutive days had no advantage over a single large dose at one time (Senger, 1959) and either was effective in promoting effective immunity. Immunity lasts for 23 months in young calves and 7 months in older cattle > 1 year if they are not exposed again (Senger, 1959). In rats and chickens a second inoculation increased antibodies but not a third inoculation (Rose and Mockett, 1983) Immunity to other species : E. zuernii: The immune response appears to be similar to that against E. bovis. Exposure to a large dose of 3, sporulated oocysts produced severe clinical disease
43 in calves but resulted in the development of excellent resistance to subsequent reinfection (Niilo, 1969) a. Site of immune reaction: The immune reaction occurs in both the small and large intestines of calves (Hammond, 1963). First generation merozoites inoculated into the caecum stimulated sufficient immunity to the extent that the calves could resist subsequent challenge (Hammond, 1964). This is probably due to the development of antimerozoite antibodies (lga, lgg and lgm) within the caecum b. Immune mechanism : The immunity to Eimeria is very complex. Eimeria has different stages in the life cycle presenting several stage specific antigens that can be targeted by both humoral and cellular immunity components. Schizonts, gametocytes and oocyst components of poultry Eimeria spp. (E. maxima, E. tenella) have at least 2 immunogenic antigens (Rose, 1984; Rose and Hasketh, 1976; Davis et al., 1978) but gametocytes of Eimeria maxima have 3 major antigens (23kda, 82kda, and 56/54kda) (Wallach, 1997). Sporozoites and merozoites not only have different antigens but also stimulate immunity of different duration in calves (Hughes, 1989). As seen in poultry, a primary infection with oocysts (26) or with a combination of oocysts (5,) and sulfa drugs developed sufficient immunity that birds could resist a second infection, but an infection with only merozoites, did not produce enough immunity to resist a second infection (Rose and Hasketh, 1976). Some authors have found that secondgeneration schizonts induce better immunity than first generation schizonts and the sexual stages are more susceptible to the immune response (Rose and Hasketh, 1976; Rose and Mockett, 1983).


44 Author Dose of inoculum Challenge (oocysts) Hammond 25 6, oocysts of et al., 1963 E. bovis.5 1x1 6 oocysts of E. bovis Hammond,.4.9x1 1 first Challenge of 1964 generation merozoites to calves again caecal inoculum with merozoites Senger et al., 1, , 1, Senger et al., 1, Reinfection , 5, 1, Senger et al., 5, as a single dose equal 1,, on 5 consecutive days 1, as a single dose or 5 equal doses of 2, on 5 consecutive Immunity Immune reactions both in small intestines and large intestines. Produced only 1, oocysts Fewer schizonts in small intestines on 1416 days of inoculation and lower percentage of infected epithelium because of developed immunity No infection No severe infection Similar in terms of immunity but 5, oocysts produced better immunity than 1, and 1, oocysts. Immunity developed rapidly within 14 days after the challenge. Immunity present at moderate degree up to 23 months after inoculation. Older animals (> 1 year) developed high degree immunity, up to 7 months Multiple infections have no advantage over the single inoculation. Multiple infection has no advantage over the single inoculation Control 179,9 to 41,3 oocysts More schizonts Large infected epithelium Slight to moderate infection Mild infection No severe infection Less severe coccidiosis More severe occidiosis and longer illness. Severe coccidiosis in all the previously uninoculated control calves. N \
with2, E.")


. Calves fed 5 oocysts had better immunity than 11, oocysts.")

45 Fitzgerald 1967 Conlogue, 1984 ' days 1 15, oocysts for 62 days 1, 1, 5,1, 5 up to 62 days 11 oocysts fed for 1 1 days Premunity ( 35 to 39 m day)with2, E.bovis+ 52 days Lasalocid or DEC treatment Premunity with( 35 to 39 th day) 2, E. bovis+ 52 days Lasalocid or DEC treatment Same as above but 7 days No treatment but premunised on day with 2 oocysts Treated 7 days with out reimunisation and challenged at 56 day 3, 5, oocysts on 47th and 49th day. challenge with 2, on the 56th day challenge on 56 th day No clinical signs Discharged fewer oocysts ( 1 5). Calves fed 5 oocysts had better immunity than 11, oocysts. Light infection but developed enough resistance to protect them. No diarrhoea Diarrhoea 11 to 13 weeks after the challenge and the medicated drug with drawn No diarrhoea Diarrhoea seen from 11 to 13 weeks. Table 1.4: Summary of various reports on the development of immunity to E. bovis. The diarrhoea is delayed by 1 week that is 12 week after the with drawl of the drug Deaths, bloody diarrhoea with tissue. N.J
46 Duration of immunity: Antibodies are detectable within 5?days of infection (Oavis et al., 197S), reach a peak in about 23 weeks (Anderson, et al., 1965; Hughes, 19S9) and are present for up to 63 days in calves. There is an inverse relationship observed between levels of lgg1, lgg2 and oocyst production (Faber, 22). One single larger dose of infection or inoculation raises antibody titres more quickly than two repeated doses and a second inoculum induces higher titres in calves and birds (Andersen et al., 1965; Rose, 19S4). This is more important than a third inoculation as the latter has no influence on titres in rats and chickens (Rose and Mockett, 19S3). As mentioned earlier, sporozoite specific antibodies peak after 23 weeks and disappear by 4 days but merozoite specific antibodies were still detectable in calves for 63 days (Hughes et al., 19S9; Andersen et al., 1965; Faber, 22). Mean titres are achieved in less time when the calves received larger doses of inoculum Cell mediated immunity: Immunity to coccidia involves complex interactions of thymusderived cell mediated immunity (CMI) and bursaderived humoral immunity (Froyman, 22). Athymic rats and bursectomised chickens excrete three times more oocysts than normal (Rose and Hesketh, 197). In one study E. bovis antigen induced a delayed hypersensitivity reaction similar to Mycobacterium infection (Phillip et al., 1977). lt is claimed that CMI is more important than humoral immunity (Hughes et al., 19S9). Subpopulations of lymphocytes are cytotoxic and cytolytic and can kill and lysethe parasite stages (Rose, 1974). As lymphocyte levels peak on 2 1h day and remain elevated for up to 4 days indicates that cell mediated immunity (CM I) is also important (Hughes et al., 19S9). The CMIassociated factors like macrophages, natural killer cells (NK), lymphocytes and 2 types of T derived lymphocyte populations (C4 +, COS + ) are believed to play a role in immunity to Eimeria infections. Increased numbers of macrophage and NK and C4+ are seen during the primary infection and cos+ cells during the secondary infection. The lymph nodes draining the intestines and spleen were observed to be more actively secreting these cell types with infection (Hermosilla et al., 1999).
47 Macrophages phagocytose the coccidial stages and the activity of macrophages seems to be increased in immunised chickens during 19 weeks after immunisation, with a peak at 5 weeks (Rose, 1974). The antibodies of the immunised chickens attach to the macrophages and enhance the activity of macrophages on sporozoites (Rose, 1974). The intraepithelial lymphocytes (IELS) of the gut play a role, not only in the development of the immunity by carrying the parasite from epithelial cells to the lamina propria and to the crypts, but they also seem to stop the sporozoites entering the enterocytes (McDonald, 1999) Components of humoral immunity: The earliest antibody detectable after primary infection is lgm which follow an initial large rise and then fall to lower levels that persist for a long period in rats. The second antibody which rises is lgg. Normally two fractions of lgg (lgga and lggb) are involved (Rose, 1984). The secondary infection recalled all the 3 fractions (lgm, lgga, and lggb) in rats and birds (Rose and Mockett, 1983). Probably this may be the reason the calves, which are exposed to primary infection, resist the second infection (Stockdale and Yates, 1978; Senger, 1959; Niilo, 1969) Estimation of immunity: Humoral immunity of Eimeria is estimated using a variety of different tests a. Neutralization and precipitation test: Precipitating antibodies are detectable in birds within 7 days of primary infection by precipitation and neutralization tests by using tissue and caecal extracts of recovered birds (Davis et al., 1978, Rose and Mockett, 1983) b. Indirect Immunofluorescent Antibody test (IF AT) : Antibody titres against sporozoites and merozoites of E. bovis in calves were high during 12 days after infection (DAI) and reduced to basal level by 4 DAI (Hughes et al., 1989). The IFAT tests using monoclonal antibodies detected antigens to E. bovis in the anterior half to twothirds of merozoites (Haeber et al., 1992) c. ELISA: E.bovis antibody titres of cow and calf sera and colostrum can be estimated using an ELl SA (Enzyme Linked lmmunosorbent Assay) test (Faber et al., 22,).
48 d. Western blotting : Stage specific differences in surface proteins in merozoites and sporozoites are commonly seen in coccidian parasites (Reduker and Speer, 1986). These can be selectively detected by antibodies using Western blotting. This technique has enabled researchers to identify antigenic proteins and together with immuneblotting has been utilised to identify and isolate specific bands to study potential vaccine candidates for chickens (Wallach et al., 1994; Mencher 1989; Smith et al., 1994) Western blotting using E. bovis: Several experiments have been conducted to identify the immunogenic proteins in different stages of Eimeria. Experiments using SOSPAGE gels identified protein bands of merozoites and sporozoite extracts of E. bovis ranging from 15, 215,KDa Molecular weight (Mr). Nitrocellulose immunoblots of immunised calves showed several binding proteins of Mr18, 18,KDa in merozoites and Mr28, to 118,KDa in sporozoites. Though these two contained different bands, 4 antigens had the same migratory distance in both. They are Mr 58,, 7,, 83,, and 98,KDa. The auto radiographic analysis of radionated parasite identified surface proteins on merozoites between 15, and 18, and on sporozoites 28,, 77, and 183,Kda. Though several proteins were identified, only a few of these proteins, such as 183,KDa proteins elicited an lgg antibody response (Redukar and Speer, 1986) Tissue culture: Parasites have been grown on tissue cultures to produce large quantities of parasites and in turn, antigens for molecular studies and for production of the vaccines. In earlier days the endogenous life cycles were studied by using cell lines (Hammond et al., 1966, 1969, 1972). And Eimeria species seems to be well adapted to many mammalian cells bovine kidney, spleen, intestine and thymus Prevalence of Eimeria species in cattle: Age prevalence: Coccidiosis as a disease or infection is more prevalent in the younger animals than the older ones. Generally higher oocyst counts are seen in 3 week to 18 month old calves
49 (Hasche and Todd 1959, Wisconsin). There have been many studies on the change in prevalence with age. The highest prevalence is seen in the age group of 1 month to weaning calves i.e. 86.3% (USA), 56% (Tanzania), 29% (Tanzania) and 46% (Wisconsin). The adults show lowest prevalence varying from 3.8% (Kenya) to 3% (Tanzania). 31 The prevalence is more in diarrhoeic animals than in nondiarrhoeic animals. This difference is more obvious in calves than other aged animals. All types of calf diarrhoeas from 2 to 1 2 weeks of age and most of the diarrhoeas with blood are associated with coccidia (Andrews, 1954) The effect of climate on the disease prevalence: The seasonal distribution of bovine coccidiosis is not obvious (Hasbulla et al., 199) but oocyst counts seem to be high during the wet season in all age groups (Waruiru et al., 2; Munuya et al., 199), presumably as this is favourable for the sporulation and survival of oocysts World wide prevalence: Table1.5. summarises various published papers on the prevalence and occurrence of coccidia in cattle. Coccidiosis is prevalent worldwide but there are geographical differences as to which species are present although in all countries at least 81 1 species are common. The most prevalent species are generally E. bovis and E. zuernii. These two species are not only the most prevalent but are also the most pathogenic. Regardless of which geographical region is considered coccidiosis as a disease or infection is more prevalent in younger animals than the older Prevalence in New Zealand: There have been few studies on the prevalence of coccidiosis in cattle in New Zealand. Clinical disease is not uncommon with intensive dairying, weaning stress, poor hygiene of the premises. lt is observed that 84% of blood scour cases and 25% nonblood scour cases among the <3months old calves and 6% among >3 months old calves were with coccidia when the calf scours were investigated on 81 different properties in New
50 Zealand. The most frequently found species are E. zuernii and E. bovis (Andrews et al., 1954). 32 In New Zealand, half of all the recorded cases of coccidiosis occurred in three months of September, October and November among young and recently calves animals (Bailey, 1994). There was a small peak in the month of April, because of autumn born calves and this was distinct in the northern half of the North Island. The intensive agricultural regions like Waikato had more cases where higher stock densities are seen. In New Zealand 11 species of Eimeria have been identified in cattle. In one study McKenna (1972) reported the prevalence of 1 of these as E. bovis (4 4%), E. zuernii (19%), E. canadensis (14%), E. ellipsoidalis (14%), E. auburnensis (12%), E. alabamensis (7%), E. cylindrica (5%), E. brasiliensis (4%), E. wyomingensis (3%) and E. subspherica (2%). Most common and pathogenic species were E. bovis and E. zuernii. In a later report E. bukidnonensis was also recorded (McKenna, 1974). In a seperate study Arias, 1993; described seven Eimeria species with E. canadensis being most dominant species (37%) followed by E. bovis (16.6%), E. auburnensis (12.2), E. ellipsoidalis (6%), and E. alabamensis (6%) Multiple species in one sample: Most studies of coccidiosis in calves have shown the presence of multiple species in one animal and as many as 8 to 81% positive samples have 2 or more species (up to 9) (Ernst et, al 1984, 1987; Joyner, 1966; Kasim, 1985; McKenna, 1972; Munyua and Ngotho, 199; Oda and Nishida, 1989; Hashe and Todd, 1959) with an average of 3.1.
 c:: Q)..S! ::: Q) :::J :::J :::J :::... :::J :::J a:s a:s a:s.q.q.q Q) Q. Cl) uj (,) g. 8.. uj uj uj uj uj uj uj uj uj uj uj uj a: Austria 13 2.3 5.8 7. 3. 11.5 3.9 8.5 Supperer (1952).")
51 :: g.s E Cl).. Cl) Cl) Cl) a:s Cl) Q) Q). c::.s. Cl) c:: Cl) Q). Cl) ""' Q) c:: c:: Cl) c:: Cl) a:s Q) ) Q) Q) c:: c:: (,).c:: 'tj (,).s E E. c:: Q) a:s Cl) E a:s :::J :: a:s E....Q.s.9.Q..)c c:: :::.Q Q) c:: Q)..S! ::: Q) :::J :::J :::J :::... :::J :::J a:s a:s a:s.q.q.q Q) Q. Cl) uj (,) g. 8.. uj uj uj uj uj uj uj uj uj uj uj uj a: Austria Supperer (1952). Brazil Torres & Ramos (1 939) Costa Rica 1 Adults Ruiz (1959) Costa Rica 1 Calves Ruiz & Ortiz 43 Guatemala 1 Adults Balconi (1 963) South Joyner West (1966) England Georgia, 534 Beef Ernst (1987) USA Calves 7.3 South East Boughton us 2 (1945) Illinois Beef Szanto J calves (1964) New McKenna Zealand (1972) cg (1 961) 33
52 Japan 21 <23 yr Hasbulah 9 old et al., (199) Kenya Munyua et al., 1989 India 88 Buffalo Bharkad et /16 calves al., 2 24 Cow /144 calves Montana 486 Calves Jacobson USA +47 Adults et al., I Wisconsin 355 Dairy Hasche & I week18 Todd, 1959 month Table 1.5: summary of various reports on the Percent prevalence of bovine Eimeria species. 34
53 Species Descriptions: The sizes and shapes of many oocysts overlap with other oocysts so there is recognized difficulty in identifying them (Joyner et al., 1966). For example, E. wyomingensis is close in appearance to the oocyst of E. auburnensis, but differs in appearance and shape of the sporocyst. E. pellita described by (Supperer, 1952) is a dark coloured, thickwalled oocyst similar to E. bukidnonensis superficially but the oocyst wall of the latter and presence of a residuum allows them to be differentiated. Sommer (1998) reported the importance of drawings to identify unknown Eimeria specimens and quantitative data as a reference set for identification. To classify cattle cocidia the quantitative data were employed in agglomerate clustering with an average linkage algorithm with equal weights assigned to size and shape. An inverse Fourier transform was used to reconstruct the oocyst outline, i.e., average shape and size. This method can be used to reconstruct and classify oocysts using quantitative data of any Eimeria species which vary in their sizes and shapes. A summary of the morphology of bovine species of Eimeria as described by varous authors is given in Table 1.6. and Plate 1.1 shows the general morphological details of a sporulated oocyst.
. 1.13.1. Eimeria species without micropylar cap: Ernst and Benz (198), described E.")
54 36 MICAOPYU CA, MICROPYLE 1 STilOA IOOY 'r'\\'pi SMALL REFRACTILl 5L8UU IN SPOROZOITE LARU REFRACTILE tloiuu IN SPOROZOITE SPOROCYST OOCYST RESIDUUM SPOROCYST RESIDUUM SPOROZOITE NUCL US SPOROZOITE INNER L AYER OF OOCYST WALl OUT(R LAYER OF OOCYST WALl Plate. 1.1: A structure of sporulated Eimeria oocyst (from Levine, 1986) Eimeria species without micropylar cap: Ernst and Benz (198), described E.bovis, E. zuernii, E. ellipsoidalis, and E. auburnensis as the most prevalent species whereas E. cylindrica, E. alabamensis, E. illinoisensis, E. canadensis, E. wyomingensis and E. subspherica as sporadic species and E. bukidnonensis, E. pellita and E. brasiliensis as the rarely occurring species a. Eimeria subspherica: This species was first described by Christensen (194), from calves in Alabama. They were described as the smallest oocysts observed with a transparent wall, subspherical to ellipsoidal shape. Later, in a study in Nigeria subspherical forms
55 were identified by Lee and Armour In other studies E. subspherica (Joyner et al., 1966 South West England, Oda and Nishida, 199 Japan) was described similarly b. Eimeria ellipsoidalis: The oocysts of Eimeria ellipsoidalis were first described from a Calf from Iowa, and were colourless, ellipsoidal (Becker and Frye, 1929). Then Christensen (1941 ) described the oocysts having lavender to yellowish coloured wall. Later, Lee (1959), found similar oocysts c. Eimeria zuernii (Rivolta 1878) Martin, 199 Synonym: Cytospermium zurneii, Rivolta, 1878 These oocysts were described by Christensen (1941) from Alabama and also Lee (1959) from Nigeria and Levine and lvens (1967) from Illinois. The oocysts were spherical to ellipsoidal, without a micropyle, with a transparent thin wall and contained one or more scattered polar granules. Sporocysts were elongate and ovoid each with a tiny stieda body. A sporocyst residuum was present either scattered or as a compact mass. Sporozoites were elongated, head to tail in sporocysts with a clear globule at the large end, and the nucleus in the center (Levine, 1985) d. Eimeria cylindrica Wilson, 1961 : Christensen (1941) described the unsporulated oocysts as cylindrical shaped, nonmicropylar with a homogenous transparent wall. In later descriptions it is reported that sporulated oocysts have no residuum and stieda body but had scattered polar granules. Sporozoites contained one or more clear globules e. Eimeria alabamensis: Originally described from cattle, in Alabama, USA (Christensen, 1941 ). The unsporulated oocysts were typically pyriform, varying from subellipsoidal to subcylindrical but the majority were tapered at one end. Oocysts contained a parachute shaped cap at each end of the sporocyst. No residual matter was present in either oocyst or sporocyst.
56 Levine and lvens (1967) described these as ovoid with sides tapered towards the small end, with no micropyle, no sporocyst residuum and containing 23 clear globules in the sporozoite Eimeria species with micropylar cap: a. Eimeria bovis: Synonyms: Coccidium bovis, Zubliln, 198. Eimeria canadensis, Bruce, 198. Eimeria smithi, Yakimoff and Galiouzo, Globidium fusiformis Hassan, The unsporulated oocysts from Alabama calves were described as stout ovoid, blunt across narrow end sometimes, subellipsoidal, asymmetrical and elongated. A micropyle was present. The oocysts were pale, cloudy, and greenish to yellowish brown in colour under low magnification (Christensen, 1941 ). An oocyst residuum and polar granules were absent. Sporocysts had a stieda body and an oocyst residuum composed of pale granules of variable number b. Eimeria canadensis: Synonym: Eimeria zurnabadensis: Yakimoff, Christensen (1941 ) described this micropylar species from Alabama calves. The oocysts were regularly ellipsoidal in shape varying from cylindrical to stoutly ellipsoidal with a tapered end. Levine and lvens (1967) described these as ovoid or ellipsoidal, with a smooth wall having no oocyst residuum but a number of splintered polar granules were seen in some oocysts. The sporocyst had a compact balllike residuum and 23 clear globules were present in sporozoites c. Eimeria auburnensis (Christensen and Porter, 1939): These oocysts were typically elongated, ovoid, varying between subellipsoidal and markedly tapered. The micropyle was seen as a gap in the wall at the tapered end covered with thin, black line. The oocyst wall was typically smooth, homogeneous, transparent, and usually yellowishbrown in tint but varying in structure from a transparent homogenous type to a relatively semitransparent
57 and heavily mammillated type. Smooth walled oocysts were present in more hosts than the rough walled. An oocyst residuum was absent. The sporocyst was ellipsoidal with a residuum as one or more compact masses. Sporozoites were commashaped with a large clear globule in the large end and 1 or 2 smaller globules (Levine and lvens, 1967) d. Eimeria bukidnonensis: Eimeria bukidnonensis Tubangui, 1931 This species was first described by Tubangui (1931) from the faeces of a bull from Bukidnon, Mindanao, Manila (Philippines). They were described as yellowish to darkish brown, uniformly pyriform shaped. The oocyst wall had radial striations and was about 2 microns thick except at the micropylar end where it was very thin. The micropyle was conspicuous, being about 4 microns wide. A definite residual body was absent in the oocyst or in the sporocysts. Later Christensen, 1941 described this species in the United States. His oocyst measurements agreed in all features with the description of Tubangui except the size was smaller. Similar descriptions were made by Levine and lvens (1967) and Hiregaudar and Rao (1966) from India. The species were compared with other oocysts from the Philippines, Alabama and Nigeria and found to be generally similar e. Eimeria wyomingensis (Huizinga and Winger, 1942): Synonyms: bukidnonensis Tubangui, 1931 of Christensen, 1938, E. bukidnonensis Tubangui, This species was originally considered as E. bukidnonensis but later identified as a different species with minor differences from E. bukidnonensis. These differences include the oocyst being smaller in size with a smooth wall without striations. The other features were the same as for E. bukidnonensis. Levine and lvens (1967) described the oocysts as ovoid with yellowishbrown to brownishyellow walls, speckled and somewhat rough, composed of a single layer and lined by a membrane. The micropyle was 5 m in inside diameter at the small end of the oocyst. Oocyst residuum and polar granules were absent. Sporocysts were ellipsoidal with narrow end and a tiny stieda body at one end. Sporocyst residuum was generally absent but sometimes present in the form of
58 granules. Sporozoites were wider at one end with a large clear globule at the broader end f. Eimeria brasiliensis: E. braziliensis was described as a new species by Torres and Romas (1939). A notable morphological feature was the presence of a polar cap measuring 8 1 microns wide by 23 microns high. Lee and Armour (1954) found similar oocysts in Vom, Nigeria. The oocysts were yellowish brown, the micropyle was like a dark line beneath the polar cap. The residual body was situated immediately behind the micropyle.
: index CO. Cl> (/)..c. ;; (/) (/) (.!) Shape] E. bukidnonensis 46.85.4 X 25 Present Thick radially Absent Tabangui, 1931 33.337.8: striated. 48.4x35.6: 1.37, Pyriform. E.bukidnonensis 3848x2434 82 18x9 Gill, 1968 I (from Hiregaudar, E.")
59 Oocyst Morpholoav Sporoc vst Morphology > Eimeria species [range N Micropyl Oocyst Polar mean, "'C Author LxW : mean: e wall granul range, E. :l (/) Cl> shape index e shape CO :l Cl> "C a. :l "'C (mean): index CO. Cl> (/)..c. ;; (/) (/) (.!) Shape] E. bukidnonensis X 25 Present Thick radially Absent Tabangui, : striated. 48.4x35.6: 1.37, Pyriform. E.bukidnonensis 3848x x9 Gill, 1968 I (from Hiregaudar, E.bukidnonensis 3846x Bhatia,et al., x (from Hiregaudar) E.bukidnonensis X 153 Lee and Armour , pyriform E.bukidnonensis 32x21, 14.4x6. Patnaik, (from Hiregaudar, E.bukidnonensis 44SOx Present Thick radially Hiregaudar and : striated. Rao, x34 :1.37:Pyrifor m E.bukidnonensis 3241 x243: Christensen 1938 New York. E. bukidnonensis 3341 x2428: 8 Present Christensen, 37x26:1.37: 1941, Alabama. Pyriform E. khurodensis 444x283: Present Mammilated, Rao and 42x29: 1.45: thick Hiregaudar. Ellipsoidal E. wyomingensis 37 45x26.4 Present Huizanqa and 1966) 1966) I ' 41

60 3.8: Winger, x28 : 1.43:void to Elonqate. E. auburnensis X 21 Present Smooth rarely Present Levine and lvens, 27, 41.3 X 2 rough , Elongate ovoid. E. auburnensis x2 Present Smooth Hiregaudar and 26:38.4x23.1 : homogenous Rao, : Elongated ovoid. E. subspherica x Majro and Dipole, E. subspherica X Absent Thin, fragile Lee and Armour, 12.2: transparent, x1 1: 1.6: Subspherical. E. subspherica 1.13x912: Ernst and 11x1.5: Courtney, E. subspherica 913x 812: Absent Transparent Absent Christensen, 11x1.4: , Sub spherical to ellipsoidal E. subspherica x Present Smooth Oda and Nishida, 1.5 colorless wall 199 4:14.5x12.3: 1.19: Spherical to ellipsoidal E. ellipsoidalis 225x142: Smooth walled Absent Levine and lvens, 23.1x16.1 : 1967 ellipsoidal ovoid E. ellipsoidalis X Smooth thin Lee,


61 17.9: walled Ellipsoidal: subspherical, cylindrical E. ellipsoidalis 1 227x1 18: 35 Absent Smooth thin Christensen,.77: walled 1941 Ellipsoidal spherical to cylindrical E. ellipsoidalis 226x1317: Becker and Frye, Ellipsoidal. E. cylindrica. 17 Lee and Armour, 28.4x :.6: E. cylindrica. 1627x12 Christensen, 15: E. cylindrica X Wilson, :.57: E. cylindrica 223x121 7: lnconspi Smooth walled Absent 1216 X granule One or Levine and lvens, 25.3x14.8:1.7 cuous 46, at one more 1967 :elongate 13.7 X end ellipsoid, 5.4, straight sides 2.5. E. canadensis Ovoid or Present Smooth wall Absent Present 23 Levine and lvens, ellipsoidal clear 1967 E. alabamensis 1924x141 6: Absent Thin delicate, Absent Absent Levine and lvens, 2.7x14.8: smooth scatter 1967 pyriform granule E. zuernii X Tabangui, : 17x16.1 :.91 : E. zuernii Absent Thin Lee, 1959 x : homogenous,.91 :1 7.3x15. transparent 7: 43

62 Subspherical Spherical or ellipsoidal. E. zuernii 1522x118: Christensen, 17.8x15.6: : 17.8x15.6 E. zuernii 1823x 16.1: absent Smooth Present Levine and 2.2x 16.1: colorless lvens1967 ovoidal Subspherical, E. brasiliensis 34.2 Smooth Present Torres& 42.75x27.5 Romos, 24.2:29.x22,o 1939 void to regular E. brasilensis Present Supperer, 49.x ,26.5, oval E. brasiliensis X Present Lee and : Armour, x 25.9:1.35: ellipsoidal E. brasiliensis X Present Marquardt, 23.x27.5: x25.1 : ellipsoidal E. bovis Lee and Armour, 32.8x :28.2x2. 9:.74 E. bovis 2334x1723: 5 homogenous Present Christensen, Stout ovoid, transparent ellipsoidal 44

63 asymmetrical and elongated. E. bovis 2434 X 19 Smooth wall present Levine and 22: 26.7 X lvens, : Ovoid E. canadensis x18 Yakamov, 32.4: x25:.73 :cylindrical, Two ends equally rounded. E. canadensis x Bruce, : Ellipsoidal. E. canadensis 295.9x Present Smooth but Present 23 Lee and Armour, 26.8:32.5 X sometimes clear :.75: rough. globule Ovoid or ellipsoidal. E. canadensis Ovoid or Present Smooth wall Absent Small 23 Levine and ellipsoidal rough wall X 69, scattered clear lvens, granules x7.9, 2.32 Table 1.6: Morphological characteristics of oocysts of Eimeria species of cattle. Range L=length, W=width range, mean of length x width, Shape index =ratio of length and width, N= Number of oocysts measured. 45
64 Cryptosporidium: Tyzzer first described this protozoan parasite in 197 in the gastric glands of the laboratory mouse. These parasites measured 6?j..tm, and were named Cryptosporidium muris. Five years later, Tyzzer described a smaller form of the organism, 2 5 m diameter in mice. This was named Cryptosporidium parvum. C. parvum is responsible for calf diarrhoea in New Zealand. Bovine Cryptosporidium infection was first described in 1971 in an 8 old month Santa Gertrudis calf with diarrhoea. In New Zealand the Whangarei Animal Health Laboratory first reported C. parvum in 198 (McSporran, 1983 and 1992). Calves are susceptible to infection for at least for the first 3 months of life. Exposed calves rapidly develop resistance to subsequent challenge. In an infected animal they are generally found in the gastrointestinal tract but may colonize epithelial cells of the trachea, bile duct, conjunctiva, nasal sinuses, salivary glands, small intestine and renal tubules of animals (McSporran, 1992). Young and immunecompromised animals are at greater risk. About 2633% calves with neonatal diarrhoea are considered to be due to Cryptosporidium (McSporran, 1992). Cryptosporidiosis from cattle is zoonotic to human beings. The oocysts are very resistant to physical agents (McSporran, 1992). Cryptosporidiosis is prevalent in many countries and the summary of the recorded prevalence of Crytosporidium and Giardia is shown in Table

65 47 Giardia Cryptosporidium Age Method Authors Country 14% 288% animals 313 Ziehl Bednarska Poland animals days Nielson et al., % 88.7% Calves Ruest et al., Canada, 1998 Alaska, Monitab a. 25% Ziehl Maldonado Mexico Nielsen Camagoes, % 48% New lmmuno Olson et al., Alberta, born 24 fluorescent 1997 British weeks Columbi a 5% 17% 2 days lmmuno Olson et al., British fluorescent 1997 Columbi a 5% ( 3 days) 41 Modified Naciri et al., France 17% days Ziehl 1999 ( 4 day) 995% Nielson (8day) 17.3% 61 4 Sucrose Pena, et al., Brazil month Flotation 1997 cows, calves. 15.2% Birth Bandali et France 3days al., % 13 Modified de la Central days Ziehl Fuente et Spain Nielson al., % 17 Modified de la Central days Ziehl Fuente et Spain Nielson al., % 8 14 Modified de la Central days Ziehl Fuente et Spain Nielson al., % 1521 Modified de la Central days Ziehl Fuente et Spain Nielson al., % 22 3 Modified de la Central days Ziehl Fuente et Spain Nielson al., 1999 Table 1. 7 : A summary of some of the recorded prevalence of Cryptosporidium and Giardia in cattle. 47
66 48 Chapter 2: Identification of Eimeria species in several studies and a redescription of their oocyst morphology 2.1. Introduction: To date, 21 species of Eimeria have been described in cattle (Ernst, 198) Geographical differences in prevalence of different species seems to be common as shown in Table 1.5. lt is usual for multiple species to be observed in any one faecal sample, with an observed average of 3.5 and as many as 8 species present (Oda and Nishida, 1989, McKenna, 1972). Identification of species usually relies on identifying oocysts in faeces. The oocysts of each Eimeria species vary in size, shape and structure, with the combination being unique to a particular species. For some, the sizes and shapes overlap with other species. As described in Section 2.2., the Eimeria species of cattle are divided into 2 broad categories based on the presence or absence of a micropyle. Two studies have been reported in detail on the species of Eimeria present in cattle in New Zealand. In one study, ten species were identified and their prevalence reported (McKenna, 1972). The species were E. bovis (44%), E. zuernii (19%), E. canadensis (14%), E. ellipsoidalis (14%), E. auburnensis (12%), E. alabamensis (7%), E. cylindrica (5%), E. brasiliensis (4%), E. wyomingensis (3%) and E. subspherica (2%). E. bukidnonensis was subsequently identified later by the same author (McKenna 1974 ). In the second New Zealand study, Arias (1993) described seven species. In this second study the species E. canadensis was the most common with a prevalence of 37% followed by E. bovis (16.6%), E. zuernii (15.7%), E. auburnensis (12.2%), E. ellipsoidalis (6%) and E. alabamensis (6%), E. cylindrica, E. subspherica, E. bukidnonensis and E. pellita were not found in this second study. The aim of the research reported in the current chapter was to redescribe the various species identified in all the various studies reported in other chapters and compare these descriptions with those previously published descriptions. Identification is based on a combination of various features and measurements and the aim was to determine how each species fitted previous descriptions. In 48
67 addition, the prevalence of each species was determined over the 3 main studies conducted during this research Materials and Methods: Oocysts were recovered and sporulated from studies described in Chapters 3, 4, and 5. See Appendix 3.3. for a description of the technique used. Oocysts were generally identified using the keys provided by Christensen (1941 ) and Levine and lvens (1967). For each species, at least 1 oocysts were measured and redescribed, except for less common species where only a few oocysts were available for measurement. The parameters recorded were : presence or absence of a polar cap; micropyle shape; oocyst width; oocyst length; length: width ratio; presence and character of the oocyst residuum; a stieda body; presence and character of the sporocyst residuum. A variety of terms are used to describe the general shape of oocysts and is in common usage without formal definitions of their meaning. These terms and a description of their meaning are as follows: Pyriform: pear shaped. Oval or ellipsoidal: oocyst shaped like a circle that is flattened, so that it is oval or an ellipse. The oocyst is not exactly circular in shape but is generally symmetrical but may taper at one end and be broader at the other end and slightly round in appearance. Ovoid: approaching being spherical or round but not tapered as for oval or ellipsoidal but more towards being round. Sub spherical : almost spherical but not an exact circle. Similar to ovoid but closer to being a true sphere. Spherical or Round: exactly circular in shape. To determine the prevalence of species within a study at least 3 oocysts were identified from one faecal sample from each animal on each occasion. For an animal to be considered infected, the species was identified in that animal on atleast one occasion. Since many samples had few oocysts this was only estimated from those animals with a reasonably high oocyst count to make the 49
68 observation practically feasible. The overall prevalence of species was calculated by determining the mean prevalence over all 3 studies. To obtain a measure of the predominant species the total number of oocysts of each species in a study that were identified was pooled and divided by the overall grand total of oocysts identified in that study to be expressed as a percentage. For all 3 studies the data from individual studies were pooled and the overall predominance of each species was expressed as a percentage Results: Prevalence and predominance of species identified at Massey No.4 Farm (See Chapter 3): Although this study continued for over 3 months, in total oocysts were recovered and identified in only 12 individual faecal samples from separate animals due to generally low oocyst counts throughout the study. The raw counts are shown in Appendix Only 1 different species were identified. They were in order of decreasing prevalence as follows (with prevalence as %): E. zuernii (1%), E. bovis (83.3%), E. auburnensis (75%), E. cylindrica (66.6%), E. bukidnonensis (58.33%), E. ellipsoidalis (41.6%), E. subspherica (33.3%), E. canadensis (25%), E. alabamensis (25%), and E. wyomingensis (16.66%). Data is summarised in table Prevalence and predominance of Eimeria species identified at Tuapaka Farm (See Chapter 4): In this study 81 young calves were faecal sampled at weaning and again at weekly intervals for 5 weeks with about half given a coccidiocide at weaning. Only 33 calves were used for estimation of prevalence where at least 3 oocysts could be recovered for identification. A total of 11 Eimeria species were identified on this farm. The raw data are shown in Appendix and a summary in Table 2.1. In order of decreasing prevalence the species identified were E. zuernii (98%), E. bovis (9%), E. auburnensis (6.6%), E. cylindrica (33.3%), E. canadensis (18.18%), E. wyomingensis (15.1 5%), E. bukidnonensis (12.12%), E. subspherica (9.1 %), E. alabamensis (9.1 %), E. brasiliensis (9.1 %) and E. el/ipsoidalis (6.6%). Summary is shown in Table
69 Prevalence and Predominance of Species identified in studies on other farms (see Chapter 5): Oocysts were identified in 8 faecal samples from other calves in all remaining studies and a total of 1 species were identified. These 8 samples were obtained from 5 individual farms (Appendix 2.4.3). On some occasions several samples were pooled from the one group of animals because of low oocyst counts. In order of decreasing prevalence the species identified (and their prevalence) were: E. bovis (87.5%) followed by E. zuernii (87.5%), E. auburnensis (5%), E. wyomingensis (37.5%), E. bukidnonensis (37.5%), E. canadensis (37.5%), E. subspherica (37.5%), E. brasiliensis (25%), E. cylindrica (25%) and E. ellipsoidalis (25%). By far the two most predominant species were E. bovis and E. zuernii. Data is summarised in Table
 u; Eimeria Species Prevalence % Predominance % E. zuernii 1. 98. 87.5 95. 25.1 28.5 25.8 26.5 E. bovis 83.3 9. 87.5 87. 19.1 46. 28.3 31.1 E. auburnensis 75. 6.6 5. 62. 16. 9.7 11.1 12.")

70 52 > "C ::s.:t U) C") en E c:: Q,) U) z Q,) nj > Q,) nj nj > >.::t:. >.::t:. LL U) U) Q,) nj "C Q,) nj Q,) E U).:t a. c:: ::s U) a. Q,) c:: U) nj nj nj a> en nj Q,) ::s 5 cu U) nj.s::. cu "C LL z C") u; Eimeria Species Prevalence % Predominance % E. zuernii E. bovis E. auburnensis E. cylindrica E. canadensis E. wyomingensis E. el/ipsoidalis E. subspherica E. alabamensis E. brasiliensis E. bukidnonensis Table 2. 1: Prevalence (%) and predominance (%) of Eimeria species from all three studies Prevalence and Predominance over the 3 studies. The overall prevalence and predominance are summarized in Table 2.1. The two most prevalent species were E. zuernii (95.2%) and E. bovis (87%) followed by E. auburnensis (62%), E. cylindrica (42%), E. bukidnonensis (36%), E. canadensis (31 %), E. subspherica (27%), E. ellipsoidalis (24%), E. wyomingensis (23%), E. alabamensis (12%) and E. brasiliensis (1 2%). The most predominant species was E. bovis (31.1%) followed by E. zuernii (26.5%), E. auburnensis (12.7%), E. bukidnonensis (6.8%), E. cylindrica (6.3%), E. wyomingensis (5.3%), E. canadensis (4.4%), E. ellipsoidalis (1.9%), E. brasiliensis (1.9%), E. subspherica (1.5%), and E. alabamensis (1%) Species Description: A summary of the basic morphological features of the oocysts of 11 bovine Eimeria species found in these studies is shown in Table 2.2. A sample of 1 oocysts was measured for 8 species and fewer for three species (E. alabamensis, E. subspherica, and E. brasiliensis) because only a few oocysts 52
71 were recovered for them. The sporulated oocysts of each species were then described in detail and comparison with previous descriptions is discussed. Identification of individual oocysts is time consuming, as it includes scoring many parameters apart from size and shape. The shapes of many oocysts overlap with each other such as E. zuernii with E. ellipsoidalis, E. ellipsoidalis with E. bovis, E. bovis with E. canadensis, E. wyomingensis with E. bukidnonensis etc. Each oocyst has a wide range of length and width which is confusing and makes identification, based purely on size difficult. For example, the length and width of E. canadensis has a range which overlaps with E. bovis and E. auburnensis. Sporocyst structure is often difficult to determine. lt differs with the angle of exposure under a microscope and overlapping of sporocysts makes it difficult to clearly measure the sporocyst and identify features such as the sporocyst residuum and large refractile globules in the sporocyst. Though there are many published papers with descriptions of species, the pictures given are often not very useful and are not the same all the time
 2 E. ellipsoidalis 2. 29.6 X 1.96 oval or thin +Ve +Ve +Ve 12 ve 25., 24.7 X 18.5, 1.4 ellipsoidal 3 E. bovis 2. 32.")
72 Species Size m (L R x W R), Shape Cell wall Stieda Polar Oocyst Colour Refractile Micropyle Mean Length, Mean body granule Residuu bodies Width, mean LIW ratio m 1 E. zuernii X , oval thin +ve +Ve +Ve 2{large ve 19.6 X 16.2, 1.2 distinct scattered at base) 2 E. ellipsoidalis X 1.96 oval or thin +Ve +Ve +Ve 12 ve 25., 24.7 X 18.5, 1.4 ellipsoidal 3 E. bovis X 14. oval thin +Ve +Ve 2{one ,23.9 X 18. 1, 1.3 flattened large at V at one end base) e 4 E. cylindrica x , cylindrical thin +Ve +Ve +Ve 2 ve 23.7 X 6.5, 1.5 distinct (centre) 5 E. subspherica X 7.2 spherical thin +Ve ve 7.,11.9 X 13.5, E. canadensis X , stout ovoid moderate +Ve +Ve +Ve yellow is 23 +Ve 21.9 x29.1, 1.4 flattened thick (centre) h end 7 E auburnensis X , oval, thin +Ve +Ve yellow is 2 +Ve 36.9 X 25.1, 1.5 flattened distinct h end 8 E. bukidnonensis X , pyriform thick +Ve ve dark 2 +Ve 31.9 X 47., 1.5 distinct 9 E. wyomingensis X , pyriform thick +Ve yellow is 2 +Ve 39.4 X 27.9, 1.4 h 1 E. brasiliensis X , +Ve 37. X 29.4, E. alabamensis X , 2 to 3 ve 2.3 X 15.3, 1.4 I Table 2. 2: A summary of the key morphological characteristics of sporulated oocysts of bovine Eimeria species. Note: L=Length, W=width R=Ratio of Length and width. VI
73 E. alabamensis, Christensen, 1941 Description: Oocysts (Piate.2.6) were ovoid but tapered at one end. Micropyle was absent. Oocyst wall was thin. The sporulated oocysts were m (L) by m (W) and with a mean of 2.3 m (L) x15.3 m (W). Their length: width ratios ranged from with a mean of 1.2. Oocyst residuum was absent. Scattered polar granules were present. Sporocyst was elongated with a tiny stieda body. Sporocyst residuum was absent and sporozoites had 2 to 3 clear globules each. Discussion: The oocysts looked similar to E. bovis, but were smaller in size and devoid of a micropyle. These descriptions are similar to those of Levine and lvens (1967). The parachute shaped cap was not seen. As observed by Levine and lvens (1967) oocyst and sporocyst residuum were not seen E. auburnensis, Christensen and Porter, Description: Oocysts (Plate 2.1) were elongated and ovoid being flattened at the smaller end. A micropyle was present at the smaller end. Oocyst wall was generally smooth but sometimes rough and thin at the broad end. The micropylar end was even thinner. The oocysts were m (L), m (W) with mean 37. m (L) x 25.1 m (W). Their length: width ratios ranged from with a mean of 1.5. Polar granules were present. Sporocyst elongated with one end smaller than the other. Stieda body was present. Sporocyst residuum was present as a compact mass or sometimes as scattered granules. Sporozoites possessed a large clear refractile globule and a small globule. Discussion: The descriptions are equivalent to the descriptions of Levine and lvens (1967). The rough oocyst wall appeared as if the wall is striated, but the presence of a sporocyst residuum, thick wall and shape of the oocyst made them distinct from E. bukidnonensis E. bovis: (Zublin, 198), Fiebiger, (Synonym: Eimeria zurnabadensis: Yakimoff, 1931) Description: Oocysts (Plate 2.1) were ovoid with a flattened end. The oocyst wall was smooth. A micropyle was present at the smaller end. Sporulated
74 56 oocysts were 2. to 32. m (L) x 14. to 24.4 m (W) with a mean of 23.9 m (L) x 18.1 m (W). The length: width ratio ranged from with a mean of 1.4. Oocyst residuum was present in some but a polar granule was absent. Sporocyst was elongated with a stieda body at the smaller end. A sporocyst residuum was present. Sporocysts had one large globule at the base and a small globule at the smaller end. Discussion: Similar to the descriptions of Levine and lvens (1967) and Christensen (1941 ). This species was typical of earlier descriptions. The oocyst residuum was visible in a few oocysts. Sometimes the indistinct micropyle made it difficult to distinguish from E. ellipsoidalis, but the sporocyst structure made it distinct from the latter E. brasiliensis: Torres and Ramos, Description: Oocysts (Plate 2.4) ellipsoidal, smooth walled. Both a micropyle and micropylar cap were present. An oocyst residuum was absent but scattered polar granules were present. The sporulated oocysts were 27.2 to 48. J..Lm (L) x 2.6 to 41.4 J..Lm (W) with a mean of 37.6 J..Lm (L) x 29.4 J..Lm (W). Their length: width ratio ranged from with a mean of 1.3. Sporocysts were elongated, ellipsoidal with a distinct stieda body. A sporocyst residuum was present as scattered granules. Sporozoites were elongated and contained one large refractile globule at each end. The sporocyst residuum was scattered in the middle. Discussion: This species is considered a rare species, but some oocysts were seen in two faecal samples in this study. Morphologically they were similar to the earlier descriptions. Presence of a micropylar cap made them distinct from other species but sometimes if the micropylar cap was lost during the processing this oocyst resembled E. canadensis, which leads to some potential for confusion. However, their size was always comparatively larger than E. canadensis E. bukidnonensis, Tabangui, Description: Oocysts (Plate 2.3) were pyriform. The oocyst wall was yellowish brown, radially striated, very thick, and wrinkled at the smaller end. A micropyle was present. The sporulated oocysts were m (L) x m
75 57 (W) with a mean m (L) x m (W) and their length: width ratios were1.1 2., with a mean of 1.5. Oocyst residuum and polar granules were present although in some, the polar granules were absent. Sporocysts were elongated with an indistinct stieda body. The sporocyst residuum was present as scattered small granules. Sporozoites were pointed at one end with large clear refractile globules at each end. Discussion: The yellowish tinge of the oocyst and its large size, the shape of the sporocyst and the striations of the oocyst made it easy to identify this species. Sometimes higher magnifications were needed to see the striations. Many earlier authors reported an absence of a sporocyst residuum, but all the oocysts in the present study had a scattered granular sporocyst residuum as described by Levine and lvens (1967). For a few oocysts it was difficult to appreciate the striations but the size was used as the criterion to identify them, as this species was the largest of all the species. The distinct pyriform shape, large size, dark yellowish brown colour and striations of E. bukidnonensis made it different from E. wyomingensis E. canadensis, Bruce, Description: Oocysts (Plate 2.2) were slightly ovoid/ ellipsoidal to cylindrical with a flattened smooth thin wall, which was yellowish coloured. A micropyle was present but sometimes not very distinct. Sporulated oocysts were m (L) x m (W) with a mean of m (L) x m (W). The length: width ratio is with a mean of An oocyst residuum was absent, but scattered polar granules were present. The sporocyst was elongated and ovoid. A stieda body was present sometimes, but was not very distinct. A sporocyst residuum was present as a compact ball or scattered granules. Sporozoites each contained 2 to 3 clear refractile globules. Discussion: The morphology is similar to the description of Christensen (1941) and Levine and lvens (1967). The oocysts were slightly smaller than in earlier descriptions and the shapes varied from ellipsoidal to cylindrical which confused the identification of this species. On occasions these oocysts were similar in internal structure to E. brasiliensis, which is an oocyst with a micropylar cap. However, when these caps, which were very fragile, were lost during
76 58 processing, oocysts resemble E. canadensis. Smaller sized oocysts can be misidentified as E. bovis and larger as E. brasiliensis E. cylindrica, Wilson, Description: Oocysts (Plate 2.5) were elongated, ellipsoidal to cylindrical, with relatively straight sides. They had a colourless oocyst wall, which was smooth and thin at the smaller end. Sporulated oocysts were m (L) x m (W) with a mean of 29.9 m (L) x 21.1 m in (W). Their length: width ratios ranged from 1.2. with a mean of 1.5. The oocyst polar granule was scattered as small fragments. The elongated sporocyst had a distinct stieda body. Sporocyst residuum was present as a compact ball or mass, and 2 to 3 clear refractile globules were present in the sporozoites. Discussion: The descriptions of these oocysts are similar to those of Levine and lvens (1967) and Christensen (1941 ). The typical shape of E. cylindrica and its size makes it relatively straight forward to identify, but it could be confused with E. canadensis and E. ellipsoidalis oocysts E. ellipsoidalis, Becker, Frye, Description: Oocysts (Plate 2.5) were ellipsoidal in shape. The oocyst wall was smooth, colourless and the micropyle was absent. Sporulated oocysts were m (L) x m (W) with a mean of 24.6 m (L) x 18.5 m (W). Their length: width ratios ranged from with a mean of The oocyst residuum was absent. Oocyst polar granules were present on most, but not all, occasions. The sporocyst was elongated, with an indistinct stieda body. Sporocyst residuum was present, either as a compact mass or as scattered granules. Sporozoites had one large and one small clear refractile globule. Discussion: These oocysts are potentially confused with E. bovis, as they have a wide range of size and shape. These descriptions are similar to Lee (1954), Becker and Frye (1929) and Christensen (1941 ) E. subspherica, Christensen, Description: Oocysts (Plate 2.5) were spherical to subspherical. Oocyst wall was smooth and thin. Micropyle was absent. These were the smallest oocysts of cattle. Oocysts were m (L) x m (W), with a mean of 13.4
77 59 m (L) x 11.8 m (W). Their length: width ratio ranged from with a mean of 1.1. Oocyst residuum and polar granules were absent. Sporocyst was elongated with a tiny stieda body. Sporocyst residuum was absent. Sporozoites had a clear globule at the larger end. Discussion: These oocysts matched with the descriptions of Christensen (1941 ). The size (these were the smallest oocysts) seen and then the special structure of the oocysts, with a distinct stieda body made identification straight forward E. wyomingensis, Huizinga and Winger, Description: Oocysts (Plate 2.2) were pyriform, had a thick oocyst wall and were yellowishbrown in colour. A micropyle was present at the smaller end of the oocyst. Sporulated oocysts were m (L) x m (W) with a mean of 39.4 m (L) x 27.9 m (W). Their length: width ratios ranged from with a mean of 1.4. Oocyst residuum and polar granules were absent. The sporocyst was elongated with an indistinct stieda body. The sporocyst residuum was present in the form of granules. Sporozoites had a large clear globule at their base. Discussion: Many earlier reports described E. bukidnonensis, Tabangui, 1931 and this species as being the same, but later reports described both as separate species with slight differences in the oocyst wall. In this study, these oocysts had smooth walls, which separates them from the earlier species and the sporocyst residuum was present in the form of scattered granules E. zuernii, (Rivolta, 1878) Martin, 199. Description: Oocysts (Plate 2.6) were spherical to ovoid in shape. The oocyst wall was smooth and colourless. A micropyle was absent. Sporulated oocysts were m (L) x m (W), with a mean of 19.5 m (L) x 16.2 m (W). Their length: width ratios ranged from with a mean of 1.2. No oocyst residuum was seen and the polar granules were scattered. The sporocyst was ovoid with an indistinct stieda body. The sporocyst residuum was present as a compact mass or sometimes as fine granules. The sporozoite had a large clear globule at the base of its broad end.
78 6 Discussion: The descriptions are similar to the earlier descriptions of Lee (1947), Tabangui (1931 ), Christensen (1941), and Levine and lvens (1967). The oocyst descriptions were very clear, and as it was the most predominant species, E. zuernii was easily identified. However, there was overlap with oocysts of E. ellipsoidalis. The ovoid shape of E. zuernii sometimes resembles E. ellipsoidalis, but the number of 2 clear globules differentiates it from E. zuernii. The smaller sized, spherical oocysts resembled E. subspherica, but the latter was much smaller and lacked a sporocyst residuum. The following Plates represent each species isolated in this study. They are all shown to the same scale.

79 61 Plate 2.1. Species with Micropyle 1 : 1. E. auburnensis 2. E. auburnensis 3. E. auburnensis 4. E. auburnensis 5. E. bovis 6. E. bovis


80 62 Plate Species with Micropyle 2: 7. E. canadensis B. E. canadensis 9. E. canadensis 1. E. wyomingensis 11. E. wyomingensis 2...


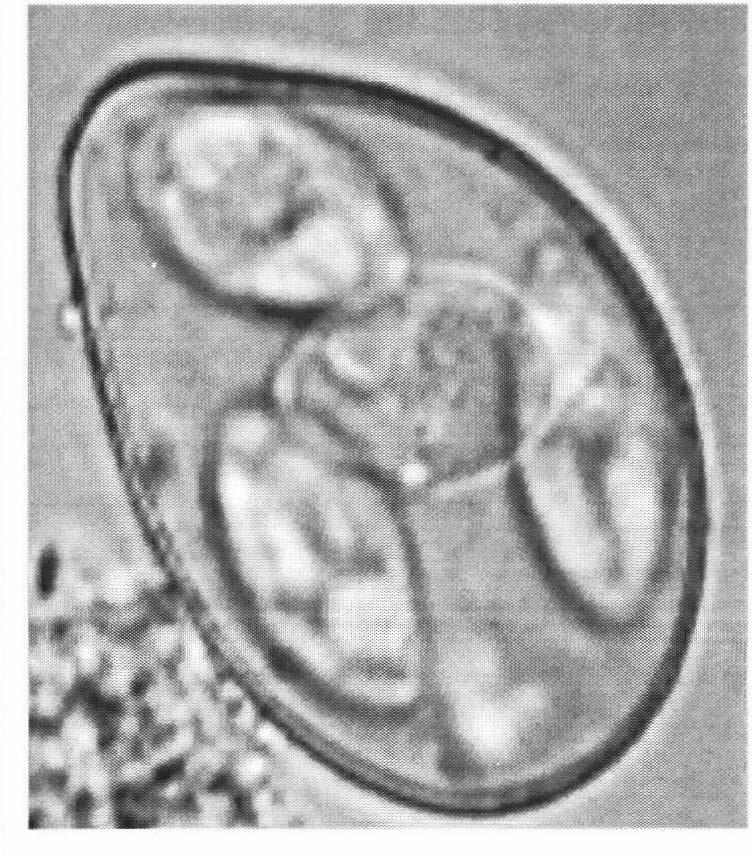
81 63 Plate 2.3. Species with Micropyle 3: 12. E. bukidnonensis (1 OOx) 13. E. bukidnonensis 14. E. bukidnonensis 15. E. bukidnonensis


82 64 Plate 2.4. Species with Micropyle 4: 16. E. brasiliensis 17. E. brasiliensis 18. E. brasiliensis 19. E. brasiliensis +2


83 65 Plate 2.5. Species without Micropyle 1 : 2. E. cylindrica 21. E. cylindrica 22. E. cylindrica 23. E.cylindrica 24. E. ellipsoidalis 25. E. ellipsoidalis 26. E. ellipsoidalis 27.E. ellipsoidalis E. subspherica 29. E. subspherica 3.E. subspherica 31.E. subspherica


84 66 Plate 2.6. Species without Micropyle 2: 31. E. zuernii 33. E. zuernii 34. E. zuernii 35. E. zuernii +2D!J


85 67 Plate 2.6. Species without Micropyle 2: 36. E. alabamensis 37. E. alabamensis 38. E. alabamensis 39. E. alabamensis.2
86 68 bovis (87%} followed by E. auburnensis (62%), E. cylindrica (42%), E. bukidnonensis (36%), E. canadensis (31 %), E. subspherica (27%), E. ellipsoidalis (24%), E. wyomingensis (23%), E. alabamensis (12%) and E. brasiliensis ( 1 2%). The most predominant species was E. bovis (31.1%) followed by E. zuernn (26.5%), E. auburnensis (12.7%), E. bukidnonensis (6.8%), E. cylindrica (6.3%), E. wyomingensis (5.3%), E. canadensis (4.4%}, E. ellipsoidalis (1.9%), E. brasiliensis (1.9%}, E. subspherica (1.5%), and E. alabamensis (1%). In earlier reports McKenna (1972 and 1974) also identified 11 species from New Zealand where the prevalence of different species vary slightly from this study but most predominant species were E. bovis (44%) and E. zuernii (19%) like this study. In a second study, Aria, 1993, isolated only 7 species and the predominant species was E. canadensis followed by E. bovis. The prevalence of Eimeria species differ globally (Table 1.5). This could be the reason for differences between the studies. As this study included animals from several different farms is true representative of New Zealand than earlier studies. Presence of multiple species in one animal is very common with Eimeria species. An average of 3.5 species in one animal was observed earlier (Oda and Nishida, 1989; McKenna, 1972) was also noted in this study with a range of 38 species in one animal. Most of the oocysts fitted with earlier descriptions.
87 69 Chapter 3. Study at Massey Number 4 Dairy Farm Introduction: Coccidiosis is a disease of calves mainly seen in the age group of one month to a year old. Adults may be infected but almost never develop clinical signs. The infection is transmitted through ingestion of sporulated oocysts in contaminated feed, pasture, water and licking of contaminated surfaces. Disease is commonly linked to poor hygiene and higher stocking densities. The topography of the paddock, drainage facilities, placement of feed and water sources, pasture cover in the paddock, number of animals in the paddock and presence of adult cows grazing together with young stock will all influence the development of the disease. For dairy calves raised separately from their mothers, it is difficult to avoid infection. To further lower the risk, farmers add coccidiostats to the feed to keep the coccidial burdens low. Normally, monensin, a coccidiostat, is added to the calf milk replacer and calf meal. There are reports that, shortly after the feed is withdrawn at weaning disease seems to occur. Presumably weaning stress is an important factor in the development of the disease. The stress may also be due to transport, feed change, inclement weather, vaccination etc. The objectives for this particular study were: 1. To investigate the effect of monensin on growth rate, production of oocysts and the development of immunity up until weaning by comparing calves fed meal containing monensin with those fed meal without monensin. 2. To determine the effect of the treatment of the calves with the coccidiocidetoltrazuril (2mg/kgbody weight) orally at the time of weaning on post weaning coccidiosis and productivity in terms of weight gains Materials and Methods: Trial design: This replicated study initially compared calves fed meal with or without monensin and comprised a total of 24 calves setstocked as 6 groups of 4 calves in 6 areas subdivided from one paddock on Massey University's No 4 Dairy Farm. All were fed whole milk, supplemented with increasing quantities of
88 calf meai(see Appendix 3.2) Three of the groups (MG1, MG2 and MG3) were fed calf meal with the coccidiostat monensin mg of meal and the other three (NMG1, NMG2 and NMG3) were fed calf meal without any coccidiostat included. The rearing practice in terms of rations fed was the same as for other nonexperimental calves on this farm. The coccidiostat added was monensin ("Monensin premix") and the meal was a standard calf meal (See Appendix 3.1.a). The calves were weaned when the average weight was 1 kgs. At weaning half of the calves (2) from each group were selected randomly and drenched with toltrazuril 2mg /kg body weight (Baycox Piglet Coccidiocide, Bayer Australia Ltd) (Refer to Appendix 3.1 b). After weaning the calves were kept in a single mob in an area equivalent to two of the initial groups. The calves were kept in 2 cells as the grass was plentiful. The trial commenced of 1 4th August 22 (Day 1) with weaning occurring on 24 t h October (Day 72) and the trial ended on 1 December (Day 113). The calves were born between 1 July to 4 August and at the commencement of the study the average was 2.5 weeks. These calves were randomly allocated into 6 groups. The detailed feeding regime and other managerial activities are shown in the table in Appendix Paddock preparation and sub division: The paddock had been grazed by adult cows over winter and had been topdressed with urea (23/7/2) to ensure adequate grass was available for setstocking of calves. lt had not been used in the past for calf rearing. This paddock was divided into 6 cells with electric fences. The calves were setstocked at a rate of 4 calves in a grazing area of.68 ha, equivalent to about 6 calves/ha. A shed suitable to shelter 4 calves was placed in each cell. A set of portable yards was constructed adjacent to the paddock for the purpose of weighing and sampling animals. Each cell contained a feed and water trough. Water was available ad lib throughout the trial Husbandry practices: The calves were moved to the experimental area at an average age of 2.5 weeks. They were initially fed on whole milk twice a day for the first week under experiment and then once a day until 75kg body weight. Initially they were on a 7
89 daily allowance of calf meal starting at 1 OOg/calf/day in the second week and increasing by an extra 5g/day each week to a maximum of 1 kg/day. Their initial milk allowance was 41itres/day increasing to 51itres/day on once a day feeding and then reducing by one litre per week until reaching 75kg bodyweight. From 75kg until weaning at 1 OOkg they were fed meal only. The composition of the calf pellets is shown in Appendix 3.1.a. The standard calf rearing practice of Massey University dairy farms was followed. Initially, the young calves were held at the No. 4 calf unit and established on twice daily whole milk feeds from one day of age. On Day 43 of the experiment (25 th Sept.) a group of 2 cows were kept overnight to reduce the pasture level as it was overgrown. This was repeated on Day 49 (11 th Oct.) The calves were disbudded on 16th October. On Day 111 (2 n d Dec) a few calves were noted to be coughing so lungworm larval counts were assessed and most of the calves were shedding lungworm larvae so all calves were treated with anthelmintic for lungworm. The calves were maintained up to Day 113 (1Oth Dec) in this paddock under daily supervision. The feeding and other activities on the farm are shown in Appendix Sample collection: Each calf was faecal sampled twice per week for the first 3 weeks and then once a week until 7 weeks postweaning. The technique was rectal stimulation of defaecation. In addition, once a week the calves were weighed on a Micropower 2 (Donald Presses Ltd, Masterton New Zealand) electronic scales and a 1 Oml blood sample, from the jugular vein, was collected for recovery of serum and subsequent determination of anticoccidial antibodies Examination of individual samples: Faecal samples were screened for coccidia throughout the experiment and the positive samples with high counts were sporulated for species identification. A faecal oocyst count (FOC) was carried out on a 2g sub sample of each sample collected. In addition, oocysts were recovered, if present, from a further subsample and sporulated, and the species present were described in a random sample of 1 oocysts. 71
90 In brief, oocysts were counted using a modified McMaster technique, using saturated NaCI as the flotation medium, where each oocyst counted represented 5 oocysts/g (see Appendix ). Oocysts were recovered from positive samples as described in Appendix and In brief, a 5g sample of faeces was homogenized in water, subjected to flotation in saturated salt, oocysts were recovered from the supernatant, washed in water, centrifuged, recovered and sporulated at 2rc for 7 days in a shallow dish containing 2% H2S4. Sporulated oocysts were recovered as per procedure in Appendix To determine the prevalence of species within an animal, 3 oocysts were identified. This was only done from those animals with a reasonably high oocyst count to make the observation practically feasible. The percentage of individual species in this study was then calculated to find out the prevalence of individual species. Faecal samples were also screened for Cryptosporidium and Giardia from Week 1 to 5 and Giardia on Week 1. On the first occasion, a commercial direct fluorescence procedure (MERIFLUOR: Meridian Diagnostics) which detects Cryptosporidium and Giardia (see the Appendix 3.3.5) was used. Subsequently, faecal smears were stained with a modified Zeihl Neilson stain (see the Appendix 3.3.4) 3.3 Statistical analysis: Faecal oocyst counts: Arithmetic weekly mean oocyst counts were analyzed after square root transformation to normalise the data (Snedecor and Cochran, 198). Data for live weight (LW) and transformed FOG were analysed using the MIXED procedure of SAS (21). The linear model included the fixed effects of week, treatment either with "monensin" (preweaning or with toltrazuril postweaning) and the interaction between week X treatment, and the random effect of replication. A replicate comprised a group of 4 animals for monensin up to weaning and 12 animals for toltrazuril after weaning. Using Akaike's information criterion, a compound symmetric error structure was determined as the most appropriate residual covariance structure for repeated measures over time within animals. 72
91 Live weight: Live weight was analyzed using the MIXED procedure in SAS (21 ). The model included the fixed effects of treatment with either monensin or toltrazuril (treated nontreated animals), time, their interaction and the random effect of animal within treatment. Using the Akaike's information criterion, a compound symmetry error structure was determined as the most appropriate residual covariance structure for repeated measures over time within animals. Least square means and their standard errors (SE) were obtained for the 11 weeks pre weaning and the 7 weeks post weaning Combined effect of two anticoccidial treatments on oocyst counts up to weaning: Statistical analysis was also carried out to see whether there was any effect of combined treatment with two anticoccidials (monensin + toltrazuril) as some animals received both drugs. Data for transformed FOC were analyzed using the MIXED procedure of SAS (21 ). The linear model included the fixed effects of week, treatment with monensin (preweaning) or with toltrazuril (post weaning), interaction between monensin and toltrazuril and the interaction between week X treatment (with toltrazuril + monensin). A replicate comprised a group of 6 animals. Using the Akaike's information criterion, a compound symmetric error structure was determined as the most appropriate residual covariance structure for repeated measures over time within animals Results: Oocyst counts up to weaning: The oocyst counts were very low in all the calves up to the 4 th collection or 2.5 weeks of treatment. Thereafter the oocyst counts rose to reach peak levels at ih collection or after 3.5 weeks of treatment. Then the oocyst counts started to decline to low levels, almost to their initial low levels, during collections 14 to 16 or 5 to 11 weeks on treatment. The monensintreated groups (MG2, MG3) had higher oocyst counts from the 3 r d and 5 th week but thereafter the nontreated groups (NMG1, NMG2, NMG3) and the monensintreated groups had similar oocyst counts (see Appendix for raw data). The highest counts in their respective groups were for MG2 and NMG1.
 oocyst counts were determined for both Treatmentwise and Groupwise and the summary of ANOVA is shown in Table 3.1.")
92 The FOC of all the samples were pooled to calculate the group mean (Groupwise) oocyst counts and treatment mean (Treatmentwise) oocyst counts. Least square mean (LSM) oocyst counts were determined for both Treatmentwise and Groupwise and the summary of ANOVA is shown in Table 3.1. The Groupwise and Treatmentwise arithmetic mean oocyst counts and the least square mean oocyst counts (Groupwise and Treatmentwise) in calves up to weaning are shown in Figs: 3.1, 3.2, 3.3 and 3.4. As shown in Table 3.1, there was no significant difference between monensintreated and nontreated calves (p=.6) and the LSM oocyst counts of both treated and nontreated calves showed similar patterns all through the experiment. The effect of week was significant (p<.1 ) indicating the oocyst counts varied over time. Full details of this statistical analysis are shown in Appendices and I 14 Cl ffi ; 6 4 MG1 MG2 _..._ MG3 NMG1, NMG2 NMG WEEKS ON TREATMENT Figure 3. 1: Comparison of arithmetic mean oocyst counts of groups of calves up to weaning fed meal containing monensin (M) and calves fed meal without monensin (NM). Each group (G1 3) comprising 4 calves.
 and calves fed meal without monensin (NM).")
 c: :::l U) > c: m Q,) :le L 1 9 8 7 6 5 4 3 2 1 + No Monensin NM Monensin M 1 2 3 4 5 6 7 8 9 1 11 12 13 14 15 16 17 Sampling occasions Figure 3.")
93 i 12 1 i MG1 MG2.. MG3 NMG1 NMG2 NMG WEEKS ON TREATM ENT Figure 3. 2: Comparison of least square mean oocyst counts of groups of calves up to weaning fed meal containing monensin (M) and calves fed meal without monensin (NM). Each group (G13) comprising 4 calves. Cl a. I U) c: :::l U) > c: m Q,) :le L No Monensin NM Monensin M Sampling occasions Figure 3. 3: Comparison of arithmetic mean oocyst counts of calves up to weaning fed meal containing monensin (M) and calves fed meal without monensin (NM) by sampling occasion. Calves were sampled twice a week for the first 3 weeks and then once a week. Each group consisted of 12 animals.

. Each group consisted of 12 animals. The error bars represent the standard error.")

94 g 35 l 3 c: 25 g , r r r r r r r r r r r r r + No monensinnm MonensinM SE Sampling occasions Figure 3. 4: Comparison of least square mean oocyst counts of calves up to weaning either fed meal containing monensin (M) or fed meal without monensin (NM). Each group consisted of 12 animals. The error bars represent the standard error. Effect Numerator Denominator F Value Pr>F OF OF Week <.1 Treatment Rep RepXTreatXWeek Table 3. 1: Summary of the statistical results for a repeated ANOVA of oocyst counts up to weaning As shown in Fig 3.5 the calves being fed meal which included monensin received less than the required amount of monensin in the feed for the initial 4
 7 6 c:: 5 4 3 E 2 1 o REQUI RED CON ACTUAL CON 11. 1 I. 1 I. I. 1 1 1 I. 1 2 3 4 5 6 7 8 9 1 weeks on treatment Figure 3.")
95 weeks. But from the 5 th week onwards the calves received the recommended dose, which is 1 mg/kg body weight. (See Appendix 3.7 for full details) C) 7 6 c:: E 2 1 o REQUI RED CON ACTUAL CON I. 1 I. I I weeks on treatment Figure 3. 5: Monensin consumption (mg/kg feed) compared to required consumption by calves preweaning based on their weekly average live weights Oocyst counts after weaning: Fig 3.6 and Fig 3.7 show the mean and least square mean oocyst counts respectively for groups treated with toltrazuril or not treated with toltrazuril at weaning. As shown in Fig. 3.6 and Fig 3.7 the oocyst counts of the calves treated with toltrazuril remained low, whereas the oocyst counts of the untreated calves increased from the first week to reach a maximum level during the third week. Thereafter, their counts declined to reach their lowest level similar to the initial level by the 6 th week post treatment. Interestingly, the counts of the treated and nontreated calves were almost similar from the 4 th week.
96 78 12 a. 1 t/) t: 8 :::J (.) 6 t/) > (.) 4 t: cu 2 J=. No To ltraz u ril l: Toltrazuril ' weeks post treatment 6 7 Figure 3. 6: Arithmetic mean of oocyst counts for calves after weaning either treated with toltrazuril 2 mg/kg body weight or not treated with toltrazuril, each group consisting 12 animals. Treatment on Week Zero. 3 (/) c :I Toltrazuril No Toltrazuril (/) > 15 1 :: (f)...j weeks post treatment Figure 3. 7: Least square mean oocyst counts for calves after weaning, either treated with toltrazuril or not treated with toltrazuril, each group consisting of 12 animals. Note : Treatment given at Week.
97 79 Effect Numerator Denominator F Value Pr>F DF OF Week <.1 Monensin Toltrazuril ToltXMon ToltXMonXWeek <.1 Table 3. 2: Analysis Of Variance for oocyst count after weaning including prior treatment with monensin. (Key: Tolt = toltrazuril, Man= monensin). The summary results for the initial model used for analysis is shown in Table 3.2. The effect of the week was significant (p<.1 ), indicating that the oocyst counts varied significantly over time through the experiment. The effect of the monensin and the combined effect of toltrazuril and monensin were non significant, but the effect of the toltrazuril was highly significant (p<.1 ). But, the interaction of MonensinXtoltrazuriiXweek was significant. This indicates that monensin had no effect in reducing the oocyst numbers in calves after weaning but toltrazuril given at weaning had significant effect on oocyst counts. The combined effect of two treatments was significant as the calves treated with both drugs had the lowest counts when compared to calves treated with either of two drugs separately and calves that were not treated with anticoccidials. Since prior treatment with monensin was not significant, a further analysis was undertaken excluding monensin (see Appendix 3.5.4).
98 8 Monensin Toltrazuril Oct Nov Nov Nov Nov Dec Dec M T NM T M NT NM NT Table 3. 3: Arithmetic mean oocyst counts (oocysts/g) of calves treated either with monensin (M) or toltrazuril (T) and treated with both (M, T) or not treated with either (NM+NT), each group consisting of 6 calves. Effect Numerator OF Denominator OF F Value Pr>F Week <.1 T oltrazuril ToltrazuriiX <.1 Week Table 3. 4: Type 3 Tests of Fixed Effects. Repeated measures analysis of variance for oocyst counts after weaning. Table 3.4 shows the summary of the repeated measures ANOVA (see Appendix for full report) when monensin treatment is removed from the model. The effects of the week, treatment and the interaction between the treatment (Toltrazuril) were all highly significant (p>.1 ), indicating that the treatment reduced the oocyst counts significantly in calves. There was an overall change in oocyst count with time consistent with an increase then a decline and the significant interaction is consistent with this being different between the two treatments.
, not treated with either drugs (NM +NT), treated with only one")
99 g "NM+ T" ' M+T e ' ' M+NT *"NM+NT weeks post treatment I 8 j Figure 3. 8: Comparison of the arithmetic mean oocyst counts of 4 groups treated with both anticoccidials ( toltrazuril+ monensin = T +M), not treated with either drugs (NM +NT), treated with only one anticoccidial at least (NM+ T) = treated with toltrazuril only; treated with monensin only( M+NT) Live weight of the calves up to weaning: The arithmetic mean live weights by group up to weaning are shown in Fig. 3.9 and by treatment in Fig At the beginning of the experiment, all 3 groups of monensintreated calves (n=1 2) had an average weight of 47.7kg. This was slightly higher than the average weight (47.1 kg) of calves (n=12) which did not receive any monensin in their feed, with a difference of.6 kg between treated and nontreated. At the end of the experiment, the treated groups weighed an average of 1.5kg and the group not treated had an average of 1 OOkg, with a difference of.5kg.
 and calves fed pellets without monensin (NMG1, NMG2, NMG3). Each group comprised 4 calves.")
100 82 I 1 9 I 8 = Ill.s::. C) "Q) :: Monensin G1 MonensinG2. MonensinG3 No MonensinG1 No MonensinG2 No MonensinsinG weeks on treatment Figure 3. 9: Comparison of arithmetic mean live weights of calves fed pellets containing monensin (MG1, MG2, and MG3) and calves fed pellets without monensin (NMG1, NMG2, NMG3). Each group comprised 4 calves. Effect Numerator OF Denominator OF F Value Pr>F Week <. 1 Monensin Rep RepXMonensinXWeek Table 3. 5: Repeated measures Analysis of variance for live weights for calves up to weaning either fed pellets containing monensin or without monensin.
101 s::: 8 C'l 7 :: weeks on treatment [ onensin NM nsin M Figure 3. 1: Comparison of Least square mean live weights of calves (Error bars represent SE) either fed pellets containing monensin (M) or fed pellets without (NM). Each treatment consisting of 12 animals As shown in Table 3.5, there was no significant effect (p>.5) of group, treatment or the interaction of treatment x group x week. But the effect of the week was significant at (p>.1 ). This indicates that the calves increased in their weight during the experiment but an effect of monensin was not significant statistically, as seen in the Fig 3.9 and Fig 3.1 as the treated and non treated calves did not differ much in their live weight gains over 11 weeks of observation (see Appendix and Appendix for raw data). The statistical analysis of monensin treatment on weight gain is shown in Appendix Live weights after weaning: The arithmetic mean live weights by toltrazuril treatment are shown in Fig and those corrected for initial live weights in Fig The analysis showing correction for initial live weight is shown in Table There was a difference of > 5kg in weight gain between the treated and nontreated calves by 7 weeks post toltrazuril treatment. The arithmetic mean difference between toltrazuril treated (133.25kgs) and untreated (129.42kgs) was 3.82kgs and the corrected
102 LSM difference between treated ( kgs) and untreated (128.76kgs) was 5.12kg (see details in Appendix and 3.6.6). 84 Effect Numerator Denominator F Value Pr>F DF DF Monensin Toltrazuril Week <.1 Tolt X Week Mon XTolt XWeek Liveweight Week <.1 Table 3. 6: ANOVA of Liveweights after weaning corrected for initial liveweight at weaning. 14 f/) C') 13 : CIJ 12.c C') 11 : ea Q) :E weeks post treatment 6 7 Figure 3. 11: Arithmetic mean live weights of calves after weaning either treated with toltrazuril 2mg /kg at the time of weaning (T) or not treated (NT). Each group consisted of 12 animals.
 or not treated with toltrazuril (NT) with live weights adjusted for initial")
103 en ) en...j 1 + T NT weeks post treatment Figure 3. 12: Least square mean weights for a ccomparison of 2 groups of calves either treated at weaning with toltrazuril (T) or not treated with toltrazuril (NT) with live weights adjusted for initial weights. Each group consisted of 12 animals. As shown in Table 3.6, the effect of week was significant (p<.1) reflecting calves getting heavier with time. The effect of the toltrazuril treatment on liveweight was also significant (p<.5) and the interaction between toltrazuril treatment and week was approaching being significant (p=.6). This interaction suggests that the divergence in live weights between the two groups was becoming greater over time. Prior treatment with monensin had no significant effect (p>.5) Cryptosporidium and Giardia results: The prevalence of Cryptosporidium in these calves using either technique is shown in Fig The prevalence of Cryptosporidium and Giardia in Week 1 is shown in Table 3.7. lt is notable that 14 of the calves were infected with Cryptosporidium and this declined to no calves infected 4 weeks later. Also, 14 of the calves were infected with Giardia in Week 1.
104 Cl) 12 E1 c: 8 m os z we eks on obse rvation + Positive 4 5 Figure 3. 13: Status of Cryptosporidium infections in calves up to 5 weeks of observation. As shown in the Table 3.7 more than half of the animals were detected positive for both Cryptosporidium (58.33%) and Giardia (54.16%) at the beginning of the study when the calves were about 2.5 weeks of age. Giardia levels were recorded only on this occasion.
105 87 Animal Cryptosporidium Giardia no Table 3. 7: Cryptosporidium and Giardia status of the calves by Meriflour test kit in Week 1.
106 Discussion: A significant feature of this study was the generally low oocyst count throughout the experiment. At the commencement of the study this was not that surprising as the mean age of calves was only 2.5 weeks. The prepatent period for cattle Eimeria species varies from 821 days. This group of calves represented the very earliest calves born on this farm this year. So contamination in the calf rearing area was likely to have been low. At the calf unit, calves were initially housed in pens and then moved to paddocks adjacent to the pens that had been used by calves in successive years. This occurred a few days before movement to the experimental area. Oocyst counts were nil in this study for up to 4 collections, i.e. after 2 weeks on the pasture, which is presumably due to nonexposure to the infection whilst in the calf pens. Earlier researchers reported at least eight days after turning out onto pasture, for development of the infection with peak excretion of oocysts between 91 8 days after infection (Svensson et a!, 1993). The rise in oocyst counts after 2 weeks, to reach the peak oocyst counts in weeks of time on the experimental paddocks may coincide with the maturation of infection resulting from the calfrearing at the Massey Calf Rearing facility immediately before being transferred to the experimental paddocks. After this time, oocyst counts were low, possibly because of immunity developing, as has been observed previously (Niilo, 1969, 197; Senger, 1959; Rose, 1987). An alternative reason is that Eimeria proceeded through their life cycles and developed into oocysts, but in the absence of further infection on the experimental paddocks oocyst counts subsequently dropped to low levels. The relatively large size of the grazing cells meant that little reinfection probably occurred over the course of the experiment because the initial contamination by these calves was widely dispersed and pasture growth was good, further diluting any oocysts. In addition, the experimental area was not previously used for calf rearing and had only been grazed by adult cattle which would have had generally low oocyst counts and hence the area would have only had a low level of contamination with Eimeria oocysts.
107 Monensin should contribute to lower oocyst counts in treated animals (Stockdale 1973 & 1981 ; McDougald, 1978; Fitzgerald 1984 ). The monensinadded mealfed animals had comparatively lower counts but untreated animals also had low numbers, possibly because of good managerial practices in the paddock. lt was reported that monensin has a dose relevant effect (Stromberg et al., 1986). Therefore, if oocyst numbers had been high then a higher dosage of monensin might be required to obtain the same effect. Monensin treatment had no significant effect on weight gains. As shown in Fig 3.5, the calves were not eating enough monensin for the first 4 weeks, as the whole fresh milk had no coccidiostats and the amount of meal eaten contributed less than the recommended 1 mg/kg body weight (McDougald, 1978; Stromberg et al., 1986). This occurred despite sufficient meal being offered to achieve this dose but the meal was not adequately consumed. lt is not surprising that both treated and nontreated animals showed similar oocyst counts up to 4 weeks of time. After 4 weeks the oocyst counts were generally low in all groups, so no obvious effect of monensin could be determined. Whether there was a developing immune response is also hard to determine. The immunity to the parasite depends on the previous exposure and the level of exposure (Stockdale and Yates, 1978; Senger, 1959; Niilo, 1969), which in this experiment appeared to be low. A large dose of infection provides good immunity and the immunity lasts for at least 4 days (Hughes et a!, 1989; Ferron et al., 1965; Faber, 22). As shown in Table 3.6, the effect of week on liveweight was significant (p<.1 ), indicating calves were getting heavier with time. The effect of the toltrazuril treatment on liveweight was significant (p<.5) and the interaction between toltrazuril treatment and week was approaching being significant (p=.6). This indicates that toltrazuril did have a postive effect on liveweight and the divergence in live weights between the two groups tended to be larger over time. Prior treatment with monensin had no significant effect (p>.5). The other notable feature was the generally low oocyst count in relation to those associated with clinical disease. There are published reports that counts of more than 5 opg, are associated with clinical disease in cattle (Horton Smith, 1958; Oda and Nishida, 199). 89
108 The impact of monensin treatment on liveweight gain up to weaning was not significant (p<.5), which is not surprising given the level of FOC that was noted. This may not be a fair reflection of monensin given the low challenge in the untreated calves. In most of the experiments that have been reported monensin improved the live weight gain in lambs and calves (Foreyt and Wescott, 1984; Fitzgerald 1984; MacDougald, 1978; Goodrich, 1984; Stockdale, 1981 ; McDougald, 1978). But in some other studies monensin did not improve weight gains in lambs with naturally acquired infections (Horton and Stockdale, 1981 ; McDougald, 1978). In this present study monensin had no significant effect on weight gains. This may be because monensin consumption was not enough during initial period of 4 weeks as shown in Fig 3.5. This allowed calves to have access to more oocysts as the effect of monensin is dose responsive (McDougald, 1978) and the treated calves shed almost equal number of oocysts as untreated animals. Probably this initial infection in animals had some effect on weight gain, as the disease causes weight loss in animals (Quigley, 9 21 ). After weaning, there was a rise in the oocyst counts of the animals which were not treated with the toltrazuril whereas those that were treated maintained low FOC. The rise in the untreated calves might have been because of the stress of weaning or else because of the withdrawal of monensin allowing inhibited stages to mature and calves picking up new infection. These two factors might both operate independently or together, but this study was not able to determine which was the case. These animals were subjected to several stressful conditions at the time of weaning such as vaccination, change of diet (no supplemental diet), bleeding, weighing, drenching (coccidiocide) and removal of shelter (pens removed from the paddock). None of the animals developed clinical disease. Indeed the FOC remained low even though there was a difference between the toltrazuriltreated and nottreated calves. A single treatment of the calves with toltrazuril significantly reduced the oocyst counts up to 4 weeks post treatment and the oocyst counts of the calves which were not treated were higher over this period. Toltrazuril has been shown to be an effective coccidiocide and is effective in killing all stages of the life cycle except the extracellular stages and is effective against all species of Eimeria species (Froyman and Grief, 22). However, there is no persistent activity.
109 Hence, any effect on FOC is only likely to persist until a new infection becomes patent. There have been several studies with various ruminants. Toltrazuril treatment of lambs (2mg/kg) reduced their oocyst counts to low levels and weekly treatment of the same lambs for 1 weeks kept FOC low (Stafford et al, 1994). In 3 different trials with goats, a single treatment with toltrazuril resulted in rapid and significant reduction of oocyst counts in treated goats. In one of these the control animals had 21,546 OPG count but the treated animals had only 36 opg count by the 4 th day after treatment and this further reduced to 163 opg on the 1o th day (McKenna, 1988). A single treatment to lambs with toltrazuril (2mg/kg) on Day 1 on pasture reduced the oocyst counts for up to 34 days. Lambs treated with 2mg/kg toltrazuril had better results over the lambs treated with 1 mg/kg (Gjerde and Helle, 1986). The improvement in the weight gain (corrected LSM) in the 6 week period after weaning was significant with > 5kgs difference between treated and untreated animals. The lower weight gains in the controls may be because of the oocyst burdens these calves had during the immediate post weaning time. The effect seen here is particularly surprising given the generally low oocyst counts seen after weaning in the calves not given toltrazuril treatment. There have been few studies, investigating the effect of coccidiosis in calves after weaning under similar type of grazing conditions and apparently no studies on weight gain when using toltrazuril in calves. Toltrazuril treatment of lambs naturally infected with Eimeria improved the weight gains when treated with 152mg/kg toltrazuril and the weight gains were significant in the period from 14 to 35 days after treatment (Gjerde and Helle, 1986). As noted in Chapter 2, the dominant species in these calves were E. bovis and E. zuernii which are generally acknowledged as the two most pathogenic species in cattle. Even so, it seems surprising that there was a significant effect on weight gain given the generally low FOC, even with these two species dominating. 91
110 92 Cryptosporidium status: At the beginning of the experiment at least 58.3% of calves were positive to Cryptosporidium and 54.2% of calves for Giardia. The average age of the calves in this experiment was 2.5 weeks at which age the infection seems to be most prevalent in calves (Maldonado et at, 1998, Atwill et at, 1998).This was the maximum level of shedding recorded in this study with counts declining each week to become nil in the fifth week of observation when the calves were 6.5 weeks old. it has been observed that the risk of infections decreases with increasing age (Mohammed et at, 1999).
111 93 Chapter 4: Experiment at Tuapaka : 4.1. Introduction: The study reported in the previous chapter examined coccidiosis both before and after weaning. Coccidiosis has been reported immediately after weaning because of the stress calves undergo at the time of weaning in terms of transport, feed change and vaccination (Parker, 1984; Fitzgerald 1961 ; Niilo, 197; Marsh 1938). lt has been previously shown that administration of anticoccidial medication early during the stress period can decrease the clinical and subclinical disease seen in feed lots (Pritchard, 1993). A single dose of toltrazuril at 15 2 mg/kg reduced oocyst counts and they remained low for 3 4 weeks post treatment in previous studies (McKenna, 1998; Gjerde and Helle, 1986; Taylor and Kenny, 1988). This present study was run in conjunction with the study reported in Chapter 3 at Massey Number 4 Dairy Farm and was designed to investigate the effect of toltrazuril treatment at weaning in young HolsteinFriesian bull calves reared by commercial rearers under commercial conditions where the probability of calves being exposed to infection with coccidia was likely to be high. Traditional rearing of dairybreed bull calves involves a commercial calf rearer raising the calves from 3 days of age until weaning at about 1 OOkg liveweight and 12 weeks of age. These animals are then sold to farmers who keep these bulls until they are slaughtered. lt is also a time when anticoccidial treatment ceases as calf meal is no longer fed. 4.2 Materials and Methods: Farm and Animals "Tuapaka" is a Massey University farm that regularly rears calves from weaning to 1824 months of age. The area of the farm where the study bulls were grazed has only been used for the rearing of dairy bull beef since the early 198s. lt is current policy for calves to be sourced from Massey University dairy farms, raised under contract by commercial calf rearers until 1 OOkg body weight and then returned to Tuapaka to be grazed until sold at 1824 months of age. These commercial calf rearers would generally follow the same rearing practice as for those calves studied in Chapter 3, except they would use milk replacer
112 rather than whole milk. For this present study calves from two different calf rearers were used with some from a third rearer arriving 1 week after the commencement of the study and being monitored as a form of additional control group. To ensure that this current experiment started with both groups of calves treated synchronously it was necessary to hold some calves after arrival at Tuapaka but in this case all calves were maintained on calf meal with coccidiostat as would have occurred on the property of the calf rearer. No calves were monitored whilst with the calf rearer Experimental Schedule: Two groups (Group A and B) of 3 calves each were selected, one from each of the two calf rearers. Half (n=1 5) of both groups were treated once with 2mg/kg body weight toltrazuril (Baycox Piglet Coccidiocide containing toltrazuril 5g/L; Batch. No.1 848A25; Expiry Date, June 23). All treatments were given orally with a 2ml syringe. The animals were randomly selected in the order of their arrival in the race at the time of the first sampling. All the calves were faecal sampled, weighed and bled. From the second week onwards the third group (Group C) of 21 calves arrived on the farm and were sampled as for Groups A and B but none of this group was treated with toltrazuril. Each group of calves were grazed together as a group but each group was grazed in a different paddock. Calves remained in these same paddocks for the duration of the experiment. Each calf was faecal sampled and weighed once a week for 5 weeks posttreatment. The technique for faecal collection was rectal stimulation of defaecation. In addition, a 1 Oml blood sample from the jugular vein was collected on the first and last week of the experiment from half of the Groups A and B for recovery of serum and subsequent determination of anticoccidial antibodies (see Chapter 6). The experiment commenced on the ih November 22 (day of treatment) and was completed 5 weeks later on 1 ih December (Week 5 post treatment). On arrival all calves were treated with an anthelmintic to remove the complication of nematodes affecting liveweight gain.
113 Oocyst counts: A total oocyst count was carried out on a 2g subsample of faeces collected as previously described (see Appendix ). In addition, oocysts were recovered from a further subsample for those animals with high oocyst counts and sporulated as previously described (Appendix and 3.3.3). Each oocyst counted represented 5 oocysts per gram. A total of 516 faecal samples were screened for coccidia throughout the experiment and all the positive samples with high counts were sporulated for species identification Species prevalence: To determine the prevalence of species within an animal 3 oocysts were identified. This was only estimated from those animals with a reasonably high oocyst count to make the observation practically feasible. These results have been reported in Chapter Faecal consistency: A total of 128 faecal samples on two occasions (3rd and 4 th week post treatment 26 th Nov and 3 r d Dec) were categorised based on their consistency of faeces as solid (1 ), semisolid (2), and liquid (3) and the faecal oocyst counts were compared to see whether there was any relationship between the faecal consistency and the oocyst counts Statistical analysis of faecal oocyst counts: Faecal oocyst counts (FOC) were analysed after square root transformation to normalise the data (Snedecor and Cochran, 198). Data were analysed using the MIXED procedure of SAS (21 ). The linear model included the fixed effects of week, treatment with toltrazuril, the interaction between week X treatment, and the random effect of replication. A replicate comprised a group of 15 animals that were treated with toltrazuril and 15 untreated animals. Using the Akaike's information criterion (SAS 21 ), a compound symmetric error structure was determined as the most appropriate residual covariance structure for repeated measures over time within animals (Appendix ).
114 Statistical analysis of Live Weights: Live weight was analysed using the MIXED procedure in SAS (21 ). The model included the fixed effects of week, treatment with toltrazuril, the interaction between week X treatment and the random effect of animal within treatment. lt also included liveweight at Week 1 to standardise initial differences between groups. Using the Akaike's information criterion, a compound symmetry error structure was determined as the most appropriate residual covariance structure for repeated measures over time within animals. Least square means and their standard errors (SE) were obtained for each treatment Statistical analysis of faecal consistency: The correlation between faecal consistency and oocyst counts was determined using SAS (21) after transforming the FOC by their square root Results Faecal oocyst counts: Arithmetic mean oocyst counts for Groups A, B and C are shown in Figs 4.1, 4.2 and 4.3 respectively. The Least Square Mean (LSM) oocyst counts for Groups A and B are shown in Fig. 4.4 and Fig. 4.5 respectively. The raw oocyst counts are recorded in Appendix The oocyst counts of Group A calves which were treated with toltrazuril were dramatically reduced by the first week from a mean of 41 2 oocysts/g to 17 oocysts/g and the counts of these treated calves remained low for the duration of the experiment (Fig. 4.1 ). Oocyst counts remained lower than the untreated calves for 5 weeks post treatment. The counts for calves which were not treated with toltrazuril remained as high in Week 2 as pretreatment, then increased a little in Week 3 and reduced thereafter to be similar to treated calves by the end of the experiment. A similar pattern was seen with calves in Group B. However, by chance the oocyst counts of toltrazuriltreated calves were initially lower than the nontreated calves. Regardless, they remained low for the duration of the experiment increasing very slightly in Week 5. The untreated calves in Group B averaged 337 oocysts/g at the start of experiment in Week, increasing to 1196 oocysts/g in Week 2 posttreatment and then reducing to be similar to the
115 treated calves by Week 5 posttreatment. The mean counts for Group C calves which were not treated with toltrazuril also increased slightly after weaning from a mean of 14 oocysts/g on arrival in Week 1 to 46 oocysts/g in Week 3 and then reducing to low levels by Week The statistical analysis of the oocyst variation of Group A and B is shown in Table 4.1. The effect of toltrazuril treatment was highly significant (p<.1) indicating that toltrazuril was effective in reducing the oocyst counts. The effect of Group was also significant (p<.5) indicating a difference between calves from different rearers. Week was not significant (p>.5) indicating oocyst counts overall did not vary over time. The interaction of "GroupxTreatXWeek" was also significant (p<.1) indicating that there was a variation between Group and Treatment over time which is consistent with the decline in oocyst counts after treatment. Effect Num OF Den OF F Value Pr >F Week Treatment Group Group*Treatment*Week Table 4. 1: Type 3 tests of fixed effects of time series analysis for oocyst counts for calves from Group A and B treated or not treated at weaning with toltrazuril. Week = week of experiment, Treat = toltrazuril treatment and Group = Group A or B.
 with toltrazuril 2mg/kg body weight (AT)")
 8 > + 6 BNT c 4 2 BT 1 2 3 4 weeks post treatment 51 Figure 4.")
116 98 45 l 1: ATl weeks post treatment 4 5 Figure 4. 1 : Comparison of arithmetic mean oocyst counts of Group A calves treated at weaning (Week ) with toltrazuril 2mg/kg body weight (AT) or not treated with toltrazuril (ANT). Each group comprised 15 calves c ::J 1 (;) 8 > + 6 BNT c 4 2 BT weeks post treatment 51 Figure 4. 2: Comparison of arithmetic mean oocyst counts of Group B calves treated at weaning (week ) with toltrazuril (BT) or not treated with toltrazuril (BNT). Each group comprised15 calves.
, Group A not treated with toltrazuril (ANT), Group B treated with toltrazuril (BT) or Group B not treated with toltrazuril (BNT) and")
117 AT Ill 32 + BT c 3 :I ACNT BNT 1ii 24 > ANT c:: 16 Cl) weeks post treatment Figure 4. 3: Comparison of Means of Group A treated with toltrazuril (AT), Group A not treated with toltrazuril (ANT), Group B treated with toltrazuril (BT) or Group B not treated with toltrazuril (BNT) and Group C not treated with toltrazuril (CNT) Each group comprised 15 animals except group C of 21 calves.
 of Group A treated with toltrazuril (AT), Group A not treated with toltrazuril (ANT). Each group comprised 15 animals.")
118 t: g 25 c;; :: en 5...J weeks post treatment FAll L N T J 4 5 Figure 4. 4: Comparison of Least Square Mean oocyst count (+/) of Group A treated with toltrazuril (AT), Group A not treated with toltrazuril (ANT). Each group comprised 15 animals. Error bars represent Standard Error. 3 I + BT BNT I weeks post treatment 5 Figure 4. 5: Comparison of Least Square Mean oocyst count ( +1) of Group B treated with toltrazuril (BT) or Group B not treated with toltrazuril (BNT). Each group comprised 15 animals. Error bars represent Standard Error.
119 Liveweights of calves: Arithmetic mean liveweights for Group A are shown in Fig 4.6, for Group B in Fig 4.7 and the Least Square Means for both Groups in Fig 4.8 and Fig 4.9 respectively. The summary of the statistical comparison of weight gains is shown in Table 4.2. By 5 weeks post weaning there was >58kgs difference in weight gain between animals treated with toltrazuril or not. As shown in Table 4.2 the effect of week was significant at (p<.1 ) reflecting the liveweight increase over time. Treatment with toltrazuril was not significant but the interaction of GroupXTreatmentXWeek was significant (p<.1) indicating the relationship was not constant over the experiment but consistent with one group weighing more than the other at the end of the experiment. Effect Numerator Denominator F Value Pr>F DF DF Group Treat Week G roup*treatment*week Liveweight week Table 4. 2: The repeated analysis variance of live weights of calves adjusted for initial liveweight (liveweight week ) showing the effect of treatment with toltrazuril ('treat"), "group" (Group A and Group B), time by week post treatment ("week") and the interaction of group, treatment and week ("group*treat*week) on the live weight.
120 t: :E 125 Cl Weeks post treatment Figure 4. 6: Comparison of arithmetic mean live weights of Group A calves either treated with toltrazuril at weaning (AT) or not treated with toltrazuril (ANT). Each group comprised 15 animals en 13 C') c:: 125 J:.2l BT BNT Weeks post treatment Figure 4. 7: Comparison of live weights of group B calves treated with toltrazuril (BT) or not treated with toltrazuril (BNT). Each group comprised of 15 animals.
121 U) 13 c 125..t: C) "(i) 12 3: 115 (/) _,J I + AT L ANT 4 5 Weeks Post Treatment 13 6 Figure 4. 8: Comparison of LSM live weights, of Group A calves treated with toltrazuril (AT) and not treated with toltrazuril (ANT). Each group comprised 15 animals 14 U) 135 ') 13 t: 125 ') Q) 12 3: :E 115 Cl) _,J 11 I + BT BNT Weeks Post Treatment Figure 4. 9: Comparison of LSM live weights, of Group B calves not treated with toltrazuril (BNT) and treated with toltrazuril (BT). Each group comprised 15 animals. Error bars represent SE.
, semi solid (2), and fluid or liquid (3) and the faecal")
122 Faecal consistency and oocyst counts: A total of 128 faecal samples were categorised based on their consistency of faeces as solid (1 ), semi solid (2), and fluid or liquid (3) and the faecal oocyst counts were compared to see whether there was any relationship between the faecal consistency and the oocyst counts as shown in Table 4.3 (see Appendix 4.3. for raw data). Consistency of faeces No. samples Faecal counts (286) (236.) (175) Table 4. 3: Faecal consistency and the oocyst counts of the calves. As shown in Table 4.4 and Fig. 4.1, there was no relationship observed between the faecal consistency and the oocyst counts in the faeces as all types (faecal consistency solid, semisolid and liquid) had minimum counts as low as zero as minimum count and solid faeces had highest counts up to 4,55. The average counts of liquid, semi solid and solid were 175, and Pearson Correlation Coefficients Fe Foe Sr_Foe Fe p Foe p.49 <.1 Fe Foe Sr Foe.. Table 4. 4: Correlation coeff1c1ents of faecal oocyst counts. Note: Fe faecal consistency, Foc=Faecal oocyst counts, Sr = Square root, P=Probability

123 15 Type 3 Tests of Fixed Effects Effect Nu m Den F Value Pr > F DF DF Fe Table 4. 5: Comparison of faecal consistency and faecal oocyst counts. As shown is Table 4.4. and 4.5., there was no significant relationship between faecal consistency and faecal oocyst counts as the correlation coefficient before square root transformation (SRT) of oocyst counts was.6 and after SRT was.7. Analysis of variance of the fixed effect was also not significant at (p=.614) which means that faecal consistency is not a true measure for the level of infection as the most liquid sample can have low oocyst counts and solid samples with high counts may mislead the level of infection of animal Vl E 3 :J 25 Vl > g i 2 3 Faecal consistency Figure 4. 1: Comparison of faecal consistency solid (1 ), semi solid (2) and fluid (3) and oocyst counts of 1 27 calves.
124 Discussion: The development of coccidiosis is affected by several factors of host and parasite (Levine, 1986) such as host age, nutritional status and immune status of an animal. Adult animals are generally resistant to the disease compared to calves this could be because of previous exposure (Stockdale and Yates; Senger, 1959; Niilo, 1969) and severe infection results in the development of good immunity that can last for at least 4 days (Hughes et a/, 1989; Ferron et al., 1965; Faber, 22). Management conditions and climatic conditions will influence numbers of infective oocysts available to the calves (Matjila & Penzhoru, 21 ; Hasbulla et al., 199; Chibundu et al., 1996; Salisbury et al., 1955 ; Niilo, 197). In this present study, bull calves from three different rearers had different levels of infection before treatment although none would be considered to be very high, suggesting that management on the farms had an influence on the oocyst counts. Group A calves had the highest mean oocyst counts (343 to 412 ocyst/g) whereas Group 8 were lower means (33 to 336 oocysts/g) whilst Group C had mean counts of to 76 oocysts/g. All the groups were subjected to a similar degree of stress at the time of weaning. The animals were transported to the Tuapaka farm, faecal sampled, weighed and half of the animals were bled and drenched with Toltrazuril orally (as described). Toltrazuriltreated animals showed a reduction in the oocyst counts after one week of treatment, consistent with toltrazuril effectively killing the existing infection. However, although toltrazuril reduced the counts after treatment there were still some oocysts were passed in treated calves. This study is in agreement with previous studies in goats where the oocyst counts were reduced almost to zero levels by toltrazuril treatment and then kept very low for 3 days post treatment (McKenna, 1988; Taylor and Kenny, 1988). In the present experiment this reduction was seen up to 4 weeks post treatment. The oocyst counts of untreated calves of all the groups rose slightly after the start of the experiment with the peak being seen during the second week. The
125 mean counts remained relatively high until the 4 1h week post treatment. Both treated and untreated calves had similar counts around Week 5 post treatment. 17 Overall there was no significant effect of treatment on liveweights (p>.5) although the liveweights of treated animals were improved after treatment with toltrazuril. Treated calves in Group A gained >8kgs live weight in the 5 weeks after the treatment over the untreated calves. The increased live weight gain of treated animals started to be apparent after 3 weeks post treatment (Fig. 4.8) giving an impression that the oocyst count reduction during these 3 weeks might have helped the animals to gain weight. Treated calves in Group B also had an improved weight gain of >4kgs over untreated calves. In all untreated groups the live weights were lower (Group A, B, C) when compared to treated animals, and this may be due to subclinical disease process going on in the animals. Although, the effect of treatment was not significant, the significant interaction of liveweight with time and treatment (p<.1) is indicative of a divergence in liveweight gain between treated and untreated animals. In this study the faecal samples were graded as solid, semi solid and runny based on the consistency and the oocysts counts of the same animals were tallied with consistency to investigate whether there is any relationship between diarrhoea and oocyst counts. No relationship between faecal consistency and oocyst counts was however observed. All types of faecal consistencies ("Solid", "Semisolid" and" Runny") had counts as low as zero as a minimum count and high counts up to > 4, oocysts/g. The average counts of "liquid category" had the highest counts of 758 oocysts/g when compared to Semi solid (237 oocysts/g) and Solid (287oocysts/g). This is similar to the results of other studies (Oda and Nishida, 199; Ernst, 1985) that also failed to show any relationship between counts and faecal consistency.
126 Chapter 5: Study of coccidiosis and oocyst shedding on various beef farms 5.1. Introduction: The previous two chapters detail experiments on coccidiosis pre and postweaning and the effect of toltrazuril treatment at weaning. Studies in this chapter detail a series of investigations designed to be complementary to these by monitoring the shedding of coccidial oocysts in beef cows and their calves, calves raised by conventional dairy calf rearers and cows with their calves on organic farms. The aim was to expand our limited knowledge of the epidemiology of bovine coccidiosis in New Zealand. In particular, to see how different rearing practices influence the coccidial burdens in calves Materials and methods: Cattle were sampled on several different farms as detailed below. Samples were either collected per rectum or fresh faeces were collected from the pasture after observing animals, defaecating. Oocysts counts were estimated with the McMaster oocyst count technique as previously described (Appendix ). If counts using this technique were all zero then a faecal float was usually performed as previously described (Appendix 3.3.1) and the results were recorded as either positive or negative. Some of the positive samples were processed for oocyst sporulation as previously described (Appendix 3.3.2) and the sporulated oocysts were speciated by measuring their sizes and shapes as described in Chapter 2 (Section 2.2) Massey University calves: (a) Conventional calves raised on No.4. Dairy Farm that were the cohorts of the calves used in the experiment reported in Chapter 3, were sampled on two occasions in October. These were two separate groups of calves. They were initially fed on whole milk and then meal containing monensin as for the calves used in the experiment in Chapter 3. In addition a group of 1 adult cows was sampled from this same herd on one occasion in October.
127 (b) A group of 1 organicallyreared calves were screened four times prior to weaning and once after weaning by collecting faeces per rectum and estimating faecal oocyst counts. The organicallyreared calves were reared on the Massey University Dairy Research Unit and were part of the organic dairy research programme. They were raised without any coccidiostat in the meal that was fed to them. A group of 1 calves from the conventionallyreared control group from this research programme were also screened 4 times prior to weaning Organic Beef Farms Calves from two farms were monitored. (a) Farm B was a fully certified commercial organic farm located in the Rangitikei region of New Zealand. lt had a mixture of beef cows suckling calves and organic dairy beef. Faecal samples were collected from adult cows, calves and autumn born bull calves on several occasions as detailed in Table 5.4. (b) Ballantrae Hill Country Research Station: This farm is owned by Ag Research and the animals sampled were from the organic farm research block. This organic farm compares cattle and sheep raised under organic farming criteria with other raised conventionally. The animals sampled were from two organic (No Chemical; referred to as NC1 and NC2) and two conventional (nonorganic) farmlets (referred to as C1 and C2). Faecal samples were collected from the same cows and calves on 3 occasions. Neither the conventional or organic calves had access to coccidiostats Commercial Calf Rearers and Farmers : Calves from three different commercial calf rearers were sampled. (a) Apiti commercial calf rearer: This farm is located near Apiti and rears 5 to 6 calves to weaning per year. Calves are initially fed in sheds with wooden floors and fed milk replacer and increasing quantities of calf pellets containing monensin until weaned off milk and moved to pasture at 3 weeks of age. The shed contained 2 pens and each pen had 12 animals each. Ten faecal samples were collected randomly from several of these inside pens, another 1 samples from calves just weaned and moved
128 outside and a 3 rd group of 1 samples from autumn born calves that were about 5 6 months old but which were still being fed about.5kg meal containing monensin per day. 11 (b) Stafford commercial farm: This farm reared a small number of dairy bull calves. A sample of 1 calves was screened on one occasion to determine the coccidial status of the calves. Samples were collected a week after weaning. (c) Alley Commercial farm : This is a hill country farm in the Manawatu. Both sheep and beef cattle were farmed. The calves (n=1 ) were sampled once and were still suckling their mothers. They varied in age from about 3 to 6 weeks old : Statistical Analysis: Ballantrae Farm data were analysed by AN OVA (SAS 21 ), where the faecal oocyst counts were log transformed by using the following formula: LnFoc = Ln (Foe+ 1 ). The model included the effect of treatment, month, interaction between treatment and month, group nested within the treatment, the animal and procedural error (See Details in Appendix. 5.3) Prevalence and species identification: To determine the prevalence of species within an animal at least 3 oocysts were identified. This was only estimated from those animals with a reasonably high oocyst count to make the observation practically feasible. The percentage of individual species in each study was then calculated to find out the prevalence of individual species in that study. The overall prevalence of species was calculated by pooling all the studies to come up with an overall prevalence. These results were discussed in Chapter 2.

129 Ill 5.3. Results: Massey University Farm : The oocyst counts of calves described in (a) and (b) are shown in Tables 5.1 a and 5.1 b and 5.2. S.No. Aug Sep Oct Jan 1 5 POSITIVE 2 POSITIVE 3 POSITIVE 4 POSITIVE 5 POSITIVE 6 POSITIVE 7 POSITIVE 8 POSITIVE 9 POSITIVE 1 POSITIVE Table 5. 1a: Counts (oocysts/g) of conventional calves (n=1) on Massey University Dairy Research Unit. Adult Calves Calves Cows Paddock A Paddock B 1 positive positive 2 5 Positive Positive 3 Positive positive 4 Positive Negative 5 Positive Negative 6 Positive Negative 7 Positive Positive 8 Positive Positive 9 Positive Negative 1 Positive Negative Table 5. 1 b: Oocyst counts (oocysts/g) of conventional calves (n=1 ) and cows (n=1 ) on Massey No. 4.Dairy Farm.
 or negative (no oocysts seen).")
130 As shown in Table 5.1 b the oocyst counts in the adult cows were low and the conventionally reared calves on Massey University No.4 Dairy Farm were also low as oocysts were only detected by floatation and thus reported as positive ( oocysts seen) or negative (no oocysts seen). The counts of the organically reared calves are shown in Table Initially these were low in September but showed a modest increase in the month of October to a mean count of 529 oocysts/g before declining to relatively low counts in November, December and January. All the conventional control calves were negative to coccidia in August but during September one calf was positive with a count of 5 oocysts/g then during October counts were nil but all the calves were positive in the month of January on faecal floatation. The data is shown in table 5.1 a. Tag Sep Oct Nov Dec Jan POSITIVE POSITIVE POSITIVE POSITIVE POSITIVE POSITIVE POSITIVE POSITIVE POSITIVE POSITIVE POSITIVE POSITIVE Average Table 5.2: Oocyst counts of calves (n=16) raised organically at Massey University Dairy Research Unit.
131 Study of Organic Beef Farms: (a) Farm B: Oocyst counts for young calves on Farm B are shown in Table 5.3. They were generally low with only 6 samples in both age groups being over 1 oocysts/g and all were <5 oocysts/g. Some cows were shedding oocysts but many had zero counts. The autumnborn calves had the highest counts amongst the 3 groups, which was a mean of 1567 oocysts/g in the month of November. ID 19 Nov 2 2 Dec 2 28 Mar 3 Calves born 3r d week of October Calf Calf 54 8 Calf Calf Calf 46 5 Calf 6 5 Mean Adult Cows Cow 36 Cow NT1 Cow 2 1 Autumn born Mean 1567 Table 5. 3 : Oocyst counts oocysts/g of calves, their dams and autumn born bull calves estimated on up to 3 occasions on Farm B. Note: means no sample is obtained.
132 114 ID 19 Nov 2 2 Dec 2 28 Mar 3 Calves born 1st week of September Calf Calf Calf Calf Calf Calf Calf Calf Calf Calf Mean Cow 25 6 Little heifer 5 5 Cow Twinkle 5 NT2 cow 4 Table 5. 3 : Oocyst counts oocysts/g of calves, their dams and autumn born bull calves estimated on up to 3 occasions on Farm B. Note: '' means no sample is obtained. (b) Ballantrae Hill Country Research Station: Sep Dec Mar NCC COC NCD COD Table 5.4: Arithmetic Mean oocyst counts (ocysts/g)of No Chemical organic calves(ncc), their dams (NCO) and Conventional calves (COC), and their dams (COD) from farmlets at Ballantrae Hill Country Research Station.
133 115 As shown in the Table 5.4 the oocyst counts of all the calves from Ballantrae Organic Unit were low men ranged (1 154) oocyst/g in September lower at the second sampling occasion in December (35 5) oocysts/g and rose slightly to (638) oocysts/g in the month of March. See Appendix 5.1. Fig. 5.1 and Fig. 5.2 show the details of pooled status of the oocyst counts of the conventional and No Chemical calf and dam groups. The NoChemical organic groups had slightly higher counts at the last collection but this was not so in the first collection as the Conventional 1 group had higher counts over the NoChemical animals. DF Num DF Den DF F Value Pr>F Treatment Month Treatment x month Group(Treatment) Table 5.5: Type 3 tests of fixed effects of time series analysis for oocyst counts of Calves on Ballantrae Farm. Treatment is Conventional or NoChemical. Effect Num DF Den DF F Value Pr>F Treatment Month Treatment x month Group(Treatment ) Table 5.6: Type 3 tests of fixed effects of time series analysis for oocyst counts of cows on Ballantrae farm. As shown in the Table 5.5 there was no significant effect of treatment, and interaction of month and treatment in calves at (p>.1 ) and no significant effect of group nested for treatment but a significant effect of the month (>.1) was seen. That means the oocyst counts were different in different months but the there was no significant difference in between oocyst counts of NoChemical groups and the conventional groups.
 that means the there was no difference between in oocyst counts of the cows of both groups. 116 7 Cl) c: 6 ::J 5 4 3 c: 2 + NCC coc NCO.. COD i 1 1 2 3 4 Sampling occasions Figure 5.")
134 Similarly, in cows (Dams) as shown in Table 5.6 there was no effect of treatment, month, interaction between treatment and the month and group at (p>.1) that means the there was no difference between in oocyst counts of the cows of both groups Cl) c: 6 ::J c: 2 + NCC coc NCO.. COD i Sampling occasions Figure 5. 1: Comparison of Mean oocyst counts of No Chemical organic calves (NCC), their dams(nc) and Conventional calves( COC), their dams(c) on 3 sampling occasions (1Sep, 2Dec, 3Mar). 7 6 ;: 5 + L1. c..j NCC coc. NCD +COD Sampling Occasions Figure 5. 2 :Comparison of logtransformed oocyst counts of No Chemical organic calves (NCC), their dams (NCO) and Conventional calves ( COC), their dams (COD) on 3 sampling occasions (1Sep, 2Dec, 3Mar). Note:Foc=Faecal oocyst count, Ln =log.
 Apiti commercial calf rearer: The young calves (n=1 ) in the calfrearing shed that were being fed meal containing monensin and some milk replacer were all")
135 Commercial Calf Rearers and Farmers: (a) Apiti commercial calf rearer: The young calves (n=1 ) in the calfrearing shed that were being fed meal containing monensin and some milk replacer were all negative for oocysts in their faeces except 1 calf being positive on a float. The second group (n=1), which were grazing and just weaned were negative on counts. The autumnborn calves had 3 out of 7 calves positive for coccidia on a float. (b) Stafford commercial farm: Young calves were sampled on one occasion (24 1h December) and these results are shown in Table 5.7 Animal ID Oocysts/g Average 967 Table 5.7: Oocyst counts (oocysts/g) of calves on Stafford commercial farm
136 118 (c) Alley commercial farm: A total of 8 calves of mixed ages of 38 weeks old were sampled and the oocyst counts are shown in Table 5.8. Calves were with their mothers. Oocyst counts were generally low. In addition, 3 cows examined were negative for oocysts. Calf no. Oocyst counts Negative Table 5.8: Oocyst counts (oocysts/g) of calves from Alley commercial farm Prevalence Species identified on other fa rms: A total of 1 species were identified in this study; details are shown in Table 5.9. The most prevalent species was E. bovis (28.9'%) followed by E. zuernii (25. 8%), E. wyomingensis (1 1.6%), E. auburnensis (1 1. 1%), E. bukidnonensis (8. 6%), E. brasiliensis (4.5%), E. canadensis (4.%), E. cylindrica (3.%), E. ellipsoidalis (2. %) and E. subspherica (1.%).
 Cl).Q t1l Cl).Q t1l c:i...: u.i u.")
137 :: 119 Cl) t1l Cl) (.) t: t: Cl) Cl) Cl) Cl) t1l Cl) Cl) t: "" t: t: t: (.) t: Cl) Cl) Cl).c: E Q.. E E t1l Cl) :::;, Cl) t1l E Cl) :::.. t:.s Cl).s..Q.Q.Q :::;, :::... ::: :::;, :::;, :::;,....Q (.) Cl).Q t1l Cl).Q t1l c:i...: u.i u.i u.i u.i u.i u.i u.i u.i u.i u.i u.i Ball Ball Ball Ball Ball Apiti Massey organic Total Percentage Table 5.9: Total Counts of species identified from different animals on different farms. Note: B=Farm B, Baii=Ballantrae
138 Discussion: Cows on all farms showed mild infections as observed in earlier studies (Svensson, 1981 ; Faber, 22; Marquardt 1961; Balconi, 1963; Fitzgerald, 1961 ). This mild infection in the dams could be the source of infection to calves in all farms. Massey No.4: The organic calves had higher counts than the conventional calves in the Massey study, which is likely to be due to the use of monensin in the feed of conventional calves even though they were grazing in separate areas. Several experiments have been conducted on calves and lambs infected with coccidia to test the efficacy of monensin in controlling coccidiosis (Stromberg et a/, 1986, Genchi et al., 1989, Fitzgerald and Stockdale, 1981 ). Oocyst counts of conventional calves were lower than the organic calves as the coccidiostat suppresses parasite growth when it is present in the system, when it is withdrawn, disease can recur (Chapman 1999). Farm 8: In Farm B, different age group animals had different levels of infection. One month old calves had a mean oocyst count of 292 oocysts/g which rose to 5 when they were 2 months old and counts were only 25 when the calves were 6 months old. In their dams, the mean count was 33 oocysts I g, but only once did any of the cows shed the parasite. The oocyst counts in the autumnborn calves which were about 6months old were quite low. This is probably consistent with the development of immunity in these calves. The calves born in the first week of September which were two months old when sampled were shedding a mean of 83 oocysts/g. By the time they were 3 months they were shedding only 2 oocysts/g; but at the age of 6 months they were shedding the highest count of 1166 oocysts/g. This series suggests some changes over time but even at the highest mean count was not particularly high. Their dams shed oocysts on all occasions but the average counts were only 5, 5 and 6 oocysts/g. Such low oocyst counts are expected in ad ult cattle.
139 121 Commercial Farms: Apiti farm had three calf groups of which two groups were still being fed with meal containing monensin so the counts were predictably very low in these two groups although they were still shedding oocysts (detectable on float). One group (autumnborn) showed moderate infection which was higher than that noted for Farm B. Stafford Farm had meal added with monensin until they were weaned. The animals were sampled 1 week after weaning and had relatively high counts ranging from 5337 oocysts/g. This is consistent with results from the two Massey studies reported in Chapters 2 and 3 where there was an increase in oocyst counts immediately after weaning. Several studies have showed different percentages of prevalence in different age groups. In a study in Wisconsin, the calves of < three months, 3 6 month old and 712 months had 451%, 4627% and 1116% prevalence (Harsche et al., 1959). Calves of 1 month old and up to weaning had the highest prevalence of 86.3% in USA (Ernst et al., 1985). The calves <3 weeks of age had lowest counts of oocysts in New Zealand reflecting the prepatent period of the parasites (Osborne and Ensor, 1952) and in Wisconsin 4% prevalence was seen in 2 week to one month old calves. Several conditions on farms such as contamination of paddocks, stocking density, rearing with adult cows, use of coccidiostats and climate had influenced the intensity of the disease in previous studies (Matjila and Penzhorn, 21 ; Niilo, 197; Pavlaseck, 1984; Chibunda et al., 1996) and will have influenced the results in the present study. The number of oocysts produced also depends on other factors as the inherent potential of each species to reproduce in a nonimmune host, immunity developed by the host, crowding factor, competition with other species, other infectious agents, nutrition of the host, strain differences of the host and parasite, stress factors and anticoccidial drugs (Fayer, 198).
140 Ballantrae Farm: There are two different management systems compared on this farm. One is raised using conventional farming approach whilst the other is farmed without the use of chemicals. There are two separate farmlets of each. On the Nochemical farmlets there is alternative grazing of sheep and cattle to keep nematode parasite burdens low as only a few parasites of sheep cross infect cattle. So neither the NoChemical group nor Conventional groups have any access to coccidiostats which is consistent with usual management of beef cattle. Though these animals were not given any coccidiostat the coccidia burden was comparatively very low. There was a slight difference between NC and CO groups both in calves and cows, but the differences were not significant statistically. The cows of both groups were shedding coccidia on all occasions but counts were very low Conclusions: This study revealed that all conventionally reared calves which were treated with monensin up to weaning had low coccidial burdens when compared to organically reared calves. The infection seems to recur when the calves were weaned and monensin feeding was withdrawn. Adult cows were also infected most of the time and the infection was very mild. The different conditions between farms are likely to have a role on the status of infection. There were about 1 Eimeria species isolated from this study. The most prevalent species was E. bovis (28.9%) followed by E. zuernii (25.8%). Of note is the fact that these are considered the two most pathogenic species. The next two most prevalent species were E. wyomingensis (1 1.6%) and E. auburnensis (1 1.1) which are generally considered to be the next in order of pathogenicity. The least pathogenic species were generally not very prevalent and included E. bukidnonensis (8.6%), E. brasiliensis (4.5%), E. canadensis (4.%), E. cylindrica (3.%), E. ellipsoidalis (2.%) and E. subspherica (1.%).
141 123 Chapter 6: Western blotting: 6.1. Introduction: In the studies reported in Chapters 3 and 4 calves were regularly bled to monitor the development of immune response and there antibody levels. Although it is well accepted that cattle develop an immune response to Eimeria there have been few attempts to measure it. This chapter will report an attempt to measure this immunity using the technique of Western blotting. This technique is reviewed in Section d. Western blotting has been used in poultry to identify the antigenic and immunogenic proteins in Eimeria maxima as part of a project to produce a vaccine in chicken (Wallach et al., 1993, 1989; Smith et al., 1994). The stage specific differences in surface antigens produce different bands and the intensity of the bands reflect the degree of protection (Wallach, 1994). Similar trials with E. bovis identified protein bands from merozoites and sporozoites ranging from 15,215, kda and the immunoblots on nitrocellulose with immunized calves had binding proteins of 18, to 18,kDa for merozoites and 28, to 118,kDa for sporozoites. Both sporozoites and merozoites had common bands at 58,, 7,, 83, and 98,kda but only the 183,kda protein elicited an lgg antibody response (Reduker and Speer, 1986). Antibodies peak in 2 to 3 weeks after infection and remain detectable for about 4 days in calves (Hughes et al., 1989; Ferron et al., 1965; Faber, 22). The aim of this study was to develop a western blotting technique for use with cattle and use this to measure the immunity of calves to Eim eria species in the studies reported in Chapters 3 and Materials and methods: Calves of Massey No.4 study (Chap 3) were bled every week for 18 weeks. The sera were extracted and kept at 2QC until used for testing. Similarly, sera were collected from calves of the Tuapaka study (Chapter 4) at the time of toltrazuril treatment and once at 5 weeks posttreatment with toltrazuril and also
142 stored at 2ooc until used. These sera were used as a primary antibody in the Western blotting technique described below Parasites: Oocysts of Eimeria were collected from the faeces of calves from all studies when an individual sample had a reasonably high oocyst count. These were sporulated and then cleaned as described in Appendix Production of parasite antigens: Several different procedures were tried to isolate parasite proteins from oocysts. After each procedure samples were examined for proteins by SDSPage. See Appendix.6.3. These included the following: French press: A total of 6,65 cleaned oocysts in 2ml of PBS were passed through a French Cell press (French Press is a cell press which uses pressure to fracture the oocysts) (7,psi) three times in an attempt to fracture the oocysts. The whole volume of fluid which passed through the French Press was used as a source of protein on the gels Vortexing with glass beads: Vortexing with glass beads was performed as described in Appendix 6.2. In brief, clean oocysts in a concentrated pellet were mixed with an equal volume of glass beads (.5mm diameter) in 2ml hard plastic cryotubes. These were subject to vortexing in a bench vortex machine for 51 second intervals of 5 cycles. After each vortex the suspension was examined under the microscope to see whether the oocysts were fractured or not Freezing and thawing: This method involves quick freezing of oocysts in freeze resistant tubes in liquid nitrogen and then thawing the oocysts in boiling water. This was repeated for 12 freezethaw cycles. Samples were examined to see how many oocysts had fractured and then this whole volume was used on gels for detecting protein.
143 Combination of vortexing with glass beads, freezing and thawing, and sonication: As earlier methods were unsuccessful to produce enough proteins on gels, a combination of all 3 above described methods together with sonication (2 cycles) was tried to get as many oocysts to fracture and release proteins as possible. Sonication was performed in 2ml Ependorf tubes using a [Sanies Vibra m Cell Ultrasonic Processor CodeSN VCX 5] at 2 cycles of 25 seconds. Tubes were kept on ice while sonication was performed. The whole volume of fluid was used as a protein source for gels Tissue culturing: The oocyst pellet was subjected to combination of all 3 procedures as detailed in above (vortexing with glass beads, freezing with liquid nitrogen and 2 cycles of sonication). An attempt was made to establish a cell culture line using MDBK cells to produce more parasites and hence more antigen for use in gels. MDBK cells were established in a monolayer with 4x1 4 cells in 1 ml of medium as the initial seeding volume. Prepared oocysts were added when the number of cells had increased to 5x1 5 cells/m I. The cells were grown using 1 x Minimum Essential Medium (Gibco, lnvitrogen Corp., Cat.N ) with 1% glutamax (GIBCO, lnvitrogen Corp.Cat.N ), nonessential amino acids (Gibco, lnvitrogen Cat.No ml), a combination of 1 O,OOOiu penicillin and 1,1Jg streptomycin (PenicillinStreptomycin Gibco, lnvitrogen Corp.No ) per 1 ml and 25tg/ml photericin (Fungizone Gibco, lnvitrogen Corp.Cat.No ), 2% sodium bicarbonate (sodium bicarbonate 7.5% Gibcolnvitrogencat.No.25594) and 1% foetal calf serum (Foetal Bovine Serum Gibco, lnvitrogen Corp. Cat. No ). After the initial inoculation, this medium was changed to a maintenance media which was similar except that, only 2% foetal calf serum was included. The media were changed every 3 rd day. The cell cultures were monitored daily for at least two weeks to spot the first motile merozoites. Motile structures resembling merozoites were seen at the end of the second week and counted. After 2 weeks the whole culture was
144 harvested by disrupting the cell monolayer manually and the medium was centrifuged to concentrate any parasite stages present together with cell debris. Because sufficient numbers were not obtained for the use in Western blotting after 2 weeks, the original culture was split and put onto a new monolayer to increase the numbers. 126 The merozoites were centrifuged, counted with cell counter and treated with 2% sodium dodecyl sulphate (SDS, BDH. Code No ), 1% glycerol, 6.25x1 o2 M tris (Hydroxymethyl) aminomethane (lnvitrogen. Code. No ), 4% mercaptoethanol (BDH Code.No.75542) in a boiling water bath for 1 minutes at a ratio of 6x1 6 merozoites per of solution as described by Reduker and Speer (1986) Western Blotting: The proteins obtained by the different procedures were quantified by optical density to estimate protein concentration using a spectrophotometer [Helios UNICAMUVVIS SpectrometerSI.No.UVA777, 1999]. Prior to using the spectrophotometer a protein estimation kit (Biorad) which binds to protein was added to the fractured oocyst preparation. The proteins obtained by the above procedure were run every time on 1 % SDS PAGE [Sodium Dodecyl Sulphate Polyacrylamide Gel electrophoresis). See Appendix 6.3 for the detailed Western blotting procedure. On each occasion to confirm some proteins were present the gels were stained with.1% Coomassie blue stain and/or silver staining (BioRad, Catalog No ). If SDS PAGE showed any bands then the blotting procedure continued. PDF [BioRad Ready Gel Blotting sandwicheslmmunobiot PVDF filter Papers] membrane or nitrocellulose membrane was then placed on the gel to transfer the separated proteins. After transfer, the membrane was then incubated in 1% skim milk powder solution for 1 hour to block nonspecific proteins. The membranes were then probed with the test sera from the calves at several concentrations including 1 :1, 1 :1 and 1 :1 dilutions. Any bound antibody was detected with rabbit antibovine peroxidase labelled lgg as the secondary
145 antibody to identify any proteins specific to Eimeria. Several dilutions of secondary antibody were used from 1 :1 to 1 :8,. Westfemto was then added to the PDF which will react with the peroxidase and indicate the 127 presence of bands. presence of bands. The PDF was then radiographed to demonstrate the A positive control of Neospora antigen was used for detection of protein using Coomassie Blue and silver staining and also as a positive control for the Western Blotting procedure Results: All attempts to recover protein were frustrated by the small number of oocysts available French press cell: The washed (cleaned) oocysts were passed through the French cell (7,psi) and only 7 unfractured oocysts were seen in the recovered 2ml volume suggesting most oocysts had been fractured. However, no proteins were seen on SDS gels after Coomassie Blue staining or silver staining Vortexing with glass beads: This method fractured few oocysts and separated of fractured oocysts from the beads was difficult. This method did not yield sufficient protein to see on a SOS gel Freeze thaw. The original oocyst pellet had 49,15 oocysts and each.5111 had 273 oocysts before freezing and thawing. The SDS gels showed no protein band on the gel Combination of Vortexing, freeze thawing, and sonication. All remaining oocysts were subject to this procedure. No protein bands were seen.
146 Tissue culturing: When no bands were seen, the remaining volume containing motile sporozoites was used for inoculating the cell culture monolayer. After 2 weeks of culture merozoites were harvested and counted and proteins were separated as detailed processed as described in The Figure 6.3 shows the details of different proteins separated on the nitrocellulose membrane. Bands were visualised by staining with Ponceau S staining. As shown in the Figure 6.3, tissue culture grown Eimeria contained many bands on gels of different molecular weights. There were faint bands above the level of 11 kda and in between 17 and 24 there were two bands and another at the level of 24kDa. In between 33 to 72kda 2 faint and 1 prominent bands were noted. In between 1 to 17kDa, a few faint bands were seen. When compared to uninfected MDBK cells there are a small number of bands that were present in the infected cells compared to the uninfected as seen in Fig 6.1 and 6.2. The gels showed several bands 12 below 2 kda, 3 bands in between 23 one prominent band around 35 kda, 45 kda and 55kDa and bands were also seen at 7, 8 and above 12kDa. The quality of the gels is poor as the availability of material to do repeats to improve the quality was low.

147 Figure 6.1 Figure 6.2 Figure 6. 1: Silver stained SOSPAGE gels. Lanes 13 contain proteins from MOBK culture containing Eimeria proteins loaded at volumes of 5 1, 1 1 and 2 1 per lane. Lanes 46 contain proteins from uninfected MOBK cultures at the same respective volumes Figure 6. 2:.1% Coomassie stained SOSPAGE gels. Lanes 24 contain proteins from MOBK culture containing Eimeria proteins loaded at volumes of 2 1, 1 1 and 5 1 per lane. Lanes 57 contain proteins from uninfected MOBK cultures at the same respective volumes.

148 13 18kDa 13kDa JOOkDa 33kDa 24kDa 17 kda llkda Figure 6. 3: Different antigenic proteins of Eimeria on Nitrocellulose membrane from cell culture grown parasites after transfer from SOSPAGE gels, stained with.2% Ponceau S Discussion: Tissue culture has been used to grow Eimeria and study the micro structure of E. bovis (Hammond et a/, 1966 and 1969, Fayer and Hammond, 1967). In this study, this procedure has been adopted to multiply the numbers in vitro as the parasite numbers obtained otherwise were few to carry out the work. The oocysts were very tough and many procedures tried in this study further wasted the few oocysts obtained. All the methods were unsuitable for cracking the oocysts and each procedure had its own limitations. Immuneblotting was used in chicken to estimate the antibody titers and isolate the immunogenic proteins which lead to the development of vaccine to chicken Eimeria. Immuneblotting to SOSPAGE separated sporozoite antigen with sera of the birds treated with toltrazuril detected strong antibody response to three antigens of 14 to 2kDa molecular weight which titre was also corresponded to the reduction of oocyst excretion and lesions (Grief, 2).
149 In cattle only a few studies have been conducted to identify the immunogenic proteins. In such earlier studies proteins were identified from E. bovis merozoites and sporozoites (Reduker and Speer, 1986). The merozoites and sporozoites had proteins which ranged from 47 to 125kDa.and cell lysate proteins. Merozoite specific proteins were at 15, 17, 39, 152 and 18kDa. In this present study there were faint bands above the level of 11 kda (probably at 15 kda) and in between the 17 and 24 there were two bands and one at the level of 24kDa. In between 33 to 72kDa 2 faint and 1 prominent band were noted. In between 1 to 17kDa there were also a few faint bands seen. These are similar to the proteins identified earlier from merozoites (Reduker and Speer, 1986). 131 Smaller sized 142 kda proteins were recorded in Eimeria of chicken (Grief, 2) and cattle (Redukar and Speer, 1986) which are immunedominant are also seen in this study. The principle reason for failure to utilise the western blotting technique for assessing serological status of the calves was the limited number of available oocysts from which to recover antigen. No attempt was made to probe the gels with calf sera. Conclusions: The object of this study was to standerdise the Western blotting technique and estmate the immunity using it. The protein extraction from available oocysts using procedures like French press, freezing and thawing, vortexing with glass beads was unsuccessful. So tissue culture technique was used to multiply the parasite numbers. Though tissue culturing technique was time consuming did it produce enough parasites for protein estimation. Several parasite specific protein bands of different sizes (one at 15kda, two between 17 24, one at 24kda, two faint and one prominent bands between 3372kDa and few bands between 1 17kDa) were identified on nitrocellulose gels but probing with calf sera was not successful.
150 132 Chapter 7: Final Discussion: 7.1. Pattern of oocyst shedding and monensin treatment: The research in this project has involved studying oocyst shedding by calves in a number of different situations. For the study on Massey No.4 dairy farm the earliest born calves on the farm were used and as a result had only a limited exposure to oocysts that were present in the calf paddocks for prior to calving before arriving on the experiment. Nevertheless oocysts were seen 2 weeks after arrival with a peak at 33.5 weeks indicating they did not get infected.the relatively large size of the grazing cells meant that little reinfection probably occurred over the course of the experiment because the initial contamination by diluting any oocysts. In addition, the experimental area was not previously used for calf rearing and had only been grazed by adult cattle which would have had generally low oocyst counts and hence the area would have only had a low level of contamination with Eimeria oocysts. Consequently it is not surprising that oocyst counts remained low in this experiment. By contrast the calves at Tuapaka were raised under standard commercial conditions and oocyst counts were higher. Monensin should contribute to lower oocyst counts in treated animals (Stockdale 1973 & 1981; McDougald, 1978; Fitzgerald 1984). The monensinadded mealfed animals had comparatively lower counts but untreated animals also had low numbers, possibly because of good managerial practices in the paddock. Commercial farms Apiti and Stafford farm calves had oocyst counts very low when they were on monensin added feed but a week after the monensin withdrawal, the oocyst count increased (2337 oocyst/g) as observed by others (Chapman, 1999). The organic farms had higher oocyst counts than the conventional calves in the Massey study, which is likely due to the monensin in the feed of conventional calves suppressing the parasite growth (Chapman, 1999). Several studies have showed different percentages of prevalence in different age groups. In a study in Wisconsin, the calves of >3months, 36 months old and 712 months had 451 %, 4667% and 1116% prevalence (Harsche et al., 1 959).
151 Calves of 1 month old and up to weaning had the highest prevalence of 86.3% in USA (Ernst et al., 1985). The calves >3weeks of age had lowest counts of oocysts in New Zealand reflecting the prepatent period of the parasite(osborne and Ensor, 1952) and in Wisconsin 4% prevalence was seen in 2 week to one month old calves. Similarly, in this study on Farm 8, different age groups showed differ level of infection. In two different groups from this farm the oocyst counts of 1 month old calves were 292oocyst/g, two month old had 5 to 8 oocysts/g and six month old had oocyst counts of oocysts/g. Cows on all farms showed mild infections as observed in earlier studies (Svensson, 1981 ; Faber, 22; Marquardt, 1961 ; Fitzgerald, 1961 ). This mild infection in the dams could be the source of infection to calves in all farms Weight up to Weaning: In most of the experiments that have been reported monensin improved the live weight gain in lambs and calves (Foreyt and Wescott, 1984; Fitzgerald, 1984; MacDougald, 1978; Goodrich, 1984; Stockdale, 1981 ). But in some studies monensin did not improve weight gains in lambs with naturally acquired infections (Horton and Stockdale, 1981 ; MacDougald, 1978). In this present study monensin had no significant (p>.5) effect on weight gains over untreated calves. This may be because monensin consumption was not enough during initial period of 4 weeks as the amount of meal eaten supplied less than the required 1 mg/kg monensin (McDougald, 1978; Stromberg et al., 1986) and the milk had no coccidiostats included. lt could also reflect the low oocyst counts in the group without monensin in their feed, especially after 4 weeks. When there was a developing immune response is also hard to determine. The immunity to the parasite depends on the previous exposure and the level of exposure (Stockdale and Yates, 1978; Senger, 1959; Niilo, 1979), which in this experiment appeared to be low. A large dose of infection provides good immunity and the immunity lasts for at least 4 days (Hughes et al., 1989; Ferron et al., 1965; Faber, 22).
152 Single oral treatment at weaning and oocyst shedding after treatment: A single treatment of the calves with toltrazuril significantly reduced the oocyst counts for up to 4 weeks post treatment in both Massey No.4 and Tuapaka) and the oocyst counts of the calves which were not treated were higher over this period. Toltrazuriltreated calves showed a reduction in the oocyst counts within one week of treatment consistent with toltrazuril effectively killing all the intracellular stages of life cycle and all the species of Eimeria (Froyman and Grief, 22). This study is in agreement with previous studies in goats where the oocyst counts were reduced almost to zero levels by toltrazuril treatment and then kept very low for 3 days post treatment (McKenna, 1988, Taylor and Kenny, 1988). However, although toltrazuril reduced the counts after treatment there were still some oocysts were passed in treated calves. Hence, any effect on FOC is only likely to persist until a new infection becomes patent. There have been several studies with various ruminants. In lambs weekly toltrazuril treatment (2 mg/kg) reduced their oocyst counts to low levels for the 1 weeks of study and this kept FOC low (Stafford et al, 1994). In 3 different trials with goats, a single treatment with toltrazuril resulted in rapid and significant reduction of oocyst counts in treated goats (McKenna, 1988). A single treatment to lambs with toltrazuril (2 mg/kg) reduced oocyst counts for up to 34 days Weight gain with toltrazuril: The improvement in the weight gain in the 6 week period after weaning was significant with > 5kgs difference between treated and untreated animals in Massey No.4 study. Similarly, in Tuapaka study, treated calves in Group A gained >8kgs live weight in the 5 weeks after the treatment over the untreated calves. The increased live weight gain of treated animals started to be apparent 3 weeks after treatment giving an impression that the oocyst count reduction during these three weeks might have helped the animals to gain weight. Treated calves in Group B also had an improved weight gain over 4kgs over untreated calves. Overall there was no significant effect of treatment on live weights (p>.5) although the live weights of treated animals were improved after treatment with toltrazuril. The significant interaction of liveweight with time
153 and treatment (p<.1) is indicative of a divergence in live weight gain between treated and untreated animals. 135 These growth rates occurred despite low counts in control calves during the immediate post weaning time. However, although the oocyst counts were low in these calves, the species predominating in these calves were E. bovis and E. zuernii which are the most pathogenic species in cattle Eimeria (Ernst and Benz, 1986) Stress around weaning: There was a rise in the oocyst counts after weaning, of the animals which were not treated with the toltrazuril until the 4th week post treatment. Both treated and untreated had similar oocyst counts around Week 5 post treatment. The rise in the untreated calves might have been because of the stress of weaning or else because of the withdrawal of monensin allowing inhibited stages to mature. These two factors might both operate independently or together, but this study was not able to determine which the case was. These animals were subjected to several stressful conditions at the time of weaning such as vaccination, change of diet (no supplemental diet), bleeding, weighing, drenching (coccidiocide) and removal of shelter, (pens removed from the paddock). The actual magnitude of the increase in oocyst count was not very great in the two Massey studies where it was followed none of the animals developed clinical disease even though there was a difference between the toltrazuriltreated and untreated calves. Several conditions on the farm such as contamination of paddocks, stocking density, rearing with adult cows, use of coccidiostats and climate had influenced the intensity of the disease in previous studies (Matjila and Penzhorn, 21 ; Niilo, 197; Pavlaseck, 1984; Chibunda et al., 1996) and will have influenced the results in the present study. The number of oocysts produced also depends on other factors studied so far as the inherent potential of each species to reproduce in a nonimmune host, immunity developed by the host, crowding factor, competition with other
154 species, other infectious agents, nutrition of the host, strain differences of the host and parasite, stress factors and anticoccidial drugs (Fayer, 198) Management on farm : Management conditions and climate conditions will influence numbers of infective oocysts available to the calves (Matjila and Penzhorn, 21 ; Hasbullah et al., 199; Chibunda et al., 1996; Salisbury et al., 1955; Niilo, 197). In the Tuapaka study, bull calves from three different rearers were on coccidiostats up to weaning and had different levels of infection. This suggests that management on the farms had an influence on the oocyst counts. Group A calves had the highest mean oocyst counts (343 to 412 oocysts/g) where as Group B were lower means (33 to 336 oocysts/g) whilst Group C had mean counts of to 76 oocysts/g. On Ballantrae farm there are two different management systems compared. One is raised using conventional farming approach whilst the other is farmed without the use of chemicals. There are two separate farmlets of each. On the Nochemical farmlets there is alternative grazing of sheep and cattle which is not usually the case on the conventional farmlets. Neither have any access to coccidiostats which is consistent with usual management of beef cattle. Despite this the coccidia burden was comparatively very low in both treatments. There was a slight difference between NC and CO groups both in calves and cows, but the differences were not significant statistically. The cows of both groups were shedding coccidian on all occasions but counts were very low. This will reflect the more extensive nature of beef cattle farms Prevalence and Predominance of Eimeria species: In cattle 21 Eimeria species have been described (Ernst, 198) and the prevalence's of the species differed globally. In New Zealand 2 studies described 11 Eimeria species (McKenna, 1972 and 1974; Arias, 1993). In this present study, 11 Eimeria species were isolated and dedescribed. The two most prevalent species over all farms were E. zuernii (95.2%) and E. bovis (87%) followed by E. auburnensis (62%), E. cylindrica (42%), E. bukidnonensis (36%), E. canadensis (31 %), E. subspherica (27%), E. elipsoidalis (24%). E. wyomingensis (23%), E. alabamemsis (12%) and E. brasiliensis (12%).
155 The most predominant species was E. bovis (31.1%) followed by E. zuernii (26.5%), E. auburnensis (12.7%), E. bukidnonensis (6.8%), E. cylindrica (6.3%), E. wyomingensis (5.3%), E. canadensis (4.4%), E. ellipsoidalis (1.9%), E. brasiliensis (1.9%), E. subspherica (1.5%), and E. alabamensis (1%). The most prevalent and predominant species in New Zealand (Andrew, 1954), E. bovis and E. zuernii were reported to be the most pathogenic (Ernst and Benz, 1986). lt is usual for multiple species to be observed in any one faecal sample, with an observed average of 3.5 and as many as 8 species present (Oda and Nishida, 1989; McKenna, 1972) and a similar pattern was observed in this study Western Blotting: Disruption of oocyst cell wall using procedures like the French press, Freezing and thawing, Overtaxing with glass beads was found to be unsuccessful. However, the combined of Vortexing, grinding after each Freezeand thaw cycle in liquid nitrogen (57 cycles), and Sonication was successfully used to crack many oocysts. This study identified tissue culturing technique as the best way to multiply the parasite numbers to produce enough parasites for protein estimation. In this study, several parasite protein bands of different sizes (one at 15kda, two between 1724, one at 24kda, two faint and one prominent bands between 33 72kda and few between 1 1 7kda) were identified on nitrocellulose gels which were similar to previous studies (Reduker and Speer, 1986). Unfortunately it was not possible to pursue with this procedure to analyse collected serum.
156 138 Appendix Oocyst counts: A total oocyst count was carried out on a 2gsubsample of sample collected. In addition, oocysts were recovered from a further subsample and sporulated, and the species present identified in a random sample of 1 oocysts. The details of the procedures are shown in appendix In brief, oocysts were counted using a modified McMaster technique, using salt saturated as the flotation media and where each oocyst cou nted represented 5 oocysts per gram. Oocysts were recovered from positive samples as described in Appendix In brief a 5g sample of faeces was homogenized in water, subjected to flotation in saturated salt and sporulated at 27 C for 7 days in 2% H2S4. Appendix Method of identification of species: Most samples contained mixed infections. Identification of unsporulated oocysts is difficult. Many species have specific structural characteristics that can only be seen clearly in fully sporulated oocysts. In the present study, therefore, species were only identified after sporulation. Species were identified according to descriptions given by the following authors. Levine (1985) and Levine & lvens (1986). Species were identified on the characteristics considered in the following order: 1. Presence and absence of micropylar cap and its characteristics. 2. The oocyst size and shape. 3. Characteristics of the micropyle if present (distinct or indistinct). 4. Number of polar granules. 5. Size and shape of sporocysts. 6. Presence or absence of sporocyst residuum and its characteristics, if present. 7. Presence or absence of stieda body. 8. Position of sporozoites in the sporocyst. 9. Number and size of refractile globule in each sporozoite. To determine oocyst and sporocyst dimensions for comparative purposes and statistical analysis, 1 oocysts of each species were measured using an Olympus BH2 microscope with apochromatic objectives and a digital micrometer. The oocysts measured for each species were from samples collected from different farms on different days.
157 Appendix Table showing multiple species present in calves: Note : Numbers followed by Tare animal no.s t t Q) OT E.zuernii 7 E.canadensis 13 E.bovis 4 E.cylindrica 4 E.ellipsoidalis 2 11T 21Nov 14Nov 29Nov E.zuernii 3 E.zuernii E.zuernii 5 E.bovis 21 E.bovis E.bovis 9 E.brasiliensis 6 E.brasiliensis E.cylindrica 7 E.auburnensi E.auburnensis 3 s Sep 24ct 29ct E.bovis 8 Un sporulated E.zuernii 15 E.subspheric E.zuernii 1 a 4 E.auburnensis 1 E.cylindrica 9 4T 18Nov 26Nov E.brasiliensis 3 E.zuernii 17 E.auburnensis 8 E.bovis Nov 18Nov 26Nov E.bukidnonen E.alabamens E.bovis 6 sis 9 is 2 E.zuernii 17 E.bovis 5 E.zuernii 2 E.subspherica 8 E.auburnensis 16 E.bovis 6 w \
158 E.wyomingensis Nov 5Nov E.bukidnonensi s 12 E.zuernii 6 E.bovis 3 E.alabamensis 9 E.canadensis 16 E.subspherica 3 E.auburnensis 8 E.cylindrica Nov 18Nov E.alabamensis E.auburnensis E.bukidnonen E.zuernii sis E.bovis E.bovis 57 26Nov 5Nov E.bovis 1 E.canadensis 9 E.cylindrica 4 E.cylindrica 19 E.canadensis 3 E.zuernii 3 E.wyomingensis 6 E.subspherica Nov 24Sep E.bukidnonensi s 23 E.zuernii E.zuernii 3 E.canadensis E.bukidnonen E.ellipsoidalis 7 sis 32 24Sep 26Nov E.canadensis E.zuernii 9 E.zuernii E.bovis 11 11Nov 14Nov E.auburnensi s 27 E.zuernii E.bovis 3 E.bovis 5Nov Unsporulated 24Sep 12Dec E.bovis 18Nov E.zuernii 4 E.canadensis E.canadensis 5 E.bovis 3 e.cylindrica 1 E. subspherica 2 Dec5 E.cylindrica 24Sep E.canadensis 1 E.canadensis E.zuernii 1 E.bovis E.bovis 2 E.cylindrica 2 24Sep E.bovis E.auburnensis ct E.aburnens 11 is E.bovis E.zuernii 21ct E.canaden 1 sis 8 5Nov 11Nov 13 E.canadensis 3 E.zuernii 4 E.bukidnonen 2 E.cylindrica sis 1 5 E.zuernii 19 E.subspheric a E.canadensis 6 2.j:>.
159 E.bukidnonen E.subspherica sis 5+3 E.bovis 1 E.auburnensis 2 E.ellipsoidalis 61T 68T 29Nov 5Dec E.zuernii 13 E.auburnensis 3 E.cylindrica 17 E.zuernii E.wyomingensis E.subspherica 9 E.bovis 12 67T 67T 29Nov 21Nov 14Nov 12Dec E.zuernii 11 E.bovis 3 E.ellipsoidalis 1 E.bovis 12 E.bovis 1 E.zuernii 2 E.bovis 2 E.ellipsoidalis 5 E.ellipsoidalis 9 E.ellipsoidalis 5 E.zuernii 12 E.zuernii 6 E.auburnensis 6 E.aburnensis 8 8T 66T 3Nov 4Nov 5Dec E.zuernii 12 E.bovis 15 E.zuernii 8 E.bovis 18 E.zuernii 14 E.bovis 13 E.auburnensis 1 E.aburnensis Nov 12Sep 5Nov 11Nov E.auburnensis 4 E.zuernii E.zuernii E.zuernii 1 E.zuernii 3 E.canadensis E.cylindrica E.ellipsoidalis 8 E.bukidnonen E.cylindrica 1 E.ellipsoidalis sis 18 E.canadensis E.auburnensis Nov E.zuernii 5 E.zuernii 3 Un sporulated E.wyomingensis 25 E.cylindrica 3 2 6Nov 29ct 11Nov 29ct E.bovis 9 E.zuernii 3 E.bovis 11 E.zuernii 2 E.bukidnonen E.ellipsoidalis 1 sis 1 E.zuernii 13 39
160 E.zuernii 6 E.cylindrica 3 E.aburnensis 1 E.aburnensis E.alabamensi s Nov E.zuernii 11 E.cylindrica 9 E.ellipsoidalis 8 E.aburnensis 2 38T 14Nov E.zuernii 14 E.bovis 1 E.canadensis 9 E.bukidnonensi s 2 18T 14Nov E.bovis 25 E.zuernii 5 29T 14Nov E.zuernii E.bovis 2T 7Nov E.zuernii 1 E.canadensis 5 E.bovis 7 12T 7Nov 9 24Sep E.zuernii 5 E.auburnensis 2 E.bovis 24 E.bukidnonen sis 21Nov E.zuernii 3 E.bovis 13 E.wyomingens is 8 E.auburnensis 6 12Dec E.bovis 7 E.auburnensis 1 E.alabamensis 2 12Dec E.zuernii E.bovis E.wyominge nsis "'" N
161 E.zuernii E.bovis E.cylindrica 13T 7Nov E.zuernii 1 E.bovis 13 E.auburnensis 8 E.subspherica 2 71T 7Nov E.bovis 21 E.zuernii 9 21Nov E.zuernii E.bovis Jan E.auburnensis 1 22T 3Nov E.zuernii 9 E.bovis 21 E.canadensis 1 38T E.zuernii 3 E.bovis 27 1T 7Nov E.bovis 27 E.zuernii 3 31T 21Nov E.zuernii 6 E.canadensis 7 E.wyomingensis 5 E.auburnensis 7 E.bovis 5 19T 5Dec E.bovis E.zuernii 25 5 """ w
162 27Nov 12Dec E.zuernii E.bovis 12 E.bovis 2 E.cylindrica 9 E.canadensis 6 E.alabamensis 5 E.bukidnonensi s?1 E.auburnensis 5 E.zuernii 3 S7T 21Nov E.zuernii 25 E.bukidnonensi s 5 SOT 29Nov 21Nov E.zuernii 5 E.bovis 28 E.auburnensis 1 E.zuernii 5 E.bovis 1 S1T S1T 21Nov 29Nov E.bovis E.zuernii 3 E.bovis 24 E.zuernii 14 un sporulated E.zuernii 7 E.wyominge E.wyomingensis 7 nsis E.alabamensis 3 E.auburnensis 6 39T 21Nov E.zuernii 2 E.aburnensis 28 72T 72T 21Nov 29Nov SDec E.zuernii 6 E.bovis 2 E.bovis 12 E.bovis 21 E.zuernii 2 E.brasiliensis 5 E.auburnensi E.wyomingensis 4 E.cylindrica 8 s 2 E.zuernii 18 1ST t
163 29Nov E.bovis 18 E.zuernii 7 E.auburnensis 7 6T 29Nov E.zuernii 13 E.bovis 17 29Nov 44 T E.bovis 21 E.zuernii 5 E.wyomingensis 1 74T 29Nov E.bovis 15 E.cylindrica 6 E.subspherica 2 E.zuernii 7 63T 12Dec E.auburnensis 2 E.bovis 8 E.zuernii 1 59T 29Nov E.zuernii 11 E.bovis 13 E.cylindrica Nov E.bovis 17 E.zuernii 4 6UR nensis.. u 1 nonens1 5Dec E.bovis 19 E.zuernii 9 E.bukidn 5 5Dec E.bovis 23 E.zuernii 8 E.auburnensis 3 5Dec E.bovis 7 E.zuernii 2 5Dec E.auburnensis 3 E.bovis 18 E.zuernii 8 E.cylindrica 2.p.. Ul
164 s E.wyomingensis Nov E.bovis 26 E.zuernii 4 E.brasiliensis 16 E.cylindrica Nov E.bukidnonensi s 15 E.zuernii 12 E.cylindrica 2 E.brasiliensis Nov E.brasiliensis 8 E.zuernii E.bovis 598 ii 11 E.bovis 14 E: Y mfilensis 1 E.bovis 3 t7t.cylindrica 5 t.augurnensjs 23.au urnens1s Nov E.aburnensis E.canadensis E. cylindrica > \
 (/) (/) (/) \"ifj (/) c c == E u (/) c c ro (/) tc O ::J ::J I ::J")
165 147 N (/) :;:. w (/) (/) (/) (/) "ifj (/) c c == E u (/) c c ro (/) tc O ::J ::J I ::J O ::J ON "! M "! M,... WWWo::t WWWW Cl) :;:. (ij (ij. :;:.

166 Appendix Species measurements : Note: L=Length, W:width, R= Ratio of L /w no zuerni E.subsperi E.auburnen E. bukidnon E.eanaden E. bovis E.eylindrie E. ellipsoid E. wyoming E.brasillien E.alabame ea sis ens is sis a at ensis sis nsis No L w R L w rati L w R L w R L w R L w R L w R L w R L w R L w R L w R I no zuerni E.subsperi E.auburne E. bukidno E.eanaden E. bovis E. eylindrie E. ellipsoid E. wyomin E.brasillie E.alabame ea nsis nensis sis a gensis nsis nsis a/ I.j>..

167 : 1.4 ' ' ' ' ' 'Cl
168 no g. zuerni E. subsperi E.auburne E.bukidno E.canaden E. bovis E. cylindric E. ellipsoid E. wyomin E.brasillie E.alabame ea nsis nensis sis a gensis nsis nsis at ' Ul
169 ' no g_. zuerni E.subsperi E.auburne E. bukidno E.canaden E. bovis E.cylindric E. ellipsoid E. wyomin E. brasillie E.alabame ea nsis nensis sis a a/ gensis nsis nsis I I i I ! ' I I I Ul
170 no g. zuerni E.subsperi E.auburne E.bukidno E.canaden E. bovis E. cylindric ea nsis nensis sis a E. ellipsoid E. wyomin a/ gensis E. brasillie nsis E.alabame nsis Ul N

171 no f. zuerni E.subsperi E.auburne E. bukidno E.canaden E. bovis ea nsis nensis sis E. cylindric E. ellipsoid E.wyomin a a/ gensis E.brasillie nsis E.alabame nsis tgo M a X M in Tot al E E. ellipsoid E. wyoming E. brasillien E.alabame S/. f. zuernii Esubsperic E.auburnen E.bukidnon E. canaden E. bovis no. a sis ensis sis cylindrica a/ ensis sis nsis Vl VJ
 Q) Ul CV ea Ul c: c: c: (J \"C 1: Ul Q) Cl c: Q) Q) ;:: cs.9:! c: E ' ' Q) c: c. c:.!!! Ul c: E CV Q).. CV 1: c. Ul.. 1/).D Q) > c: CV ::J..::t! CV > CV c :J CV >...D ::J ::J.")

172 154 Appendix Oocysts identified to species from the study on Massey University No. 4 Dairy Farm. ci z Ul.!!! CV u; Ul Ul Ul.!!! Ul c: Ul (J c: u; ;: Q) Q) Ul CV ea Ul c: c: c: (J "C 1: Ul Q) Cl c: Q) Q) ;:: cs.9:! c: E ' ' Q) c: c. c:.!!! Ul c: E CV Q).. CV 1: c. Ul.. 1/).D Q) > c: CV ::J..::t! CV > CV c :J CV >...D ::J ::J. (J <? G.!. ::J Cl!.D 3: CV ' w w u..i w w u..i et w u..i u..i u..i Nov Nov Nov NOv Nov Nov Nov Nov Dec Oct Nov Nov Nov Sep Nov Dec Sep Nov Oct Nov Nov Nov Nov Nov No /1 3/1 2 8/1 2 5/1 2 9/1 2 4/1 2 7/1 2 2/1 2 3/25 2 preval ence%
173 Appendix Oocyst identification from calves from Tuapaka Farm. In total 23 faecal samples were examined 155 z Cll 1' c:... Cll :I N u.i 1', '(5 1/) Q. a; W UI 'iij c:. 'iij 1'.... W UI 1/) c: Cll c:... :I. :I 1' ' 11) w ;: Q).J:. Q. tij.. :I!I! 1' UJ u Cll c: c:, :si: :I 1/)., 11) w e: Cll Cl c:.e >I/) ::. 11) W e: 1/) c: Cll E 1'. 1' (ij ' 11) w 1 4T 2 Nov 21 11T Nov 14 Nov 21 Nov 29 4T Nov 7 Nov 26 61T Nov 29 67T Nov Nov 21 2 Nov Dec 12 ST T Nov 4 Dec 12 38T Nov 7 Nov 11 Nov 14 1ST Nov T Nov 14 Nov 21 Dec 12 2T Nov 7 Dec 12 12T
174 Nov 7 8T Nov Nov T Nov Nov T 13 Nov T Nov Dec 5 1T 5 25 Nov T Nov T Nov Dec T 21 Nov 21 5T 25 5 Nov Nov T 5 Nov Nov 29 39T Nov 21 72T 2 28 Nov Nov Dec 5 15T Nov T Nov Dec T Nov T Nov
175 157 Dec T Dec Dec T Nov Dec T Nov Dec T Dec T Nov total +ve/t 32/33 3/33 6/33 11/33 2/33 3/33 2/33 3/33 4/33 5/33 2/33 :33 otal prev alenc 3 e No
 CO 1/) 1/).!!! 1/) 1/) 1/) c: 'iii (..) c: 1/) CO eo 1/) Q) 1/) c: Q) c: c: c: (.")
 Q). \"l. CO =c u.i u.i u.i w u.")
 Nov 19 12 2 15 Apiti 6 Sep 23 2 3 2 4 4 massey organic(po oled) 1 1 1 1 Maurice 1 1 2 Farm No.")
176 158 Appendix 2.4.3: Identification of oocysts in faeces of calves from other Farms. c:) z !!!.!!! 1/) CO 1/) 1/).!!! 1/) 1/) 1/) c: 'iii (..) c: 1/) CO eo 1/) Q) 1/) c: Q) c: c: c: (..) ' c: Q) Q) Cl Q) Q) '(5. c:..c: c: c: E c: 1/) "C '... Q, 1/) ' E CO Q)... CO c: :;; Q, 1/) :::1 1/). Q) c:....11:: CO CO :::1 CO >.... :::1 :::1 :::1 > c N. (..) Q). "l. CO =c u.i u.i u.i w u.i w w w w w w Blakies 7 DB Nov Nov DB Nov DB Nov Ballentrae 4B(NC1) Nov B(NC2) Nov Apiti 6 Sep massey organic(po oled) Maurice Farm No Prevalence /o 14
177 159 Appendix 3.1. Calf treatment: Appendix 3.1.a. Calf performance 2% pellets Supplied by Denver Stock Feeds Barley meal 6% Soya bean meal 2% Copra Meal 1 % Molasses 2.5% Limestone Salt Soya bean oil Calf premix Total 2% 2%.5%.25% 1.15% Monensin.1% Batch No Supplied by: Denver Stock Feeds Expiry date: April 24. Final monensin concentration of feed was 1 OOmg/kg of calf meal Appendix 3.1. b. Baycox (Toltrazuril) specifications: Trade name: Baycox Concentration: Baycox (piglet coccidiocide toltrazuril 5g/L) Batch No: 1848A25 Expiry Date: June 23 Toltrazuril 2ml contained active constituent of Toltrazuril 5g/l. batch. No.1848A25. Expiry Date: June 23 and the animals were dosed using 2ml syringe.

178 16 Appendix 3.2. Feeding Schedule of the calves. Day Date Activity. Milk liter Meal Dose of Fed monensin Am Pm Am Pm per day 1 14/8/ 2 F/S, B/S and g 5mg Weighed. 2 15/8/2 Calves had g coats on. 3 16/8/ g 5mg 4 17/8/ g 5mg 5 18/8/ /8/ /8/2 F/S, B/S, 1.5 5g Weighed g 5g 5mg 5mg 5mg 5mg Required monensin dose to achieve 1mg/kg feed (mean calf weight) 47.66mg/ 47.66kg 8 21/8/ /8/ g Pellets, 5mg Hay 1 23/8/ _g_ 11 24/8/2 5. 1g 1mg 12 25/8/ OOg 1mg 13 26/8/ mg G 14 27/8/2 F/S, B/S, 5. 1g 1mg 547mg/ Weighed. 54.7kg 3.5 5g 5mg 5mg_ 15 28/8/2 5. 1g 1mg 16 29/8/2 5. 1g 1mg 17 3/8/2 5. 1g 1g 2mg 18 31/8/2 5. 1g 1 OOg,Ha 2mg 19 1/9/2 5. 1g 1g 2mg 2 2/9/2 5. 1g 1g 2mg 21 3/9/2 5. 1g 1g 2mg 59.5mg/ 59.45kg 22 4/9/ OOg 15g 2mg 23 5/9/2 5. 1g 15g 25mg 24 6/9/2 5. 1g 15g 25mg 25 7/9/2 5. 1g 15g 25mg 26 8/9/ g 15g 3mg 27 9/9/ g 15g 3mg 28 1/9/2 F/S, B/S, 5. 15g 15g 3mg 64.mg/ Weighed 64.4kg 29 11/9/ g 2g 35mg 3 12/9/2 5. 2g 2g 4mg 31 13/9/2 5. 2g 2g 4mg 32 14/9/2 5. 2g 2g 4mg y.

179 33 15/9/2 5. 2Q 2g 34 16/9/2 5. 2g 2g 4mQ 4mg 35 17/9/2 F/S,B/S, 5. 2g 2g 4mg 7mgl Weighed 7.45kQ 36 18/9/2 5. 2g 25g 37 19/9/ g 25g 38 2/9/ g 3g 39 21/9/2 5. 3g 3g 45mg 5mg 55mg 6mg 4 22/9/2 5. 3g 3g 41 23/9/2 2 cows 5. 35g 35g 7mg were allowed to graze the grass for one day /9/2 F/S, B/S, 35g 35g 7mg 74.5mg/ Weighed. 74.5kg 6mg /9/2 Cows were 4. 35g 4g 75mg allowed to graze overnight /9/2 4. 4g 4g 27/9/2 3. 4g 45g 46 28/9/ g 45g 45 8mg 85mg 9mg 47 29/9/2 2. 5g 5g 1mg 48 3/9/2 2. 5Q 5g 1mg 49 1/1/2 F/S, B/S, 2. 5g 5g 1mg 8.2mg/ Weighed. 8.29kg 5 2/1 /2 2. 5g 5g 1mg 51 3/1 /2 5g 5g 1mg 52 4/1 /2 5g 5g 1mg 53 5/1 /2 5g 5g 1mg 6/1 /2 5Q 5g 1mg 55 7/1 /2 5g 5g 1mg 8/1 /2 F/S, B/S, 5g 5g 1mg Weighed /1 /2 5g 5g 1mg 58 1/1 /2 5g 5g 1mg 95. mg/ 59 11/1 /2 Grazing 5g 5g 1mg paddock with cows 6 12/1 /2 5JJ 5g 1mg 61 13/1 /2 5g 5g 1mg 62 14/1 /2 5g 5g 1mg 63 15/1 /2 F/S, B/S, 5g 5g 1mg Weighed /1 /2 Debudding 5g 5g 1mg 33calves bleed /1 /2 5g 5g 1mg 66 18/1 /2 5g 5g 1mg 67 19/1 /2 5g 5g 1mg 95kg

180 68 2/1/2 5Q 5q 1mg 69 21/1 /2 5g 5g 1mg 22/1 /2 F/S, B/S, 5g 5g 1mg 1 22mg/ Weighed kg /1/2 5g 5g 1mq 72 24/1 /2 Weaned. F/S,B/S, Drenched with Toltrazuril, Vaccinated with 7 in one /1 / /1/ /1/ /1 / /1 /2 96.mg/ 78 3/1 / /1/2 8 1/1 1/2 82 3/1 1/2 83 4/1 1/2 Gate open between last twopaddocks and calves were allowed all together in the first two paddocks kg 84 5/1 1/2 F/S, B/S, 97.5kg Weighed. 85 6/1 1/ kg 9 11/1 1/ /1 1/2 F/S, B/S, Weighed /1 1/2 95 to 16/1 1/ /1 1/ kg 97 18/1 1/2 F/S, B/S, Weighed /1 1/2 99 2/1 1/ /1 1/ /1 1/2 F/S, B/S,
. 3. Steel bowl ans spoons. 4. Cover slips. 5. Pipettes. 6. Universal Glass bottle (28ml). 7. Centrifuge Tubes. b. Solutions: 1.")
181 Weighed /1 1/2 11 1/12/ /1 2/2 14 calves were coughing 112 3/1 2/2 F/S, B/S, Weighed /1 2/2 End of the 9/1 2/2 work kg Appendix 3.3. SOPs: Appendix ocyst counting: a. Equipment used: 1. McMaster chamber. 2. Filter (Coffee Strainer). 3. Steel bowl ans spoons. 4. Cover slips. 5. Pipettes. 6. Universal Glass bottle (28ml). 7. Centrifuge Tubes. b. Solutions: 1. Saturated salt solution. ( Specific gravity 1.2) c.technique used All the samples were collected directly from the rectum and stored at 4 oc until used. Oocysts were counted using a modified McMaster technique as follows: 1. Two gram faeces were weighed and 28ml saturated NaCI solution (specific gravity 1.2) measured out. The feces were homogenized in some of the salt solution in a bowl. The suspension was then poured through a 5umaperture sieve and the remaining salt solution was used to wash the bowl and the material retained on the sieve. 1. Samples were withdrawn using a Pasteur pipette and run into two counting chambers. The total number of oocysts counted, multiplied by 5, and represented the number of oocysts contained in one gram of faeces (OPG).
182 164 Appendix Separation of oocysts for sporulation for samples > 1 Opg: a. Equipment: 1. Steel bowls Filter (tea strainer) 3. 1 Sieve and water jet. 4. Centrifuge tubes (5ml and 2ml). 5. 'J' pipette and Pasteur pipette. 6. Suction pump and a jar. 7. Test tube stands. 8. Centrifuge. 9. Petridishes. b. Solutions: 1. Saturated salt solution 2. 2% H 2 So 4 C. Technique: 1. 5g faeces from each sample were homogenized with 5ml tap water and filtered through a 5umsieve.The residue in each sieve was washed with a jet of tap water from a wash bottle. 2. Approximately 5mls filtrate was centrifuged at 8g for 6 minutes. 3. Two thirds of the supernatant was discarded. The sediment was re suspended in tap water and re centrifuged as in step2. 4. The resultant sediment was resuspended in NaCI solution (specific gravity1.2) and allow to stand for 1 minutes to allow coarse material to sink with little chance of trapping oocysts. The suspension was then centrifuged at 4g for 6 minutes. 5. The tube was removed gently from the centrifuge and allowed to stand for a further 1 minutes in order to compensate for any disturbance of the oocyst band at the top. 6. Approximately 5mls was sucked from the top using a "J" tip pipette attached to a suction pump and collected in a 5ml centrifuge tube. 7. The oocysts were washed free of salt solution by suspension and centrifugation in distilled water twice. 8. The washed sediment was transferred to a 15ml graduated conical centrifuge tube and centrifuged at 15g for 6 minutes. 9. The supernatant (appoximately 12mls) was discarded and the sediment resuspended in 2% H 2 So4 solution. The total volume was not > 5ml. The suspension was the placed in a 35mm petridish. 1. The petridish was placed in a 2JCC room for 7 days. lt was checked regularly to avoid drying out. Further 2% of H2S 4 was added as needed. Appendix Recovery of sporulated oocysts: Petridishes were removed from the 2JDC room and the oocysts were recovered as follows: 1. The oocyst suspension was stirred thoroughly in order to free the oocysts, which usually adhere to the bottom. 2. The suspension was washed into micro tubes and stored at 4 C until used for species identification. Appendix Staining of Cryptosporidium oocysts by a modified Zeihl Neilson technique: The following procedure was used 1. Dry smear at room temperature 2. Fix in 96% methanol for 2 to 5 minutes
183 3. Dry at room temperature 4. Fix briefly in flame 5. Stain with concentrated Carbol fuchsin 2 to 3 minutes without heating 6. Rinse in tap water 7. Differentiate with H2S4 for 2 to 6 minutes (concentrations 51%) 8. Rinse in tap water 9. Counter stain with 5% malachite green for 5 minutes 1. Rinse in tap water 11. Dry at room temperature 12. Mount in eukitt In smears stained by this technique Cryptosporidium appear as 3 to 6 Jlm in diameter, densely stained red bodies clearly distinguishable against a green background. Some of the parasites however are rather stained, these are probably oocysts or their precursors. The cryptosporidium contain a varying number of darker blue or brownish internal bodies. The parasites are easily detected at magnifications of 2 to 4 x. The properties of the carbol fuchsin dye may vary, and with certain preparations step 5 in the staining procedure may have to be extended to 1 hour even overnight. For differentiation (step 7) H2S4, 1 % may be used in concentrations from.25% to 1 O%.The most appropriate concentration of the acid and length of the differentiation procedure would seem to depend on the properties of the carbol fuchsin dye. So before adopting the technique, it is advisable to make a few experiments with positive control smears, in order to adjust steps 5 and 7 to the dye preparation available. In smears from fecal samples or ileal mucosa scrapings, yeasts were found to be stained by the Giemsa method, but not by the Zeihl Neilsen method. 165
184 166 Appendix MERIFLUOR (Meridian diagnostics) Cryptosporidiuml Giardia, direct immunofluorescent detection procedure for the simultaneous detection of Cryptosporidium oocysts and Giardia cysts in faecal material. 1. Use a transfer loop to transfer a drop of fecal sample to a treated slide well. Spread the specimen over the entire well. Do not scratch the treated surface of the slide. 2. Use a new transfer loop to transfer a drop of positive control to a separate treated slide well. Spread the positive control over the entire well. Do not scratch the treated surface of the well. 3. Use a new transfer loop to transfer a drop of negative control to a separated treated side well. 4. Allow the slides to air dry completely at room temperature (usually requires 3 minutes). 5. Place one drop of detection reagent in each well. 6. Place one drop of counterstain in each well. 7. Mix the reagents with an applicator stick and spread over the entire well. Do not scratch the treated surface of the well. 8. Incubate the slides in a humidified chamber for 3 minutes at room temperature. Note: Protect from the light. 9. Use a wash bottle to rinse the slides with a gentle stream of 1 x wash buffer until excess detection reagent and counterstain is removed. Note: Do not submerge the slides during rinsing. Avoid disturbing the specimen or causing cross contamination of the specimens. 1. Remove excess buffer by tapping the long edge of the slide on a clean paper towel. Note: Do not allow the slide to dry. 11. Add one drop of mounting medium to each well and apply a cover slip. 13. Scan each well thoroughly using 1 2X magnification. The presence of oocysts should be confirmed at higher magnification.

185 167 Appendix Oocyst counts up to weaning: st 8th 15th 22 Aug Aug Aug Aug Aug Sep Sep Sep Sep Sep Sep Sep oct oct oct Oct No. Treat rep R R R R Mean R R R R Mean R R R R 3 IO NR NR NR NR Mean NR NR NR NR 2 1 io Mean NR NR NR Mean The second column of the above table represents the "treatment " R means monensin added to pellets and NR means monensin is not added to pellets. Rep represents 3 different groups (1 to 3) under each group that is Monensin treated and nontreated groups. Rest of the columns are different occasions of sample collections. NR ' I I I I I
186 168 Appendix Weekly average oocyst counts of calves up to weaning (Group wise) : T R R G ro u p R N R N R N R The first column of the above table represents the "treatment " R means monensin added to pellets and NR means monensin is not added to pellets. Group represents 3 different groups (1 to 3) under each group that is Monensin treated and nontreated groups. Rest of the columns are, different weeks on Monensin treatment.
187 169 Appendix Statistical analysis for group wise oocyst counts up to weaning: Type 3 Tests of Fixed Effects Effect DF DF F Value Pr > F Week <.1 Treat Rep Rep*treat*week Least mean square means Standard Effect rep week Estimate Error DF t Value Pr > ltl Treat NR <.1 Treat R <.1 Week Week Week Week <.1 Week <.1 Week <.1 Week Week Week Week Week Standard Effect rep week Estimate Error DF t Value Pr > ltl rep*treat*week NR rep*treat*week NR rep*treat*week NR rep *treat*week NR rep *treat*week NR rep *treat*week NR rep *treat* week NR rep *treat*week NR <.1 rep *treat*week NR rep *treat*week NR rep *treat*week NR rep *treat*week R rep*treat*week R rep*treat*week R rep *treat*week R rep *treat*week R rep *treat*week R rep *treat*week R rep *treat*week R rep*treat*week R rep *treat*week R rep *treat*week R rep *treat*week NR rep *treat*week NR rep *treat*week NR rep*treat*week NR rep *treat*week NR
188 rep*treat*week NR rep*treat*week NR rep*treat*week NR rep*treat*week NR rep*treat*week NR rep*treat*week NR rep*treat*week R rep*treat*week R rep*treat*week R rep*treat*week R rep*treat*week R <.1 rep*treat*week R rep*treat*week R rep*treat*week R rep*treat*week R rep*treat*week R rep*treat*week R rep*treat*week NR rep*treat*week NR rep *treat*week NR rep*treat*week NR rep*treat*week NR rep*treat*week NR rep*treat*week NR rep*treat*week NR rep*treat*week NR rep*treat*week NR rep*treat*week NR rep*treat*week R rep*treat*week R rep*treat*week R rep*treat*week R <.1 rep*treat*week R rep*treat*week R rep*treat*week R rep*treat*week R rep*treat*week R rep*treat*week R rep*treat*week R
189 171 Appendix Oocyst counts up to weaning (Treatment wise): Type 3 Tests of Fixed Effects Nu m Den Effect OF OF F Value Pr > F week <.1 treat treat*week Least Squares Means Standard Effect treat week Estimate Error OF t Value Pr > ltl treat NR <.1 treat R week week week week week week week <.1 week week <.1 week week week week week week week treat*week NR treat*week NR treat*week NR treat*week NR treat*week NR treat*week NR treat*week NR <.1 treat*week NR treat*week NR treat*week NR treat*week NR treat*week NR treat* week NR treat*week NR treat*week NR treat* week NR treat*week R treat*week R treat*week R treat*week R treat*week R treat* week R treat*week R <.1 treat*week R treat*week R treat*week R treat*week R treat*week R treat*week R treat*week R treat*week R treat*week R
190 172 Appendix Oocyst counts after weaning showing the status of Two (anticoccidials treatment): No. Treatment 29th 5th 11th 18th 26th 3rd Oct Nov Nov Nov Nov Dec 43 R 116 R 6 R 15 R 28 R 9 R To I To I To I To I To I To I Average NR 31 NR 56 NR 33 NR 113 NR 25 NR BC BC BC BC BC BC Average R 118 R 117 R 16 R 32 R 29 R NBC NBC NBC NBC NBC NBC Average NR NR NR NR NR NR NBC 5 NBC 8 NBC 15 NBC NBC NBC 5 Average Note: NR= meal with out monensin, R= meal with monensin, BC= treated with toltrazuril and NBC= not treated with toltrazuril. Appendix Weekly average weights after weaning Week Treated Untreated
191 173 Appendix 3.5.3: Statistical analysis of oocyst counts after weaning : Type 3 Tests of Fixed Effects Nu m Den Effect DF DF F Value Pr > F week <.1 be bc*week <.1 Least Squares Means Standard Effect be week Estimate Error DF t Value Pr > ltl week week <.1 week <.1 week <.1 week <.1 week <.1 week be BC <.1 be NBC <.1 bc*week BC bc*week BC bc*week BC bc*week BC bc*week BC <.1 bc*week BC <.1 bc*week BC bc*week NBC bc*week NBC <.1 bc*week NBC <.1 bc*week NBC <.1 bc*week NBC <.1 bc*week NBC bc*week NBC
192 174 Appendix Statistical analysis of oocyst counts with two anti coccidials: Nu m Den Type 3 Tests of Fixed Effects Effect OF OF F Value Pr > F Week <.1 rum be rum*bc rum*bc*week <.1 Least Squares Means Standard Effect rum be week Estimate Error OF t Value Pr > ltl week week <.1 week <.1 week <.1 week <.1 week < rum NR <.1 rum R <.1 be BC <.1 be NBC <.1 rum*be NR BC rum*be NR NBC <.1 rum*be R BC rum*be R NBC <.1 Standard Effect rum be week Estimate Error OF t Value Pr > ltl rum*bc*week NR BC rum*bc*week NR BC rum*bc*week NR BC rum*bc*week NR BC rum*bc*week NR BC rum*bc*week NR BC rum*bc*week NR NBC rum*bc*week NR NBC <.1 rum*bc*week NR NBC <.1 rum*bc*week NR NBC rum*bc*week NR NBC rum*bc*week NR NBC rum*bc*week R BC rum*bc*week R BC rum*bc*week R BC rum*bc*week R BC rum*bc*week R BC rum*bc*week R BC rum*bc*week R NBC rum*bc*week R NBC <.1 rum*bc*week R NBC <.1 rum*bc*week R NBC <.1 rum*bc*week R NBC rum*bc*week R NBC Differences of Least Squares Means Standard Effect rum be week rum be _week Estimate Error OF t Value Pr > ltl
193 Week <.1 Week <.1 Week Week Week Week Week Week Week Week Week Week Week Week Week rum NR R be NBC rum*bc NR NR NBC rum*bc NR R rum*bc NR R NBC rum*bc NR NBC R rum*bc NR NBC R NBC rum*bc R R NBC BC BC BC BC BC BC BC
194 176 Appendix Live weights of individual calves up to weaning (Group wise): Animal Treat Rep 14th 2th 27th 3rd Aug Aug Aug Sep 1Oth 17th 24th 1st 8th 15th 22nd Sep Sep Sep Oct Oct Oct Oct 43 R 17 R 116 R 118 R Average 6 R 16 R 15 R 117 R 32 R 28 R 9 R 29 R Average 25 NR 57 NR 39 NR 113 NR Average 3 NR 33 NR 18 NR 56 NR Average 31 NR NR N R NR average Note: NR= fed with meal not added with monensin, R= fed with monensin added meal Appendix Group mean weekly live weights up to weaning: Treat Rep 14th 2th 27th 3rd 1mh 1nh 2Mh 1 8th ment Aug Aug Aug Sep Sep Sep Sep Oct Oct 15th Oct 22n d Oct R R R NR NR NR
195 177 Appendix Statistical analysis of live weights up to weaning (treatment wise): Note= treat=treatment NR= No Monensin feed, R= Monensin added feed Type 3 Tests of Fixed Effects Nu m Den Effect DF DF F Value Pr > F week <.1 treat treat*week Least Squares Means Standard Effect treat week Estimate Error DF t Value Pr > ltl treat NR <.1 treat R <.1 week <.1 week <.1 week <.1 week <.1 week <.1 week <.1 week <.1 week <. 1 week <. 1 week <. 1 week <.1 Standard Effect treat week Estimate Error DF t Value Pr > ltl treat*week NR <.1 treat*week NR <. 1 treat*week NR <. 1 treat*week NR <.1 treat*week NR <.1 treat*week NR <.1 treat*week NR <.1 treat*week NR <. 1 treat*week NR <.1 treat*week NR <.1 treat*week NR <.1 treat*week R <.1 treat*week R <.1 treat*week R <.1 treat*week R <.1 treat*week R <.1 treat*week R <.1 treat*week R <.1 treat*week R <.1 treat*week R <.1 treat*week R <.1 treat*week R <.1
196 178 Appendix Statistical analysis of weight group wise up to weaning: treat= Treatment, rep:replicate, Note: NR= fed with meal not added with monensin, R= fed with monensin added meal, Type 3 Tests of Fixed Effects Nu m Den Effect DF DF F Value Pr > F week <.1 treat rep rep*treat*week Least Squares Means Standard Effect treat rep week Estimate Error OF t Value Pr > ltl treat NR <.1 treat R <.1 week <.1 week <.1 week <.1 week <.1 week <.1 week <.1 week <.1 week <.1 week <.1 week <.1 week <.1 Standard Effect treat rep week Estimate Error DF t Value Pr > ltl rep*treat*week NR <.1 rep*treat*week NR <.1 rep*treat*week NR <.1 rep*treat*week NR <.1 rep*treat*week NR <.1 rep*treat*week NR <.1 rep*treat*week NR <.1 rep*treat*week NR <.1 rep*treat*week NR <.1 rep*treat*week NR <.1 rep*treat*week NR <.1 rep *treat*week R <.1 rep*treat*week R <.1 rep*treat*week R <.1 rep *treat*week R <.1 rep *treat*week R <.1 rep*treat*week R <.1 rep*treat*week R <.1 rep *treat*week R <.1 rep *treat*week R <.1 rep*treat*week R <.1 rep*treat*week R <.1 Standard Effect treat rep week Estimate Error DF t Value Pr > ltl rep*treat*week NR <.1
197 rep*treat*week NR <.1 rep *treat*week NR <.1 rep*treat*week NR <.1 rep *treat*week NR <.1 rep*treat*week NR <.1 rep *treat*week NR <.1 rep *treat*week NR <.1 rep *treat*week NR <.1 rep *treat*week NR <.1 rep *treat*week NR <.1 rep *treat*week R <.1 rep *treat*week R <.1 rep *treat*week R <.1 rep *treat*week R <.1 rep *treat*week R <.1 rep *treat*week R <.1 rep*treat*week R <.1 rep*treat*week R <.1 rep*treat*week R <.1 rep*treat*week R <.1 rep*treat*week R <.1 rep*treat*week NR <.1 rep *treat*week NR <.1 rep*treat*week NR <.1 rep*treat*week NR <.1 rep*treat*week NR <.1 rep*treat*week NR <.1 rep*treat*week NR <.1 rep*treat*week NR <.1 rep*treat*week NR <.1 rep*treat*week NR <.1 rep*treat*week NR <.1 rep*treat*week R <.1 rep*treat*week R <.1 rep*treat*week R <.1 rep *treat*week R <.1 rep*treat*week R <.1 rep *treat*week R <.1 rep*treat*week R <.1 rep*treat*week R <.1 rep*treat*week R <.1 rep*treat*week R <.1 rep*treat*week R <.1 179
198 18 Appendix Statistical analysis adjusted live weights: Type 3 Tests of Fixed Effects Appendix Weight of calves after weaning: Nu m Den Effect OF OF F Value Pr > F Weights after treating with 2mg/kg weight rum be Animal Treatment 29th 5th 11th 18th 3rd 1th week <.1 No: Oct Nov Nov Nov Dec Dec bc*week rum*bc*week R BC lw < R BC Least Squares Means 6 R BC Standard 15 R BC Effect rum be week Estimate Error OF t Value Pr > ltl 28 R BC rum NR <.1 9 R BC rum R <.1 be BC < NR BC be NBC <.1 25 NR BC week <.1 56 NR BC week < NR BC week <.1 14 NR BC week <.1 31 NR BC week <. 1 bc*week BC <. 1 Average bc*week BC <.1 17 R NBC bc*week BC < R NBC bc*week BC < R NBC bc*week BC <.1 16 R NBC bc*week NBC <.1 32 R NBC bc*week NBC < R NBC bc*week NBC <.1 39 NR NBC bc*week NBC <.1 57 NR NBC bc*week NBC <.1 3 NR NBC rum*bc*week NR BC <.1 18 NR NBC rum*bc*week NR BC <.1 47 NR NBC rum*bc*week NR BC <.1 2 NR NBC rum*bc*week NR BC <.1 Average rum*bc*week NR BC <.1 rum*bc*week NR NBC <.1 rum*bc*week NR NBC <.1 Note: NR= fed with meal not added with monensin, R = fed with monensin added meal, BC= treated with rum*bc*week NR NBC <.1 toltrazuril and NBC= not treated with toltrazuril. rum*bc*week NR NBC <.1 rum*bc*week NR NBC <.1 rum*bc*week R BC <.1 rum*bc*week R BC <.1 rum*bc*week R BC <.1 Appendix Weekly average weights after weaning rum*bc*week R BC <.1 Week rum*bc*week R BC <.1 rum*bc*week R NBC <.1 rum*bc*week R NBC <.1 rum*bc*week R NBC <.1 Treated rum*bc*week R NBC <.1 rum*bc*week R NBC <.1 untreated Note: NR = fed with meal not added with monensin, R or Rum= fed with monensin added mea treated with toltrazuril and NBC= not treated with toltrazuril
199 182 Appendix 3.7. Comparison of Monensin concentration of feed actually recquired (1/kg feed} and supplied based on the weekly average weights of the animals. Weeks Required Actual treatment Dose Received on average Dose mg weight mg

200 183 Appendix : Oocysts counts of calves: BC means treated with toltrazuril and NBC means not treated with toltrazuril Group Treatment 7th Nov 14 '" Nov 21 5( Nov 26 '" Nov ara Dec 12 m Dec A. No 75 BC BC BC 64 BC BC BC BC BC 5 62 BC BC 5 3 BC 2 2 BC BC BC BC NBC NBC NBC NBC NBC NBC NBC NBC NBC NBC Average 59 NBC NBC NBC NBC NBC Average Group B 36 BC 3 34 BC 5 52 BC BC 42 BC BC BC BC BC BC BC BC BC


201 BC BC Average NBC NBC NBC NBC NBC NBC NBC NBC NBC NBC NBC NBC NBC NBC NBC Average Group C NBC Sampling 11 NBC NBC 25 6 NBC NBC NBC NBC NBC 5 1 NBC NBC NBC No 57 NBC NBC NBC NBC NBC NBC NBC NBC NBC NBC Average NBC
202 185 Appendix Statistical analysis of oocyst counts: not considering group C The Mixed Procedure Model Information Dependent Variable tfec Covariance Structure Subject Effect Estimation Method Compound Symmetry anim(group*treat) REML Residual Variance Method Profile Fixed Effects SE Method ModelBased Degrees of Freedom Method BetweenWithin Class Level Information Class Levels Values ani m group 2 AB treat 2 be nbc week Animal calves, TreatmentBC= treated with toltrazuril, NBC= not treated with toltrazuril Dimensions Covariance Parameters Columns in X Columns in Z Subjects Max Obs Per Subject Observations Used Observations Not Used Total Observations 35 6 Iteration History Iteration Evaluations 2 Res Log Like Criterion Convergence criteria met. Covariance Parameter Estimates Cov Parm Subject Estimate CS anim(group*treat) Residual Fit Statistics 2 Res Log Likelihood AIC (smaller is better) AICC (smaller is better) BIC (smaller is better)
203 186 Null Model Likelihood Ratio Test OF ChiSquare Pr > ChiSq Type 3 Tests of Fixed Effects Nu m Den Effect OF OF F Value Pr > F week treat <.1 group group*treat*week Least Squares Means Standard Effect group treat week Estimate Error OF t Value Pr > ltl week <.1 week week <.1 week <.1 week week treat be <.1 treat nbc <.1 group A <.1 group B <.1 Effect group treat week Estimate Error OF t Value Pr > ltl group*treat*week A be <.1 group*treat*week A be group*treat*week A be group*treat*week A be group *treat*week A be group*treat*week A be group *treat*week A nbc group*treat*week A nbc group*treat*week A nbc <.1 group*treat*week A nbc <.1 group*treat*week A nbc group*treat*week A nbc group*treat*week B be group*treat*week B be group*treat*week B be group*treat*week B be group*treat*week B be group*treat*week B be group *treat*week B nbc group*treat*week B nbc group*treat*week B nbc <.1 group*treat*week B nbc group*treat*week B nbc group*treat*week B nbc

204 187 Appendix Live weights of calves: Group A" BC calves treated with toltrazuril and NBC calves not treated with toltrazuril 7 ' " 14 ' " '" 3 ' 12 tn NO. Treatment Nov Nov Nov Nov Dec Dec BC BC BC BC BC BC BC BC BC BC BC BC BC BC BC Arithmetic mean Untreated group: Group A 18 NBC NBC NBC NBC NBC NBC NBC NBC NBC NBC NBC NBC NBC NBC Arithmetic mean Group B 36 BC BC BC BC BC BC BC BC BC BC BC BC BC BC BC Arithmetic mean


205 NBC NBC NBC NBC NBC NBC NBC NBC NBC NBC NBC NBC NBC NBC NBC Group C no sampli 73 NBC ng NBC NBC NBC NBC NBC NBC NBC NBC NBC NBC or 27 NBC NBC NBC NBC NBC NBC NBC NBC NBC NBC Arithmetic Mean Appendix Average weekly weight of calves: Group Group A B Week BC NBC BC NBC BC calves treated with toltrazuril and NBC calves not treated with toltrazuril
206 Appendix Statistical analysis of Liveweights: The Mixed Procedure Model Information Dependent Variable lw Covariance Structure Compound Symmetry Subject Effect anim Estimation Method REML Residual Variance Method Profile Fixed Effects SE Method ModelBased Degrees of Freedom Method BetweenWithin Class Level Information Class Levels Values ani m gr 2 ab treat 2 be nbc week Note: gr= Group A, B, Treat= Treated with toltrazuril (BC), Not treated with toltrazuril (NBC), Week= weeks post treatment. Dimensions Covariance Parameters Columns in X Columns in Z Subjects Max Obs Per Subject Observations Used Observations Not Used Total Observations Iteration History Iteration Evaluations 2 Res Log Like Criterion Convergence criteria met. Covariance Parameter Estimates Cov Parm Subject Estimate CS anim Residual Fit Statistics 2 Res Log Likelihood AIC (smaller is better) AICC (smaller is better) BIC (smaller is better) Null Model Likelihood Ratio Test OF ChiSquare Pr > ChiSq <.1 Solution for Fixed Effects Standard Effect gr treat week Estimate Error OF t Value Pr > ltl


207 19 Intercept gr gr treat treat week week week week week week a b be nbc < <.1 <.1 <.1 <.1 <.1 Effect Standard gr treat week Estimate Error DF t Value Pr > ltl gr*treat*week gr*treat*week gr*treat*week gr*treat*week gr*treat*week gr*treat*week gr*treat*week gr*treat*week gr*treat*week gr*treat*week gr*treat*week gr*treat*week gr*treat*week gr*treat*week gr*treat*week gr*treat*week gr*treat*week gr*treat*week gr*treat*week gr*treat*week gr*treat*week gr*treat*week gr*treat*week gr*treat*week lw1 a a a a a a a a a a a a b b b b b b b b b b b b be be be be be be nbc nbc nbc nbc nbc nbc be be be be be be nbc nbc nbc nbc nbc nbc <.1 Type 3 Tests of Fixed Effects Num Den Effect DF DF F Value Pr > F gr 1 treat 1 week 5 gr*treat*week 16 lw1 1 Effect gr gr treat < <.1 Least Squares Means Standard gr treat week Estimate Error DF t Value Pr > ltl a b be <.1 <.1 <.1
208 191 treat week week week week week week nbc <.1 <.1 <.1 <.1 <.1 <.1 <.1 Standard Effect gr treat week Estimate Error DF t Value Pr > ltl gr*treat*week a be gr*treat*week a be gr*treat*week a be gr*treat*week a be gr*treat*week a be gr*treat*week a be gr*treat*week a nbc gr*treat*week a nbc gr*treat*week a nbc gr*treat*week a nbc gr*treat*week a nbc gr*treat*week a nbc gr*treat*week b be gr*treat*week b be gr*treat*week b be gr*treat*week b be gr*treat*week b be gr*treat*week b be gr*treat*week b nbc gr*treat*week b nbc gr*treat*week b nbc gr*treat*week b nbc gr*treat*week b nbc gr*treat*week b nbc <.1 <.1 <.1 <.1 <.1 <.1 <.1 <.1 <.1 <.1 <.1 <.1 <.1 <.1 <.1 <.1 <.1 <.1 <.1 <.1 <.1 <.1 <.1 <.1 Considering group C The Mixed Procedure Model Information Data Set WORK. FOUR Dependent Variable tfec Covariance Structure Compound Symmetry Subject Effect anim(group*treat) Estimation Method REML Residual Variance Method Profile Fixed Effects SE Method ModelBased Degrees of Freedom Method BetweenWithin Class Level Information Class Levels Values
209 192 ani m group 3 AB C treat 2 be nbc week Dimensions Covariance Parameters Columns in X Columns in Z Subjects Max Obs Per Subject Observations Used Observations Not Used Total Observations Iteration History Iteration Evaluations 2 Res Log Like Criterion Convergence criteria met. Covariance Parameter Estimates Cov Parm Subject Estimate CS anim(group*treat) Residual Fit Statistics 2 Res Log Likelihood AIC (smaller is better) AICC (smaller is better) BIC (smaller is better) Null Model Likelihood Ratio Test OF ChiSquare Pr > ChiSq Type 3 Tests of Fixed Effects Effect Num OF Den OF F Value Pr > F
210 193 week treat group group*treat*week <.1 Least Squares Means Standard Effect group week Estimate Error OF t Value Pr > ltl week 1 Nonest week 2 Nonest week 3 Nonest week 4 Nonest week 5 Nonest week 6 Nonest treat be Nonest treat nbc Nonest group A <.1 group B <.1 group c Nonest group*treat*week A be <.1 group*treat*week A be group*treat*week A be group*treat*week A be g roup*treat*week A be group*treat*week A be group*treat*week A nbe group*treat*week A nbe group*treat*week A nbc <.1 group*treat*week A nbc <.1 group*treat*week A nbc group*treat*week A nbc group*treat*week B be group*treat*week B be g roup*treat*week B be g roup*treat*week B be g roup*treat*week B be g roup*treat*week B be group*treat*week B nbc g roup*treat*week B nbe g roup*treat*week B nbe <.1 group*treat*week B nbe group*treat*week B nbe group*treat*week B nbe group*treat*week c nbe <.1 group*treat*week c nbc <.1 group*treat*week c nbc <.1 group*treat*week c nbc group*treat*week c nbe

211 194 Appendix Live weights of calves treated with toltrazuril at weaning : Group A: BC calves treated with toltrazuril and NBC calves not treated with toltrazuril NO. Treatment Group A BC 19 BC 17 BC BC 22 BC 16 BC 2 BC 7 BC 62 BC 77 BC 3 BC 2 BC 6 BC 66 BC 12 BC Arithmatic mean Group A 18 NBC 65 NBC 8 NBC 13 NBC 1 NBC 63 NBC 5 NBC 4 NBC 21 NBC 68 NBC 59 NBC 74 NBC 71 NBC 69 NBC 76 Arithmetic mean GrouJ> B 36 BC 34 BC 52 BC 4 BC 42 BC 54 BC 48 BC 55 BC 53 BC 32 BC BC h Nov th Nov t Nov 28 th Nov rd Dec t h Dec

212 195 BC BC BC BC Arithmetic mean NBC NBC NBC NBC NBC NBC NBC NBC NBC NBC NBC NBC NBC NBC NBC Group C NBC NBC NBC NBC NBC NBC NBC NBC NBC NBC NBC NBC NBC NBC NBC NBC NBC NBC NBC NBC NBC Arithmetic Mean or
Diagnosis, treatment and control: dealing with coccidiosis in cattle
 Vet Times The website for the veterinary profession https://www.vettimes.co.uk Diagnosis, treatment and control: dealing with coccidiosis in cattle Author : Adam Martin Categories : Vets Date : January
Phylum:Apicomplexa Class:Sporozoa
 Phylum:Apicomplexa Class:Sporozoa The most characteristic features of sporozoa are 1-unique appearance of most protozoa makes it possible for knowledge able person to identifiy them to level of genus and
Protozoa. Apicomplexa Sarcomastigophora Ciliophora. Gregarinea Coccidia Piroplasma
 Protozoa Apicomplexa Sarcomastigophora Ciliophora Gregarinea Coccidia Piroplasma Coccidia characterized by thick-walled oocysts excreted in feces In Humans Cryptosporidium Isospora Cyclospora Sarcocystis
HISTOPATHOLOGY. Introduction:
 Introduction: HISTOPATHOLOGY Goats and sheep are the major domestic animal species in India. Much of the economy of the country has been depend upon the domestication of these animals. Especially economy
Apicomplexans Apicomplexa Intro
 Apicomplexans Apicomplexa Intro Cryptosporidium Apicomplexan Select Characteristics Gliding motility Apical Complex organelle for invasion of host cell Life cycle alternates b/w sexual and asexual phases
Coccidiosis in macropods and other species
 Coccidiosis in macropods and other species Author: Derek Spielman Wildlife Assistance and Information Foundation; Sydney School of Veterinary Science, the University of Sydney Abstract This presentation
Joerg Kinne, Mansoor Ali*, Ulrich Wernery, and J. P. Dubey
 J. Parasitol., 88(3), 2002, pp. 548 552 American Society of Parasitologists 2002 CLINICAL LARGE INTESTINAL COCCIDIOSIS IN CAMELS (CAMELUS DROMEDARIUS) IN THE UNITED ARAB EMIRATES: DESCRIPTION OF LESIONS,
Coccidiosis in Lambs. Dr Fiona Lovatt. Flock Health Ltd. RCVS Recognised Specialist in Sheep Health & Production
 Coccidiosis in Lambs Dr Fiona Lovatt RCVS Recognised Specialist in Sheep Health & Production Flock Health Ltd What is coccidiosis? Fifteen different types of coccidia may affect sheep in UK but only two
STUDIES ON BOVINE COCCIDIA [APICOMPLEXIA: EIMERIIDAE] IN PARTS OF PLATEAU STATE, NIGERIA
![STUDIES ON BOVINE COCCIDIA [APICOMPLEXIA: EIMERIIDAE] IN PARTS OF PLATEAU STATE, NIGERIA](/thumbs/77/76476594.jpg "STUDIES ON BOVINE COCCIDIA [APICOMPLEXIA: EIMERIIDAE] IN PARTS OF PLATEAU STATE, NIGERIA") i STUDIES ON BOVINE COCCIDIA [APICOMPLEXIA: EIMERIIDAE] IN PARTS OF PLATEAU STATE, NIGERIA ABISOLA TITILAYO OLUWADARE PGNS/UJ/7090/91 B.SC. [HONS] APPLIED BIOLOGY M.SC. APPLIED ENTOMOLOGY AND PARASITOLOGY
i STUDIES ON BOVINE COCCIDIA [APICOMPLEXIA: EIMERIIDAE] IN PARTS OF PLATEAU STATE, NIGERIA ABISOLA TITILAYO OLUWADARE PGNS/UJ/7090/91 B.SC. [HONS] APPLIED BIOLOGY M.SC. APPLIED ENTOMOLOGY AND PARASITOLOGY
Apicomplexa of Intestinal Pathology
 LECTURES #4, #5 & #6: APICOMPLEXA 1 Apicomplexa of Intestinal Pathology Cryptosporidium, Eimeria, Cystoisospora General Characteristics of Apicomplexa A. Morphology by stage Zoite o Tear-shaped (cylindrical
Parasitology Amoebas. Sarcodina. Mastigophora
 Parasitology Amoebas Sarcodina Entamoeba hisolytica (histo = tissue, lytica = lyse or break) (pathogenic form) o Trophozoite is the feeding form o Life Cycle: personfeces cyst with 4 nuclei with thicker
Coccidiosis of Cattle
 Utah State University DigitalCommons@USU USU Faculty Honor Lectures Lectures 5-1-1964 Coccidiosis of Cattle Datus M. Hammod Utah State University Follow this and additional works at: https://digitalcommons.usu.edu/honor_lectures
PLASMODIUM MODULE 39.1 INTRODUCTION OBJECTIVES 39.2 MALARIAL PARASITE. Notes
 Plasmodium MODULE 39 PLASMODIUM 39.1 INTRODUCTION Malaria is characterized by intermittent fever associated with chills and rigors in the patient. There may be enlargement of the liver and spleen in the
Diagnosis and classification of Eimeria species in cattle in Mosul
 () ( ) (%,) E.zuernii (%,) E.subspherica : %, E.ellipsoidalis (%,) E.bukidnonensis (%,) E.canadensis (%) E.alabamensis (%,) E.bovis %, (%,) E.cylindrica (%,). %, %, %, Abstract Diagnosis and classification
Coccidia. Nimit Morakote, Ph.D.
 Coccidia Nimit Morakote, Ph.D. 1 Learning objectives After class, students will be able to: Describe morphology, life cycle, signs and symptoms, prevention and control, laboratory diagnosis and treatment
Copyright is owned by the Author of the thesis. Permission is given for a copy to be downloaded by an individual for the purpose of research and
 Copyright is owned by the Author of the thesis. Permission is given for a copy to be downloaded by an individual for the purpose of research and private study only. The thesis may not be reproduced elsewhere
Protozoan Parasites of Veterinary importance 2017
 Protozoan Parasites of Veterinary importance 2017 VPM-122 Laboratory 4 Spencer J. Greenwood PhD, DVM Dept. of Biomedical Sciences Room 2332N AVC North Annex sgreenwood@upei.ca Office phone # 566-6002 To
SUMMARY OF PRODUCT CHARACTERISTICS
 SUMMARY OF PRODUCT CHARACTERISTICS Revised: March 2015 1. NAME OF THE VETERINARY MEDICINAL PRODUCT Tolracol 50 mg/ml oral suspension for pigs, cattle and sheep 2. QUALITATIVE AND QUANTITATIVE COMPOSITION
cyst&' appeared to be of two kinds-one smaller and Smnith "is inclined to regard these epithelial cell parasites as
 COCCIDIA IN SUBEPITHELIAL INFECTIONS OF THE INTESTINES OF BIRDS PHILIP B. HADLEY From the Agricultural Experiment Station of the Rhode Island State College' Received for publication, July 10, 1916 In an
1) Most common, infectious, pathogenic animal (zoonotic) parasite of humans; estimated that 13% of humans are infected
 Most common, infectious, pathogenic animal (zoonotic) parasite of humans; estimated that 13% of humans are infected") XX Phylum Apicomplexa (Chapter 8) 2005 A. Characteristics 1. All are parasitic 2. APICAL COMPLEX a. Group of organelles used to invade host cells b. Visible only with electron microscopy Picture Slide
XX Phylum Apicomplexa (Chapter 8) 2005 A. Characteristics 1. All are parasitic 2. APICAL COMPLEX a. Group of organelles used to invade host cells b. Visible only with electron microscopy Picture Slide
Mastitis and colostrum management update. Dr Kiro Petrovski University of Adelaide, Roseworthy
 Mastitis and colostrum management update Dr Kiro Petrovski University of Adelaide, Roseworthy Biography Started working with dairy cows at age of 11 First independent calving First cow surgery at 16 Work
Protozoan Parasites: Lecture 20 Apicomplexans II Coccidia Part II & Cryptosporidium Pages 28-36
 Protozoan Parasites: Lecture 20 Apicomplexans II Coccidia Part II & Cryptosporidium Pages 28-36 Coccidia: Life cycle & treatment/control effectiveness? Asexual stages Sexual stages Prophylactic drugs Current
AARJMD VOLUME 1 ISSUE 19 (MARCH 2014) ISSN : A Peer Reviewed International Journal of Asian Academic Research Associates AARJMD
 ISSN : A Peer Reviewed International Journal of Asian Academic Research Associates AARJMD") A Peer Reviewed International Journal of Asian Academic Research Associates AARJMD ASIAN ACADEMIC RESEARCH JOURNAL OF MULTIDISCIPLINARY PERCENTAGE PREVALENCE OF EIMERIAN SPECIES IN AWASSI SHEEP IN NORTHERN
A Peer Reviewed International Journal of Asian Academic Research Associates AARJMD ASIAN ACADEMIC RESEARCH JOURNAL OF MULTIDISCIPLINARY PERCENTAGE PREVALENCE OF EIMERIAN SPECIES IN AWASSI SHEEP IN NORTHERN
University of Canberra. This thesis is available in print format from the University of Canberra Library.
 University of Canberra This thesis is available in print format from the University of Canberra Library. If you are the author of this thesis and wish to have the whole thesis loaded here, please contact
Giardia and Apicomplexa. G. A. Lozano UNBC
 Giardia and Apicomplexa G. A. Lozano UNBC NINE Protozoan diseases/parasites Ciliphora, Ichthyophthirius, Ick Sarcomastigophora, Giardia, giardiasis Apicomplexa: Eimeria, Toxoplasma, Sarcocystis, Cryptosporidium.
Copyright is owned by the Author of the thesis. Permission is given for a copy to be downloaded by an individual for the purpose of research and
 Copyright is owned by the Author of the thesis. Permission is given for a copy to be downloaded by an individual for the purpose of research and private study only. The thesis may not be reproduced elsewhere
Coccidiosis and cryptosporidiosis: control and management options
 Vet Times The website for the veterinary profession https://www.vettimes.co.uk Coccidiosis and cryptosporidiosis: control and management options Author : Sara Pedersen Categories : Farm animal, Vets Date
EFFECTS OF SEASON AND RESTRICTED FEEDING DURING REARING AND LAYING ON PRODUCTIVE AND REPRODUCTIVE PERFORMANCE OF KOEKOEK CHICKENS IN LESOTHO
 EFFECTS OF SEASON AND RESTRICTED FEEDING DURING REARING AND LAYING ON PRODUCTIVE AND REPRODUCTIVE PERFORMANCE OF KOEKOEK CHICKENS IN LESOTHO By SETSUMI MOTŠOENE MOLAPO MSc (Animal Science) NUL Thesis submitted
A STUDY OF FACTORS ASSOCIATED WITH THE PREVALENCE OF COCCIDIA INFECTION IN CATTLE AND ITS SPATIAL EPIDEMIOLOGY IN BUSIA,
 A STUDY OF FACTORS ASSOCIATED WITH THE PREVALENCE OF COCCIDIA INFECTION IN CATTLE AND ITS SPATIAL EPIDEMIOLOGY IN BUSIA, BUNGOMA AND SIAYA COUNTIES, KENYA. A thesis submitted in partial fulfillment of
COCCIDIOSIS INCIDENCE, CONTROL AND EPIDEMIOLOGY PUT IN FOCUS
 Vet Times The website for the veterinary profession https://www.vettimes.co.uk COCCIDIOSIS INCIDENCE, CONTROL AND EPIDEMIOLOGY PUT IN FOCUS Author : Hany M Elsheikha Categories : Vets Date : December 28,
LABORATORY. The Protozoa. At the Bench
 LABORATORY Laboratory 8, Page 1 8 The Protozoa Introduction: The protozoa are unicellular animals that are classified on the basis of the organelles used for locomotion (flagella, pseudopodia, cilia or
Understanding Epidemics Section 3: Malaria & Modelling
 Understanding Epidemics Section 3: Malaria & Modelling PART B: Biology Contents: Vector and parasite Biology of the malaria parasite Biology of the anopheles mosquito life cycle Vector and parasite Malaria
Copyright is owned by the Author of the thesis. Permission is given for a copy to be downloaded by an individual for the purpose of research and
 Copyright is owned by the Author of the thesis. Permission is given for a copy to be downloaded by an individual for the purpose of research and private study only. The thesis may not be reproduced elsewhere
SUMMARY OF PRODUCT CHARACTERISTICS
 SUMMARY OF PRODUCT CHARACTERISTICS 1. NAME OF THE VETERINARY MEDICINAL PRODUCT AMPROLINE 400 mg/ml solution for use in drinking water for chickens and turkeys 2. QUALITATIVE AND QUANTITATIVE COMPOSITION
Efficacies of fenbendazole and albendazole in the treatment of commercial turkeys artificially infected with Ascaridia dissimilis
 Efficacies of fenbendazole and albendazole in the treatment of commercial turkeys artificially infected with Ascaridia dissimilis Jessica Perkins, Thomas Yazwinski, Chris Tucker Abstract The goal of this
Systemic Apicomplexans. Toxoplasma
 Systemic Apicomplexans Toxoplasma Protozoan Groups Historically, protozoa have been grouped by mode of motility. Flagellates Hemoflagellates Trypanosoma cruzi Leishmania infantum Mucoflagellates Tritrichomonas
Biology of toxoplasmosis
 1 Biology of toxoplasmosis E. Petersen 1 and J. P. Dubey 2 1 Statens Seruminstitut, Copenhagen, Denmark 2 U.S. Department of Agriculture, Beltsville, USA History Toxoplasma gondii is a coccidium, with
Copyright is owned by the Author of the thesis. Permission is given for a copy to be downloaded by an individual for the purpose of research and
 Copyright is owned by the Author of the thesis. Permission is given for a copy to be downloaded by an individual for the purpose of research and private study only. The thesis may not be reproduced elsewhere
Bovine coccidiosis the facts
 STAKEHOLDERS GOVERNMENT & STATE AGENCIES Bord Bia Department of Agriculture, Food and the Marine (DAFM) Teagasc DAIRY AND BEEF PROCESSORS Arrabawn Co-op Aurivo Carbery Group Dairygold Glanbia Kerry Agribusiness
COCCIDIOSIS FROM DAY
 C O N T R O L COCCIDIOSIS FROM DAY COCCIDIOSIS CAN CAUSE SERIOUS ECONOMIC PROBLEMS Coccidiosis is caused by microscopic parasites (protozoa) which are common on-farm The coccidia destroy the intestinal
Large Animal Topics in Parasitology for the Veterinary Technician Jason Roberts, DVM This presentation is designed to review the value veterinary
 Large Animal Topics in Parasitology for the Veterinary Technician Jason Roberts, DVM This presentation is designed to review the value veterinary technicians can add to mixed or large animal practices
Salmonella Dublin: Clinical Challenges and Control
 Salmonella Dublin: Clinical Challenges and Control Simon Peek BVSc, MRCVS PhD, DACVIM, University of Wisconsin-Madison School of Veterinary Medicine Advancing animal and human health with science and compassion
Copyright is owned by the Author of the thesis. Permission is given for a copy to be downloaded by an individual for the purpose of research and
 Copyright is owned by the Author of the thesis. Permission is given for a copy to be downloaded by an individual for the purpose of research and private study only. The thesis may not be reproduced elsewhere
Malaria. This sheet is from both sections recording and includes all slides and diagrams.
 Malaria This sheet is from both sections recording and includes all slides and diagrams. Malaria is caused by protozoa family called plasmodium (Genus) mainly affect blood system specially RBCs and each
Ultrastructure of Endogenous Stages of Eimeria ninakohlyakimovae Yakimoff & Rastegaieff, 1930 Emend. Levine, 1961 in Experimentally Infected Goat
 Mem Inst Oswaldo Cruz, Rio de Janeiro, Vol. 92(4): 533-538, Jul./Aug. 1997 Ultrastructure of Endogenous Stages of Eimeria ninakohlyakimovae Yakimoff & Rastegaieff, 1930 Emend. Levine, 1961 in Experimentally
This information is intended to give guidance for vets and CP staff and volunteers in the treatment of a CP cat with diarrhoea.
 Diarrhoea Procedures This information is intended to give guidance for vets and CP staff and volunteers in the treatment of a CP cat with diarrhoea. In the shelter environment acute (sudden onset) diarrhoea
Above: life cycle of toxoplasma gondii. Below: transmission of this infection.
 Toxoplasmosis PDF This article is based on a paid for research paper dated 1972 of similar title and authored by J.K.Frenkel and J.P. Dubey. It was published by The Journal of Infectious Diseases Vol.
Eukaryotic Organisms
 Eukaryotic Organisms A Pictoral Guide of Supportive Illustrations to accompany Select Topics on Eukaryotic Oranisms Bacteria (Not Shown) Agent of Disease Reservoir Vector By Noel Ways Favorable Environmental
and other serological tests in experimentally infected cattle
 J. Hyg., Camb. (1982), 88, 21 21 Printed in Great Britain A comparison of the results of the brucellosis radioimmunoassay and other serological tests in experimentally infected cattle BY J. HAYES AND R.
Health plans and fluke and worm control
 Health plans and fluke and worm control Tim Geraghty SAC Consulting is a division of Scotland s Rural College Leading the way in Agriculture and Rural Research, Education and Consulting Farm Profit Sheep
Suckler cow management. Dai Grove-White.
 Suckler cow management. Dai Grove-White. Where is suckler beef going? Biological efficiency Suckler VS dairy beef Carbon foot-printing & land use Poorer quality land Mass-market or niche market Output
CENTRAL VETERINARY LABORATORY, MAFF
 CENTRAL VETERINARY LABORATORY, MAFF Trial to evaluate the efficacy of Stalosan F disinfectant against coccidial oocysts o CENTRAL VETERINARY LABORATORY, MAFF REPORT TO CONTRACT, MANAGER PERIOD OF INVESTIGATION
Journal of Bacteriology and Parasitology
 ISSN: 2155-9597 PJournal of Bacteriology & arasitology Journal of Bacteriology and Parasitology Sultana et al., J Bacteriol Parasitol 2017, 8:4 DOI: 10.4172/2155-9597.1000314 Research Article Prevalence
Copyright is owned by the Author of the thesis. Permission is given for a copy to be downloaded by an individual for the purpose of research and
 Copyright is owned by the Author of the thesis. Permission is given for a copy to be downloaded by an individual for the purpose of research and private study only. The thesis may not be reproduced elsewhere
Some aspects of wildlife and wildlife parasitology in New Zealand
 Some aspects of wildlife and wildlife parasitology in New Zealand Part 3/3 Part three: Kiwis and aspects of their parasitology Kiwis are unique and unusual in many ways. For a comprehensive and detailed
Epidemiology of Eimeria Infections in Calves in Addis Ababa and Debre Zeit Dairy Farms, Ethiopia
 Epidemiology of Eimeria Infections in Calves in Addis Ababa and Debre Zeit Dairy Farms, Ethiopia Rahmeto Abebe, DVM, MSc 1 Abebe Wossene, DVM, MSc 2 Bersissa Kumsa, DVM, MSc 3 1 Department of Biomedical
NMR HERDWISE JOHNE S SCREENING PROGRAMME
 NMR HERDWISE JOHNE S SCREENING PROGRAMME INFORMATION PACK www.nmr.co.uk NML HerdWise Johne s Screening Programme Contents 1. Introduction 2. What is Johne s Disease? 3. How is Johne s Disease transmitted?
A:Malaria (Plasmodium species) Plasmodium falciparum causes malignant tertian malaria P. malariae: causes Quartan malaria P. vivax: causes benign
 Plasmodium falciparum causes malignant tertian malaria P. malariae: causes Quartan malaria P. vivax: causes benign") A:Malaria (Plasmodium species) Plasmodium falciparum causes malignant tertian malaria P. malariae: causes Quartan malaria P. vivax: causes benign tertian malaria P. ovale: causes benign tertian malaria
A:Malaria (Plasmodium species) Plasmodium falciparum causes malignant tertian malaria P. malariae: causes Quartan malaria P. vivax: causes benign tertian malaria P. ovale: causes benign tertian malaria
Factors Affecting Breast Meat Yield in Turkeys
 Management Article The premier supplier of turkey breeding stock worldwide CP01 Version 2 Factors Affecting Breast Meat Yield in Turkeys Aviagen Turkeys Ltd Introduction Breast meat, in the majority of
Biocontainment. Within populations. The Sandhills Calving System. Actions to prevent the spread of infectious agents.
 Principles of The Sandhills Calving System and how they apply to other production systems Sandhills Calving System reduces scours Successful Farming John Walter and Betsy Freese Jan, 6 David R. Smith,
EVALUATION OF DIFFERENT CHICKEN LAYER BREEDS FOR USE IN INTEGRATED AQUACULTURE-POULTRY PRODUCTION SYSTEMS IN GAUTENG, SOUTH AFRICA
 EVALUATION OF DIFFERENT CHICKEN LAYER BREEDS FOR USE IN INTEGRATED AQUACULTURE-POULTRY PRODUCTION SYSTEMS IN GAUTENG, SOUTH AFRICA By IKGADIMENG BETTY MOTIANG Submitted in partial fulfilment of the requirements
Relationship between Coccidiosis Infection and Hematological Profile, Body Weight and Famacha Scores in Dorper Sheep
 Relationship between Coccidiosis Infection and Hematological Profile, Body Weight and Famacha Scores in Dorper Sheep Nurzaty Ewani, A.H., Ariff 1 *, O.M., Sani 2, R.A. and Rasedee 3, A. 1 Department of
Management traits. Teagasc, Moorepark, Ireland 2 ICBF
 Management traits Donagh Berry 1, Jessica Coyne 1, Sinead McParland 1, Brian Enright 2, Brian Coughlan 2, Martin Burke 2, Andrew Cromie 2 1 Teagasc, Moorepark, Ireland 2 ICBF donagh.berry@teagasc.ie ICBF
EBA Series FOOTHILL ABORTION UPDATE: PART I: THE TICK
 EBA Series FOOTHILL ABORTION UPDATE: PART I: THE TICK Foothill abortion in cattle, also known as Epizootic Bovine Abortion (EBA), is a condition well known to beef producers who have experienced losses
Reedy Fork Dairy Farm Parasitology Report Fall 2016
 Reedy Fork Dairy Farm Parasitology Report Fall 2016 By Catherine Si and Nick De Castro History: Reedy Fork Dairy Farm, certified organic since 2007, has a herd of 200 cattle, which are mostly Jersey/ Holstein
TREATMENT OF ANOESTRUS IN DAIRY CATTLE R. W. HEWETSON*
 TREATMENT OF ANOESTRUS IN DAIRY CATTLE R. W. HEWETSON* Summary Six priming doses of 40 mg progesterone at two day intervals followed by 1,000 I.U. P.M.S. were superior to two priming doses plus P.M.S.
Johne s Disease Control
 Johne s Disease Control D. Owen Rae DVM, MPVM College of Veterinary Medicine UF/IFAS Gainesville, FL Introduction Johne s disease is caused by the bacteria Mycobacterium avium paratuberculosis (MAP). The
BIO Parasitology Spring 2009
 BIO 475 - Parasitology Spring 2009 Stephen M. Shuster Northern Arizona University http://www4.nau.edu/isopod Lecture 10 Malaria-Life Cycle a. Micro and macrogametocytes in mosquito stomach. b. Ookinete
RELATIONSHIPS AMONG WEIGHTS AND CALVING PERFORMANCE OF HEIFERS IN A HERD OF UNSELECTED CATTLE
 RELATIONSHIPS AMONG WEIGHTS AND CALVING PERFORMANCE OF HEIFERS IN A HERD OF UNSELECTED CATTLE T. C. NELSEN, R. E. SHORT, J. J. URICK and W. L. REYNOLDS1, USA SUMMARY Two important traits of a productive
Copyright is owned by the Author of the thesis. Permission is given for a copy to be downloaded by an individual for the purpose of research and
 Copyright is owned by the Author of the thesis. Permission is given for a copy to be downloaded by an individual for the purpose of research and private study only. The thesis may not be reproduced elsewhere
Mastitis: Background, Management and Control
 New York State Cattle Health Assurance Program Mastitis Module Mastitis: Background, Management and Control Introduction Mastitis remains one of the most costly diseases of dairy cattle in the US despite
Project title: Evaluation of the prevalence of coccidia in Ontario suckling. piglets and identification of a preventive treatment
 Project title: Evaluation of the prevalence of coccidia in Ontario suckling piglets and identification of a preventive treatment Final report: July 6, 2007 Principal Investigator: Andrew Peregrine, Department
Level 1 Agricultural and Horticultural Science, 2011
 90921 909210 1SUPERVISOR S Level 1 Agricultural and Horticultural Science, 2011 90921 Demonstrate knowledge of livestock management practices 9.30 am Thursday 17 November 2011 Credits: Five Achievement
9 Parasitology 9 EXERCISE EQA. Objectives EXERCISE
 0696T_c09_81-90.qxd 07/01/2004 23:19 Page 81 EXERCISE 9 Parasitology Exercise Pre-Test Attempt to answer the following questions before starting this exercise. They will serve as a guide to important concepts.
Copyright is owned by the Author of the thesis. Permission is given for a copy to be downloaded by an individual for the purpose of research and
 Copyright is owned by the Author of the thesis. Permission is given for a copy to be downloaded by an individual for the purpose of research and private study only. The thesis may not be reproduced elsewhere
Fact sheet. All animals, particularly herbivores, appear to be natural hosts for coccidian species with a high degree of host specificity observed.
 Coccidia in k angaroos Fact sheet Introductory statement Coccidians are protozoan parasites which infect the intestinal tract of many animals. Within kangaroos, coccidia infections can lead to clinical
Observations on Eimeria species of Dasyprocta leporina (Linnaeus, 1758) (Rodentia: Dasyproctidae) from the state of Pará, North Brazil
 (Rodentia: Dasyproctidae) from the state of Pará, North Brazil") Mem Inst Oswaldo Cruz, Rio de Janeiro, Vol. 99: 000-000, 2004 1 Observations on Eimeria species of Dasyprocta leporina (Linnaeus, 1758) (Rodentia: Dasyproctidae) from the state of Pará, North Brazil Ralph
Mem Inst Oswaldo Cruz, Rio de Janeiro, Vol. 99: 000-000, 2004 1 Observations on Eimeria species of Dasyprocta leporina (Linnaeus, 1758) (Rodentia: Dasyproctidae) from the state of Pará, North Brazil Ralph
EFFECT OF PADDOCK SIZE, STOCKING RATE, ANTHELMINTICS, AND TRACE ELEMENTS ON THE WEIGHT GAIN OF YOUNG CATTLE
 EFFECT OF PADDOCK SIZE, STOCKING RATE, ANTHELMINTICS, AND TRACE ELEMENTS ON THE WEIGHT GAIN OF YOUNG CATTLE W. H. SOUTHCOTT*, M. K. HILL, B. R. WATKIN, and J. L. WHEELER* Summary A total-of 444 heifers,
Detection of Gastrointestinal Helminthic and Protozoan Infections in Diarrhoeic Goats
 International Journal of Current Microbiology and Applied Sciences ISSN: 2319-7706 Volume 6 Number 4 (2017) pp. 801-805 Journal homepage: http://www.ijcmas.com Original Research Article https://doi.org/10.20546/ijcmas.2017.604.100
HUSK, LUNGWORMS AND CATTLE
 Vet Times The website for the veterinary profession https://www.vettimes.co.uk HUSK, LUNGWORMS AND CATTLE Author : Alastair Hayton Categories : Vets Date : July 20, 2009 Alastair Hayton discusses how best
Dominance/Suppression Competitive Relationships in Loblolly Pine (Pinus taeda L.) Plantations
 Plantations") Dominance/Suppression Competitive Relationships in Loblolly Pine (Pinus taeda L.) Plantations by Michael E. Dyer Dissertation submitted to the Faculty of the Virginia Polytechnic Institute and Stand University
Dominance/Suppression Competitive Relationships in Loblolly Pine (Pinus taeda L.) Plantations by Michael E. Dyer Dissertation submitted to the Faculty of the Virginia Polytechnic Institute and Stand University
Diurnal variation in microfilaremia in cats experimentally infected with larvae of
 Hayasaki et al., Page 1 Short Communication Diurnal variation in microfilaremia in cats experimentally infected with larvae of Dirofilaria immitis M. Hayasaki a,*, J. Okajima b, K.H. Song a, K. Shiramizu
Common writing errors:
 Legal writing Common writing errors: A comedy of errors certain barristers and most judges do not like the use of commas if they are not fulfilling the function of replacing a conjunction in order to avoid
EVALUATION OF THE EFFICACY OF CYCOSTAT 66G AGAINST COCCIDIOSIS IN FATTENING RABBITS UNDER CONTROLLED FIELD CONDITIONS.
 EVALUATION OF THE EFFICACY OF CYCOSTAT 66G AGAINST COCCIDIOSIS IN FATTENING RABBITS UNDER CONTROLLED FIELD CONDITIONS. PIERRE COUDERT INRA, BASE, 37380 Nouzilly coudert@tours.inra.fr ABSTRACT This study
Copyright is owned by the Author of the thesis. Permission is given for a copy to be downloaded by an individual for the purpose of research and
 Copyright is owned by the Author of the thesis. Permission is given for a copy to be downloaded by an individual for the purpose of research and private study only. The thesis may not be reproduced elsewhere
The comparative analysis of infection pattern and oocyst output in
 Veterinary World, EISSN: 2231-916 Available at www.veterinaryworld.org/vol.7/july-21/18.pdf RESEARCH ARTICLE Open Access The comparative analysis of infection pattern and oocyst output in Eimeria tenella,
ANTICOCCIDIALS USED FOR THE THERAPY OF COCCIDIOSIS IN CHICKENS, TURKEYS AND GEESE
 ANTICOCCIDIALS USED FOR THE THERAPY OF COCCIDIOSIS IN CHICKENS, TURKEYS AND GEESE Guideline Title Anticoccidials used for the Therapy of Coccidiosis i n Chickens, Turkey and Geese Legislative Basis Directive
Blood protozoan: Plasmodium
 Blood protozoan: Plasmodium Dr. Hala Al Daghistani The causative agent of including Plasmodium vivax P. falciparum P. malariae P. ovale. malaria in humans: four species are associated The Plasmodium spp.
Cryptosporidium spp. Oocysts
 Sampling and Source Tracking of Cryptosporidium spp. Oocysts June 28, 2005 Kristen L. Jellison, Ph.D. Department of Civil & Environmental Engineering Lehigh University Bethlehem, Pennsylvania Ultimate
Effects of Late-Summer Protein Supplementation and Deworming on Performance of Beef Calves Grazing Native Range
 Effects of Late-Summer Protein Supplementation and Deworming on Performance of Beef Calves Grazing Native Range D.L. Lalman, J.G. Kirkpatrick, D.E. Williams, and J.D. Steele Story in Brief The objective
Farm Newsletter - May 2017
 Farm Newsletter - May 2017 ***MEETING DATE*** 7th June 2017, The Bell Inn, Chittlehampton - 7:30PM Reducing Antibiotic Usage on Farm As mentioned in last months newsletter we will be hosting a meeting
Ahead of print online version
 Folia Parasitologica 60 [3]: 232 236, 2013 ISSN 0015-5683 (print), ISSN 1803-6465 (online) Institute of Parasitology, Biology Centre ASCR http://folia.paru.cas.cz/ A new species of Choleoeimeria (Apicomplexa:
SUMMARY OF THESIS. Chapter VIII "The place of research, its purpose, the biological material and method"
 SUMMARY OF THESIS Raising Japanese quail is a global activity still limited compared with growth of hens and broilers, but with great prospects for the development of characteristics and adaptability of
A. Effect upon human culture 1. Control of malaria has contributed to world=s population explosion 2. Africans brought to U.S.
 VI. Malaria A. Effect upon human culture 1. Control of malaria has contributed to world=s population explosion 2. Africans brought to U.S. because they were resistant to malaria & other diseases 3. Many
Anticoccideal Drugs. By Prof. Dr. Nehal Aly Afifi. Pharmacology Dept. Faculty of Vet. Med. Cairo Univ.
 Anticoccideal Drugs By Prof. Dr. Nehal Aly Afifi Pharmacology Dept. Faculty of Vet. Med. Cairo Univ. Anticoccidial Drugs 2 Parasitic disease caused by TS. protozoa (Eimeria spp.) cause complete destruction
IN-VIVO EVALUATION OF ANTI-COCCIDIAL EFFICACY OF SALINOMYCIN AND AMPROLIUM IN COMMERCIAL CHICKEN
 IN-VIVO EVALUATION OF ANTI-COCCIDIAL EFFICACY OF SALINOMYCIN AND AMPROLIUM IN COMMERCIAL CHICKEN R. Selvarani*, M. Raman and S. Gomathinayagam Department of Veterinary Parasitology Madras Veterinary College,
FREEDOM OF INFORMATION SUMMARY
 Date of Approval Letter: FREEDOM OF INFORMATION SUMMARY NEW ANIMAL DRUG APPLICATION NADA 141-148 Combination of DECCOX AND RUMENSIN in Cattle Feed (decoquinate and monensin) For the prevention of coccidiosis
Innovative BRD risk assessment in intensive beef cattle system
 Palais du Pharo, Marseille - 27-29 November, 2013 Innovative BRD risk assessment in intensive beef cattle system Dr. Riccardo Compiani, DVM, PhD student Department of Health, Animal Science and Food Safety