Phylogenetic Relationships and Evolution of Snakes
|
|
|
- Sophia Flynn
- 5 years ago
- Views:
Transcription

1 University of New Orleans University of New Orleans Theses and Dissertations Dissertations and Theses Summer Phylogenetic Relationships and Evolution of Snakes Alex Figueroa University of New Orleans, New Orleans, Follow this and additional works at: Part of the Biodiversity Commons, Evolution Commons, and the Integrative Biology Commons Recommended Citation Figueroa, Alex, "Phylogenetic Relationships and Evolution of Snakes" (2016). University of New Orleans Theses and Dissertations This Dissertation-Restricted is brought to you for free and open access by the Dissertations and Theses at It has been accepted for inclusion in University of New Orleans Theses and Dissertations by an authorized administrator of The author is solely responsible for ensuring compliance with copyright. For more information, please contact
2 Phylogenetic Relationships and Evolution of Snakes A Dissertation Submitted to the Graduate Faculty of the University of New Orleans in partial fulfillment of the requirements for the degree of Doctor of Philosophy in Conservation Biology by Alex Figueroa B.S. Rutgers University, 2001 M.S. Loma Linda University, 2006 August, 2016
3 Dedicated to my family and friends ii
4 Table of Contents List of Figures...Page v List of Tables... Page vi Abstract... Page vii Chapter 1: A Species-level Phylogeny of Extant Snakes with Description of a New Colubrid Subfamily and Genus...Page 1 Abstract...Page 1 Introduction...Page 3 Methods...Page 8 Results and Discussion... Page 13 Conclusions... Page 41 Acknowledgements... Page 43 References... Page 44 Supporting Information... Page 59 Chapter 2: Patterns of Lineage Diversification in Snakes: Testing Venom-Delivery as a Key Innovation... Page 61 Abstract... Page 61 Introduction... Page 63 Methods... Page 66 Results... Page 72 Discussion... Page 80 Acknowledgements... Page 88 References... Page 89 Supporting Information... Page 101 Chapter 3: The Evolution of Habitat Use in Snakes: A Specialized Body Shape Suitable for Diverse Habitat Associations... Page 102 Abstract... Page 102 Introduction... Page 104 Methods... Page 107 Results... Page 113 Discussion... Page 126 Conclusions... Page 133 Acknowledgements... Page 134 References... Page 136 Supporting Information... Page 142 Chapter 4: Striking from a Limb: Context, Morphology, and Strike Performance in a Prehensiletailed Arboreal Snake, Corallus hortulanus... Page 143 Abstract... Page 143 Introduction... Page 145 Methods... Page 148 Results... Page 153 Discussion... Page 155 Conclusions... Page 162 Acknowledgements... Page 163 References... Page 164 iii
5 Vita... Page 171 iv
6 List of Figures Figure Page 14 Figure Page 23 Figure Page 74 Figure Page 76 Figure Page 78 Figure Page 79 Figure Page 83 Figure Page 84 Figure Page 85 Figure Page 119 Figure Page 120 Figure Page 121 Figure Page 123 Figure Page 127 Figure Page 150 Figure Page 156 v
7 List of Tables Table Page 6 Table Page 69 Table Page 108 Table Page 115 Table Page 116 Table Page 123 Table Page 124 Table Page 125 Table Page 154 Table Page 157 Table Page 161 vi
8 Abstract Snakes represent an impressive evolutionary radiation of over 3,500 widely-distributed species, categorized into 515 genera, encompassing a diverse range of morphologies and ecologies. This diversity is likely attributable to their distinctive morphology, which has allowed them to populate a wide range of habitat types within most major ecosystems. In my first chapter, I provide the largest-yet estimate of the snake tree of life using maximum likelihood on a supermatrix of 1745 taxa (1652 snake species + 7 outgroup taxa) and 9,523 base pairs from 10 loci (5 nuclear, 5 mitochondrial), including previously unsequenced genera (2) and species (61). I then use this phylogeny to test hypotheses regarding heterogeneity in diversification rates and how this shaped overall patterns of snake diversity in Chapter 2. I also used the species-level phylogeny to test the evolution of habitat use in snakes, morphological variation, and whether distantly-related species exhibit morphological convergence in Chapter 3. Finally, in Chapter 4 I investigate how prehensile tails effect striking performance in arboreal snakes. Convergence; Diversification; Ecomorphology; Evolution; Habitat use; Performance; Phylogeny; Snakes; Species-level; Striking vii
9 Chapter 1. A Species-level Phylogeny of Extant Snakes with Description of a New Colubrid Subfamily and Genus Abstract With over 3,500 species encompassing a diverse range of morphologies and ecologies, snakes make up 36% of squamate diversity. Despite several attempts at estimating higher-level snake relationships and numerous assessments of generic- or species-level phylogenies, a largescale species-level phylogeny solely focusing on snakes has not been completed. Here, we provide the largest-yet estimate of the snake tree of life using maximum likelihood on a supermatrix of 1745 taxa (1652 snake species + 7 outgroup taxa) and 9,523 base pairs from 10 loci (5 nuclear, 5 mitochondrial), including previously unsequenced genera (2) and species (61). Increased taxon sampling resulted in a phylogeny with a new higher-level topology and corroborate many lower-level relationships, strengthened by high nodal support values (> 85%) down to the species level (73.69% of nodes). Although the majority of families and subfamilies were strongly supported as monophyletic with > 88% support values, some families and numerous genera were paraphyletic, primarily due to limited taxon and loci sampling leading to a sparse supermatrix and minimal sequence overlap between some closely-related taxa. With all rogue taxa and incertae sedis species eliminated, higher-level relationships and support values remained relatively unchanged, except in five problematic clades. Our analyses resulted in new topologies at higher- and lower-levels; resolved several previous topological issues; established 1
10 novel paraphyletic affiliations; designated a new subfamily, Ahaetuliinae, for the genera Ahaetulla, Chrysopelea, Dendrelaphis, and Dryophiops; and appointed Hemerophis (Coluber) zebrinus to a new genus, Mopanveldophis. Although we provide insight into some distinguished problematic nodes, at the deeper phylogenetic scale, resolution of these nodes may require sampling of more slowly-evolving nuclear genes. 2
11 Introduction Phylogenies form the cornerstone of our understanding of evolutionary relationships between organisms and provide a historical basis for testing and inferring ecological and evolutionary processes (Harvey and Pagel, 1991; Huelsenbeck and Rannala, 1997; Pagel, 1999; Whelan et al., 2001). Although phylogenetic methodologies have witnessed an explosion of advancements, estimating large trees remains costly, time-intensive, and computationally difficult. Thus, most analyses have concentrated on resolving the relationships of smaller taxonomic groups, culminating in the accumulation of published sequences available for compiling into larger datasets, or "super-matrices"(driskell et al., 2004; McMahon and Sanderson, 2006). Coalescent-based species-trees methods are currently favored over concatenated approaches owing to their greater accuracy, but their use for large datasets is still impractical (Edwards, 2009; Lambert et al., 2015). Consequently, many researchers rely on the supermatrix approach (de Queiroz and Gatesy, 2007) or on shortcut coalescence methods (Gatesy and Springer, 2014). The supermatrix uses concatenated sequences to estimate largescale phylogenies with branch lengths (Burleigh et al., 2015; McCormack et al., 2013; Pyron and Wiens, 2011; Piwczyński et al., 2014; Pyron et al., 2013a; Rabosky et al., 2013; Soltis et al., 2013). This technique has earned criticism because large amounts of missing data may obscure phylogenetic signal, leading to uncertainty in topology and branch lengths (Lemmon, 2009; Lemmon and Lemmon, 2013; Sanderson et al., 2010; Thomson and Shaffer, 2009), but shortcut coalescence methods are also prone to these same shortcomings (Gatesy and Springer, 2014). However, several studies have shown that concatenated procedures may nonetheless produce similar results to species-trees (Pyron et al., 2014b; Lambert et al., 2015), particularly when there 3
12 is no agreement among gene trees, and between gene and species trees (Edwards, 2009). This is also the case for deep divergences because shortcut coalescence has difficulty integrating genetree incongruity at this level (Gatesy and Springer, 2014). Our goal for this study was to estimate a species-level phylogeny for snakes using the supermatrix technique. To date, only two studies have estimated a species-level phylogeny of snakes (Pyron et al., 2013a; Zheng and Wiens, 2016), with the latter adding more independent loci to the dataset of the former. These studies featured 1262 known snake species, integrated as part of a larger phylogeny focusing on Squamata, accounting for merely 39% of the total snake diversity at the time. At greater than 3,500 species (Uetz and Hošek, 2015), over a thousand more than the estimate provided by Heise et al. (1995) two decades earlier, and with the recent recognition of new families and subfamilies (Adalsteinsson et al., 2009; Chen et al., 2013; Kelly et al., 2009; Pyron and Wallach, 2014; Pyron et al., 2014a; Vidal et al., 2010a), phylogenetic estimates of the snake tree of life are markedly underrepresented. Indeed, the first phylogenetic analysis including all families and subfamilies was only recently completed (Pyron and Burbrink, 2012), and only included one representative from each rank. Over the years, researchers have emphasized resolving higher-level snake relationships (Cadle, 1988; Chen et al., 2013; Dowling et al., 1996; Gower et al., 2005; Heise et al., 1995; Hsiang et al., 2015; Kelly et al., 2003; Lawson et al., 2004; Lawson et al., 2005; Pyron et al., 2011; Pyron and Burbrink, 2012; Pyron et al., 2013a; Pyron et al., 2013b; Pyron et al., 2014b; Reeder et al., 2015; Slowinski and Lawson, 2002; Vidal and Hedges, 2002a; Vidal et al., 2007; Vidal et al., 2009; Wiens et al., 2008; Wiens et al., 2012; Zaher et al., 2009; Zheng and Wiens, 2016), and topology within families: typhlopids (Adalsteinsson et al., 2009; Hedges et al., 2014; Pyron and Wallach, 2014; Vidal et al., 2010b); boids (Noonan and Chippindale, 2006; Pyron et al., 2014a; Rawlings et al., 2008; 4
13 Reynolds et al., 2014); acrochordids (Sanders et al., 2011); xenodermatids (Teynie et al., 2015); homalopsids (Alfaro et al., 2008; Murphy et al., 2011); pareatids (You et al., 2015); viperids (Castoe and Parkinson, 2006; Lenk et al., 2001b; Malhotra et al., 2010); elapids and lamprophiids (Kelly et al., 2008; Kelly et al., 2009; Sanders et al, 2013; Vidal et al., 2008); dipsads (Grazziotin et al., 2012; Vidal et al., 2010a); pseudoxendontids (Zhang and Huang, 2013); natricines (McVay et al., 2015); sibynophiids (Chen et al., 2013); and colubrids (Lawson et al., 2005; Pyron et al., 2011). Despite these efforts, many unresolved nodes remain scattered throughout the entire snake tree, such as the monophyly of Scolecophidia (Pyron et al., 2013a), topology of Typhlopinae (Pyron and Wallach, 2014), monophyly of Cylindrophiidae and Anomochilidae (Gower et al., 2005), topology of Booidea (Pyron et al., 2014a; Reynolds et al., 2014), placement of Xenophidiidae and Bolyeridae (Reynolds et al., 2014), and several issues within Caenophidia (Lawson et al., 2005; Pyron et al., 2011; Pyron et al., 2014b). With higherlevel relationships of snakes still not settled, our understanding of the snake tree of life remains incomplete. Although snakes have received a great deal of attention from biologists (Mullin and Seigel, 2009; Seigel and Collins, 1993; Seigel et al., 1987), studies of snake biology from comparative and evolutionary perspectives are scarce relative to other reptile taxa such as lizards, in part because of the lack of comprehensive and well-supported snake phylogenies. Estimating a clade-wide species-level phylogeny for snakes with utility for testing evolutionary hypotheses will greatly augment our knowledge of snake biology. Here, we present an updated hypothesis on extant snake phylogeny with increased sampling using the supermatrix approach comprising 1745 taxa (1652 snake species + 7 outgroup taxa), representing 46.33% of the currently known snake species from all known families and subfamilies (Table 1.1), an increase of 7.24% from 5
14 Pyron et al. (2013a) and Zheng and Wiens (2016. Accepting this tree, we discuss higher-level relationships and highlight taxonomic issues at the genus-level. Table 1.1. Number of taxa sampled per family or subfamily. Families are listed in order according to Figure 1.1. For the taxonomy of families and subfamilies, we use Adalsteinsson et al. (2009) for Anomalepididae and Leptotyphlopidae, Pyron and Wallach (2014) for Gerrhopilidae, Typhlopidae, and Xenotyphlopidae, Pyron et al. (2014a) for Booidea, and Pyron et al. (2013a) for Alethinophidia. The number of species per clade was taken from The Reptile Database ( on 10/01/2015. Percentages of the number of species sampled do not include taxa not assigned to species status. Paraphyletic taxa are included under their traditional family and/or subfamily. In the Total cell for total number of species, the number not in parentheses equals the sum of the values in the table and the number in the parentheses equals the number returned when a search for Serpentes is conducted in The Reptile Database. Percentage for total number of species sampled is based on 3566 species. Clade Number of Species Sampled (% Sampled) 6 Total Number of Species Scolecophidia Anomalepididae 2 (11%) 18 Leptotyphlopidae Epictinae 17 (23%) 2 sp. 64 Leptotyphlopinae 18 (36%) 50 Gerrhopilidae 2 (11%) 18 Xenotyphlopidae 2 (100%) 1 sp. 1 Typhlopidae Typhlopinae 52 (52%) 19 sp. 64 Afrotyphlopinae 19 (26%) 3 sp. 61 Madatyphlopinae 2 (15%) 13 Asiatyphlopinae* 49 (33%) 8 sp. 124 Alethinophidia Aniliidae 1 (100%) 1 Tropidophiidae 10 (29%) 34 Calabariidae 1 (100%) 1 Candoiidae 3 (60%) 5 Sanziniidae 3 (75%) 4 Charinidae Charininae 3 (75%) 4 Ungaliophiinae 3 (100%) 3 Erycidae 9 (75%) 12 Boidae 24 (80%) 30 Cylindrophiidae 2 (15%) 13 Anomochilidae 1 (33%) 3
15 Table 1.1 Continued. Uropeltidae 15 (28%) 1 sp. 54 Xenopeltidae 1 (50%) 2 Loxocemidae 1 (100%) 1 Pythonidae 32 (80%) 40 Bolyeridae 1 (50%) 2 Xenophidiidae 1 (50%) 2 Acrochordidae 3 (100%) 3 Xenodermatidae 4 (22%) 18 Pareatidae 16 (80%) 20 Viperidae Viperinae 66 (67%) 98 Azemiopinae 1 (50%) 2 Crotalinae 190 (82%) 1 sp. 231 Homalopsidae 26 (47%) 1 sp. 53 Lamprophiidae Psammophiinae 45 (87%) 3 sp. 52 Prosymninae 5 (31%) 16 Pseudaspidinae 2 (100%) 2 Atractaspidinae 7 (30%) 23 Aparallactinae 11 (23%) 47 Lamprophiinae 31 (43%) 72 Pseudoxyrhophiinae 61 (64%) 4 sp. 89 Elapidae 195 (54%) 1 sp. 358 Colubridae Sibynophiinae 6 (55%) 11 Natricinae 110 (47%) 3 sp. 226 Pseudoxenodontinae 5 (36%) 1 sp. 11 Dipsadinae 242 (32%) 2 sp. 754 Grayiinae 3 (75%) 4 Calamariinae 4 (5%) 87 Ahaetullinae subfam. nov. 27 (48%) 56 Colubrinae 315 (47%) 3 sp. 670 Incertae Sedis 4 22 TOTAL 1652 (46.33%) 3549 (3566) *Number of species of Xerotyphlops is included in Asiatyphlopinae. Buhoma depressiceps, Buhoma procterae, and Oxyrhabdium leporinum are all listed as incertae sedis on The Reptile Database, but Micrelaps bicoloratus is not. We list these four species as incertae sedis because of their variable topological history (see Fig. 1.1). 7
16 Materials and Methods Tissue data collection and sequence acquisition We constructed a dataset of 1745 taxa (1659 species), of which the following seven species represent outgroups: Calotes versicolor, Chamaeleo calyptratus, Elgaria multicarinata, Heloderma suspectum, Liolaemus darwinii, Plica plica, and Varanus salvator. The dataset consisted of 9,523 bp from the following 10 genes: three mitochondrial protein-coding genes, cytochrome b (cyt-b; 1,107 bp; 1,398 taxa), NADH subunit 2 (ND2; 1,042 bp; 334 taxa), and NADH subunit 4 (ND4; 802 bp; 986 taxa); two non-coding ribosomal genes (12S; 790 bp; 1,023 taxa) and (16S; 649 bp; 1,167 taxa); and five nuclear protein-coding genes, brain-derived neurotrophic factor precursor (BDNF; 675 bp; 314 taxa), neurotrophin-3 (NT3; 669 bp; 449 taxa), oocyte maturation factor Mos (c-mos; 753 bp; 957 taxa), and two recombination-activating genes (RAG-1.1; 926 bp; 209 taxa, RAG-1.2; 880 bp; 166 taxa; RAG-1.3; 517 bp; 153 taxa), and (RAG-2; 716 bp; 153 taxa). We split RAG-1 into three separate alignments because the majority of sequences did not overlap, but instead formed three separate segments of overlapping sequences. Sequences for seven outgroups and 1591 snake species were downloaded from GenBank (S1.1 Table). To maximize gene coverage for each species, we combined sequences from multiple individuals of the same species. We sequenced an additional 150 tissue samples from 88 species, of which 61 were not previously sequenced (S1.2 Table). Eighteen we field collected and 132 we obtained from museum vouchers. For field collected samples, we obtained tissue from tail clips or ventral scale clips using sterilized scissors, from snakes collected in Costa Rica and Singapore. We placed all tissue samples in 90% ethanol under the Alexander D. 8
17 McKelvy Field Series (ADM). Methods for tissue collection were approved by the University of New Orleans Animal Welfare Committee and by both permitting agencies for each country: Costa Rica, Ministerio del Ambiente y Energía Sistema Nacional de Areas de Conservación, permit ACTo-GASP-PIN , and; Singapore, NParks, permit NP/RP Museum tissue samples represent a combination of liver, muscle, and heart tissue and were gathered from the following museums: AMNH, CAS, FMNH, KU, LSUHC, LSUMNS, MVZ, and YPM (refer to S1.2 Table for museum codes). Species we sequenced are identified by species name and voucher number (S1.2 Table). For taxonomic classification, we consulted The Reptile Database ( As of October 2015, the database recognizes 3566 species of snakes. Our dataset accounted for approximately 46.33% of currently recognized snake species. DNA extraction, amplification, sequencing, and alignment We extracted genomic DNA from tissue samples following the standard protocol provided for Qiagen DNeasy kits. We sequenced six genes: 16S, c-mos, cyt-b, ND4, NT3, and RAG-1. A list of the primers used, their source, and annealing temperatures are provided in S1.3 Table. We aliquoted a 2 µl portion of each purified DNA extract and combined it with GoTaq Green MasterMix (Promega Corp.), primers from respective gene, and deionized water to create a 10 µl reaction to be used in the Polymerase Chain Reaction (PCR). We placed all PCR reactions on a thermal cycler under the following protocol: 95 C for 2 min; 95 C for 30 s; 50 C for 30 s for 40 cycles; 72 C for 1:15 min; 72 C for 3-5 min; and chilled at 4 C until taken off cycler. Next, we cleaned the PCR products using 1 µl of ExoSap-IT (USB Corp.) per 10 µl of PCR product. We performed cycle sequencing on purified PCR products using 1 µl primer 9
18 (10 µm), 2 µl template, and 5 µl deionized water along with a Big Dye Terminator 3.1 (Amersham Pharmacia Biotech) reaction premix for 50 cycles of 96 C for 10 s; 45 C for 5 s; and 60 C for 4 min and purified using a Sephdex column, then used an ABI 3130XL Genetic Analyzer to determine nucleotide sequences of each sample. We aligned all sequences using the default parameters of the Geneious alignment, and refined alignments using the default parameters of the MUSCLE alignment (Edgar, 2004) in the program Geneious v4.8.4 ( Kearse et al., 2012). We then edited alignments by eye and trimmed ambiguous end regions. For some genes, a few species had identical sequences with other taxa so we retained the first taxon in alphabetical order (Pyron et al., 2013a; S1.1 Table). Finally, we used Geneious to concatenate all genes to create a supermatrix. This matrix contained 71.41% of missing data; however, previous studies have shown that missing data does not negatively influence topology, branch length estimates, and node support (Pyron et al., 2011; Pyron et al., 2013a; Pyron et al., 2013b; Zheng and Wiens, 2016). We deposited all sequences generated from this study in GenBank (S1.2 Table). The final alignment is available at the DataDryad repository ( Phylogenetic inference We performed phylogenetic analyses on the 10-gene concatenated matrix using the maximum likelihood (ML) criterion in the program RAxML HpC-2 v8 (Stamatakis, 2014) on the CIPRES portal ( Miller et al., 2010). First, we analyzed each gene separately to check topological congruence by performing rapid bootstrap analyses and pruned misplaced taxa with suspect placement out of the alignment, before concatenating them into the 10
19 final alignment. The following five species were removed from the alignment due to poor placement for all genes: Boiga siamensis FMNH267726, Chrysopelea ornata LSUHC7158, Dipsadoboa werneri, Emydocephalus ijmae, and Psammodynastes pictus FMNH We conducted analyses by generating starting trees under the default parsimony model and obtained node support from 100 non-parametric bootstrap replicates using the GTRGAMMA model for all genes and codon partitions since the GTRGAMMA model is recommended over GTR + Γ + I as the 25 rate categories implemented with GTRGAMMA accounts for potentially invariant sites (Stamatakis, 2006). After concatenating the genes, we performed a rapid bootstrap analysis on the data partitioned by gene and codon position and obtained node support from 1000 nonparametric bootstrap replicates using the GTRGAMMA model. Rogue taxa can present themselves in phylogenetic estimates due to ambiguous or insufficient phylogenetic signal (Sanderson and Shaffer, 2002). These taxa decrease resolution and support in any best tree estimate because they cannot be placed with any confidence anywhere in the tree due to occupying numerous different phylogenetic positions in a set of trees (Wilkinson, 1996). Thus to produce a more informative best tree estimate with improved clade support, we identified and eliminated rogue taxa with the webserver version of RogueNaRok at (Aberer et al., 2013) using the support on best tree estimate threshold, optimizing support, and maximum dropset size of 1. To avoid pruning a large number of taxa, we only pruned 22 taxa that had a random improvement score (i.e., fraction of improvement in bootstrap support values throughout the tree when the selected taxon is pruned and all rogue taxa above it are also pruned) above 0.8 (S1.4 Table). We acknowledge that excluding additional rogue taxa will improve clade support values, but we wanted to include a maximum number of taxa to estimate a more comprehensive phylogeny. After pruning rogue taxa, the final dataset 11
20 resulted in 1745 taxa (1659 species). We then performed 10 ML searches on 10 random stepwise addition parsimony-based starting trees using the GTRGAMMA model. Next, we executed a final topology optimization on the best scoring ML tree to produce a nearest-neighbor interchange (NNI)-optimized estimate of the ML tree also using the GTRGAMMA model. Finally, we assessed node support using the non-parametric Shimodaira-Hasegawa-Like (SHL) implementation of the approximate likelihood-ratio test (alrt; Anisimova and Gascuel, 2006) based on several advantages over other support methods and considered SHL values of 85% or greater as strong support (Pyron et al., 2013a). We also estimated the tree with all rogue taxa from the first analysis and species classified as incertae sedis, all within the family Lamprophiidae (Buhoma depressiceps, Buhoma procterae, Micrelaps bicoloratus, and Oxyrhabdium leporinum), eliminated to scrutinize their influence on higher-level relationships. Nomenclatural Acts The electronic edition of this article conforms to the requirements of the amended International Code of Zoological Nomenclature, and hence the new names contained herein are available under that Code from the electronic edition of this article. This published work and the nomenclatural acts it contains have been registered in ZooBank, the online registration system for the ICZN. The ZooBank LSIDs (Life Science Identifiers) can be resolved and the associated information viewed through any standard web browser by appending the LSID to the prefix The LSID for this publication is: urn:lsid:zoobank.org:pub: E- D532-4C52-92AC-BECAE776E434. The electronic edition of this work was published in a 12
21 journal with an ISSN, and has been archived and is available from the following digital repositories: PubMed Central, LOCKSS. Results and Discussion Higher-level phylogeny As in previous studies, we find very strong support (SHL = 100) for the clade Serpentes (Hsiang et al., 2015; Pyron et al., 2013a; Reeder et al., 2015; Townsend et al., 2004; Wiens et al., 2012; Zheng and Wiens, 2016). In Fig. 1.1 we display a summary of the full ML tree (lnl = ) to exhibit relationships above the genus-level and present the full species-level tree in Fig. 1.2, made available in Newick format in S1 File and on the DataDryad repository ( Overall, more than half of the nodes in the full species-tree received strong support (73.45% of nodes with SHL values > 85). In the following section we largely compare our tree to Pyron et al., (2013a), since they provide a recent detailed comparison to preceding publications and because theirs is the only other clade-wide species-level tree (but see Zheng and Wiens, 2016). In general, we substantiate many of the higher-level relationships reported in Pyron et al., (2013a); however, several differences also exist. Support for monophyly for each family and subfamily was above 88%, except for Gerrhopilidae (SHL = 48), and Cylindrophiidae was paraphyletic with Anomochilidae (Gower et al., 2005; Reynolds et al., 2014; Zheng and Wiens, 2016). 13
22 Figure 1.1. Abridged phylogeny on final dataset of 1652 snake species and seven outgroup taxa displaying higher-level relationships. Maximum-likelihood phylogenetic estimate based on 10 concatenated genes. Tips represent families and sub-families. Commonly recognized higher-level clades are labeled in all caps and bold. Species classified as Lamprophiidae incertae sedis are also shown since they did not place within a subfamily. Node values represent SHL support values. Skeleton of the species tree is displayed on the left, colored and labeled as they appear in Figure
23 Scolecophidia Similar to many prior examinations, we find relationships within Scolecophidia unresolved (Burbrink and Crother, 2011; Heise et al., 1995; Pyron and Burbrink, 2012; Pyron et al., 2013a; Pyron et al., 2013b; Reeder et al., 2015; Rieppel, 1988; Scanlon and Lee, 2011; Underwood, 1967; Vidal et al., 2009; Vidal et al., 2010b; Wiens et al., 2008; Wiens et al., 2012; Zheng and Wiens, 2016), with studies showing either Scolecophidia 85,86] (Heise et al., 1995; Vidal et al., 2010b), Anomalepididae (Pyron et al., 2013a; Pyron et al., 2013b) or Leptotyphlopidae + Typhlopoidea (Reeder et al., 2015; Vidal et al., 2009; Wiens et al., 2008; Wiens et al., 2012; Zheng and Wiens, 2016) as sister to all snakes. Morphology also reveals uncertainty surrounding Scolecophidia (reviewed in Burbrink and Crother, 2011), but based on the presence of vestigial supratemporal and ectopterygoid bones, absent in other scolecophidians, Anomalepididae may be the most basal scolecophidian (Scanlon and Lee, 2011). We believe future work will lead to a reclassification of Scolecophidia, but until then relationships within the infraorder remain problematic. In addition, we find weak support for the placement of Asiatyphlopinae, Afrotyphlopinae, and Madatyphlopinae within Typhlopidae as in previous studies (Hedges et al., 2014; Kornilios et al., 2013; Pyron and Wallach, 2014; Pyron et al., 2013a; Vidal et al., 2010b; Zheng and Wiens, 2016). The issue appears to lie primarily with the placement of Argyrophis (Hedges et al., 2014) and Xerotyphlops (Hedges et al., 2014; Pyron et al., 2013a; Zheng and Wiens, 2016), which together formed Asiatyphlopinae I. Xerotyphlops is represented by two species, one occurring in the eastern Mediterranean and the other on Socotra Island (Kornilios et al., 2013), and Argyrophis is distributed from western Asia to Southeast Asia (Kornilios et al., 2013; Pyron and Wallach, 2014). Discordance in topology therefore appears 15
24 associated with these two genera being intermediate in distribution between African and Asian typhlopids, which may show affinities to clades from both regions. Henophidia As mentioned above, Cylindrophiidae is paraphyletic with Anomochilidae. Difficulty in resolving this relationship is likely due to the representation of Anomochilus by one species and two genes (12S and 16S), and Cylindrophis by two species with greater gene coverage. Both of these families were formerly shown as part of or paraphyletic with Uropeltidae (Pyron et al., 2013b; Reeder et al., 2015; Wiens et al., 2008; Wiens et al., Based on the history of paraphyly between these families, Burbrink and Crother (2011) recommended synonymizing Cylindrophiidae and Anomochilidae with Uropeltidae to resolve these families. However, we recommend retaining the current classification until more species are sampled (Table 1.1) on the grounds that Cylindrophiidae + Anomochilidae share morphological features not present in Uropeltidae (Burbrink and Crother, 2011; Gower et al., 2005) and since strong support has been shown distinguishing them from Uropeltidae (Pyron and Burbrink, 2012; Pyron et al., 2013a; Pyron et al., 2013b; Zheng and Wiens, 2016; this study). For boids, our analysis validates the taxonomic changes made in Pyron et al., (2014a), but differs in topology from previous assessments in the placement of Calabariidae, Candoiidae, and Sanziniidae (Pyron et al., 2013a; Reynolds et al., 2014; Zheng and Wiens, 2016). Although the relationship Erycidae + Boidae is recovered in all studies (Pyron et al., 2013a; Zheng and Wiens, 2016; this study), except one (Reynolds et al., 2014), support for this relationship is low. Thus, the only node we can have 16
25 confidence in is the one joining Charininae and Ungaliophiinae (Pyron et al., 2013a; Reynolds et al., 2014; Zheng and Wiens, 2016; this study). Xenophidiidae and Bolyeridae Perhaps the most notable difference from the topology of Pyron et al. (2013a) was the placement we recovered for Xenophidiidae + Bolyeridae (SHL = 91). Earlier studies showed them as sister to various clades within Henophidia (Lawson et al., 2004; Pyron and Burbrink, 2012; Pyron et al., 2013b; Reeder et al., 2015; Zheng and Wiens, 2016), but we found very strong support (SHL = 100) for them as sister to Caenophidia (SHL = 100), as also shown in other studies (Reynolds et al., 2014; Scanlon and Lee, 2011). In addition, these snakes possess morphological characters, particularly within the palate, bolstering their close relationship with Caenophidia and not to Henophidia (Scanlon and Lee, 2011). Pyron et al. (2013a) is the only study showing a disassociation between these families placing Xenophidiidae as sister to Alethinophidia, with the exception for Aniliidae + Tropidophiidae, and Bolyeridae as sister to Booidea. Currently, both clades are represented by one species and Xenophidiidae by only one gene (cyt-b). Both clades contain two species; for Xenophidion, both species are known only from one specimen each, and for Bolyeridae, Bolyeria is extinct, and Casarea is rare (Lawson et al., 2004), so obtaining additional sequences for either clade is unlikely. If this placement is retained, then Caenophidia should be redefined to include Xenophidiidae and Bolyeridae, or they should be given their own taxonomic grouping. 17
26 Caenophidia Pyron et al. (2014b) recently reviewed and attempted to resolve several problematic issues within Caenophidia. The major problems hindering resolution of this clade are 1) placement of Xenodermatidae inside or outside of Colubroidea; 2) placement of Homalopsidae; 3) topology of Lamprophiidae; and 4) topology of Colubridae. Previous studies have placed Xenodermatidae as sister to Acrochordidae (Kelly et al., 2003; Pyron et al., 2013a) or as basal in Colubroidea (Chen et al., 2013; Pyron et al., 2011; Reeder et al., 2015; Vidal and Hedges, 2002b; Wiens et al., 2008; Zheng and Wiens, 2016), have placed Homalopsidae as sister to Lamprophiidae + Elapidae (Chen et al., 2013; Pyron et al., 2011; Pyron et al., 2013a) or as sister to (Lamprophiidae + Elapidae) + Colubridae (Lawson et al., 2005; Pyron and Burbrink, 2012; Reeder et al., 2015; Vidal et al. 2007; Wiens et al., 2008; Zheng and Wiens, 2016), and have shown conflicting topologies for the subfamilies within Lamprophiidae and Colubridae (Chen et al. 2013; Kelly et al., 2003; Kelly et al., 2009; Pyron et al., 2011; Pyron et al., 2013a; Vidal et al. 2007; Wiens et al., 2008; Zheng and Wiens, 2016). Pyron et al. (2014b) used seven methods to examine these relationships showing Xenodermatidae as basal in Colubroidea with varying support and Homalopsidae as sister to (Lamprophiidae + Elapidae) + Colubridae with strong support. However, they expressed little confidence in resolving the topology within Lamprophiidae and Colubridae since several divergences were defined by low support. We confirm their findings that Xenodermatidae is sister to the rest of Colubroidea (SHL = 100) and that relationships within Lamprophiidae and Colubridae remain unresolved, but our findings for the placement of Homalopsidae contradicted theirs, as we recovered strong support (SHL = 91) for Homalopsidae + Lamprophiidae, and found Elapidae to be nested within Lamprophiidae. 18
27 Typically, Lamprophiidae and Elapidae are recovered as distinct clades (Kelly et al., 2009; Lawson et al., 2005; Pyron et al., 2011; Pyron et al., 2013a; Pyron et al., 2013b; Pyron et al., 2014b; Vidal et al., 2008), but we found strong support (SHL = 96) for Elapidae + Buhoma depressiceps as sister to Pseudoxyrhophiinae (SHL = 99), shown previously only in Pyron and Burbrink (2012). The topology of Lamprophiidae is complicated by the presence of several incertae sedis taxa (see Lamprophiidae; Kelly et al., 2009; Lawson et al., 2005; Pyron and Burbrink, 2012; Pyron et al., 2013b), but Elapidae remains nested within Lamprophiidae even when these taxa are removed (S1.1 Fig.). In addition, we found the placement of Pareatidae and Viperidae within Colubroidea unresolved. Pareatidae is consistently placed as sister to Viperidae, which is sister to Colubridae, Elapidae, Homalopsidae, and Lamprophiidae (Chen et al. 2013; Pyron and Burbrink, 2012; Pyron et al., 2011; Pyron et al., 2013a; Pyron et al., 2013b; Reeder et al., 2015; Zheng and Wiens, 2016). A possible explanation for this is that our dataset includes the greatest sampling of pareatids, adding seven additional species previously not included in higherlevel relationships, two we sequenced and five from You et al. (2015). Lamprophiidae Part of the issue with resolving the topologies within Lamprophiidae, and within Colubridae, is that they exemplify rapid radiations manifested by the presence of short internodes (Pyron et al., 2011). Yet another major issue hindering progress within Lamprophiidae is the presence of several incertae sedis taxa, not identified as rogue taxa by RogueNaRok. These taxa constantly show contrasting phylogenetic placement between studies (Kelly et al., 2009; Lawson et al., 2005; Pyron et al., 2011; Pyron et al., 2013a; Vidal and Hedges, 2002a; Vidal et al., 2008; 19
28 Zheng and Wiens, 2016). We are reluctant in placing any confidence in the topology between subfamilies recovered for Lamprophiidae, despite high support values. However, the topology after all rogues and incertae sedis taxa were pruned remained essentially the same (S1.1 Fig.) adding supplementary support for this topology. Nonetheless, our topology differs from earlier studies. Previous studies have consistently recovered the sister relationship between Aparallactinae + Atractaspidinae (Kelly et al., 2009; Lawson et al., 2005; Pyron and Burbrink, 2012; Pyron et al., 2011; Pyron et al., 2013a; Pyron et al., 2013b; Pyron et al., 2014b; Vidal et al., 2008); however, we found this relationship unresolved, likely due to the strong placement (SHL = 95) of Atractaspis irregularis as sister to these two clades, and this taxon is represented by only one gene. The topology recovered here was Psammophiinae + ((B. procterae + Prosymninae) + (Pseudaspidinae + (Atractaspidinae + Aparallactinae) + (O. leporinum + Lamprophiinae)) + (((Ditypophis sp. + M. bicoloratus) + Pseudoxyrhophiinae) + (B. depressiceps + Elapidae)))). All nodes received strong support (SHL > 88), except for subclades B. procterae + Prosymninae and Ditypophis sp. + M. bicoloratus. Pyron et al. (2013a) had augmented the definition of Pseudaspidinae to include Buhoma and Psammodynastes. With added sampling of Psammodynastes, we recovered this genus as paraphyletic with Rhamphiophis oxyrhynchus (SHL = 100) within Psammophiinae, making Rhamphiophis paraphyletic (Fig. 1.2G). Buhoma, on the other hand, was split with B. procterae sister to Prosymninae and B. depressiceps sister to Elapidae. Oxyrhabdium leporinum was sister to Lamprophiinae and Micrelaps bicoloratus was placed within Pseudoxyrhophiinae. In all preliminary and final analyses, Psammodynastes constantly occupied the same phylogenetic position; however, placement of the other four species was erratic and always differed. Therefore, we tentatively include Psammodynastes as part of Psammophiinae. Due to their perpetual variable placement, 20
29 we continue recognizing Buhoma, M. bicoloratus, and O. leporinum as Lamprophiidae incertae sedis. Colubridae For Colubridae, we recovered the following four subclades: i) Sibynophiinae + Natricinae (SHL = 80); ii) Pseudoxenodontinae + Dipsadinae (SHL = 82); iii) Grayiinae + Calamariinae (SHL = 70); and iv) Ahaetuliinae subfam. nov. + Colubrinae (SHL = 95). The nodes between these subclades all received very strong support (SHL > 97). The only consistently recovered clade among these is subclade ii (Chen et al. 2013; Pyron and Burbrink, 2012; Pyron et al., 2011; Pyron et al., 2013b; Pyron et al., 2014b); although other studies do not recover this subclade (Grazziotin et al., 2012; Pyron et al., 2013a; Zheng and Wiens, 2016). Several studies also regularly recovered the subclade Natricinae + (Pseudoxenodontinae + Dipsadinae) (Chen et al. 2013; Pyron and Burbrink, 2012; Pyron et al., 2011; Pyron et al., 2014b), but we do not uncover that relationship here. Instead, Natricinae formed a subclade with Sibynophiinae, also reported in (Pyron et al., 2013b). The subfamily Sibynophiinae was only recently included in molecular analyses, originally grouped with Calamariinae (Chen et al. 2013), then subsequently placed as sister to Grayiinae + Colubrinae (Pyron et al., 2013a; Zheng and Wiens, 2016), and to Calamariinae + (Colubrinae + Grayiinae) (Pyron et al., 2014b). The subfamily Grayiinae was also recently described (Vidal et al. 2007) and grouped with Calamariinae in that study, also recovered in Pyron and Burbrink (2012). However, Grayiinae has most frequently been grouped with Colubrinae (Chen et al. 2013; Lawson et al., 2005; Pyron et al., 2011; Pyron et al., 2013a; Pyron et al., 2013b; Pyron et al., 2014b; Zheng and Wiens, 2016). Dipsadinae is exclusively a 21
30 New World family, but recent placement of Stichophanes and Thermophis as sister to Dipsadinae (Peng et al., 2014; Pyron et al., 2013a; Wang et al., 2014) expanded its distribution into the Old World. Pyron et al. (2013a) did not include Stichophanes, and they mentioned that Thermophis may even warrant its own subfamily. However, our results do not uphold this view since we show Stichophanes + Thermophis (SHL = 96; Fig. 1.2L) as placed within Dipsadinae. Wang et al. (2014), on the other hand, supported Stichophanes + Thermophis as sister to Dipsadinae, but their dataset was not as extensive and did not include T. zhaoermii. Until now, the basal node of Colubrinae has remained ambiguous. Pyron et al. (2013a) suggested that monophyly of Ahaetulla, Chrysopelea, and Dendrelaphis at the base of Colubrinae, may warrant recognition as a distinct subfamily, but support for division of these taxa in their study was low. Due to increased sampling, and the inclusion of Dryophiops, we established strong support for recognizing these taxa as a new subfamily, using the name proposed by Pyron et al. (2013a), Ahaetuliinae subfam. nov. Higher-level phylogeny with all rogue taxa eliminated With all rogue taxa (101) and incertae sedis species (4) eliminated, higher-level relationships and support values remained relatively unchanged (S1.1 Fig.). Where changes in topology or support values occurred, it was in the problematic clades discussed above, specifically Typhlopidae, Booidea, Pareatidae + Viperidae, Lamprophiidae, and Colubridae. For Typhlopidae, Xerotyphlops formed a clade by itself, sister to all other typhlopids. Madatyphlopinae formed a moderately supported (SHL = 87) clade with Typhlopinae. However, the placements of Afrotyphlopinae and Asiatyphlopinae remained unresolved. In Booidea, the 22
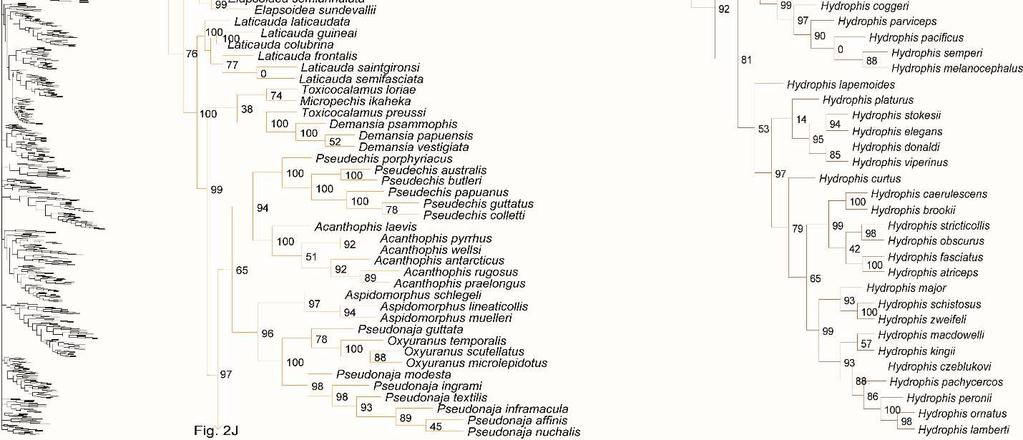
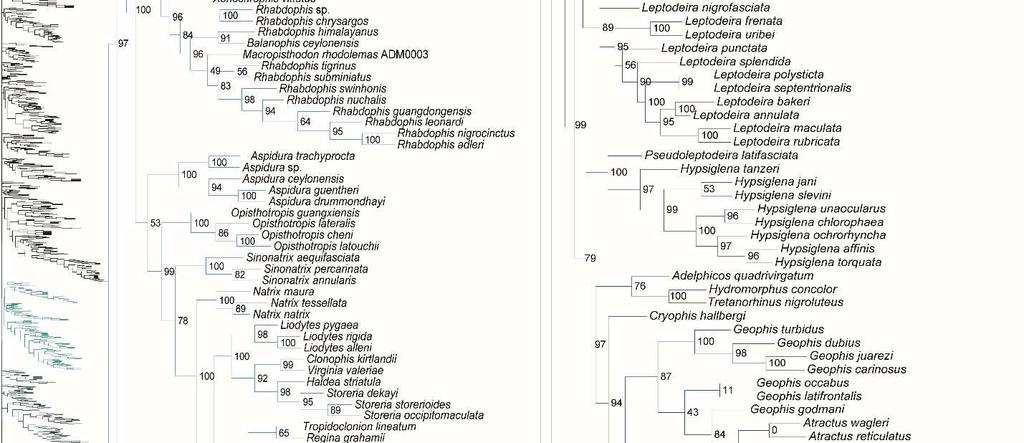
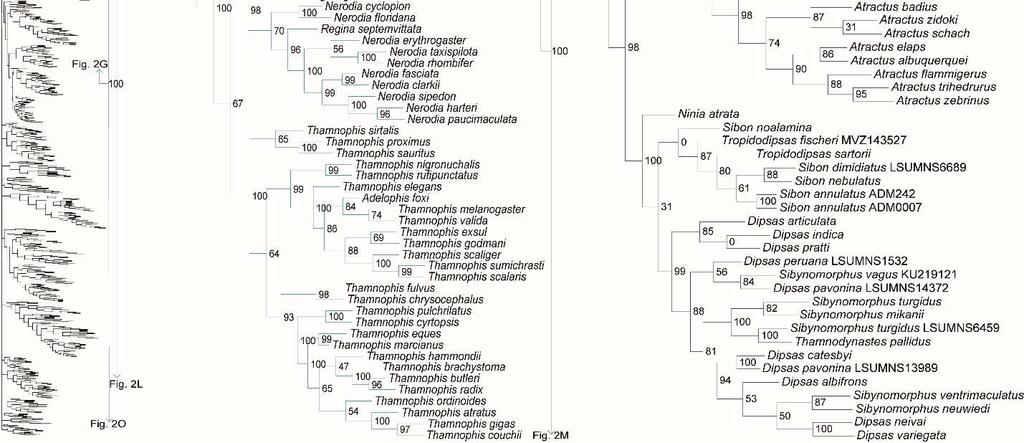
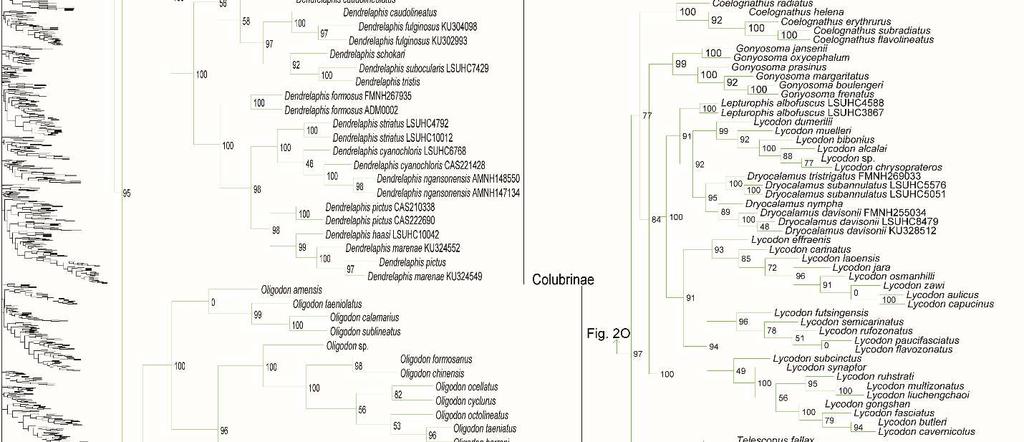
31 placement of Calabariidae + Candoiidae swapped with Sanziniidae, greatly altering support values throughout Booidea, except in Charininae + Ungaliophiinae. Within Colubroidea, the placement of Pareatidae and Viperidae remains unresolved. Interestingly, with incertae sedis species removed from Lamprophiidae, topology of the subfamilies and of Elapidae within Lamprophiidae remained the same and the relationship between Atractaspidinae and Aparallactinae was strongly resolved, providing compelling support for the topology recovered. However, the node joining Prosymninae to all other lamprophiids became ambiguous. Relationships within Colubridae remained stable, except that Pseudoxenodontinae placed as sister to all other colubrids. In addition, we note that the sister relationship of Xenopeltidae to Loxocemidae + Pythonidae became ambiguous, and that with the exclusion of Xenophidiidae as a rogue taxon, Bolyeridae still placed as sister to Caenophidia with high support (SHL = 99), upholding its position outside of Henophidia. Figure 1.2. Species-level phylogeny on final dataset of 1652 snake species. Maximumlikelihood phylogenetic estimate based on 10 concatenated genes. Node values represent SHL support values. Seven outgroup taxa are not shown. Colors of clades indicate their position in the overall tree, shown at left. Newly sequenced taxa are highlighted in bold. Skeleton of the species tree is displayed on the left with displayed subfamilies/families highlighted. Letters denoted by i and ii represent parts of the tree where external branches do not connect to the part of the tree immediately preceding it. A) Anomalepididae, Epictinae, Leptotyphlopinae, Gerrhopilidae, Xenotyphlopidae, and Typhlopinae B) Asiatyphlopinae I, Afrotyphlopinae; Madatyphlopinae, and Asiatyphlopinae II; C) Aniliidae, Tropidophiidae, Calabariidae, Candoiidae, Sanziniidae, Charininae, Ungaliophiinae, Erycidae, and Boidae; Di) Cylindrophiidae + Anomochilidae, Uropeltidae, Xenopeltidae, Loxocemidae, and Pythonidae, Dii) Bolyeridae, Xenophidiidae, Acrochordidae, Xenodermatidae, and Pareatidae; Ei) Viperinae; Eii) Azemiopinae, and Crotalinae; F) Crotalinae cont.; G) Homalopsidae, Psammophiinae, Buhoma procterae, Prosymninae, Pseudaspidinae, Atractaspidinae, and Aparallactinae; Hi) Oxyrhabdium leporinum, Lamprophiinae, Hii) Ditypophis sp. + Micrelaps bicoloratus, and Pseudoxyrhophiinae; I) Buhoma depressiceps and Elapidae; J) Elapidae cont.; K) Sibynophiinae and Natricinae; L) Pseudoxenodontinae and Dipsadinae; M) Dipsadinae cont.; N) Dipsadinae cont.; O), Grayiinae, Calamariinae, Ahaetullinae subfam. nov., and Colubrinae; Pi) Colubrinae cont.; Pii) Colubrinae cont.; Q) Colubrinae cont.; R) Colubrinae cont. 23
32 24
33 25

34 26
35 27


36 28

37 29

38 30


39 31
40 32
41 Genus- and species-level phylogeny Of the 147 samples we sequenced, two genera (Dryophiops, and Liopeltis) and 61 species were not previously incorporated in any phylogenetic analyses. Dryophiops placed within Ahaetullinae subfam. nov. as sister to Ahaetulla (SHL = 99), and Liopeltis fell within Colubrinae as sister taxon (SHL = 97) to Ptyas + Cyclophiops. We recovered strong support for the phylogenetic placement of 105 of our samples (SHL > 85). For taxa where our sequences resulted in multiple terminals of the same species, the following species were not monophyletic: Ahaetulla nasuta, A. prasina, Chironius exoletus, C. fuscus, C. monticola, C. multiventris, Dasypeltis fasciata, Dendrelaphis cyanochloris, D. marenae, Dendrophidion percarinatum, Philothamnus natalensis, Phrynonax poecilonotus, P. shropshirei, Psammodynastes pictus, Sibynomorphus turgidus, Spilotes sulphureus, and Trimeresurus fucata. Throughout the entire tree, most genera were monophyletic with varied node support. Space does not allow for exhaustive scrutiny at the generic and species level of our tree with previous publications, although a cursory examination reveals consistency with previous publications. Instead, we focus on assessing the placement of paraphyletic genera, most of which require greater sampling of species and genes, or perhaps individuals, to provide an improved appraisal of their phylogenetic positions. Paraphyly at the lower-level of the tree emerged due to various reasons. For some clades paraphyly is well-established and confirmed here, more notably in Brachyophidium, Pseudotyphlops, Rhinophis, and Uropeltis in Uropeltidae (Fig. 1.2Di) (Bossuyt et al., 2004; Pyron et al., 2013a; Pyron et al., 2013b; Reynolds et al., 2014); Ovophis and Trimeresurus in respect to Ovophis okinavensis + Trimeresurus gracilis as basal to Gloydius (Fig. 1.2F) 33
42 (Malhotra and Thorpe, 2004; Malhotra et al., 2010); Adelophis, Amphiesma, Atretium, Nerodia, Regina, Thamnophis, Tropidoclonion, and Xenochrophis in Natricinae (Fig. 1.2K) (Alfaro and Arnold, 2001; Guo et al., 2014; McVay et al., 2015; Pyron et al., 2013a); and Dipsas, Geophis, and Sibynomorphus in Dipsadinae (Fig. 1.2L) (Grazziotin et al., 2012; Pyron et al., 2013a; Vidal et al., 2010a; Zaher et al., 2009). Additional taxa include: variable placement of Morelia viridis (Fig. 1.2Di) (Kluge, 1993; Lawson et al., 2004; Pyron et al., 2013a; Rawlings et al., 2008) and Bothrocophias campbelli (Fig. 1.2F) (Fenwick et al., 2009); and Suta with Parasuta (Fig. 1.2J) (Pyron et al., 2013a; Sanders et al., 2008). Clearly, these clades require further inspection. On the other hand, we were able to rectify other paraphyletic taxa with strong support, specifically within Colubrinae: Boiga, Chironius, Coronella, Crotaphopeltis, Dasypeltis, Dipsadoboa, Hapsidophrys, and Philothamnus, Rhinechis, and Scaphiophis. In some taxa, such as Cerrophidion wilsoni (Fig. 1.2F), Atractus irregularis (Fig. 1.2G), Ditypophis sp. (Fig. 1.2Hii), Aspidelaps irregularis (Fig. 1.2I), Pseudonaja guttata (Fig. 1.2I), Geophis with Atractus (Fig. 1.2L), Sibon noalamina (Fig. 1.2L), Philodryas chamissonis and P. trilineata (Fig. 1.2M), Conophis and Conopsis (Fig. 1.2M & Fig. 1.2R), Ptyas korros (Fig. 1.2Q), Tantilla melanocephala (Fig. 1.2R), and Salvadora hexalepis (Fig. 1.2R), sequence overlap with related taxa was zero or minimal. Whereas for the following taxa, their placement were unresolved: Typhlopidae, Rhinotyphlops unitaeniata (Fig. 1.2B); Uropeltidae, Rhinophis philippinus (Fig. 1.2D); Pythonidae, Simalia oenpelliensis (Fig. 1.2D); Viperidae, Atropoides picadoi and Bothrops lojanus (Fig. 1.2F); Elapidae, Toxicocalamus loriae (Fig. 1.2I); Natricinae, Macropisthodon rhodolemas ADM0003 (Fig. 1.2K); Dipsadinae, Oxyrhopus fitzingeri LSUMNS6586 and Siphlophis cervinus (Fig. 1.2M); Calamariinae, Pseudorabdion oxycephalum (Fig. 1.2O); and Colubrinae, Hierophis andreanus and Dolichophis cypriensis (Fig. 1.2Pi), 34
43 Pantherophis and Pituophis (Fig. 1.2Q), Drymobius rhombifer, Dendrophidion dendrophis, Chilomeniscus stramineus, Tantilla melanocephala, and Salvadora hexalepis (Fig. 1.2R).We do not classify Calliophis and Sinomicrurus as paraphyletic until the identity of Calliophis sp. is known. For some clades, paraphyly was strongly supported allowing us to synonymize these taxa. Within Psammophiinae, we synonymize Rhagerhis moilensis with Malpolon. This species consistently forms a monophyletic clade with Malpolon (Carranza et al., 2006; Kelly et al., 2008; Kelly et al., 2009; Pyron et al., 2013a) (Fig. 1.2G), but two studies Böhme and De Pury, 2011; Vidal et al., 2008), inaccurately cite Kelly et al. (2008) as providing evidence for their separation. In Aparallactinae, we synonymize Xenocalamus with Amblyodipsas (Fig. 1.2G), also recovered in Pyron et al. (2013a), the only other study including these taxa. Within Colubrinae we synonymize several clades. First, we synonymize Lepturophis and Dryocalamus with Lycodon, which forms a strong clade (SHL = 100) with these taxa strongly embedded within (Grismer et al., 2014; Pyron et al., 2013a) (Fig. 1.2Pii). Next, we synonymize Rhinechis scalaris, a species with an erratic phylogenetic history (Lenk et al., 2001; Utiger et al., 2002), with Zamenis, but the addition of more genes shows it related to Zamenis (Burbrink and Lawson, 2007; Pyron et al., 2013a) (Fig. 1.2Q), with which it has morphological affinities to (Schulz, 1995). Finally, we also synonymize Cyclophiops with Ptyas. Previously recovered as sister clades (Chen et al., 2014; Pyron et al., 2013a), our increased sampling for both genera shows that Ptyas forms a strong clade (SHL = 95) with the two species of Cyclophiops strongly nested within two separate subclades (Fig. 1.2R). Conversely, in other clades paraphyly was strong, but we do not propose taxonomic changes, specifically in Hebius sauteri placing with Amphiesma (Fig. 1.2K), Balanophis ceylonensis within Rhabdophis (Fig. 1.2K), Thamnodynastes pallidus 35
44 placing with Sibynomorphus (Fig. 1.2L), Pliocercus split (Fig. 1.2L & 1.2M), Ninia split (Fig. 1.2L & 1.2M), Dispholidus typus within Thelotornis (Fig. 1.2O), Chionactis occipitalis placing with Sonora (Fig. 1.2R), and P. shropshirei LSUMNS7806 within Spilotes (Fig. 1.2R), mainly because these taxa, or taxa they placed with, are presented for the first time in a phylogenetic analysis. In the case of Hemerophis, after the genus Bamanophis was erected for Coluber dorri (Schätti and Trape, 2008), H. zebrinus remained as the only Old World Coluber representative, until it was recently recognized as Hemerophis without justification (Uetz and Hošek, 2015; Wallach et al., 2014). Yet, the two are distantly-related within a clade of Old World racers (Nagy et al., 2003; Nagy et al., 2004; Pyron et al., 2011; Pyron et al., 2013a). H. zebrinus is typically placed in a clade sister to Bamanophis and Macroprotodon, but a very recent study incorporating new sequence data for Rhynchocalamus, not included here, places H. zebrinus as the basal lineage within this clade sister to (Bamanophis + Macroprotodon) and all other Old World racers Šmίd et al. (2015); while H. socotrae, occupies a branch away from this clade. Nagy et al. (2004) shows weak support for a sister relationship between the two using maximum parsimony, but shows them separated with greater support using Bayesian inference and ML. Therefore, we create a new genus for H. zebrinus, Mopanveldophis gen. nov. Supermatrix approach Despite the utility of the supermatrix approach, this method is also potentially responsible for uncertainty in some nodes. Compiling available molecular data from numerous studies leads to a sparse data matrix with a substantial portion of missing data unequally scattered throughout 36
45 the alignment due to sampling differences between studies (Burleigh et al., 2015). Our dataset consisted of 71.41% of missing data with several taxa represented by a single gene to taxa with data spanning all loci. Heterogeneity in sparse data matrices can alter topological relationships and negatively impact tree support by increasing the presence of rogue taxa (Wilkinson, 1996). Rogue taxa typically are characterized by little character data that do not overlap with closelyrelated taxa (Thomson and Shaffer, 2009). We identified and removed 22 rogue taxa from our data matrix, 12 of which were delineated by one gene and eight by two genes. The genes 12S, 16S, c-mos, and ND4 were most associated with rogue taxa. These genes evolve more slowly and are not adequate for delimiting species-level relationships (see methods), and several families in our tree are only represented by one or two individuals with few sequenced loci (i.e., Anomalepididae, Anomochilidae, Bolyeridae, Cylindrophiidae, and Xenophidiidae; Table 1.1). Many taxa in the tree with low support were also represented by a single gene. Furthermore, lack of sequence overlap between closely-related species can also lead to misplacement of taxa in the tree, sometimes with high support as mentioned above. However, many taxa with extensive missing data were placed correctly in the tree (e.g., Chironius multiventris, Pseudocerastes urarachnoides, Rhabdophis chrysargos, Trimeresurus wiroti), grouping with closely-related taxa with high support, confirming that increased taxon sampling is a favorable choice for improving phylogenetic accuracy (Hedtke et al., 2006), even with a high percentage of missing data (Wiens and Tiu, 2012). This can occur when the overall number of characters in the data matrix is high (Driskell et al., 2004; Philippe et al., 2004; Roure et al., 2013; Wiens and Moen, 2008; Wiens and Morrill, 2011), especially for SHL support values since they are not negatively affected by the amount of missing data in the data matrix (Pyron et al., 2011). 37
46 In many cases, denser sampling influenced phylogenetic relationships and node support (Nabhan and Sarkar, 2011). For example, adding 30 samples of 18 species (14 never before sequenced) to Ahaetuliinae, resolved the basal Colubrinae node and distinguished Ahaetuliinae as a new subfamily. Increased taxon sampling also resolved several paraphyletic issues at the generic level, identified new associations of paraphyly, mostly due to poor gene sampling, resulted in new phylogenetic hypotheses for some taxa such as Scaphiophis, Stichophanes + Thermophis, and Xerotyphlops, and prompted us to make some taxonomic changes. Moreover, our sequencing contribution resulted in complete or nearly complete taxonomic coverage of several genera, including Ahaetulla, Asthenodipsas, Chrysopelea, Dendroaspis, Dryocalamus, Dryophiops, Phrynonax, Ptyas, and Ungaliophis, and greatly increased representation of species of the speciose genera Boiga and Dendrelaphis. Nonetheless, many challenges exist to estimating the snake tree of life. Taxonomic descriptions Subfamily Ahaetuliinae subfam. nov. urn:lsid:zoobank.org:act: 22C DEF-45A4- ABAC-11C AD Type genus. Ahaetulla Link (1807) Content. Four genera containing 56 species. Ahaetulla (8 species), Chrysopelea (5 species), Dendrelaphis (41 species), and Dryophiops (2 species). Etymology. From the Sri Lankan language Sinhala, ahaetulla/ahata gulla/as gulla, meaning eye plucker or eye picker for belief that they pluck out the eyes of humans 38
47 as accounted by the Portuguese traveler João Ribeiro in 1685 (as cited in Weinstein et al., 2011). Diagnosis and Definition. Snakes of this subfamily are arboreal and are diagnosed by keeled ventral and subcaudal scales (laterally notched in some species), and enlarged posterior grooved fangs lacking in some Dendrelaphis. Support for monophyly of this clade is very strong (SHL = 100) as also reported in Pyron et al. (2013a). Ahaetuliinae is further split into two monophyletic groups: 1) Dryophiops and Ahaetulla (SHL = 96) and; 2) Chrysopelea and Dendrelaphis (SHL = 100). Diagnostic characteristics of the first group include, elongate and laterally-compressed bodies, elongate heads, 15 smooth midbody dorsal scale rows, and large eyes with horizontal pupils and well-developed canthus rostralis outfitting these snakes with binocular vision (Walls, 1942). Features diagnostic of the second group include, slender body, rectangular slightly compressed heads, large eyes with round pupils, smooth to weakly-keeled mid-body dorsal scale rows. Chrysopelea are celebrated for their unique gliding behavior, whereas Dendrelaphis are capable of jumping (Socha, 2011). Sister taxon. Previously placed within Colubrinae, Ahaetuliinae forms a strong (SHL = 95) sister relationship with Colubrinae, also weakly supported by Pyron et al. (2013a). Distribution. Members of this subfamily inhabit various habitats, but are mostly associated with forests distributed from Pakistan, Sri Lanka and India, north to Nepal and Bangladesh, eastwards all throughout Southeast Asia to southern China, Philippines, Papua New Guinea, and northeast Australia. Remarks. The name Ahaetulla has suffered from a tumultuous nomenclatural history (Savage and Oliver, 1956). In addition, members of these genera have historically been 39
48 grouped with unrelated taxa based on absence or presence of hypapophyses (Boulenger, 1896; Brongersma, 1938). Genus Mopanveldophis gen. nov. urn:lsid:zoobank.org:act: 3B0CB6A0-1EEC E77- B105C22ACABB Type species. Mopanveldophis zebrinus. Content. The genus is monotypic containing only the species, Mopanveldophis zebrinus. Etymology. The generic nomen Mopanveldophis is derived from the word mopanveld, the name of the type of habitat the specimens were found in, and the Greek adjective ophis, meaning snake. This name refers to veld habitat distributed in Southern Africa, from the Afrikaans word field, that is dominated by the mopane tree, Colophospermum mopane, from the Sechuana word mopani. Diagnosis and Definition. As described in Broadley and Schätti (1997) and Bauer et al. (2001), a snake with pale grey dorsal coloration and irregular broad, dark crossbands becoming faint in coloration posteriorly and on tail. Ventrals are uniform white with irregular lateral black spots, and subcaudals are also white with lateral grey stippling. Dorsal portion of head is uniform grey-brown with yellowish orange snout and labials, and dark markings on supralabials 2-6. Dorsal scales with two apical pits, 23 scale rows near neck, 23 at midbody, and anterior to the vent. Approximately 195 ventrals, 90 paired subcaudals, and divided anal scute. Nine supralabials with the fifth and sixth entering the orbit, one anterior subocular smaller than the loreal shield and situated above the fourth and anterior part of the fifth supralabials, and two preoculars and two postoculars. Also, diagnosed by a single large lower anterior temporal shield above the 40
49 7 th and 8 th supralabials, two upper anterior temporal, three posterior temporal, and maxillary with teeth separated by a diastema. Its banded pattern was suggested as Batesian mimicry of the sympatric spitting cobra, Naja nigricollis. Bamanophis differs by having scale rows near neck, at midbody, and 17 near vent, ventral scale and paired subcaudals, lacking an anterior subocular, having one posterior subocular, 10 supralabials, and maxillary teeth with diastema (Schätti and Trape, 2008). Sister taxa. M. zebrinus is basal lineage to a clade including Bamanophis + Macroprotodon, placed within a larger clade of Old World racers (Nagy et al., 2003; Nagy et al., 2004; Pyron et al., 2011; Pyron et al., 2013a). Distribution. Currently recognized as endemic to northern Namibia, Africa (Herrmann and Branch, 2013), but its range may extend into Angola, Africa (Bauer et al., 2001). Remarks. First described from a dead specimen collected in 1991 (Broadley and Schätti, 1997), the species is currently known from only three specimens (Bauer et al., 2001). Upon its description it was assigned to the genus Coluber, presumably on basis of similar morphology, but then switched to Hemerophis (Uetz and Hošek, 2015; Wallach et al., 2014) with no published reasoning. Schätti and Trape (2008) provide an account detailing the differences of Bamanophis to other racer species, including M. zebrinus. Conclusions At less than half (46.33%) of the total snake diversity sampled, we provide the most comprehensive sampling effort to date, but remain far from fully estimating the snake tree of life. 41
50 This sampling effort pales in comparison to larger clades such as birds that have approximately 70% of more than 10,000 species sequenced (Burleigh et al., 2015). Although our results provide resolution for several higher-level nodes, these nodes may continue to prove problematic. Collectively, future analyses should target or pay special attention to the following ten issues: 1) resolving topology of Scolecophidia; 2) resolving topology of Typhlopinae; 3) resolving paraphyly of Cylindrophiidae with Anomochilidae; 4) placement of Xenophidiidae and Bolyeridae; 5) resolving topology of Booidea; 6) placement of Xenodermatidae; 7) placement of Pareatidae; 8) placement of Homalopsidae; 9) resolving topology of Lamprophiidae + Elapidae; and 10) resolving topology of Colubridae. Clearly, greater taxon and gene sampling will help better formulate a picture of snake relationships and resolve ambiguous nodes in the tree (Hedtke et al., 2006; Nabhan and Sarkar, 2011). Taxa most lacking in representation are fossorial clades, mainly Afrotyphlopinae, Anomalepididae, Aparallactinae, Calamariinae, Cylindrophiidae, Epictinae, Gerrhopilidae, Madatyphlopinae, Uropeltidae, and Xenodermatidae at below 30% (Table 1.1). Similar deficiencies occur at the genus level, but are not listed here. The genes most frequently sampled for snakes are 12S, 16S, c-mos, cyt-b, and ND4, and should be considered as candidate genes in future studies. Sampling more nuclear genes will also be crucial in resolving deeper nodes (Zheng and Wiens, 2016). Where coalescence-based methods are practiced, researchers should place emphasis on short and weakly supported branches since they are more prone to incomplete lineage sorting and thus, conflict most often with branches on species-trees (Lambert et al., 2015). This phylogeny has major implications on snake evolution such as on the evolution of gape size and the evolution of venom-delivery systems (Scanlon and Lee, 2011; Vidal and Hedges, 2002b; Vidal et al., 2009), and serves as a resource for formulating future studies on snake phylogenetics. 42
51 Acknowledgements We are indebted to the many researchers who donated tissue samples to museum collections and uploaded their sequences on GenBank. For supporting this research in the way of loaning tissue samples, We would like to acknowledge curators and staff at the Ambrose Monell Cryo Collection (AMCC) at the American Museum of Natural History, New York (AMNH), the California Academy of Sciences (CAS), the Field Museum of Natural History (FMNH), the Natural History Museum & Biodiversity Research Center at the University of Kansas (KU), and the LSU Museum of Natural Science Collection of Genetic Resources (LSUMNS) and L.J. Vitt and his NSF grants DEB and DEB , the Museum of Vertebrate Zoology (MVZ), and the Peabody Museum of Natural History Yale University (YPM). We thank Robin Rowe at the University of New Orleans W.M. Keck Conservation and Molecular Genetics Laboratory for sequencing molecular samples, and Caño Palma Biological Research Station in Costa Rica and David Bickford at The National University of Singapore for providing lab space during field research. We also like to thank several anonymous reviewers for providing useful comments that helped improve the manuscript. 43
52 References Aberer AJ, Krompass D, Stamatakis A. Pruning rogue taxa improves phylogenetic accuracy, an efficient algorithm and webservice. Syst. Biol. 2013; 62: Adalsteinsson SA, Branch WR, Trape S, Vitt LJ, Hedges SB. Molecular phylogeny, classification, and biogeography of snakes of the family Leptotyphlopidae (Reptilia, Squamata). Zootaxa. 2009; 2244: Alfaro ME, Arnold, SJ. Molecular systematics and evolution of Regina and the thamnophiine snakes. Mol. Phylogenet. Evol. 2001; 21: Alfaro ME, Karns DR, Voris HK, Brock CD, Stuart BL. Phylogeny, evolutionary history, and biogeography of Oriental Australian rear-fanged water snakes (Colubroidea: Homalopsidae) inferred from mitochondrial and nuclear DNA sequences. Mol. Phylogenet. Evol. 2008; 46: Anisimova M, Gascuel O. Approximate likelihood-ratio test for branches: A fast, accurate, and powerful alternative. Syst. Biol. 2006; 55: Bauer AM, Lamb T, Branch WR, Babb RD. New records of two rare snakes from northern Namibia, with comments on the trans-kunene distribution of mopaneveld squamates. Herpetozoa. 2001; 14: Böhme W, De Pury S. A note on the generic allocation of Coluber moilensis Reuss 1834 (Serpentes: Psammophiidae). Salamandra. 2011; 47: Bossuyt F, Meegaskumbura M, Beenaerts N, Gower DJ, Pethiyagoda R, Roelants K, et al. Local endemism within the Western Ghats - Sri Lanka biodiversity hotspot. Science. 2004; 306:
53 Boulenger GA. Catalogue of the snakes in the British Museum (Natural History). Vol. III. Containing the Colubridae (opisthoglyphae and proteroglyphae), Amblycephalidae, and Viperidae. London: Taylor and Francis; Broadley DG, Schätti B. A new species of Coluber from northern Namibia (Reptilia, Serpentes). Madoqua. 1997; 19: Brongersma LD. On the presence or absence of hypapophyses under the posterior precaudal vertebrae in some snakes. Zool. Meded. 1938; 20: Burbrink FT, Crother BI. Evolution and taxonomy of snakes. In: Aldridge RA, Sever DM, editors. Reproductive biology and phylogeny of snakes. Boca Raton: CRC Press; p Burbrink FT, Lawson R. How and when did Old World ratsnakes disperse into the New World? Mol. Phylogenet. Evol. 2007; 43: Burleigh JG, Kimball RT, Braun EL. Building the avian tree of life using a large-scale, sparse supermatrix. Mol. Phylogenet. Evol. 2015; 84: Cadle JE. Phylogenetic relationships among advanced snakes: A molecular perspective. Univ. of California Publ. Zool p Carranza S, Arnold EN, Pleguezuelos JM. Phylogeny, biogeography, and evolution of two Mediterranean snakes, Malpolon monspessulanus and Hemorrhois hippocrepis (Squamata: Colubridae), using mtdna sequences. Mol. Phylogenet. Evol. 2006; 40: Castoe TA, Parkinson CL. Bayesian mixed models and the phylogeny of pitvipers (Viperidae: Serpentes). Mol. Phylogenet. Evol. 2006; 39:
54 Chen X, Huang S, Guo P, Colli GR, de Oca ANM., Vitt LJ, et al. Understanding the formation of ancient intertropical disjunct distributions using Asian and Neotropical hinged-teeth snakes (Sibynophis and Scaphiodontophis: Serpentes: Colubridae). Mol. Phylogenet. Evol. 2013; 66: Chen X, McKelvy AD, Grismer LL, Matsui M, Nishikawa K, Burbrink FT. The phylogenetic position and taxonomic status of the Rainbow Tree Snake Gonyophis margaritatus (Peters, 1871) (Squamata: Colubridae). Zootaxa. 2014; 3881: de Queiroz A, Gatesy J. The supermatrix approach to systematics. Trends Ecol. Evol. 2007; 22: Dowling HG, Hass CA, Hedges SB, Highton R. Snake relationships revealed by slow-evolving proteins: a preliminary survey. J. Zool., Lond. 1996; 240: Driskell AC, Ane C, Burleigh JG, McMahon MM, O'Meara B, Sanderson MJ. Prospects for building the tree of life from large sequence databases. Science. 2004; 306: Edgar RC. MUSCLE: multiple sequence alignment with high accuracy and high throughput. Nucleic Acids Res. 2004; 32: Edwards SV. Is a new and general theory of molecular systematics emerging? Evolution. 2009; 63: Fenwick AM, Gutberlet RL, Jr Evans JA, Parkinson CL. Morphological and molecular evidence for phylogeny and classification of South American pitvipers, genera Bothrops, Bothriopsis and Bothrocophias (Serpentes: Viperidae). Zool. J. Linn. Soc. 2009; 156: Gatesy J, Springer MS. Phylogenetic analysis at deep timescales: Unreliable gene trees, bypassed hidden support, and the coalescence/concatalescence conundrum. Mol. Phylogenet. Evol. 2014; 80:
55 Gower DJ, Vidal N, Spinks JN, McCarthy CJ. The phylogenetic position of Anomochilidae (Reptilia: Serpentes), first evidence from DNA sequences. J. Zool. Syst. Evol. Res. 2005; 43: Grazziotin FG, Zaher H, Murphy RW, Scrocchi G, Benavides MA, Zhang YP, et al. Molecular phylogeny of the new world Dipsadidae (Serpentes: Colubroidea): a reappraisal. Cladistics. 2012; 28: Grismer L, Quah ES, Muin MA, Wood PJL, Nor SAM. A diminutive new species of cavedwelling Wolf Snake (Colubridae: Lycodon Boie, 1826) from Peninsular Malaysia. Zootaxa. 2014; 3815: Guo P, Liu Q, Zhang L, Li JX, Huang Y, Pyron RA. A taxonomic revision of the Asian keelback snakes, genus Amphiesma (Serpentes: Colubridae: Natricinae), with description of a new species. Zootaxa. 2014; 3873: Harvey PH, Pagel MD. The Comparative Method in Evolutionary Biology (Vol. 239). Oxford: Oxford University Press; Hedges SB, Marion AB, Lipp KM, Marin J, Vidal N. A taxonomic framework for typhlopid snakes from the Caribbean and other regions (Reptilia: Squamata). Carib. Herpetol. 2014; 49: Hedtke SM, Townsend TM, Hillis DM. Resolution of phylogenetic conflict in large data sets by increased taxon sampling. Syst. Biol. 2006; 55: Heise PJ, Maxson LR, Dowling HG, Hedges SB. Higher-level snake phylogeny inferred from mitochondrial DNA sequences of 12S rrna and 16S rrna genes. Mol. Biol. Evol. 1995; 12:
56 Herrmann HW, Branch WR. Fifty years of herpetological research in the Namib Desert and Namibia with an updated and annotated species checklist. J. Arid Environs. 2013; 93: Hsiang AY, Field DJ, Webster TH, Behlke AD, Davis MB, Racicot RA, et al. The origin of snakes: Revealing the ecology, behavior, and evolutionary history of early snakes using genomics, phenomics, and the fossil record. BMC Evol. Biol. 2015; 15: 87. Huelsenbeck JP, Rannala B. Phylogenetic methods come of age: testing hypotheses in an evolutionary context. Science. 1997; 276: Kearse M, Moir R, Wilson A, Stones-Havas S, Cheung M, Sturrock S, et al. Geneious Basic: an integrated and extendable desktop software platform for the organization and analysis of sequence data. Bioinformatics. 2012; 28: Kelly CMR, Barker NP, Villet MH. Phylogenetics of advanced snakes (Caenophidia) based on four mitochondrial genes. Syst. Biol. 2003; 52: Kelly CMR, Barker NP, Villet MH, Broadley DG, Branch WR. The snake family Psammophiidae (Reptilia: Serpentes): phylogenetics and species delimitation in the African sand snakes (Psammophis Boie, 1825) and allied genera. Mol. Phylogenet. Evol. 2008; 47: Kelly CMR, Barker NP, Villet MH, Broadley DG. Phylogeny, biogeography and classification of the snake superfamily Elapoidea: a rapid radiation in the late Eocene. Cladistics. 2009; 25: Kluge AG. Aspidites and the phylogeny of pythonine snakes. Rec. Aus. Mus. 1993; (Suppl. 19):
57 Kornilios P, Giokas S, Lymberakis P, Sindaco R. Phylogenetic position, origin and biogeography of Palearctic and Socotran blind-snakes (Serpentes: Typhlopidae). Mol. Phylogenet. Evo. 2013; 68: Lambert SM, Reeder TW, Wiens JJ. When do species-tree and concatenated estimates disagree? An empirical analysis with higher-level scincid lizard phylogeny. Mol. Phylogenet. Evol. 2015; 82: Lawson R, Slowinski JB, Burbrink FT. A molecular approach to discerning the phylogenetic placement of the enigmatic snake Xenophidion schaeferi among the Alethinophidia. J. Zool. 2004; 263: Lawson R, Slowinski JB, Crother BI, Burbrink FT. Phylogeny of the Colubroidea (Serpentes): new evidence from mitochondrial and nuclear genes. Mol. Phylogenet. Evol. 2005; 37: Lemmon EM, Lemmon AR. High-throughput genomic data in systematics and phylogenetics. Annu. Rev. Ecol. Evol. Syst. 2013; 44: Lemmon AR, Brown JM, Stanger-Hall K, Lemmon EM. The effect of ambiguous data on phylogenetic estimates obtained by maximum likelihood and Bayesian inference. Syst. Biol. 2009; 58: Lenk P, Joger U, Wink M. Phylogenetic relationships among European ratsnakes of the genus Elaphe Fitzinger based on mitochondrial DNA sequence comparisons. Amphibia-Reptilia. 2001; 22: Lenk P, Kalyabina S, Wink M, Joger U. Evolutionary relationships among the true vipers (Reptilia: Viperidae) inferred from mitochondrial DNA sequences. Mol. Phylogenet. Evol. 2001; 19:
58 Link HF. Beschreibung der Naturalien-Sammlung der Universität zu Rostock, Volume 2. Rostock: Adlers Erben; Malhotra A, Thorpe RS. A phylogeny of four mitochondrial gene regions suggests a revised taxonomy for Asian pitvipers (Trimeresurus and Ovophis). Mol. Phylogenet. Evol. 2004; 32: Malhotra A, Creer S, Pook CE, Thorpe RS. Inclusion of nuclear intron sequence data helps to identify the Asian sister group of New World pitvipers. Mol. Phylogenet. Evol. 2010; 54: McCormack JE, Harvey MG, Faircloth BC, Crawford NG, Glenn TC, Brumfield RT. A phylogeny of birds based on over 1,500 loci collected by target enrichment and highthroughput sequencing. PLoS One. 2013; 8: e McMahon MM, Sanderson MJ. Phylogenetic supermatrix analysis of GenBank sequences from 2228 papilionoid legumes. Syst. Biol. 2006; 55: McVay JD, Flores Villela O, Carstens B. Diversification of North American natricine snakes. Biol. J. Linn. Soc. 2015; 116: Miller MA, Pfeiffer W, Schwartz T. Creating the CIPRES Science Gateway for inference of large phylogenetic trees. In: Proceedings of the Gateway Computing Environments Workshop (GCE), 14 November 2010, New Orleans, LA; p Mullin SJ, Seigel RA. Snakes: Ecology and conservation. New York: Cornell University Press; Murphy JC, Sanders KL. First molecular evidence for the phylogenetic placement of the enigmatic snake genus Brachyorrhos (Serpentes: Caenophidia). Mol. Phylogenet. Evol. 2011; 61:
59 Nabhan AR, Sarkar IN. The impact of taxon sampling on phylogenetic inference: a review of two decades of controversy. Brief. Bioinformatics. 2011; 13: Nagy ZT, Joger U, Wink M, Glaw F, Vences M. Multiple colonization of Madagascar and Socotra by colubrid snakes: evidence from nuclear and mitochondrial gene phylogenies. Proc. R. Soc. Lond. B. 2003; 270: Nagy ZT, Lawson R, Joger U, Wink M. Molecular systematics of racers, whipsnakes and relatives (Reptilia: Colubridae) using mitochondrial and nuclear markers. J. Zool. Syst. Evol. Res. 2004; 42: Noonan BP, Chippindale PT. Dispersal and vicariance: the complex evolutionary history of boid snakes. Mol. Phylogenet. Evol. 2006; 40: Pagel M. Inferring the historical patterns of biological evolution. Nature. 1999; 401: Peng LF, Lu CH, Huang S, Guo P, Zhang YP. A new species of the genus Thermophis (Serpentes: Colubridae) from Shangri-La, Northern Yunnan, China, with a proposal for an eclectic rule for species delimitation. Asian Herpetol. Res. 2014; 5: Philippe H, Snell EA, Bapteste E, Lopez P, Holland PW, Casane D. Phylogenomics of eukaryotes: impact of missing data on large alignments. Mol. Biol. Evol. 2004; 21: Piwczyński M, Szpila K, Grzywacz A. Pape T. A large scale molecular phylogeny of flesh flies (Diptera: Sarcophagidae). Syst. Entomol. 2014; 39: Pyron RA, Burbrink FT. Extinction, ecological opportunity, and the origins of global snake diversity. Evolution. 2012; 66: Pyron RA, Wallach V. Systematics of the blindsnakes (Serpentes: Scolecophidia: Typhlopoidea) based on molecular and morphological evidence. Zootaxa. 2014; 3829:
60 Pyron RA, Wiens JJ. A large-scale phylogeny of Amphibia including over 2800 species, and a revised classification of extant frogs, salamanders, and caecilians. Mol. Phylogenet. Evol. 2011; 61: Pyron RA, Burbrink FT, Colli GR, de Oca ANM, Vitt LJ, Kuczynski CA, et al. The phylogeny of advanced snakes (Colubroidea), with discovery of a new subfamily and comparison of support methods for likelihood trees. Mol. Phylogenet. Evol. 2011; 58: Pyron RA, Burbrink FT, Wiens JJ. A phylogeny and revised classification of Squamata, including 4161 species of lizards and snakes. BMC Evol. Biol. 2013a; 13: 93. Pyron RA, Kandambi HD, Hendry CR, Pushpamal V, Burbrink FT, Somaweera R. Genus-level phylogeny of snakes reveals the origins of species richness in Sri Lanka. Mol. Phylogenet. Evol. 2013a; 66: Pyron RA, Reynolds RG, Burbrink FT. A taxonomic revision of Boas (Serpentes: Boidae). Zootaxa. 2014a; 3846: Pyron RA, Hendry CR, Chou VM, Lemmon EM, Lemmon AR, Burbrink FT. Effectiveness of phylogenomic data and coalescent species-tree methods for resolving difficult nodes in the phylogeny of advanced snakes (Serpentes: Caenophidia). Mol. Phylogenet. Evol. 2014b; 81: Rabosky DL, Santini F, Eastman J, Smith SA, Sidlauskas B, Chang J, et al. Rates of speciation and morphological evolution are correlated across the largest vertebrate radiation. Nat. Comm. 2013; 4: 1 8. Rawlings LH, Rabosky DN, Donnellan SC, Hutchinson MN. Python phylogenetics: inference from morphology and mitochondrial DNA. Biol. J. Linn. Soc. 2008; 93:
61 Reeder TW, Townsend TM, Mulcahy DG, Noonan BP, Wood PL Jr, Sites JW Jr, et al. Integrated analyses resolve conflicts over squamate reptile phylogeny and reveal unexpected placements for fossil taxa. PLoS One. 2015; 10: e Reynolds RG, Niemiller ML, Revell LJ. Toward a Tree-of-Life for the boas and pythons: Multilocus species-level phylogeny with unprecedented taxon sampling. Mol. Phylogenet. Evol. 2014; 71: Rieppel O. A review of the origin of snakes. Evol. Biol. 1988; 22: Roure B, Baurain D, Philippe H. Impact of missing data on phylogenies inferred from empirical phylogenomic datasets. Mol. Biol. Evol. 2013; 30: Sanders KL, Lee MSY, Leys R, Foster R, Scott Keogh J. Molecular phylogeny and divergence dates for Australasian elapids and sea snakes (Hydrophiinae): evidence from seven genes for rapid evolutionary radiations. J. Evol. Biol. 2008; 21: Sanders KL, Hamidy A, Head JJ, Gower DJ. Phylogeny and divergence times of filesnakes (Acrochordus): inferences from morphology, fossils and three molecular loci. Mol. Phylogenet. Evol. 2010; 56: Sanders KL, Lee MSY, Mumpuni Bertozzi T, Rasmussen AR. Multilocus phylogeny and recent rapid radiation of the viviparous sea snakes (Elapidae: Hydrophiinae). Mol. Phylogenet. Evol. 2013; 66: Sanderson M, Shaffer H. Troubleshooting molecular phylogenetic analyses. Ann. Rev. Ecol. Syst. 2002; 33: Sanderson MJ, McMahon MM, Steel M. Phylogenomics with incomplete taxon coverage: the limits to inference. BMC Evol. Biol. 2010; 10:
62 Savage JM, Oliver JA. Proposed addition to the "Official List of Generic Names in Zoology" of "Ahaetulla" Link, 1807, with "Ahaetulla mycterizans" Link, 1807, as the type species (Class Reptilia). Bull. Zool. Nomen. 1956; 12: Scanlon JD, Lee MSY. The major clades of living snakes: Morphological evolution, molecular phylogeny, and divergence dates. In: Aldridge RD, Sever DM, editors. Reproductive biology and phylogeny of snakes. Boca Raton: CRC Press; p Schätti B, Trape JF. Bamanophis, a new genus for the West African colubrid Periops dorri Lataste, 1888 (Reptilia: Squamata: Colubrinae). Rev. Suisse Zool. 2008; 115: Schulz KD. A monograph of the colubrid snakes of the genus Elaphe Fitzinger. Schulz, Königstein; Seigel RA, Collins JT. Snakes: Ecology and Behavior. New York: McGraw-Hill; Seigel RA, Collins JT, Novak SS. Snakes: Ecology and evolutionary biology. New York: Macmillan; Slowinski JB, Lawson R. Snake phylogeny: evidence from nuclear and mitochondrial genes. Mol. Phylogenet. Evol. 2002; 24: Šmίd J, Martίnez G, Gebhart J, Aznar J, Gállego J, Göçmen B, et al. Phylogeny of the genus Rhynchocalamus (Reptilia; Colubridae) with a first record from the Sultanate of Oman. Zootaxa. 2015; 4033: Socha JJ. Gliding flight in Chrysopelea: turning a snake into a wing. Integr. Comp. Biol. 2011; 51: Soltis DE, Mort ME, Latvis M, Mavrodiev EV, O Meara BC, Soltis PS, et al. Phylogenetic relationships and character evolution analysis of Saxifragales using a supermatrix approach. Am. J. Bot. 2013; 100:
63 Stamatakis A. RAxML Version 8: a tool for phylogenetic analysis and post-analysis of large phylogenies. Bioinformatics. 2014; 30: Stamatakis A. RAxML-VI-HPC: maximum likelihood-based phylogenetic analyses with thousands of taxa and mixed models. Bioinformatics. 2006; 22: Teynie A, David P, Lottier A, Le MD, Vidal N, Nguyen TQ. A new genus and species of xenodermatid snake (Squamata: Caenophidia: Xenodermatidae) from northern Lao People s Democratic Republic. Zootaxa. 2015; 3926: Thomson RC, Shaffer HB. Sparse supermatrices for phylogenetic inference, taxonomy, alignment, rogue taxa, and the phylogeny of living turtles. Syst. Biol. 2009; 59: Townsend TM, Larson A, Louis E, Macey JR. Molecular phylogenetics of Squamata: the position of snakes, amphisbaenians, and dibamids, and the root of the squamate tree. Syst. Biol. 2004; 53: Uetz P, Hošek J. The Reptile Database. Accessed October Underwood G. A contribution to the classification of snakes. London: Trustees of the British Museum (Natural History); Utiger U, Helfenberger N, Schätti B, Schmidt C, Ruf M, Ziswiler C. Molecular systematics and phylogeny of Old World and New World ratsnakes, Elaphe Auct., and related genera (Reptilia, Squamata, Colubridae). Russ. J. Herpetol. 2002; 9: Vidal N, Hedges SB. Higher-level relationships of snakes inferred from four nuclear and mitochondrial genes. C.R. Biologies 2002; 325: Vidal N, Hedges SB. Higher-level relationships of caenophidian snakes inferred from four nuclear and mitochondrial genes. C.R. Biologies 2002; 325:
64 Vidal N, Delmas AS, David P, Cruaud C, Couloux A, Hedges SB. The phylogeny and classification of caenophidian snakes inferred from seven nuclear protein-coding genes. C.R. Biologies 2007; 330: Vidal N, Branch WR, Pauwels OSG, Hedges SB, Broadley DG, Wink M, et al. Dissecting the major African snake radiation: a molecular phylogeny of the Lamprophiidae Fitzinger (Serpentes: Caenophidia). Zootaxa. 2008; 1945: Vidal N, Rage JC, Couloux A, Hedges SB. Snakes (Serpentes). In: Hedges SB, Kumar S, editors. The Timetree of Life. New York: Oxford University Press; p Vidal N, Dewynter M, Gower DJ. Dissecting the major American snake radiation: a molecular phylogeny of the Dipsadidae Bonaparte (Serpentes, Caenophidia). C.R. Biologies 2010a; 333: Vidal N, Marin J, Morini M, Donnellan S, Branch WR, Thomas R, et al. Blindsnake evolutionary tree reveals long history on Gondwana. Biol. Lett. 2010b; 6: Wallach V, Williams KL, Boundy J. Snakes of the world: A catalogue of living and extinct species. Florida: CRC Press, Taylor and Francis Group; Walls GL. The vertebrate eye and its adaptive radiation. Michigan: The Cranbrook Institute of Science, Bloomington Hills; Wang X, Messenger K, Zhao E, Zhu C. Reclassification of Oligodon ningshaanensis Yuan, 1983 (Ophidia: Colubridae) into a new genus, Stichophanes gen. nov. with description on its malacophagous behavior. Asian Herpetol. Res. 2014; 5: Weinstein SA, Warrell DA, White J, Keyler DE. Venomous bites from non-venomous snakes: A critical analysis of risk and management of colubrid snake bites. London: Elsevier;
65 Whelan S, Liò P, Goldman N. Molecular phylogenetics: state-of-the-art methods for looking into the past. Trends Genet. 2001; 17: Wiens JJ, Moen D.S. Missing data and the accuracy of Bayesian phylogenetics. J. Syst. Evol. 2008; 46: Wiens JJ, Morrill MC. Missing data in phylogenetic analysis: reconciling results from simulations and empirical data. Syst. Biol. 2011; 60: Wiens JJ, Tiu J. Highly incomplete taxa can rescue phylogenetic analyses from the negative impacts of limited taxon sampling. PLoS One. 2012; 7: e Wiens JJ, Kuczynski CA, Smith SA, Mulcahy DG, Sites JW, Townsend TM, et al. Branch lengths, support, and congruence: testing the phylogenomic approach with 20 nuclear loci in snakes. Syst. Biol. 2008; 57: Wiens JJ, Hutter CR, Mulcahy DG, Noonan BP, Townsend TM, Sites JW, et al. Resolving the phylogeny of lizards and snakes (Squamata) with extensive sampling of genes and species. Biol. Lett. 2012; 8: Wilkinson M. Majority-rule reduced consensus trees and their use in bootstrapping. Mol. Biol. Evol. 1996; 13: You CW, Poyarkov NA, Lin SM. Diversity of the snail eating snakes Pareas (Serpentes: Pareatidae) from Taiwan. Zool. Scr. 2015; 44: Zaher H, Grazziotin FG, Cadle JE, Murphy RW, Moura-Leite JC, Bonatto SL. Molecular phylogeny of advanced snakes (Serpentes, Caenophidia) with an emphasis on South America xenodontines: a revised classification and descriptions of new taxa. Pap. Av. Zool. 2009; 49:
66 Zhang B, Huang S. Relationship of Old World Pseudoxenodon and New World Dipsadinae, with comments on underestimation of species diversity of Chinese Pseudoxenodon. Asian Herpetol. Res. 2013; 4: Zheng Y, Wiens JJ. Combining phylogenomic and supermatrix approaches, and a timecalibrated phylogeny for squamate reptiles (lizards and snakes) based on 52 genes and 4162 species. Mol. Phylogenet. Evol. 2016; 94:
67 Supporting Information Table S1.1. List of GenBank accession numbers for 7 outgroup taxa and 1615 snake species. Two sequences were deleted during preliminary tree searches and 21 were identified as rogue taxa and pruned from the dataset leaving 1592 snake species from GenBank in the tree. Names represent species names as listed on The Reptile Database ( as of October Refer to S1.4 Table for list of rogue taxa. Taxa deleted during preliminary tree searches are highlighted in red, rogue taxa are highlighted in yellow, and sequences that were deleted because they were identical to other sequences are highlighted in green. Table S1.2. List of taxa, institutional voucher numbers, and GenBank accession numbers for tissue samples extracted and sequenced in this study. Tissue samples for Boiga siamensis FMNH267726, Chrysopelea ornata LSUHC7158, and Psammodynastes pictus FMNH were represented by clear chromatograms, but placed poorly in preliminary phylogenetic trees, so they were not included in the final data matrix. Therefore, we did not deposit these taxa in GenBank. Tropidolaemus subannulatus KU was identified as a rogue taxon by RogueNaRok and was pruned from the dataset and thus, is not represented in the phylogeny. Table S1.3. Six loci, gene type, gene length, primer name, PCR annealing temperature and primer source. 59
68 Table S1.4. Rogue taxa as identified by RogueNaRok Web-Server ( Each taxon is associated with a raw improvement score (R.I.S.), which represents the fraction of improvement in bootstrap support values throughout the tree when the selected taxon is pruned and all rogue taxa above it are also pruned. We performed one run and chose to sacrifice relatively lower node support values to maximize the number of taxa represented in the phylogeny. Thus we elected to only prune taxa with R.I.S. greater than 0.8, resulting in a total of 22 pruned taxa (highlighted in bold). Figure S1.1. Abridged phylogeny displaying higher-level relationships with all rogue taxa and incertae sedis species eliminated. Maximum-likelihood phylogenetic estimate based on 10 concatenated genes. Tips represent families and sub-families. Commonly recognized higherlevel clades are labeled in all caps and bold. Node values represent SHL support values. Skeleton of the species tree is displayed on the left, colored and labeled as they appear in Fig File S1.1. Newick format maximum-likelihood phylogeny for 1745 taxa representing 1652 snake species and 7 outgroup taxa displayed in Fig
69 Chapter 2. Patterns of Lineage Diversification in Snakes: Testing Venom-Delivery as a Key Innovation Abstract Snakes represent an impressive evolutionary radiation of over 3,500 widely-distributed species encompassing a diverse range of morphologies and ecologies. This diversity is likely attributable to their distinctive morphology, which has allowed them to populate a wide range of habitat types. Species richness among snake families also varies considerably, from monotypic families such as Xenotyphlopidae and Aniliidae, to Dipsadinae which comprises 754 species. We used 14 fossil calibrations to date a recently published snake phylogeny comprising 1625 snake species delineating every extant family and subfamily to investigate snake macroevolutionary speciation dynamics. We also test if the clades Alethinophidia, Caenophidia, Viperidae, Lamprophiidae, Elapidae, Colubridae, Natricinae, Dipsadinae, and Colubrinae are characterized by increased speciation rates and if the evolution of venom-delivery in Colubroidea and frontfanged venom-delivery in Viperidae and Elapidae are distinguished by shifts in diversification rate. Our dates indicate snakes split from lizards approximately mya with extant snakes originating 113 mya. Divergence between the two infraorders, Scolecophidia and Alethinophidia, occurred mya, and the most diverse clade of snakes, the Caenophidia, arose mya. Snake diversification carries the signature of ecological opportunity, with speciation rates declining over time. However, a small spike in speciation rates appears roughly 61
70 100 mya corresponding to the origin of Alethinophidia, and a more considerable increase accompanies the rise of Caenophidia. Heterogeneity in snake diversification rates is largely shaped by two slowdowns and five increases and is strongly supported by greater than 95% cumulative probability. Deceleration in speciation rates occurred within Scolecophidia and Henophidia; whereas the five gains developed over a relatively short period of time within clades of Caenophidia. The most notable of these increases happened within Viperidae and Elapidae, which both independently evolved extremely developed front-fanged venom-delivery systems and which accumulated 331 and 358 species, respectively. However, STRAPP analysis demonstrated that venom-delivery is not associated with increased diversification in these clades. 62
71 Introduction Species richness is a testament to evolution's capacity to generate biodiversity. However, species diversity is unequally distributed and varies by orders of magnitude at all phylogenetic levels (Hutchinson, 1959; Hunt et al., 2007; Butlin et al., 2009). Disparity in species richness is most commonly attributed to differences in net diversification rates (i.e., differences in speciation and extinction rates) among clades (Kirkpatrick and Slatkin 1993; Mooers and Heard, 1997; Barraclough and Nee 2001) and is expected to leave a signature on phylogenetic trees (Ree, 2005). Where rate differences are large, this is manifest as shifts in diversification rates (Simpson, 1944; Sanderson and Donoghue, 1996). Researchers often aim to correlate these rate shifts with certain species traits (Slowinski and Guyer, 1993; Barraclough et al., 1998) or aspects of the environment (Davies et al., 2004; Weir and Schluter, 2007; Day et al., 2008) that may favor diversification (Heard and Hauser, 1995; Ree, 2005). Extinction is likely the main cause of depauperate lineages (Pyron and Burbrink, 2012), but ecological opportunity associated with the appearance of key innovations, transitions to new environments, or ecological release can also cause imbalance in species richness (Simpson 1953; Heard and Hauser, 1995; Donoghue, 2005; Yoder et al. 2010), although the tempo of diversification ultimately slows as ecomorphological niches fill (Nee et al., 1992; Schluter, 2000; Gavrilets and Losos 2009). Key innovations play a crucial role in diversification because they contribute to ecological divergence by way of morphological and ecological specialization, leading to increases in diversification rates (Mitter et al., 1988; Heard and Hauser, 1995; Hodges and Arnold, 2005). As such, the appearance and influence of key innovations constitutes one of several evolutionary process that ultimately shape phylogenetic trees (Rabosky, 2014). 63
72 Phylogenetic evidence for an association between key innovations and increased diversification generally comes from comparisons of clade size (Heard and Hauser, 1995; Ree, 2005) or from state-dependent analyses (Maddison et al., 2007; Rabosky and Huang, 2015), but state-dependent analyses generally do not account for unmeasured traits that may act in conjunction with focal traits or may even explain more of the variation in rate shifts (Beaulieu and O'Meara, 2015). While key innovations have received a great deal of attention within the context of adaptive radiations (Yoder et al., 2010; Losos, 2010; Givnish, 2015), relatively few studies have examined how the evolution of such traits might affect diversity at the family- or genus-level. To accurately identify the lineages responsible for diversification rate shifts, it is important to have a well-resolved tree with fine phylogenetic resolution because rate shifts may be induced by multiple subclades as opposed to the clade as a whole (Alfaro et al., 2013). Here, we use the species-level phylogeny of Chapter 1 comprising 1652 species to investigate how diversification rate heterogeneity shapes overall patterns of snake diversity, and to identify rate shifts. Snakes constitute an evolutionary radiation of over 3,500 extant species within Squamata (Uetz& Hošek, 2015), encompassing a diverse range of morphologies and habits (Gans, 1961; Greene, 1997). Two major features stand out as hallmarks of snake diversity making them an ideal model system for testing hypotheses regarding diversification and ecological opportunity: 1) species richness is extremely imbalanced from the genus-level upwards (see Chapter 1) and 2) the majority of snake diversity is concentrated in Alethinophidia, specifically within the superfamily Caenophidia and the family Colubridae. Snakes are divided into two infraorders; the basal Scolecophidia ( blindsnakes and threadsnakes ) and the Alethinophidia ( typical snakes ). Scolecophidia accounts for only 417 snake species (11.7% of known snake diversity), of which all members are small, fossorial, possess short tails and 64
73 reduced eyes, have a small gape size, and feed frequently on ants and termites. Alethinophidia, on the other hand, hosts the remaining diversity of snakes, spanning all extremes of morphologies, habitats, diet, and habits. Species diversity within Alethinophidia is extremely disproportionate, with most species (ca. > 2900; > 82%) appointed to Caenophidia ('advanced snakes') disseminated across eight families. Yet, nearly all of the species diversity is contained within the following four families: 1) Viperidae; 2) Lamprophiidae; 3) Elapidae; and 4) Colubridae. Of these, Colubridae has by far the most species (> 1800) currently spread throughout eight subfamilies, accounting for 62% of the species in Caenophidia. More specifically, 1650 of these species reside within Natricinae, Dipsadinae, and Colubrinae. Reasons for this massive inequality in species richness remains unknown, but has been suggested to be related to the evolution of venom-delivery, with the presence of supralabial secretory serous cells early in the superfamily Colubroidea (Vidal, 2002; Jackson, 2003), which is a clade within Caenophidia composed of all the families except for Acrochordidae. To date, the only other study examining clade-wide diversification rates in snakes is based on sampling performed at the genus-level (Pyron and Burbrink, 2012). This study showed a shift at the most recent common ancestor of Viperidae, Homalopsidae, Colubridae, Elapidae, and Lamprophiidae, and proposed that the key innovation of venom delivery systems along with the colonization of new areas, particularly of the New World, provided ecological opportunity that helped spur the increase in diversification rates in Colubroidea (Caenophidia minus Acrochordidae). However, the location of this shift does not provide evidence for venom as a key innovation, and since not all members of Colubroidea are venomous (Jackson, 2003), an increase in diversification rates should therefore be seen either at the base of Colubroidea or in clades with high species richness whose members are all venomous. Additional examinations 65
74 into snake diversification rates focused on smaller, individual clades such as crotalids, lampropeltines, thamnophiines (Burbrink and Pyron, 2010; Burbrink et al., 2012a; McVay et al., 2015), alsophiines (Burbrink et al., 2012b), elapids (Lee et al., 2016), 2010), the sea snake genus Hydrophis (Lukoschek and Keogh, 2006; Sanders et al., 2010), rattlesnakes (Blair and Sánchez- Ramírez, 2016), and viperids (Lynch, 2009), but lacked the comparative, macroevolutionary approach required to detect higher-level shifts in diversification rates (Rabosky, 2014). In this paper, we consider how and why species-richness in snakes is imbalanced by first timecalibrating the phylogeny of Chapter 1 and estimating divergence times. We then test the following three hypotheses: 1) Speciation rates increase in Alethinophidia, Caenophidia, Viperidae, Lamprophiidae, Elapidae, Colubridae, Natricinae, Dipsadinae, and Colubrinae; 2) Diversification shift occurs at the base of Colubroidea in association with the evolution of venom; 3) Diversification shifts are associated with the independent evolution of specialized front-fanged venom-delivery systems in Viperidae and Elapidae, and their resultant high species richness. Materials and Methods Phylogeny and Divergence Time Estimation The phylogeny of Chapter 1 is the largest-yet estimate of the snake tree of life and used a maximum likelihood approach on a supermatrix of 1745 taxa (1652 snake species + 7 outgroup taxa) and 9,523 base pairs, representing all recognized families and subfamilies. Owing to the size of their dataset, we used treepl to date the tree (Smith and O'Meara, 2012), which 66
75 implements the penalized likelihood optimality criterion to penalize rate differences across the tree by allowing for different rates on different branches (Sanderson, 2002). This program combines the standard derivative-based greedy hill-climbing optimization with a stochastic partial simulated annealing algorithm to overcome optimization challenges of local minima in estimating divergence times in large phylogenetic trees (Smith and O'Meara, 2012). In total, we constrained the ages of 14 nodes using minimum and maximum ages from fossil specimens as constraints (Table S2.1). Selection of fossil calibration points for snakes has a controversial history based on taxonomic uncertainty, making dates from some previous studies unreliable (for details see Sanders et al., 2010; Head, 2015). Since tree shape is fashioned by how node ages are distributed over time, leading to asymmetry among lineages across the entire tree, increased taxon sampling is considered to improve the accuracy of divergence estimates by minimizing overrepresentation of older nodes in rate variation (Nee et al., 1994; Heath et al., 2008). We ran treepl using a two-step process. First, we ran a random subsample and replicate cross-validation (RSRCV) analysis from to 100,000, increasing in increments of 0.1, to determine the optimal smoothing value. We selected the optimal smoothing value with the lowest Chi-square value (0.1) used during the penalty procedure process of penalized likelihood. RSRCV randomly samples with replacement multiple terminals and is much faster and produces similar results to standard cross-validation where each terminal taxon is iteratively removed (Smith and O Meara, 2012). Second, we ran a thorough analysis under the additive penalty function (untransformed rates), applicable when root nodes are calibrated (Sanderson, 2002), set with the following parameters: gradient-based, auto-differentiation based, and auto-differentiation cross-validationbased optimizers were all set to 1; penalized likelihood replicates = 200,000; cross validation simulated annealing iterations = 50,000. Prior to comparative analyses we removed outgroup 67
76 taxa and pruned the following incertae sedis taxa and species responsible for paraphyly: Aspidelaps lubricus, Atractaspis irregularis, Atropoides picadoi, Apostolepis sanctaeritae, Bothrocophias campbelli, Bothrops lojanus, Bothrops isabelae, Buhoma depressiceps, Buhoma procterae, Cerrophidion wilsoni, Conophis lineatus, Conophis vittatus, Conopsis biserialis, Conopsis nasus, Geophis godmani, Morelia viridis, Micrelaps bicoloratus, Oxyrhopus fitzingerilsumns6586, Oxyrhabdium leporinum, Philodryas chamissonis, Philodryas trilineata, Ptyas korros, Pseudonaja guttata, Salvadora hexalepis, Sibon noalamina, Simalia oenpelliensis, Tantilla melanocephala. Lineage Diversification We tested heterogeneity in species richness by modelling macroevolutionary dynamics of diversification using Bayesian analysis of macroevolutionary mixtures (BAMM; Rabosky et al., 2013; Rabosky, 2014; Rabosky et al., 2014a). BAMM uses reversible-jump Metropolis-coupled Markov Chain Monte Carlo (MC3) to detect and quantify heterogeneity in evolutionary rates and to detect subclades sharing a common macroevolutionary rate dynamic by mapping distinct sets of rate shifts and identifying their location on the tree. Importantly, BAMM does not identify a single set of independent rate shifts within a given dataset, but instead classifies configurations of rate shifts (i.e., sets of shifts that are sample together; Rabosky et al., 2014a). We applied BAMM to the time-calibrated tree running MC3 for 10 million generations and sampling from the posterior distribution every 1000 generations. The first 10% of samples we discarded as burn-in, then we checked for convergence of parameter estimates (i.e., log-likelihoods, numbers of processes, and evolutionary rate parameters) by evaluating means of effective sample sizes 68
77 using the R package CODA (Plummer et al., 2006). We summarized and visualized the tree with mapped macroevolutionary rate parameters using the R package BAMMtools (Rabosky et al., 2014b). Since all our shift configurations had low probabilities, we were unable to extract the single shift configuration with the highest posterior probability. Instead, we used the maximum shift credibility to extract the shift configuration that maximizes the marginal probability of rate shifts along individual branches (Rabosky, 2014). For comparison, we also calculated modelaveraged diversification rates and shifts. For clades experiencing shifts in diversification patterns, we estimated rate-through-time curves from the joint posterior density of parameters. We also calculated the 95% cumulative shift probability that a diversification shift occurred on each branch. Finally, we identified different macroevolutionary cohort regimes (i.e., shared, potentially dynamic diversification process shared by all lineages downstream from the location of a rate shift; Shi and Rabosky, 2015). For these analyses, we incorporated incomplete taxon sampling (Shi and Rabosky, 2015) at the genus level (Table 2.1). There is a total of 515 snake genera (Uetz& Hošek, 2015), of these, we sampled 402 genera, leaving 113 not sampled, and accounted for 46.33% of the total extant snake diversity (Table S2.2). Table 2.1. Number of taxa sampled per family or subfamily. Families are listed in order according to Figure 2.1. For the taxonomy of families and subfamilies, we use Adalsteinsson et al., (2009) for Anomalepididae and Leptotyphlopidae, Pyron and Wallach (2014) for Gerrhopilidae, Typhlopidae, and Xenotyphlopidae, Pyron et al. (2014b) for Booidea, and Pyron et al. (2013a) for Alethinophidia. The number of species per clade was taken from The Reptile Database ( on 10/01/2015. Percentages of the number of species sampled do not include taxa not assigned to species status. Paraphyletic taxa are included under their traditional family and/or subfamily. In the Total cell for total number of species, the number not in parentheses equals the sum of the values in the table and the number in the parentheses equals the number returned when a search for Serpentes is conducted in The Reptile Database. Percentage for total number of species sampled is based on 3566 species. Total sampled snake diversity is 46.33%. For those clades represented by one species, we used the date of their divergence from their sister clade. Dates for the following papers represent divergence dates from sister clade, not age of clade: Burbrink and Pyron (2008), Vidal et al. (2009); Scanlon and 69
78 Lee (2011), and; Pyron and Burbrink (2012). Pan-Serpentes (total-group) = fossil stem snakes + crown snakes. Serpentes (crown-group) = extant snakes + extinct taxa. Taxon Species Richness Burbrink & Pyron, 2008 Vidal et al., 2009 Clade Age (millions of years) Scanlon Pyron & & Lee, Burbrink, Zheng & Wiens, 2015 This Study Pan-Serpentes (Total) -- N/A * N/A Serpentes (Crown) Scolecophidia Anomalepididae 18 (11%) N/A N/A Leptotyphlopidae Epictinae 64 (23%) N/A N/A N/A N/A Leptotyphlopinae 50 (36%) N/A N/A N/A N/A Gerrhopilidae 18 (11%) N/A N/A N/A Xenotyphlopidae 1 (100%) N/A N/A N/A Typhlopidae Typhlopinae 64 (52%) N/A N/A N/A N/A Afrotyphlopinae 61 (26%) N/A N/A N/A N/A Madatyphlopinae 13 (15%) N/A N/A N/A N/A Asiatyphlopinae 124 (33%) N/A N/A N/A N/A Alethinophidia Aniliidae 1 (100%) Tropidophiidae 34 (29%) Calabariidae 1 (100%) 50.2 N/A Candoiidae 5 (60%) N/A N/A N/A Sanziniidae 4 (75%) N/A N/A N/A N/A Charinidae -- N/A N/A N/A Charininae 4 (75%) N/A N/A N/A Ungaliophiinae 3 (100%) 44.5 N/A N/A Erycidae 12 (75%) N/A N/A Boidae 30 (80%) Cylindrophiidae 13 (15%) 41.0 N/A Anomochilidae 3 (33%) N/A N/A Uropeltidae 54 (28%) Xenopeltidae 2 (50%) Loxocemidae 1 (100%) Pythonidae 40 (80%) Bolyeridae 2 (50%) N/A Xenophidiidae 2 (50%) N/A N/A Caenophidia -- N/A N/A Acrochordidae 3 (100%) N/A Colubroidea -- N/A Xenodermatidae 18 (22%) N/A Pareatidae 20 (80%) N/A Viperidae N/A Viperinae 98 (67%) N/A N/A N/A
79 Table 2.1 Continued. Azemiopinae 2 (50%) N/A N/A N/A Crotalinae 231 (82%) N/A N/A N/A Homalopsidae 53 (47%) N/A Lamprophiidae -- N/A 41.5 N/A N/A Psammophiinae 52 (77%) 27.4 N/A N/A Prosymninae 16 (31%) N/A N/A N/A Pseudaspidinae 2 (100%) 27.4 N/A N/A Atractaspidinae 23 (30%) 32.8 N/A N/A Aparallactinae 47 (23%) N/A N/A N/A Lamprophiinae 72 (43%) N/A N/A N/A Pseudoxyrhophiinae 89 (64%) 30.3 N/A N/A Elapidae 358 (54%) N/A Colubridae -- N/A N/A N/A Sibynophiinae 11 (55%) N/A N/A N/A N/A Natricinae 226 (47%) N/A 39.8 N/A Pseudoxenodontinae 11 (36%) N/A N/A Dipsadinae 754 (32%) N/A Grayiinae 4 (75%) N/A N/A N/A Calamariinae 87 (5%) 34.6 N/A N/A Ahaetullinae 56 (48%) N/A N/A N/A N/A Colubrinae 670 (47%) N/A *The authors report the date of the Anguimorpha - Pan-Serpentes divergence at 162 in their figure 3.2 and as 172 in the text. In this table we record the date provided in the figure. Recently, several papers have demonstrated that state-dependent diversification analyses suffer from high Type I errors (FitzJohn, 2012; Machac, 2014; Rabosky and Goldberg, 2015) partially due to phylogenetic pseudoreplication (Maddison and FitzJohn, 2014) and additional unknown factors (Rabosky and Goldberg, 2015). Based on these and additional criticisms, Rabosky and Huang (2015) declare that "it seems likely that many trait-dependent diversification relationships reported in the literature are not real". At the forefront of these analyses is BiSSE, which does not test if independent shifts in character state correlate with shifts in diversification (Maddison and FitzJohn, 2014) and assumes all variation in diversification rates can be explained by the proposed two character states (Maddison et al., 2007). Two recently introduced methods, the hidden state speciation and extinction model (HiSSE; Beaulieu and O'Meara, 2015) and structured rate permutations on phylogenies (STRAPP; Rabosky and Huang, 2015), attempt 71
80 to alleviate this issue. HiSSE accounts for variation in diversification rates which may be attributable to a non-specified, unobserved discrete ("hidden state") trait, which may display diversification dynamics and transition rates distinct from the focal trait. However, HiSSE also does not account for phylogenetic pseudoreplication (Rabosky and Huang, 2015). STRAPP, on the other hand, tests association between trait and diversification rates against a null distribution generated by taxon-block permutations that randomly reshuffles diversification rates throughout the tree preserving the covariances in rate regimes among taxa, making it robust to phylogenetic pseudoreplication (Rabosky and Huang, 2015). The main advantages of STRAPP is that it unambiguously accounts for the number of independent diversification rate shifts in the phylogeny and does not require that variation in diversification rates be explained by specified character states. Therefore, to test if venom-delivery or goo-eating is associated with shifts in diversification rates, we used STRAPP, as implemented in BAMMtools, to test the correlation between the trait and the BAMM estimated diversification rates. We ran permutations and used the Mann-Whitney U-test statistic to check for significance between diversification rates and created to files with binary traits coded as front-fanged venom-delivery (non-venomous or venomous). Results Time-calibrated phylogeny A summary of the time-calibrated tree is presented in Fig. 2.1 and the full time-calibrated tree is available in Newick format in File S2.1. Inferring the date of origin for any given clade 72
81 requires the ancestral node having at least two descendant species; if not, then only the date of divergence from the most recent common ancestor (MRCA) with the sister clade is provided. Estimated dates for the major snake clades vary considerably among studies (Table 2.1; see Hsiang et al., 2015 for approximate dates) and from studies providing divergence estimates for smaller clades: blindsnakes (Vidal et al., 2010); Henophidia (Noonan and Chippindale, 2006; Sanders et al., 2010); elapids (Sanders et al., 2008; Sanders et al., 2013a); and Natricinae (McVay et al., 2015). However, dates for Viperidae were similar to those reported in a previous study (Wüster et al., 2008). These discrepancies are likely due to differences in fossil calibrations chosen and divergence estimate methods. Similar to other studies using treepl, some of our calibrated nodes remained stuck on the minimum or maximum calibration date (Shi& Rabosky, 2015), probably due to very short internal branches leading to little correspondence between the model of autocorrelated rates and the rates in the tree (S. Smith personal communication). Zheng and Wiens (2015) also used treepl, but they estimated divergence dates for all of Squamata, and only specified one calibration point (at the root) for snakes. Based on our estimates, snakes split from Anguimorpha + Iguania approximately million years ago (mya). Extant snakes originated about 113 mya with the divergence between the two Infraorders, Scolecophidia and Alethinophidia, occurring mya. By 25 mya all the currently recognized families and subfamilies have evolved. Acrochordidae contains the youngest genera originating 25 mya and Macrovipera is the youngest genus appearing at 9.29 mya (Table S2.2). Divergence among the major clades within Scolecophidia and Henophidia proceeded slowly. The quickest splits within these clades were between Leptotyphlopidae and Typhlopidae, and between Xenopeltidae, Loxocemidae, and Pythonidae. On the other hand, all the families within Caenophidia, except for Acrochordidae, Viperidae, and Elapidae, evolved 73


82 Figure 2.1. Time-calibrated tree of 1625 snake species. Representative clades are labeled for reference. Axis is in millions of years and shows the geologic time scale. The first three epochs beginning from the present are not labeled and represent the Holocene, Pleistocene, and Pliocene. immediately after Caenophidia (ca. within 10 my) split from Bolyeridae + Xenophidiidae (ca mya), suggesting rapid radiation within this clade (Fig. 2.1; Table 2.1). Viperidae and Elapidae are also suggestive of explosive species diversification as they are relatively young clades that radiated into a large number of species. Within the families of Lamprophiidae and Colubridae, the subfamilies also diverged rapidly (Fig. 2.1), some at (e.g. Dipsadinae and Colubrinae at mya) or about the same time (e.g., Sibynophiinae at mya and 74
83 Pseudoxenodontinae at mya), likely leading to the difficulties in resolving relationships within those families (Pyron et al., 2014a; see Chapter 1). Lineage Diversification All BAMM parameters had effective sample sizes > 200. Snakes diversified with a mean background speciation rate of and a mean extinction rate of (Fig. 2.2). Diversification rates in snakes carry the signature of ecological opportunity, starting out high when they split off from lizards and declining towards the present. However, this decline is punctuated by a small increase in speciation rate approximately 100 mya identifying the origin of Alethinophidia and higher level divisions within Henophidia, and by a larger spike at 70 mya, marking the origin of Caenophidia and rapid evolution of all its families and subfamilies (Fig. 2.2). We also find elevated speciation rates in Viperidae, Lamprophiidae, Elapidae, Colubridae, Natricinae, Dipsadinae, and Colubrinae (Fig. 2.3; Fig. 2.4). All these clades are characterized by decreasing rates over their history, with rates in Natricinae falling below the background speciation rate, except in Lamprophiidae, which shows a spike in diversification rates just below 40 mya that remains elevated towards the present, and in Elapidae which experiences an increase later in its history delineated by the exceptional speciation rate in the young, derived Hydrophis clade (Fig. 2.4E). BAMM identified 7 diversification shifts distributed throughout the entire phylogeny under the maximum shift credibility, beginning with a slowdown in the branch leading to the 'core' Scolecophidia, which excludes Anomalepididae, and a slowdown in Henophidia that includes the clades Booidea, Uropeltoidea, and Pythonoidea (Fig. 2.4; Fig. 2.5). Speciation rates 75
84 Figure 2.2. Speciation (red) and extinction (blue) rates with credibility intervals for snakes over time. Mean speciation background rate is and mean extinction background rate is in these two clades always remain below the background speciation rate, likely because of the elevated speciation rate of Caenophidia. The remaining 5 shifts all occurred within Caenophidia and represent increases in diversification rates (Fig. 2.4): 1) Viperidae (ca. 331 species; Table 2.1); 2) Elapidae (ca. 358 species; Table 2.1), including Buhoma depressiceps; 3) Hydrophis, excluding H. gracilis, H. jerdonii, and H. spiralis (ca. 43 species; Table S2.2) - our results do not place the diversification shift at the base of Hydrophis, as in Sanders et al. (2010), but instead excludes H. gracilis, H. jerdonii, and H. spiralis, which was not included in their analysis and placed outside of the focal Hydrophis clade (see Chapter 1); 4) the Neotropical "goo-eating" clade within Dipsadinae that includes the genera Geophis, Atractus, Sibon, Tropidodipsas, Dipsas, Sibynomorphus, Ninia atrata (ca. 266 species; Table S2.2), and Thamnodynastes pallidus, which may not belong to this clade (see Chapter 1), and; 5) a clade of Old World racers 76
85 within Colubrinae that include the genera Dolichophis, Hierophis, Orientocoluber, and Eirenis (ca. 27 species; Table S2.2). The set of distinct shift configurations that account for 95% of probability of the data, and which was used to compute the maximum shift credibility and mean phylorate plots, is shown in Fig. S2.1. Each of these clades evolved a large number of species in a relatively short period of time (Fig. 2.1; Fig. 2.4), and their shift in increased diversification rates is strongly supported by cumulative shift probability analysis (Fig. 2.6). Each of these clades also experience decreasing speciation towards the present except for Elapidae and the "goo-eaters"(fig. 2.4D & Fig. 2.4F). Macroevolutionary cohort analysis indicates strong heterogeneity in diversification rates with speciation rates in each of the delineated clades with shifts being decoupled from other clades in the tree (Fig. 2.7). The mean phylorate plot was highly congruent with the maximum shift credibility plot, but identified four additional diversification shifts with a slight increase in diversification rates for Erycidae + Boidae, larger increases in diversification rates in Trachischium monticola + Hebius within Natricinae, in Erythrolamprus within Colubrinae and in the same clade of Old World racers as above, but also including the genera Hemorrhois, Spalerosophis, and Platyceps, and a slight shift in one of the basal clades within Psammophiinae (Fig. 2.5B). In testing for state-dependent diversification, the STRAPP analysis found no support for front-fanged venom-delivery increasing rates of diversification in Viperidae and Elapidae (P = 0.245). 77
86 Figure 2.3. Rate-variation-through-time plots showing increased diversification rates for various snake lineages. The red line signifies speciation rate for each clade and the black line shows the speciation rate for all snakes. Shading intensity for speciation rate represents 90% Bayesian credible interval on the distribution of rates through time. A) Alethinophidia. B) Caenophidia. C) Lamprophiidae. D) Colubridae. E) Natricinae. F) Dipsadinae. G) Colubrinae. 78
87 Figure 2.4. Rate-variation-through-time plots for each of the 7 clades from Fig. 2.3 that experienced shifts in diversification rates. The red line signifies speciation rate for each clade and the black line shows the speciation rate for all snakes. Shading intensity for speciation rate represents 90% Bayesian credible interval on the distribution of rates through time. A) Scolecophidia, with the exception of Anomalepididae. B) Henophidia, with the exception of Aniliidae + Tropidophiidae and Bolyeridae + Xenophidiidae. C) Viperidae. D) Elapidae, including Buhoma depressiceps. D) Hydrophis, excluding H. gracilis, H. jerdonii, and H. spiralis. F) The "goo-eating" dipsads, Geophis, Atractus, Sibon, Tropidodipsas, Dipsas, Sibynomorphus, Ninia atrata, and Thamnodynastes pallidus. G) The Old World racers, Dolichophis, Hierophis, Orientocoluber, and Eirenis within Colubrinae. Graphs A and B represent decreases in speciation rate and C-G represent increases in speciation rate. 79
88 Discussion Shifts in diversification rates amongst clades can lead to unbalanced patterns of species richness across phylogenetic trees, but the drivers of rate shifts are not always readily apparent. Using a species-level phylogeny comprising all known snake families and subfamilies, we estimated divergence times, calculated diversification rates, identified rate shifts, and tested hypotheses regarding differences in speciation rates and whether shifts in diversification rates are associated with key innovations in the form of the evolution of venom in Colubroidea and in front-fanged venom delivery systems in Viperidae and Elapidae. Although much discrepancy surrounds the age of the major snake clades (Table 2.1), snakes most likely arose during the Early Cretaceous, no later than 172 mya (Scanlon and Lee, 2011). Most estimates place the date of origin for Pan-Serpentes between mya and between mya for Serpentes (Wiens et al., 2006; Burbrink and Pyron, 2008; Scanlon and Lee, 2011; Pyron and Burbrink, 2012; Hsiang et al., 2015; Zheng and Wiens, 2015). The principal divisions in the major clades of snakes, and within clades of Scolecophidia and Henophidia took place late in the Late Cretaceous, but most snake genera and species arose within the Cenozoic (Fig. 2.1). Anomalepididae is the basalmost clade of snakes (see Chapter 1) and appeared shortly after the origin of Serpentes. The core Scolecophidia clade and Alethinophidia split from one another quickly thereafter, mya, with the core Scolecophidia clade originating mya. Alethinophidia, however, did not appear until mya, and immediately following, rapid divergence of the major Henophidia clades ensued (Scanlon and Lee, 2011; Hsiang et al., 2015). These time periods corresponding with the Cretaceous Terrestrial Revolution when multiple higher-level taxa experienced rapid speciation (Lloyd et al., 2008). Caenophidia also was 80
89 subjected to accelerated, but more pronounced, splitting into its major lineages after its origin 70 mya, as also previously suggested (Greene, 1997). Shortly thereafter, several caenophidian clades, specifically within Lamprophiidae and Colubridae, rapidly diversified (Fig. 2.3; Fig. 2.4) coinciding with the Cretaceous-Paleogene mass extinction, resulting in the loss of over 75% in biodiversity, including large-bodied squamates, but triggered diversification in small-bodied squamates (Longrich et al., 2012). However, many caenophidian genera and species originate in the Eocene when the Earth undergoes global warming, and after the recovery and radiation of mammals (Longrich et al., 2012), a major prey source. The increased basal diversification of Alethinophidia and Caenophidia, as evidenced by their short internal branches (Fig. 2.1), may explain high levels of homoplasy in molecular characters (Kelly et al., 2003) and why there is difficulty in resolving some problematic nodes, specifically for Boidae (Pyron et al., 2014b; Reynolds et al., 2014; Scanlon and Lee, 2011) and major lineages within Caenophidia (Kelly et al., 2009; Pyron et al., 2014a; see Chapter 1). As implied by the basal short branches characterizing Alethinophidia and Caenophidia, these two clades are characterized by elevated speciation rates at the time of their origin, providing support for our first hypothesis that speciation rates are higher in these two clades. Despite the noticeable spike in background speciation rates coinciding with the origin of these two clades (Fig. 2.4), there were no rate shifts associated with either clade, but rates remained above the background rate throughout the history of Caenophidia. Why these two clades quickly radiated into their constituent families and subfamilies remains unknown and warrants investigation. The background speciation rate in snakes tends to slow over time (Fig. 2.2) exemplify niche-filling processes characteristic of ecological opportunity and diversity dependence (Yoder et al., 2010; Rabosky et al., 2012), but nonetheless remained high on interior 81
90 branches throughout the evolution of snakes with only two significant slowdowns occurring within clades of Scolecophidia and Henophidia. In contrast, Pyron and Burbrink (2012) showed an increase in diversification rates in Typhlopidae. Although Pyron and Burbrink (2012) offered no explanation, the rate shift in Typhlopidae likely occurs because this clade contains most of the species diversity in Scolecophidia, possibly due to their habit of consuming prey whole compared to other scolecophidians (Cundall and Greene, 2000). Together, Scolecophidia and Henophidia consist of 624 species, merely 5% of the total snake diversity (Table 2.1), and therefore were diagnosed with slowing of diversification rates when compared to Caenophidia, which accounts for the remaining species. When considering Alethinophidia, which also comprises Henophidia, snake diversity exceeds 3000 species, constituting the only clade of squamates with unusually great species richness (Ricklefs et al., 2007), but the factors driving this immense diversity remain unknown. Since the majority of species richness is within Caenophidia, venom-delivery is frequently regarded as a key innovation because it allowed for the transition over from constriction in capturing and digesting a wider range of prey and prey sizes (Savitzky, 1980; Vidal, 2002; Jackson, 2003; Pyron and Burbrink, 2012). Yet, the evolution of venom-delivery is complicated with several, rear-fanged clades not radiating to any exceptional degree (e.g., Homalopsidae), independently losing the venom gland, and by different clades evolving different types of toxins (Fry et al., 2008). Clearly, increased speciation rates in Alethinophidia and Caenophidia serve as one explanation, but since we found no support for our second hypothesis that Colubroidea underwent a shift in diversification rate, this suggests that processes acting in clades with high lineage accumulation largely overshadow the evolution of venom early in Colubroidea. 82
 Scolecophidia, with the exception of Anomalepididae; 2) Henophidia, with the exception of Aniliidae + Tropidophiidae and Bolyeridae +")
91 Figure 2.5. Phylorate plots displaying speciation rates through time among snake lineages plotted on the time-calibrated tree. A) Maximum shift credibility tree showing 7 diversification shifts. Diversification shifts are in the following clades: 1) Scolecophidia, with the exception of Anomalepididae; 2) Henophidia, with the exception of Aniliidae + Tropidophiidae and Bolyeridae + Xenophidiidae; 3) Viperidae; 4) Elapidae, including Buhoma depressiceps; 5) Hydrophis, excluding H. gracilis, H. jerdonii, and H. spiralis; 6) the "goo-eating" dipsads, Geophis, Atractus, Sibon, Tropidodipsas, Dipsas, Sibynomorphus, Ninia atrata, and Thamnodynastes pallidus; and 7) the Old World racers, Dolichophis, Hierophis, Orientocoluber, and Eirenis within Colubrinae. B) Mean evolutionary rate plot showing 11 diversification shifts. Branches are colored by estimated net diversification rates (blue = slower speciation and red = faster speciation). Diversification shifts are in the following clades: 1) Scolecophidia, with the exception of Anomalepididae; 2) Henophidia, with the exception of Aniliidae + Tropidophiidae and Bolyeridae + Xenophidiidae; 3) Erycidae + Boidae; 4) Viperidae; 5) slight shift within Psammophiinae that is difficult to locate; 6) Elapidae, including Buhoma depressiceps; 7) Hydrophis, excluding H. gracilis, H. jerdonii, and H. spiralis; 8) Trachischium monticola + Hebius within Natricinae; 9) the "goo-eating" dipsads, Geophis, Atractus, Sibon, Tropidodipsas, Dipsas, Sibynomorphus, Ninia atrata, and Thamnodynastes pallidus; 10) Erythrolamprus within Colubrinae; and 11) the same clade of Old World racers as above, but also including the genera Hemorrhois, Spalerosophis, and Platyceps. 83


92 Figure 2.6. Cumulative shift probability plot showing the cumulative probability on each branch that a shift occurred. Occurrence of a shift implies that macroevolutionary dynamics on focal branch are decoupled from background diversification rate. Branches colored in red denote cumulative shift probability of 0.95 or higher. We also find support for our first hypothesis that the species-rich clades Viperidae, Lamprophiidae, Elapidae, Colubridae, Natricinae, Dipsadinae, and Colubrinae are typified by high speciation rates. For Viperidae, Lamprophiidae, Elapidae, Dipsadinae, and Colubrinae, rates remain above the background speciation rate. Thus, high species richness in Caenophidia is due to increased diversification within several of its constituent clades, and not by an overall rate shift in Colubroidea. Despite high species richness in all these clades, shifts in diversification rates were only detected in Viperidae and Elapidae, partially supporting our third hypothesis that 84

93 Figure 2.7. Macroevolutionary cohort matrix displaying pairwise probability that clades share common macroevolutionary rate parameters. Red identifies those taxa that share similar diversification rates and blue identifies taxa whose rates are decoupled from the rest. The matrix illustrates strong heterogeneity in diversification rates, particularly in each of the clades from Fig. 2.4 and Fig. 2.5A that experienced shifts in diversification rates. these clades underwent a shift in diversification rate, as evident by their much greater speciation rates (Fig. 2.4). Thus, based on this method we have support for an association of front-fanged venom-delivery and increased diversification in these two clades; however, based on our STRAPP analysis this association is not realized, failing to support the second part of our fourth hypothesis and showing that simply proposing a key innovation where a rate shift occurs does not demonstrate a causal link (Cracraft, 1990; Heard and Hauser, 1995). For instance, similar to Viperidae and Elapidae, Atractaspidinae (ca. 23 species; Table 2.1) also independently evolved a front-fanged venom system, but did not radiate to the extent of viperids and elapids (Jackson, 2003), suggesting other factors were likely responsible. Two notable differences among these clades are the restricted distribution and conserved morphology and habits of Atractaspidinae 85
94 compared to the global distribution and widely variable morphology and ecology of viperids and elapids. As suggested by some authors colonization of new areas, especially of rodent-rich habitats of temperate areas by vipers (Ineich et al., 2006), and of arid habitats (Byrne et al., 2008), or more specifically, the Australo-Melanesian region (Keogh, 1998; Scanlon and Lee, 2004; Sanders et al., 2008) by elapids may better explain diversification shifts in these two clades. Likewise, independent colonization of the New World by these two clades and also by Natricinae, Dipsadinae, and twice in Colubrinae (Chen et al., 2013) may help explain high speciation rates and high lineage accumulation in these clades as suggested by Pyron and Burbrink (2012). In addition to the shifts in Viperidae and Elapidae, we detected increased shifts in Hydrophis, Neotropical "goo-eaters", and in a clade of Old World racers. Hydrophis was previously shown to represent an adaptive radiation within Elapidae (Voris and Voris, 1983; Lukoschek and Keogh, 2006). Hydrophis is characterized by exceptionally elevated speciation rates generated by differences in trophic ecology, where generalists and specialized macro- and microcephalic forms partition the dietary and habitat niche in species-dense assemblages (Sanders et al., 2013b). Such high local-diversity (i.e., species packing) arises due to effective niche partitioning (Schoener, 1974; Connell, 1978), which is a strong driver of diversification, as also shown in hummingbirds (McGuire et al., 2014), and increases the likelihood of species creating their own ecological opportunity (Erwin, 2008; Losos, 2010; Ricklefs, 2010). "Gooeating" snakes (i.e., snakes that specialize feeding on soft-bodied invertebrates (Cadle and Greene, 1993) possess a seromucous infralabial gland that functions in controlling mucus and in transporting highly viscous prey, which independently evolved in Neotropical "goo-eaters" and in Pareatidae (Zaher et al., 2014). However, based on current phylogenetic hypotheses, this trait 86
95 may have independently evolved twice within Dipsadinae due to the removed phylogenetic position of the genus Adelphicos (Zaher et al., 2014; see Chapter 1) from the rest of the Neotropical "goo-eaters"(i.e., Atractus, Dipsas, Geophis, Ninia, Sibon, Sibynomorphus, Tropidodipsas) a highly diversified clade of greater than 250 species, including the most species rich snake genera Atractus (ca. 138 species; Table S2.2), that evolved from the less-diverse (~31 species), vertebrate-consuming, rear-fanged Leptodeirini (Mulcahy, 2007). The seromucous infralabial gland has been proposed as the cause of high species richness in Neotropical "gooeaters" (Zaher et al., 2014); however, Adelphicos (ca. 6 species) and Pareatidae (ca. 20 species) are relatively species-poor, suggesting some other factor drove the Neotropical "goo-eating" radiation. The shift in the clade of Old World racers was unexpected and is likely linked with the radiation of Eirenis (ca. 20 species; Table S2.2), an ecologically-derived group with distinctive morphological characters, most notably dwarfism, that are associated with a cryptic lifestyle and led to rapid radiation over a short period (Nagy et al., 2004; Mahlow et al., 2013; Rajabizadeh et al., 2015). Understanding factors leading to extraordinary lineage accumulation within these clades will further expand our knowledge of the macroevolutionary processes that produced the great caenophidian radiation. In comparison to other vertebrates which possess limbs capable of evolutionary and structural modification to meet functional demands, snakes appear at a disadvantage due to their morphologically-constrained body plan. Yet, the lack of limbs and body elongation are most likely the driving force behind snake evolution and diversity, and probably allowed for ecological opportunity early in their evolutionary history, providing them access to available resources, novel habitats, and prey not available to other predators (Gans, 1975; Pough, 1983). Even though the snake-like body shape (i.e., highly elongate body with 87
96 reduced or absent limbs) has independently evolved several times in squamates, only snakes radiated to an exceptional degree (Greer, 1991; Wiens et al., 2006; Shine and Wall, 2008). Shine and Wall (2008) postulate that trunk elongation associated with burrowing locomotion provided the structural foundation permitting snakes to shift to ingesting large meals because of an increase in gut volume. However, this hypothesis remains to be tested, along with other proposed key innovations for snakes, that mainly involve structural modifications associated with feeding biology (Pough, 1983). These key innovations include kinetic skull and jaw disarticulation in early macrostomates, which provided large gapes for consuming prey whole (Gans, 1961; Greene, 1983; Vincent et al., 2006; Longrich et al., 2012); constriction (Greene and Burghardt, 1978; Boback et al., 2012); associated venom-delivery adaptations (Jackson, 2003; Fry et al., 2008); and the seromucous infralabial gland and asymmetrical dentition of "goo-eaters"(hoso et al., 2007; Zaher et al., 2014). So far, front-fanged venom-delivery does not appear to be a key innovation that increased diversification rates in viperids and elapids suggesting we should look beyond key innovations and consider synergistic factors as well. Acknowledgements We would like to thank Stephen A. Smith for his help with treepl and Liam Revell for his assistance with phytools. 88
97 References Alfaro, M.E., Santini, F., Brock, C., Alamillo, H., Dornburg, A., Rabosky, D.L., Carnevale, G., Harmon, L.J Nine exceptional radiations plus high turnover explain species diversity in jawed vertebrates. Proc. Natl. Acad. Sci. USA 106, Barraclough, T.G., Nee, S Phylogenetics and speciation. Trends Ecol. Evol. 16, Barraclough, T.G., Vogler, A.P., Harvey, P.H Revealing the factors that promote speciation. Phil. Trans. R. Soc. B 353, Beaulieu, J.M., O Meara, B.C Detecting hidden diversification shifts in models of traitdependent speciation and extinction. biorxiv doi: Blair, C., Sánchez-Ramírez, S Diversity-dependent cladogenesis throughout western Mexico: Evolutionary biogeography of rattlesnakes (Viperidae: Crotalinae: Crotalus and Sistrurus). Mol. Phylogenet. Evol. 97, Boback, S.M., Hall, A.E., McCann, K.J., Hayes, A.W., Forrester, J.S., Zwemer, C.F Snake modulates constriction in response to prey's heartbeat. Biol. Lett. rsbl Burbrink, F.T., Pyron, R.A The taming of the skew: estimating proper confidence intervals for divergence dates. Syst. Biol. 57, Burbrink, F.T., Pyron, R.A How does ecological opportunity influence rates of speciation, extinction, and morphological diversification in New World ratsnakes (tribe Lampropeltini)? Evol. 64, Burbrink, F.T., Chen, X., Myers, E.A., Brandley, M.C., Pyron, R.A. 2012a. Evidence for determinism in species diversification and contingency in phenotypic evolution during adaptive radiation. Proc. R. Soc. Lond. 279,
98 Burbrink, F.T., Ruane, S., Pyron, R.A. 2012b. When are adaptive radiations replicated in areas? Ecological opportunity and unexceptional diversification in West Indian dipsadine snakes (Colubridae: Alsophiini). J. Biogeogr. 39, Butlin, R., Bridle, J., Schluter, D Speciation and patterns of diversity. Cambridge Univ. Press, Cambridge. Byrne, M., Yeates, D.K., Joseph, L., Kearney, M., Bowler, J., Williams, M.A.J., Cooper, S., Donnellan, S.C., Keogh, J.S., Leys, R., Melville, J., Murphy, D.J., Porch, N., Wyrwoll, K-H Birth of a biome: insights into the assembly and maintenance of the Australian arid zone biota. Mol. Ecol. 17, Cadle, J.E., Greene, H.W. 1993, Phylogenetic Patterns, Biogeography, and the Ecological Structure of Neotropical Snake Assemblages. In: Species Diversity in Ecological Communities: Historical and Geographical Perspectives (eds. Ricklefs, R.E., Schluter, D). pp University of Chicago Press, Chicago, Illinois. Connell, J.H Diversity in tropical rain forests and coral reefs. Science, 199, Cracraft, J The origin of evolutionary novelties: pattern and process at different hierarchical levels. In Evolutionary innovations (ed. M.H. Nitecki), pp University of Chicago Press. Cundall, D., Greene, H.W., Feeding in snakes. In: Schwenk, K. (Ed.), Feeding: Form, Function, and Evolution in Tetrapod Vertebrates. Academic Press, New York, pp Davies, T.J., Barraclough, T.G., Chase, M.W., Soltis, P.S., Soltis, D.E., Savolainen, V Darwin's abominable mystery: insights from a supertree of the angiosperms. Proc. Natl. Acad. Sci. USA, 101,
99 Day, J.J., Cotton, J.A., Barraclough, T.G Tempo and mode of diversification of Lake Tanganyika cichlid fishes. PLoS One 3, e1730. Donoghue, M.J Key innovations, convergence, and success: macroevolutionary lessons from plant phylogeny. Paleobiol. 31, Erwin, D.H Macroevolution of ecosystem engineering, niche construction and diversity. Trends Ecol. Evol. 23, FitzJohn, R.G Diversitree: comparative phylogenetic analyses of diversification in R. Method. Ecol. Evol. 3, Fry, B.G., Scheib, H., van der Weerd, L., Young, B., McNaughtan, J., Ramjan, S.F.R., Vidal, N., Poelmann, R.E., Norman, J.A Evolution of an arsenal structural and functional diversification of the venom system in the advanced snakes (Caenophidia). Mol. Cell. Proteomics, 7, Gans, C The feeding mechanism of snakes and its possible evolution. Amer. Zool Gans, C Tetrapod limblessness: Evolution and functional corollaries. Amer. Zool. 15, Gavrilets, S., Losos, J.B Adaptive radiation: contrasting theory with data. Science, 323, Givnish, T.J Adaptive radiation versus radiation and explosive diversification : why conceptual distinctions are fundamental to understanding evolution. New Phytol. 207, Greene, H.W Dietary correlates of the origin and radiation of snakes. Am. Zool. 23,
100 Greene, H.W Snakes. The Evolution of Mystery in Nature. Berkeley: Univ. Calif. Press. 351 pp. Greene, H.W., Burghardt, G.M Behavior and phylogeny: constriction in ancient and modern snakes. Science 200, Greer, A.E Limb reduction in squamates: identification of the lineages and discussion of the trends. J. Herpetol. 25, Heath, T.A., Hedtke, S.M., Hillis, D.M Taxon sampling and the accuracy of phylogenetic analyses. J. Syst. Evol. 46, Heard, S.B., Hauser, D.L Key evolutionary innovations and their ecological mechanisms. Hist. Biol. 10, Hodges, S.A., Arnold, M.L Spurring plant diversification: are floral nectar spurs a key innovation? Proc. R. Soc. Lond. B 262, Hoso, M., Asami, T., Hori, M Right-handed snakes: convergent evolution of asymmetry for functional specialization. Biol. Lett. 3, Hsiang, A.Y., Field, D.J., Webster, T.H., Behlke, A.D., Davis, M.B., Racicot, R.A., Gauthier, J. A., The origin of snakes: Revealing the ecology, behavior, and evolutionary history of early snakes using genomics, phenomics, and the fossil record. BMC Evol. Biol. 15, 87. Hunt, T., Bergsten, J., Levkanicova, Z., Papadopoulou, A., St John, O., Wild, R., Hammond, P.M., Ahrens, D., Balke, M., Caterino, M.S., Gómez-Zurita, J., Ribera, I., Barraclough, T.G., Bocakova, M., Bocak, L., Vogler, A.P A comprehensive phylogeny of beetles reveals the evolutionary origins of a superradiation. Science 318,
101 Hutchinson, G.E Homage to santa rosalia. Am. Nat. 93, Ineich, I., Bonnet, X., Shine, R., Shine, T., Brischoux, F., Lebreton, M., Chirio, L What, if anything, is a typical viper? Biological attributes of basal viperid snakes (genus Causus Wagler, 1830). Biol. J. Linn. Soc. 89, Jackson, K The evolution of venom delivery systems in snakes. Zool. J. Linn. Soc. 137, Kelly, C.M., Barker, N.P., Villet, M.H Phylogenetics of advanced snakes (Caenophidia) based on four mitochondrial genes. Syst. Biol. 52, Kelly, C.M.R., Barker, N.P., Villet, M.H., Broadley, D.G., Phylogeny, biogeography and classification of the snake superfamily Elapoidea: a rapid radiation in the late Eocene. Cladistics 25, Keogh, J.S Molecular phylogeny of elapid snakes and a consideration of their biogeographic history. Biol. J. Linn. Soc. 63, Kirkpatrick, M., Slatkin, M Searching for evolutionary patterns in the shape of a phylogenetic tree. Evol. 47, Lee, M.S., Sanders, K.L., King, B., Palci, A Diversification rates and phenotypic evolution in venomous snakes (Elapidae). R. Soc. Open Sci. 3, Lloyd, G.T., Davis, K.E., Pisani, D., Tarver, J.E., Ruta, M., Sakamoto, M., Hone, D.W.E., Jennings, R., Benton, M.J Dinosaurs and the Cretaceous terrestrial revolution. Proc. R. Soc. Lond. B 275, Longrich, N.R., Bhullar, B.A.S., Gauthier, J.A Mass extinction of lizards and snakes at the Cretaceous Paleogene boundary. Proc. R. Soc. Lond. B 109,
102 Losos, J.B Adaptive radiation, ecological opportunity, and evolutionary determinism. Am. Nat. 175, Lukoschek, V., Keogh, J.S Molecular phylogeny of sea snakes reveals a rapidly diverged adaptive radiation. Biol. J. Linn. Soc. 89, Lynch, V.J Live birth in vipers (Viperidae) is a key innovation and adaptation to global cooling during the Cenozoic. Evol. 63, Machac, A Detecting trait-dependent diversification under diversification slowdowns. Evol. Biol. 41: Maddison, W.P., FitzJohn, R The unsolved challenge to phylogenetic correlation tests for categorical characters. Syst. Biol. 64, Maddison, W.P., Midford, P.E., Otto, S.P Estimating a binary character s effect on speciation and extinction. Syst. Biol. 56, Mahlow, K., Tillack, F., Schmidtler, J.F., Müller, J An annotated checklist, description and key to the dwarf snakes of the genus Eirenis Jan, 1863 (Reptilia: Squamata: Colubridae), with special emphasis on the dentition. Vertebr. Zool. 63, McGuire, J.A., Witt, C.C., Remsen, J.V., Corl, A., Rabosky, D.L., Altshuler, D.L., Dudley, R Molecular phylogenetics and the diversification of hummingbirds. Current Biology 24, McVay, J.D., Flores Villela, O., Carstens, B., Diversification of North American natricine snakes. Biol. J. Linn. Soc., 116, Mitter, C., Farrell, B., Wiegmann, B The phylogenetic study of adaptive zones: has phytophagy promoted insect diversification? Am. Nat. 132,
103 Mooers, A.Ø., Heard, S.B Inferring evolutionary process from phylogenetic tree shape. Q. Rev. Biol. 72, Nagy, Z.T., Lawson, R., Joger, U., Wink, M Molecular systematics of racers, whipsnakes and relatives (Reptilia: Colubridae) using mitochondrial and nuclear markers. J. Zoolog. Syst. Evol. Res. 42, Nee, S., Mooers, A.O., Harvey, P.H Tempo and mode of evolution revealed from molecular phylogenies. Proc. Natl. Acad. Sci. 89, Nee, S., Holmes, E.C., May, R.M., Harvey, P.H Extinction rates can be estimated from molecular phylogenies. Phil. Trans. R. Soc. Lond. B 344, Noonan, B.P., Chippindale, P.T Dispersal and vicariance: The complex evolutionary history of boid snakes. Mol. Phylogenet. Evol. 40, Plummer, M., Best, N., Cowles, K., Vines, K CODA: Convergence Diagnosis and Output Analysis for MCMC. R News 6, Pough, F.H Feeding mechanisms, body size, and the ecology and evolution of snakes. Introduction to the symposium. Am. Zool. 23, Pyron, R.A., Burbrink, F.T Extinction, ecological opportunity, and the origins of global snake diversity. Evol. 66, Pyron, R.A., Burbrink, F.T., Wiens, J.J. 2013a. A phylogeny and revised classification of Squamata, including 4161 species of lizards and snakes. BMC Evol. Biol. 13, 93. Pyron, R.A., Wallach, V Systematics of the blindsnakes (Serpentes: Scolecophidia: Typhlopoidea) based on molecular and morphological evidence. Zootaxa 3829,
104 Pyron, R.A., Hendry, C.R., Chou, V.M., Lemmon, E.M., Lemmon, A.R., Burbrink, F.T. 2014a. Effectiveness of phylogenomic data and coalescent species-tree methods for resolving difficult nodes in the phylogeny of advanced snakes (Serpentes: Caenophidia). Mol. Phylogenet. Evol. 81, Pyron, R.A., Reynolds, R.G., Burbrink, F.T. 2014b. A taxonomic revision of Boas (Serpentes: Boidae). Zootaxa 3846, R Development Core Team R: A language and environment for statistical computing. R Foundation for Statistical Computing, Vienna, Austria. Rabosky, D.L Automatic detection of key innovations, rate shifts, and diversitydependence on phylogenetic trees. PLoS One 9:e Rabosky, D.L., Goldberg, E.E Model inadequacy and mistaken inference of traitdependent speciation. Syst. Biol. 64: Rabosky, D. L., Huang, H A Robust Semi-Parametric Test for Detecting Trait-Dependent Diversification. Syst. Biol. syv066. Rabosky, D.L., Slater, G.J., Alfaro, M.E Clade age and species richness are decoupled across the eukaryotic tree of life. PLoS Biol, 10, e Rabosky, D.L., Santini, F., Eastman, J.M., Smith, S.A., Sidlauskas, B., Chang, J., Alfaro, M.E Rates of speciation and morphological evolution are correlated across the largest vertebrate radiation. Nat. Commun. 4: /ncomms2958. Rabosky, D.L., Donnellan, S.C., Grundler, M., Lovette, I.J. 2014a. Analysis and visualization of complex macroevolutionary dynamics: an example from Australian scincid lizards. Syst. Biol. 63,
105 Rabosky, D.L., Grundler, M., Anderson, C., Shi, J.J., Brown, J.W., Huang, H., Larson, J.G. 2014b. BAMMtools: an R package for the analysis of evolutionary dynamics on phylogenetic trees. Methods Ecol. Evol. 5, Rajabizadeh, M., Nagy, Z.T., Adriaens, D., Avci, A., Masroor, R., Schmidtler, J., Nazarov, R., Esmaeili, H.R., Christiaens, J Alpine Himalayan orogeny drove correlated morphological, molecular, and ecological diversification in the Persian dwarf snake (Squamata: Serpentes: Eirenis persicus). Zool. J. Linn. Soc. Ree, R.H Detecting the historical signature of key innovations using stochastic models of character evolution and cladogenesis. Evol. 59, Ricklefs, R.E Evolutionary diversification, coevolution between populations and their antagonists, and the filling of niche space. Proc. Natl. Acad. Sci. USA 107, Ricklefs, R.E., Losos, J.B., Townsend, T.M Evolutionary diversification of clades of squamate reptiles. J. Evol. Biol. 20: Sanders, K.L., Lee, M.S.Y., Leys, R., Foster, R., and Keogh, J.S Molecular phylogeny and divergence dates for Australasian elapids and sea snakes (hydrophiinae): evidence from seven genes for rapid evolutionary radiations. J. Biol. Evol. 21, Sanders, K.L., Hamidy, A., Head, J.J., Gower, D.J., Phylogeny and divergence times of filesnakes (Acrochordus): inferences from morphology, fossils and three molecular loci. Mol. Phylogenet. Evol. 56, Sanders, K.L., Lee, M.S.Y., Mumpuni, Bertozzi, T., Rasmussen, A.R. 2013a. Multilocus phylogeny and recent rapid radiation of the viviparous sea snakes (Elapidae: Hydrophiinae). Mol. Phylogenet. Evol. 66,
106 Sanders, K.L., Rasmussen, A.R., Elmberg, J., Silva, A., Guinea, M.L., Lee, M.S.Y. 2013b. Recent rapid speciation and ecomorph divergence in Indo Australian sea snakes. Mol. Ecol. 22, Sanderson, M.J Estimating absolute rates of molecular evolution and divergence times: a penalized likelihood approach. Mol. Biol. Evol. 19, Sanderson, M.J., Donoghue, M.J Reconstructing shifts in diversification rates on phylogenetic trees. Trends Ecol. Evol. 11, Savitzky, A.H The role of venom delivery strategies in snake evolution. Evol. 34, Scanlon, J.D., Lee, M.S.Y Phylogeny of Australasian venomous snakes (Colubroidea, Elapidae, Hydrophiinae) based on phenotypic and molecular evidence. Zool. Scr. 33, Scanlon, J.D., Lee, M.S The major clades of living snakes: morphological evolution, molecular phylogeny, and divergence dates. Reproductive biology and phylogeny of snakes. Boca Raton, FL: CRC Press. pp Schluter, D The ecology of adaptive radiation, 288 pp. Oxford, UK: Oxford University Press. Schoener, T.W Resource partitioning in ecological communities. Science 185, Shine, R., Wall, M Interactions between locomotion, feeding, and bodily elongation during the evolution of snakes. Biol. J. Linn. Soc. 95, Simpson, G.G Tempo and Mode in Evolution. Columbia University Press, New York. 98
107 Slowinski, J.B., Guyer, C Testing whether certain traits have caused amplified diversification: an improved method based on a model of random speciation and extinction. Amer. Nat. 142, Smith, S.A., O Meara, B.C., TreePL: divergence time estimation using penalized likelihood for large phylogenies. Bioinformatics 28, Uetz, P. & J. Hošek (eds.), The Reptile Database, accessed March 23, Vidal, N Colubroid systematics: evidence for an early appearance of the venom apparatus followed by extensive evolutionary tinkering. J. Toxicol. 21, Vidal, N., Rage, J.C., Couloux, A., Hedges, S.B Snakes (Serpentes). In: Hedges, S.B., Kumar, S. (Eds.), The Timetree of Life. Oxford University Press, New York, pp Vidal, N., Marin, J., Morini, M., Donnellan, S., Branch, W.R., Thomas, R., Vences, M., Wynn, A., Cruaud, C., Hedges, S.B Blindsnake evolutionary tree reveals long history on Gondwana. Biol. Lett. 6, Vincent, S.E., Dang, P.D., Herrel, A., Kley, N.J Morphological integration and adaptation in the snake feeding system: a comparative phylogenetic study. J. Evol. Biol. 19, Voris, H.K., Voris, H.H Feeding strategies in marine snakes: an analysis of evolutionary, morphological, behavioral and ecological relationships. Amer. Zool. 23, Weir, J.T., Schluter, D The latitudinal gradient in recent speciation and extinction rates of birds and mammals. Science 315,
108 Wiens, J.J., Brandley, M.C., Reeder, T.W Why does a trait evolve multiple times within a clade? Repeated evolution of snakeline body form in squamate reptiles. Evol. 60, Wüster, W., Peppin, L., Pook, C.E., Walker, D.E A nesting of vipers: phylogeny and historical biogeography of the Viperidae (Squamata: Serpentes). Mol. Phylogenet. Evol. 49, Yoder, J.B., Clancey, E., Des Roches, S., Eastman, J.M., Gentry, L., Godsoe, W., Hagey, T.J., Jochimsen, D., Oswald, B.P., Robertson, J., Sarver, B.A.J., Schenk, J.J., Spear, S.F., Harmon, L.J Ecological opportunity and the origin of adaptive radiations. J. Evol. Biol. 23, Zaher, H., de Oliveira, L., Grazziotin, F.G., Campagner, M., Jared, C., Antoniazzi, M.M., Prudente, A.L Consuming viscous prey: a novel protein-secreting delivery system in neotropical snail-eating snakes. BMC Evol. Biol. 14,
109 Supporting Information Table S2.1. Nodes and fossil ages used for estimating divergence times. Age is given as a range (minimum and maximum ages) or as a minimum age given in millions of years (Myr). Refer to references for justification for each fossil calibration selected. Our nodes Boidae, Charininae, Charina correspond to Boinae, Charinidae, and Charininae, respectively, in Head (2015). Table S2.2. List of 402 genera sampled and 113 genera not sampled in Chapter 1. For genera sampled, the total number of species, the number of species sampled, and the percentage of species sampled is provided for each genus. For genera not sampled, the total number of species, family or subfamily designation, and distribution is provided. i.s. = incertae sedis. Figure S2.1. Phylorate plots for each of the shift configurations sets that account for 95% of probability of the data. Values above each plot represents posterior probability for each set of shift configurations. Black circles indicate locality of occurrence for a shift in diversification rates. File S2.1. Newick file for time-calibrated phylogeny for 1745 taxa representing 1652 snake species and 7 outgroup taxa displayed in Fig
110 Chapter 3. The Evolution of Habitat Use in Snakes: A Specialized Body Shape Suitable for Diverse Habitat Associations Abstract Over 3,500 species of snakes presently inhabit diverse habitats in all major non-arctic biomes, from soils, caves, and forest canopies, to numerous types of aquatic ecosystems. Morphology often relates to functional performance, and species occupying different habitat types are considered to show morphological adaptations suited for their habitats. We use the most recent and comprehensive snake phylogeny to examine habitat use and body shape variation in snakes to test three hypotheses: 1) Individual habitat use categories independently evolved numerous times in snakes; 2) Species from different habitat associations form morphological clusters by occupying distinct regions of multivariate morphospace; and 3) Species from similar habitat associations show convergence in both morphology and adaptive regimes. Stochastic character mapping inferred snakes as having evolved from an ancestrally fossorial lifestyle and that throughout their evolutionary history, have undergone multiple expansions into new habitats as they colonized and transitioned, often repeatedly, between a multitude of habitat types. Species associated with different habitats widely overlapped in body shape morphospace, and did not form clearly defined morphological groups. Hierarchical clustering showed that distantlyrelated species of similar habitat use formed several morphological subclusters, but these 102
111 subclusters were part of larger clusters that included species from different habitat associations. Snakes converged on morphology based on phenotypic distance, but did not converge in morphospace due to the invasion of divergent taxa into their phylomorphospace. We estimated between 39 adaptive regimes, of which 11 were convergent using the AICc criterion, which is criticized for over-fitting models, and six adaptive regimes using the pbic criterion. 103
112 Introduction The study of functional traits that allow individuals to interact with their environment in ecologically-relevant ways forms a cornerstone of our understanding of adaptation. An important finding in this regard is that species have in many cases independently evolved similar functional solutions to the same ecological challenges. This convergent evolution of analogous functional traits in distantly-related taxa usually occurs in response to species occupying similar ecological niches (see Stayton 2015), modeled as a peak in the adaptive landscape (Mahler, et al. 2013; Arbuckle, et al. 2014). Thus, we can distinguish between pattern-based convergence, where lineages independently evolved similarity (Stayton 2015), and process-based convergence, where convergence arises due to some evolutionary process (Stayton 2015), most commonly by convergent lineages entering equivalent adaptive regimes (Schluter, 2000; Mahler, et al. 2013). General examples of convergence include fins for swimming in fish and mammals (Donley, et al. 2004) or wings for flying in insects, pterodactyls, birds, and bats (Maina 2000). As these examples illustrate, convergence can occur both over broad taxonomic scales, and at finer taxonomic levels. Perhaps the most well-known example of repeated morphological convergence is that of Caribbean Anolis lizards, which are grouped into 6 classes of habitat specialists known as ecomorphs (i.e., lineages similar in morphology and behavior that occupy the same structural habitat niche, but not sharing a recent common ancestor; (Williams 1972; Losos 2009). Convergence provides strong support for repeatability in evolution (Losos, et al. 1998; Mahler, et al. 2013) and for adaptation (Harvey and Pagel 1991) as distantly-related species adapt to inhabit all or parts of the same multidimensional niches (Harmon, et al. 2005). Morphology most often reflects phylogeny, and morphological divergence occurs in response to ecological factors such 104
113 as habitat use and diet (Arnold 1983). Because morphology is highly correlated with both behavior and ecology, collectively known as ecomorphology (Williams 1972), variation in morphology serves as a predictor of differences in resource use (Williams 1972; Arnold 1983; Losos 1990). Unlike anoles and other vertebrates that have limbs capable of evolutionary and structural change, snakes lack limbs with which to interact with their environment, resulting in a specialized and highly conserved body plan, capable of comparatively limited modifications and adaptations. The evolutionary loss of limbs in snakes therefore required structural innovations to overcome functional challenges associated with locomotion and prey handling. In spite of this clear morphological constraint and originating from a fossorial lifestyle (Bellairs and Underwood 1951; Shine and Wall 2008; Yi and Norell 2015), snakes exploded into a radiation of over 3,500 extant species (Uetz and Hošek 2014), encompassing a diverse range of morphologies and habits (Gans 1961; Pough 1983; Greene, et al. 1997). Yet despite this diversity, and perhaps due to the number of limited external morphological characters to quantify, variation in habitat transitions and snake morphology has received little attention, much less within an appropriate phylogenetic framework. In this study we trace the evolution of habitat use and quantify morphological variation in snakes to test hypotheses regarding morphological convergence. We currently lack an understanding of how snake lineages filled and transitioned between available habitats, or even how habitat use is distributed amongst snakes. Most evidence points to a terrestrial, more specifically, a subterranean origin (Shine and Wall 2008; Hsiang, et al. 2015; Yi and Norell 2015). Thus, from a fossorial origin, snakes went on to invade all major non- Arctic biomes and occupy nearly every habitat stratum of terrestrial ecosystems, from deep soils to high forest canopies, as well as aquatic ecosystems, both freshwater and marine (Greene, et al. 105
114 1997). Some of these habitat associations are known to have evolved independently several times (Lillywhite and Henderson 1993; Colston, et al. 2010; Brischoux and Shine 2011). Snakes are often used as models of niche partitioning (Toft 1985; Luiselli 2006), a necessary component in maintaining community structure by limiting competitive species-interactions (Pianka 1974; Schoener 1974), particularly between closely-related and ecologically-similar species to promote sympatry (Richman and Price 1992), and also in taxa, like snakes, that form species-dense communities. Such communities will benefit from species partitioning broad habitat use categories (e.g., fossorial, aquatic, terrestrial, or arboreal) based on differential structural habitat use (see methods; Rand 1964). For most snakes, habitat association is based solely on qualitative observations (Reinert 1992), mainly owing to their secretive lifestyle. The term secretive is often used interchangeably with cryptozoic (i.e., fossorial/subterranean), but many snakes spend a large part of their time concealed in some type of substrate (i.e., burrows, holes, rocks, vegetation). To distinguish between conserved morphologies due to phylogeny and morphological shifts associated with an ecological origin, we use the time-calibrated phylogenetic tree of Chapter 2 consisting of 1652 species, the most recent and comprehensive phylogeny to date. To trace the evolutionary history of habitat use from ancestral species to descendant taxa, we mapped habitat use categories onto the phylogenetic tree and used stochastic character mapping to estimate ancestral habitat states and infer historical transitions between habitat types. Sympatric snakes tend to show the greatest ecological divergence in habitat use and the use of dietary resources (Reinert 1993; Luiselli 2006); therefore, we predict that the majority of variation in morphology lies in head shape. We specifically tested the following hypotheses concerning niche-based divergence: 1) Individual habitat use categories independently evolved 106
115 numerous times in snakes; 2) Species from different habitat associations form morphological clusters by occupying distinct regions of multivariate morphospace; and 3) Species from similar habitat associations show converge in morphology and converge in similar adaptive regimes. Materials and Methods Ancestral Character State Estimation and Habitat Use Transitions Habitat use in snakes is usually classified into broad categories (e.g., fossorial, aquatic, terrestrial, or arboreal). Further dividing these categories by identifying physical features of the habitat and morphological adaptations associated with habitat use (sensu Rand, 1964) can provide slightly more specific and/or biologically accurate descriptions of habitat use and identify microhabitat specializations. Therefore, to infer the history of habitat use in snakes, we defined 9 general habitat categories (9-state model; fossorial, semifossorial, semiaquatic, freshwater, marine, aquatic-mixed, terrestrial, semiarboreal, and arboreal) and 28 specific habitat categories (28-state model) of snake habitat association (Table 3.1) by surveying the literature to identify habitat associations for all species represented on our phylogeny (Table S3.1). For many species, insufficient qualitative information is available to categorize their specific habitat use, in which case we simply kept their broad habitat association. We used the phytools package (Revell 2012) in R to perform stochastic character mapping (SCM) on the 9- and 28-state habitat use models, which uses a Markov chain Monte Carlo (MCMC) approach to sample character histories from their posterior distribution to obtain a sample of unambiguous histories on the tree (Huelsenbeck, et al. 2003). Because phytools has difficulty estimating ancestral states on a time- 107
116 calibrated phylogeny, we converted the time-calibrated tree into an ultrametric tree using penalized likelihood, which retained a highly congruent branching structure to the timecalibrated tree. Next, we excluded outgroups and assessed the fit of the following three discrete trait maximum likelihood (ML) models using the R package geiger (Harmon, et al. 2008): (i) transition rates between states are equal (ER);(ii) forward and reverse transition rates between states are equal, but differ between different trait combinations (SYM); and (iii) all transition rates are different (ARD). Afterwards, we compared model fit using corrected Akaike information criterion (AICc) and selected the model with the lowest value. We then implemented SCM using the model with the lowest AICc value. Since SCM samples character states at nodes and changes in character state along edges, we replicated SCM 1000 times on the time-calibrated tree to estimate the number of character changes, the proportion of time spent in each character state, and the posterior probabilities that each internal node is in each character state. Table 3.1. List and definitions for 28 types of specific habitat associations used to characterize habitat use of snakes. Habitat Association Subterranean Subterranean- Burrower Soil-Burrower Sand-Burrower Definition Specialized burrowers most active in the soil or in nests/mounds of social insects (i.e., ants and termites) Specialized burrowers most active below the surface in soil Specialized burrowers occupying sabulicole (sand) environments Subterranean-Debris Most active under various cover items (leaf litter, logs, rocks, etc.) Most active under rocky cover items (scree, cap rocks, rock crevices, etc.) in rupicolous Subterranean-Rocks (rocky) environments Aquatic Lentic Exclusively aquatic in slow-moving freshwater environments (lakes and ponds) Aquatic-Freshwater Most active in freshwater environments (rivers, lakes, ponds, etc.) Freshwater-Burrower Burrows into aquatic soil, aquatic vegetation or use mud tunnels Aquatic-Mixed Aquatic-Mixed- Burrower Riverine Active in marine, brackish, or freshwater environments Burrows into aquatic vegetation or mudflats in marine, brackish, or freshwater environments Exclusively aquatic in riverine ecosystems 108
117 Table 3.1 Continued. Amphibious Intertidal Intertidal-Burrower Coastal Reef-Flats Coral-Reefs Deep-Water Pelagic Terrestrial Terrestrial Marine snakes that come ashore for various activities (basking, reproduction, digestion, shelter, etc.) Mangroves, mud flats, tidal rivers, estuaries, and marshes Burrows into mudflats or use intertidal burrow systems in marine, brackish, or freshwater environments Marine snake inhabiting river mouths, estuaries, shoals, seas along coasts (preferences for turbidity exists between species Most active along sandy bottoms from shore to coral reefs Most active among coral reefs Deep water near land or coral reefs Open seas far from land Activity occurs predominately above the ground surface Terrestrial-Fossorial Equal use of terrestrial and fossorial environments Terrestrial-Aquatic Equal use of terrestrial and aquatic environments Predominately terrestrial snakes, adept at climbing (some species are troglodytic - active Terrestrial-Scansorial in caves) Terrestrial-Arboreal Equal use of terrestrial and arboreal environments GeneralistI GeneralistII GeneralistIII Arboreal Arboreal* Found in terrestrial, aquatic, and arboreal environments Found in terrestrial, fossorial, and aquatic environments Found in terrestrial, fossorial, and arboreal environments Specialized climbers most active in arboreal environments *Arboreal snakes likely partition arboreal habitats, but very little data exists to make any discriminations. Taxon Sampling and Morphological Measurements To quantify variation in morphology and character evolution, we sampled a maximum of 15 specimens per species, resulting in a dataset of 1715 specimens for 284 species. To provide more phylogenetic coverage, we included numerous species from a recently published dataset (Grundler and Rabosky 2014) to incorporate more non-arboreal tips on the phylogeny since our data consisted principally of arboreal species, resulting in a dataset of 405 species. Specific habitat use in our morphological dataset is distributed as follows: Amphibious = 1; Aquatic- Freshwater = 10; Aquatic-Mixed = 2; Aquatic-Mixed-Burrower = 2; Arboreal = 124; Freshwater-Burrower = 5; Generalist-I = 6; Generalist-II = 3; Intertidal = 2; Intertidal-Burrower 109
118 = 4; Sand-Burrower = 9; Soil-Burrower = 7; Subterranean-Debris = 42; Subterranean-Rock = 1; Terrestrial = 79; Terrestrial-Aquatic = 9; Terrestrial-Arboreal = 61; Terrestrial-Fossorial = 16; and Terrestrial-Scansorial = 22. Due to limited availability of museum specimens for some species, we obtained measurements from both sexes since variation among species outweigh variation within species. For each specimen we measured nine external morphological characters to account for variation in body shape: (snout-vent length [SVL], tail length (distance from the cloaca to the tip of the tail [TL]), mid-body width [MBW]; and head shape: head length (tip of the snout to the end of the quadrate [HL]), jaw length (tip of the snout to the end of the bottom quadrate [JL]), head width (at the widest part of the head [HW]), head depth (at the tallest part of the head [HD]), interocular distance (shortest distance between the edges of the eyes [IO]), and eye diameter (ED). For SVL, TL, we used dental floss to measure the size of each character, then measured the dental floss to the nearest 0.1 cm on a meter stick. The remaining characters were measured to the nearest 0.1 mm using Mitutoyo digital calipers. Variables measured in cm were converted to mm for statistical analyses. Morphological Variation We performed all statistical analyses in R (Team 2011). We analyzed morphological variation by conducting a suite of non-phylogenetic and phylogenetic tests on the mean for each variable. Since body size accounts for the majority of the observed morphological variation, we analyzed variation based on shape by calculating the residuals for each log10-transformed character using linear regressions against SVL to correct for body size. Biological shape is a composite of multiple traits making morphometric data essentially a multivariate test requiring 110
119 dimension reduction to test the hypothesis that species form discrete clusters in multivariate morphospace. To analyze morphological variation and to test if species from different habitat associations form morphological clusters, we performed principal components analysis (PCA) and hierarchical clustering. We performed PCA, using the 'psych' and 'GPArotation' packages, on the covariance matrix of the size-corrected variables to reduce the dimensionality of the data, retaining PCs with eigenvalues > 1 for further analyses (Ricklefs and Travis 1980). PCA allows comparison of species distributions within multivariate morphological space and identification of patterns of correlation among morphological variables. Next, we used hierarchical clustering to identify morphological subclusters. We performed hierarchical clustering using the package 'stats', by calculating a Euclidean distance matrix on the size-corrected variables and by using Ward's clustering method to minimize within-cluster variance. To visualize morphology associated with each cluster, we created boxplots using the PC loadings for each species and their cluster affiliation. Finally, to examine if morphology is related to morphological cluster, we carried out a multivariate analysis of variance (MANOVA). If the MANOVA reveals any significant differences in morphology due to morphological cluster, we will use analysis of variance (ANOVA) to identify where those differences lie. Test for Morphological Convergence To identify morphological convergence, we performed two separate analyses on the PC scores. The first is a pattern-based approach, which requires known or putative convergent taxa be specified a priori, and the second is a process-based approach that does not require convergent taxa be known a priori. Since several species from the morphological dataset are not included in 111
120 the phylogeny, we substituted their names for the names of closely-related species in the tree (Pennell, et al. 2016). Using this procedure, we managed to manually replace 37 species, but omitted 23 species due to the lack of available tips on the phylogeny of closely-related species (Supplement 3). For the pattern-based approach, we used the package 'convevol' to quantify the amount of independently evolved similarity within our PC scores (Stayton, 2015). This procedure takes into account morphological similarity, but does not require a certain level of similarity, and incorporates two approaches. First is a distance-based procedure, which calculates between two lineages as a proportion of the distance between both species tips and the largest distance between those taxa throughout their evolutionary history (anywhere between the species tips and their most recent common ancestor [MRCA])(C1-C4): C1, the proportion of the maximum distance from the MRCA in morphospace between focal taxa that has been reduced by phenotypic evolution; C2, similar to C1, but accounts for the amount of morphological change; C3, the proportion of evolution attributable to convergence between focal taxa; and C4, the proportion of evolution attributable to convergence to the smallest clade containing the focal taxa. Second, is a frequency-based measure (C5), which quantifies the number of lineages that have evolved into a certain region of morphospace and counts the number of lineages entering the region of the morphospace occupied by the hypothesized convergent taxa (C5). For C1, values of 0 correspond to no convergence and values of 1 equal complete convergence, and for all other values of C, the greater the value, the greater convergence is. We performed 1000 simulations of evolution along the phylogeny using BM, calculating convergence measures for each simulation in convevol to determine if the observed C value is greater than would be expected by chance (P-value). For our process-based analysis, we tested for convergence by detecting the phylogenetic 112
121 placement and magnitude of evolutionary trait shifts, known as regimes, and identify whether distantly-related taxa share the same regime. To test for shared evolutionary trait regimes, we used the package 'l1ou', which fits Ornstein-Uhlenbeck (OU) models in a stepwise fashion to estimate species placement within a multidimensional adaptive landscape of trait space without the a priori designation of ecomorphs or selective regimes (Khabbazian, et al. 2016). All clades in the tree are assumed to evolve around different optima (i.e., adaptive regimes) until independent lineages sharing a common optimum are identified and convergence is achieved. This procedure applies a phylogenetic lasso method, which considerably speeds up analyses, on OU models and selects the best-fit model using the phylogenetic Bayesian information criterion (pbic), a new test that accounts for the phylogenetic correlation between species for approximating the number of shifts in the marginal probability. This procedure is designed to reduce the detection of false shifts from those that overfit models, like the corrected Akaike Information Criterion (AICc)(Ho and Ané 2014). However, for comparison we re-ran the analysis using the AICc, which produces results similar to SURFACE (Ingram, et al. 2013), the first method designed to test for shared evolutionary trait regimes. We performed these methods on the PC scores with a maximum of 50 shifts, and calculated support for each shift by running 1000 bootstrap iterations. Results Hypothesis 1 - Multiple independent origins of habitat use Under both models, more time was spent in a terrestrial state, nearly double the time of 113
122 any other state, and each habitat state independently evolved multiple times, with terrestriality, fossorialism, and arboreality evolving more frequently, under both models (Table 3.2 & Table 3.3). The best-fit model selected for broad habitat use (p < 0.001, AICc = ) and for specific habitat use (p < 0.001, AICc = ) was ARD. Based on the posterior distribution of 1000 simulated trees, there were approximately state changes for the 9-state model and state changes for the 28-state model. The phylogeny used here comprised 552 terrestrial snakes, 406 arboreal snakes, 432 subterranean snakes, and 182 aquatic snakes, which culminated in branches in the simulated stochastic mapped trees spending more time in terrestrial, arboreal, and subterranean character states than in aquatic states. As expected, habitat state changes were most frequent between closely-associated habitat states such as terrestrial to fossorial and arboreal, and rare between inaccessible habitat states, such as from fossorial to most other states, and amongst aquatic, arboreal, and fossorial states. Stochastic character mapping estimated the MRCA of extant snakes as 99.7% fossorial in broad habitat use (Fig. 3.1), and as 99.8% subterranean-burrower in specific habitat use (Fig. 3.2). For Alethinophidia, the MRCA was estimated as 99.7% and 100% terrestrial in broad and specific habitat use, respectively. In general, character states for the majority of nodes were unambiguous for both models (i.e., characterized by one character state). Hypothesis 2 - Morphospace variation based on habitat association When plotting morphological variation based on specific habitat use (Fig. 3.3), species of different habitat associations widely overlapped in morphospace, and did not form clearly defined groups, indicating that habitat associations as defined in this paper, are not identified by 114
123 Table 3.2. Summary of character state changes for 9 categories of general habitat use based on the all-rates-different model (p< 0.001, AICc = ) replicated over 1000 stochastically mapped trees. There were approximately character changes. Percentages exemplify the amount of time spent in each character state. Transitions are read on the horizontal, not the vertical. Posterior probabilities estimated the root node of snakes as being 99.7% fossorial. Habitat Use Fossorial (15.77%) Semifossorial (14.15%) Semiaquatic (2.58%) Freshwater (3.05%) Habitat Use Marine (1.61%) Aquatic- Mixed (2.06%) Terrestrial (36.29%) Semiarboreal (4.81%) Arboreal (19.68%) Fossorial Semifossorial Semiaquatic Freshwater Marine Aquatic-Mixed Terrestrial Semiarboreal Arboreal Total
124 Table 3.3. Summary of character state changes for 28 categories of specific habitat use based on the all-rates-different model (p< 0.001, AICc = ) replicated over 1000 stochastically mapped trees. There were approximately character changes. Percentages exemplify the amount of time spent in each character state. Transitions are read on the horizontal, not the vertical. Posterior probabilities estimated the root node of snakes as being 99.8% subterranean-burrower in habit. Habitat Use Subterranean- Burrower (12.41%) Soil- Burrower (3.29%) Sand- Burrower (2.16%) Subterranean- Debris (7.70%) Subterranean- Rock (0.42%) Lentic (0.02%) 116 Habitat Use Aquatic- Freshwater (3.50%) Freshwater- Burrower (0.49%) Aquatic- Mixed (0.60%) Aquatic- Mixed- Burrower (0.44%) Riverine (0.00%) Amphibious (0.36%) Subterranean-Burrower Soil-Burrower Sand-Burrower Subterranean-Debris Subterranean-Rock Lentic Aquatic-Freshwater Freshwater-Burrower Aquatic-Mixed Aquatic-Mixed-Burrower Riverine Amphibious Intertidal Intertidal-Burrower Coastal Reef-Flat Coral-Reefs Deep-Water Pelagic Terrestrial Terrestrial-Fossorial Terrestrial-Aquatic Terrestrial-Scansorial Terrestrial-Arboreal GeneralistI Intertidal (0.55%) Intertidal- Burrower (0.23%)
125 Table 3.3 Continued. GeneralistII GeneralistIII Arboreal Total Table 3.3. Continued. Habitat Use Coastal (0.69%) Reef- Flat (0.22%) Coral- Reefs (0.04%) Deep- Water (0.10%) Pelagic (0.02%) Terrestrial (36.73%) Terrestrial- Fossorial (3.50%) 117 Habitat Use Terrestrial- Aquatic (2.02%) Terrestrial- Scansorial (3.84%) Terrestrial- Arboreal (7.44%) GeneralistI (0.38%) GeneralistII (0.19%) GeneralistIII (0.17%) Subterranean-Burrower Soil-Burrower Sand-Burrower Subterranean-Debris Subterranean-Rock Lentic Aquatic-Freshwater Freshwater-Burrower Aquatic-Mixed Aquatic-Mixed-Burrower Riverine Amphibious Intertidal Intertidal-Burrower Coastal Reef-Flat Coral-Reefs Deep-Water Pelagic Terrestrial Arboreal (12.47%)
126 Table. 3.3 Continued. Terrestrial-Fossorial Terrestrial-Aquatic Terrestrial-Scansorial Terrestrial-Arboreal GeneralistI GeneralistII GeneralistIII Arboreal Total
 replicated over 1000 trees. Posterior probabilities estimated the root node of snakes as being 99.7% fossorial. Outgroups are not included. specific, unique morphologies.")

127 Figure 3.1. Stochastic character mapping of 9-state snake habitat use. Ancestral state estimation on 9-states of snake habitat use based on the all-rates-different model (p < 0.001, AICc = ) replicated over 1000 trees. Posterior probabilities estimated the root node of snakes as being 99.7% fossorial. Outgroups are not included. specific, unique morphologies. Arboreal and terrestrial snakes occupied the largest area of morphospace, with most arboreal species loading on the bottom right hemisphere of the plot and most terrestrial species loading on the middle of the plot. Aquatic and subterranean snakes occupied the bottom left hemisphere and the upper right portion. The first two components of the PCA explained 85.73% of the variation in morphology, with the first PC summarizing variation in body width and head shape, and PC2 explaining variation primarily in tail length and eye diameter (Table 3.4). Ward's hierarchical cluster analysis resulted in two major clusters demonstrating broad overlap in morphospace 119
 replicated over 1000 trees. Posterior probabilities estimated the root node of snakes as being 99.8% subterranean-burrower in specific habitat. Outgroups are not included.")
. Cluster 1 represents thicker species with large heads and eyes, and longer tails.")
128 Figure 3.2. Stochastic character mapping of 28-state snake habitat use. Ancestral state estimation on 9-states of snake habitat use based on the all-rates-different model (p < 0.001, AICc = ) replicated over 1000 trees. Posterior probabilities estimated the root node of snakes as being 99.8% subterranean-burrower in specific habitat. Outgroups are not included. and supporting the PCA analysis (Fig. 3.4). The two clusters differ significantly in morphology (Wilks λ = 0.445, F1, 403 = , p < 0.001) in both PCs (PC1: F1, 403 = , p < 0.001; PC2: F1, 403 = 47.22, p < 0.001). Cluster 1 represents thicker species with large heads and eyes, and longer tails. Since hierarchical clustering results in a dendrogram with numerous branches, to recognize subclusters of morphologically similar species, we arbitrarily extracted 19 subclusters corresponding to the number of habitat associations in the PCA (Fig. 3.3) using the command rect.hclust. The subclusters did not 120
129 equate to habitat associations, but distantly-related species from similar habitat associations did form several clades within different subclusters suggesting morphological convergence. The 19 subclusters also differ significantly in morphology (Wilks λ = 0.734, F1, 403 = 72.81, p < 0.001), but only in PC1 (F1, 403 = , p < 0.001), with species from the second cluster loading lower on PC1. Figure 3.3. PCA plot showing morphospace for first two PCs of size-corrected traits for 405 snakes colored by specific habitat use. Habitat associations are according to Table 3.1. Hypothesis 3 Morphological convergence in snakes Pattern-based convergence analysis on the morphological clusters from the hierarchical analysis resulted in C1 values that ranged from to 0.707, indicating that for all subclusters except one, species were morphologically similar and that taxa within those subclusters were able to close over 50% of the evolutionary distance separating them, and all were significantly convergent (Table 3.5), supporting cluster assignment from the hierarchical cluster analysis. Each subcluster was also defined by high C2 values, over 1.0 in many cases, suggesting the magnitude of evolutionary change was high. 121
130 C3 and C4 values were essentially the same for each subcluster, with convergence only accounting for less than 0.60% of the total evolution in each subcluster from their recent common ancestor, and for less than 0.70% of the total evolution in the smallest clade containing the taxa represented in each subcluster (Table 3.5). On the other hand, C5 values varied considerably between subclusters, ranging from 12 to 43, but none was significant, specifying that numerous lineages cross over into the morphological space of the subclusters (Table 3.5), as demonstrated by the broad overlap in morphospace (Fig. 3.3). The best-fitting pbic model (pbic = ) identified six adaptive regime shifts, of which all were unique and none were convergent (Table 3.6). Both PCs supported each shift, but not each shift received high bootstrap support (Fig. 3.5A). The six adaptive shifts occurred in three major clades, Viperidae, Elapidae, and Dipsadinae, with four shifts occurring in Elapidae. Most of these taxa are subterranean or terrestrial in habits, suggesting they are utilizing the morphological adaptive landscape differently and are diverging in morphology. In comparison, the AICc model (AICc = ) identified 39 adaptive regime shifts, of which five were unique and 11 were convergent (Table 3.6). Similar to the pbic model, shifts were supported by both PCs and not all shifts received high bootstrap support (Fig. 3.5B). Adaptive and convergent shifts occurred in species from almost every major clade and from various habitat associations. Convergent shifts even occurred between species from different habitat associations, supporting the findings from the PCA and hierarchical cluster analysis that species from different habitat associations overlap and cluster together. Again, a large number of shifts occurred within Elapidae, but not all taxa were subterranean or terrestrial. As demonstrated in Khabbazian et al. (2016), the pbic model was more conservative in identifying shifts than the AICc model used in SURFACE. 122
131 Table 3.4. Principal component loadings on snout-vent-length corrected residuals of nine external morphological characters. The first two principal components accounted for 85.73% of the total variation. PC1 represents body width and head shape, and PC2 represents tail and eye shape. Variable PC1 PC2 Tail Length Mid-Body Width Head Length Jaw Length Head Width Head Depth Interocular Distance Eye Diameter Eigenvalue % Variation Explained 70.73% 15.00% Figure 3.4. Hierarchical clustering dendrogram of 405 snakes and boxplots of first two principal components for 19 subclusters. Hierarchical clustering analysis resulted in two major clusters, labeled on the plot. 123
132 Table 3.5. Similarity- (C1-C4) and frequency-based (C5) convergence measures for snakes. C1 = the proportion of the maximum distance between focal taxa that has been closed by evolution; C2 = C1 while accounting for the magnitude of change; C3 = the amount of evolution attributable to convergence between focal taxa; C4 = the amount of evolution attributable to convergence to the smallest clade containing these focal taxa; and C5 = quantifies the number of lineages that have evolved into a certain region of morphospace and counts the number of lineages entering the region of the morphospace occupied by the hypothesized convergent taxa. Higher C values correspond to greater convergence. Significance tests are for C1 and C5, and significant P-values are displayed in bold. Subclusters Convergence values C1 p C2 C3 C4 C5 p Subcluster < Subcluster < Subcluster < Subcluster < Subcluster < Subcluster < Subcluster < Subcluster < Subcluster < Subcluster < Subcluster < Subcluster < Subcluster < Subcluster < Subcluster < Subcluster < Subcluster < Subcluster < Subcluster <
133 Table 3.6. List of adaptive and convergent regimes and their associated taxa as identified by l1ou for pbic and AICc model. The pbic model resulted in 6 adaptive regimes, of which 0 were convergent. The AICc model resulted in 39 adaptive regimes, of which 11 were convergent. Convergent regimes are highlighted in bold. Adaptive Peak Taxa Convergent Regime pbic 1) Trimeresurus popeiorum 1 2) Hemachatus haemachatus 2 3) Acanthophis antarcticus 3 4) Furina diadema, F. ornata, Simoselaps anomalus, S. bertholdi, Brachyurophis semifasciatus, Denisonia devisi, Elapognathus coronatus, Cryptophis nigrescens, Suta monachus, S. fasciata, S. suta, Vermicella calonotus, Hemiaspis signata, H. damelii, Echiopsis curta, Drysdalia mastersii, D. coronoides, Austrelaps superbus, Tropidechis carinatus, Notechis scutatus, Hoplocephalus stephensii, H. bitorquatus, H. bungaroides 5) Vermicella intermedia 6 6) Sibynomorphus neuwiedi 4 AICc 1) Ungaliophis continentalis, U. panamensis 1 2) Corallus ruschenbergerii, C. hortulanus, C. cookii 7 3) Chilabothrus angulifer, C. fordii, C. chrysogaster, C. striatus 15 4) Xenopeltis unicolor, Morelia viridis 1 5) Pareas boulengeri 13 6) Trimeresurus gramineus 11 7) Trimeresurus hageni, T. nebularis, T. fucatus, T. stejnegeri, T. 9 purpureomaculatus 8) Trimeresurus popeiorum 4 9) Trimeresurus insularis 2 10) Ophryacus undulatus 10 11) Bitia hydroides, Cantoria violacea, Fordonia leucobalia 8 12) Gerarda prevostiana 6 13) Compsophis infralineatus, C. laphystius 13 14) Micrurus corallinus 13 15) Ophiophagus hannah, D. jamesoni, D. angusticeps, D. polylepis 9 16) Hemachatus haemachatus 5 17) Pseudohaje goldii 2 18) Naja mossambica 2 19) Naja haje 2 20) Demansia psammophis, D. vestigiata 15 21) Demansia papuensis 11 22) Acanthophis antarcticus 6 23) Pseudonaja modesta
134 Table 3.6 Continued. 24) Furina diadema, F. ornata, Simoselaps anomalus, S. bertholdi, Brachyurophis 7 semifasciatus, Denisonia devisi, Elapognathus coronatus, Cryptophis nigrescens, Suta monachus, S. fasciata, S. suta, Vermicella calonotus, Hemiaspis signata, H. damelii, Echiopsis curta, Drysdalia mastersii, D. coronoides, Austrelaps superbus, Tropidechis carinatus, Notechis scutatus, Hoplocephalus stephensii, H. bungaroides 25) Vermicella intermedia 8 26) Hoplocephalus bitorquatus 16 27) Heterodon platirhinos, H. simus 12 28) Imantodes inornatus 11 29) Sibynomorphus mikanii 8 30) Sibynomorphus turgidus 2 31) Sibynomorphus ventrimaculatus 2 32) Sibynomorphus neuwiedi 3 33) Tropidodryas striaticeps, T. serra 12 34) Thamnodynastes pallidus 13 35) Philodryas baroni 14 36) Philodryas argentea 6 37) Uromacer catesbyi 10 38) Crotaphopeltis tornieri, C. hotamboeia 12 39) Oxybelis fulgidus 11 Discussion Habitat Use Habitat use is an important source of biological variation because shifts into novel habitats sets the stage for morphological and cladogenic diversification as species are challenged by new selective regimes (Schluter 2000; Yoder, et al. 2010). Since morphology is highly correlated with ecology (Williams 1972; Arnold 1983; Losos 1990), similarities in habitat use acts as a predictor of convergence in morphology and other life-history traits. Stochastic character mapping supports earlier studies (Bellairs and Underwood 1951; Shine and Wall 2008; Yi and Norell 2015), strongly pointing to a subterranean origin, heavily influenced by the 126
 pbic model. B) AICc model.")
135 Figure 3.5. Morphological convergent adaptive regimes identified by l1ou for 405 snakes. Pruned time-constrained phylogeny and bar graphs showing evolutionary shift configurations for first two principal components. A) pbic model. B) AICc model. Colored branches illustrate taxa undergoing shift in adaptive regime and black/grey branches depicting non-adaptive regimes. Shifts are marked by a star and shift magnitude in the optimum trait value for each PC. 127
136 phylogenetic position of Scolecophidia. Indeed, a burrowing origin is often implicated as the catalyst for many of the features that characterize snakes (reviewed in Shine and Wall 2008). From this fossorial condition, snakes transitioned into terrestrial habits at the base of Alethinophidia, and encountered ecological opportunity providing them with new and more plentiful resources, especially since the morphology of snakes allow them to exploit prey not readily accessible to other predators (Gans 1975; Pough 1983). As Alethinophidia diversified, snakes continued expanding into other habitats, even recolonizing subterranean habitats. Thus, diversification of habitat use, as shown by extant snakes, occurred after the rise of Alethinophidia coinciding with an explosion of snake diversity when snakes also diverged in all aspects of morphology, ecology, and behavior (see Chapter 2). Thus, as they radiated and filled niches, and communities continued to grow, more opportunities arose for species to adapt and diversify (Losos 2010). Furthermore, since snakes form species-dense communities, they may have created their own ecological opportunity (Erwin 2008; Losos 2010; Ricklefs 2010) by partitioning niches to limit competition (Toft 1985; Luiselli 2006). Nearly all habitat associations independently evolved multiple times, setting the stage for convergent evolution. Repeated evolution of certain habitat categories, such as arboreality, from comparatively accessible habitats, suggests that shifts into these habitat states may not require drastic changes in morphology. Since most transitions transpired to or away from terrestrial habitats, terrestrial snakes may maintain a generalized morphology, favorable for adapting to changes in habitat state. This could partially explain why snakes of different habitat associations exhibited considerable overlap in morphospace. 128
137 Morphological Shape Variation The broad overlap in morphospace shows that snakes from different habitat associations share similar regions of the morphological landscape, indicating that habitat use is not directly tied to morphology. Variation in morphology derives from differences in functional performance in ecologically-relevant traits, and is expected to match the species environment (Arnold, 1983; Irschick and Garland, 2001). In other taxa, where species have been shown to form distinct morphological clusters related to habitat use, these taxa vary in their appendages such as length of antennae and pereopods in cave amphipods (Trontelj et al., 2012) and limb shape in various lizards (Losos, 1990 Revell et al., 2007; Goodman et al., 2008; Collar et al., 2010). Thus, it may be that the conserved body plan of snakes (i.e., elongate, cylindrical body with no limbs), which can only be altered in length, width, height, and head shape, is capable of performing within different functional environments, which is advantageous given that most species move across multiple environments. In this case, species evolve to either function effectively in multiple environments or specialize for a specific environment, potentially incurring tradeoffs (Bonnet et al., 2005). Perhaps the most functionally demanding activities for snakes are burrowing, climbing, and swimming, with some species possessing specialized traits such as small, solid heads in burrowers (Shine and Wall, 2008) and paddle tails in sea snakes (Aubret and Shine, 2008), which we do not examine here. However, most snakes are capable of at least climbing and swimming (Greene, 1997), and snake species generally have little need to burrow since they feed on prey not found in soils or use burrows from other animals for shelter. For instance, snakes traversing arboreal environments can cross gaps in the canopy by using the posterior portion of their elongate bodies to form loops or coils around branches for support, and using the anterior 129
138 portion of their body to extend and grasp substrate, instead of jumping like other wingless animals (Lillywhite and Henderson, 1993). Arboreal snakes have an advantage by having lighter bodies relative to snakes from other habitat associations (Pizzatto et al., 2007), precluding branches bending under their weight. Elongation and limblessness provides organisms with the advantage of moving more efficiently by using lateral undulation, the main type of locomotion in snakes, which they use to move in various contexts, including climbing and swimming (Gans, 1975; Astley and Jayne, 2009), eliminating the need for specialized locomotor modes, although snakes do use alternative modes of locomotion, including specialized modes, but these are not accompanied by major external morphological adaptations other than variations in scale shape or number (Gans, 1986; Greene, 1997). This may partially explain why variation in morphological shape was more prevalent in head shape. Given that the lack of limbs greatly reduces the number of quantitative characters related to locomotor performance, and traits associated with locomotion have not been clearly identified, it could be that the characters we measured are not functionally-relevant traits, nor do they adequately capture variation associated with locomotion. However, the role the lack of limbs and body elongation played early in snake evolution is undeniable (Gans, 1975; see Chapter 2), and is presumed to have provided snakes with the structural foundation to ingest large meals (Shine and Wall, 2008), which was the precursor for evolutionary changes in head shape. The lack of limbs constrains prey capture and handling, requiring snakes to swallow prey whole. As such, snakes are gape-limited predators, restricted in the size and shape of prey they can eat, and selection acts to decrease the time needed to swallow prey (Vincent et al., 2006). Accordingly, head shape is a strong determinant of diet (Savitzky, 1983). In other gape-limited organisms, such as fish, variation in morphology is also predominately concentrated at the 130
139 trophic level (Frédérich and Vandewalle, 2011; Mushick et al., 2012; Lobato et al., 2014). In those studies, morphological types are quite distinct, but morphology and trophic ecology are also associated with habitat use. Although, we did not examine diet, but previous studies examining head shape in snakes have demonstrated variation in head shape in relation to diet (Hampton, 2011) and convergence in species consuming similar prey (Fabre et al., 2016). However, we do not have an understanding of feeding functional diversity since performance studies of feeding in snakes is limited to aquatic species (Herrel et al., 2008). In aquatic taxa, head shape differs based on prey type and whether species use laterally- or frontally-directed strikes (Drummond, 1983; Young, 1991; Herrel et al., 2008) and distantly-related taxa have converged in head shape and strike type (Bilcke et al., 2006; Herrel et al., 2008). Yet, head shape, to a lesser degree, is also associated with habitat use, particularly for burrowing species (Fabre et al., 2016), and in other burrowing organisms (Navas et al., 2004; Barros et al., 2011), activity patterns (Fabre et al., 2016), sexual dimorphism (Vincent and Herrel, 2007), and predator defense (Dalbosco et al., 2012). Therefore, it is important to differentiate between conflicting signals of selection on head shape. A detailed comparative study of head shape in snakes has yet to be conducted, but in general, dietary generalists have wider and taller heads (Fabre et al., 2016), piscivorus species have longer and narrower heads (Herrel et al., 2008; Fabre et al., 2016), and those eating crustaceans have wide and tall heads with modified skulls and teeth, and small gapes for crushing prey (Fabre et al., 2016). Ultimately, selection on feeding biology culminated in many key innovations and shaped the diversity we witness today (see Chapter 2). 131
140 Morphological Convergence in Snakes Convergence in morphology develops when the number of ways to perform a certain function is limited (Herrel et al., 2008). In snakes, selection could favor divergence in morphological traits associated with head shape, due to variation in diet, rather than in characters related to locomotion. This distinction is important for two reasons: 1) niches are multidimensional, and species may converge in different aspects of a particular niche (Harmon et al., 2005); and 2) individual traits can evolve at different rates, such as head shape evolving faster than body shape in cichlids (Young et al., 2009). If diet indeed outweighs the importance of locomotion in establishing niche placement in snakes, morphological traits associated with diet may diverge more rapidly for reasons mentioned above. Convergence is often demonstrated when species cluster together in trait space (Harmon et al., 2005; Trontelj et al., 2012; Stayton, 2015). Our cluster analyses revealed that distantlyrelated species clustered in trait space, but clustering did not orient with habitat use. By testing convergence using two methods, a pattern-based and a process-based approach, we reached different conclusions regarding morphological convergence in snakes. The pattern-based approach tests that similar phenotypes evolved independently in multiple lineages (Stayton, 2015). Within each subcluster of the hierarchical analysis species were morphologically similar to each other, and this was supported by the distance-based measure of convergence. However, the phylomorphospace analysis as conducted under the frequency-based measure of convergence showed that numerous taxa invaded the morphospace of each subcluster, making convergence nonsignificant. This is likely due to the large number of species constituting each subcluster, making the region of morphospace for each subcluster large enough for more taxa to invade. 132
141 Recently, more focus has been placed on testing the process of adaptation in producing convergent evolution (Ingram and Mahler, 2013; Uyeda and Harmon, 2014; Bastide et al., 2015; Khabbazian et al., 2016). These methods test for evolved similarity due to adaptation by using patterns of morphological variation to estimate shifts in adaptive regimes on a phylogeny (Ingram and Mahler, 2013). Specifically, they test that taxa independently underwent similar adaptive shifts in trait evolution, and associate shifts to variation in ecology. Due to problems of model overfitting using the AIC criterion (Ho and Ané 2014), we tested shifts in adaptive regimes associated with habitat use using AIC and the more conservative, pbic criterion. Model fitting under the AIC criterion resulted in 39 adaptive regime shifts, with 11 being convergent, and the pbic resulted in only six adaptive regime shifts, with none being convergent. Regime shifts appear throughout the entire phylogeny under the AIC criterion, but is focused primarily in subterranean elapids under the pbic criterion. Inspection of hierarchical subclusters show that taxa considered convergent using the AIC model do not all cluster together. Lack of convergent shifts indicate that taxa with similar ecologies may have not yet reached the same adaptive peaks (Friedman et al. 2016) or multiple dimensions of niche have not been captured in our dataset (Harmon et al., 2005). Conclusions Snakes arose from a fossorial origin and diversification in habitat use ensued after the rise of Alethinophidia, with several habitat categories evolving numerous times. Variation in morphological shape overlaps broadly in snakes making it difficult to classify species habitat use based on morphology. Therefore, an appropriate understanding of habitat use requires adequate 133
142 field studies quantifying a species spatial ecology. Morphological variation is largely associated with head shape, most likely related to divergence in diet than in habitat use. Snakes feed on various types of prey that encompass different sizes and shapes (Colston et al., 2010), and incorporate different prey-handling mechanisms (Cundall and Greene, 2000), yet it is unknown how these relate to head shape. Geometric morphometrics is superior at capturing more of the functionally important variation (Adams et al., 2004) in head features and should be adopted to more adequately provide insight into the diversity of feeding systems in snakes. Furthermore, since snakes form species-dense communities, it would be interesting to examine body shape and ecological functional diversity within communities to see how snakes partition these axes because convergent evolution seems prominent in species-dense communities where species exceed the number of available niches (terhorst et al., 2010). Acknowledgements We would like to acknowledge the curators and staff at the following museums for providing us with lab space: American Museum of Natural History, New York (AMNH), Academy of Natural Sciences (ANSP), California Academy of Sciences (CAS), Field Museum of Natural History (FMNH), Los Angeles County Natural History Museum (LACM), Lee Kong Chian Natural History Museum (LKCNHM), LSU Museum of Natural Science (LSUMNS), Harvard University Museum of Comparative Zoology (MCZ). We also want to thank Liam Revell (phytools), Cécile Ané and Mohammad Khabbazian ('l1ou), and Tristan Stayton (convevol) for providing help with their respective R packages. This research was funded by the following grants to A.F.: Jessup Fellowship from ANSP, Charles Stearns Memorial Grant-In-Aid 134
143 from CAS, FMNH Collections Study Grant, and National Science Foundation East Asia & Pacific Summer Institute (OISE ). 135
144 References Adams DC, Rohlf FJ, Slice DE Geometric morphometrics: ten years of progress following the revolution. Italian Journal of Zoology, 71:5 16. Arbuckle K, Bennett CM, Speed MP, Münkemüller T A simple measure of the strength of convergent evolution. Methods in Ecology and Evolution 5: Arnold SJ Morphology, performance and fitness. American Zoologist 23: Bellairs AA, Underwood G The origin of snakes. Biological Reviews 26: Brischoux F, Shine R Morphological adaptations to marine life in snakes. J Morphol 272: Byrnes G, Jayne BC Gripping during climbing of arboreal snakes may be safe but not economical. Biol Lett 10. Colston TJ, Costa GC, Vitt LJ Snake diets and the deep history hypothesis. Biological Journal of the Linnean Society 101: Donley JM, Sepulveda CA, Konstantinidis P, Gemballa S, Shadwick RE Convergent evolution in mechanical design of lamnid sharks and tunas. Nature 429: Erwin DH Macroevolution of ecosystem engineering, niche construction and diversity. Trends Ecol Evol 23: Gans C The feeding mechanism of snakes and its possible evolution. Integrative and Comparative Biology 1: Gans C Tetrapod limblessness: evolution and functional corollaries. American Zoologist 15:
145 Greene HW, Fogden M, Fogden P Snakes: the evolution of mystery in nature: Univ of California Press. Grundler MC, Rabosky DL Trophic divergence despite morphological convergence in a continental radiation of snakes. Proceedings of the Royal Society of London B: Biological Sciences 281: Harmon LJ, Kolbe JJ, Cheverud JM, Losos JB Convergence and the multidimensional niche. Evolution 59: Harmon LJ, Weir JT, Brock CD, Glor RE, Challenger W GEIGER: investigating evolutionary radiations. Bioinformatics 24: Harvey PH, Pagel MD The comparative method in evolutionary biology: Oxford university press Oxford. Henderson RW, Binder MH The ecology and behavior of vine snakes (Ahaetulla, Oxybelis, Thelotornis, Uromacer): A Review: Milwaukee Public Museum Press. Ho LST, Ané C Intrinsic inference difficulties for trait evolution with Ornstein Uhlenbeck models. Methods in Ecology and Evolution 5: Hoffstetter R, Gasc J-P Vertebrae and ribs of modern reptiles. Biology of the Reptilia 1: Hsiang AY, Field DJ, Webster TH, Behlke AD, Davis MB, Racicot RA, Gauthier JA The origin of snakes: revealing the ecology, behavior, and evolutionary history of early snakes using genomics, phenomics, and the fossil record. BMC Evol Biol 15:87. Huelsenbeck JP, Nielsen R, Bollback JP Stochastic mapping of morphological characters. Syst Biol 52:
146 Ingram T, Mahler DL, Hansen T SURFACE: detecting convergent evolution from comparative data by fitting Ornstein-Uhlenbeck models with stepwise Akaike Information Criterion. Methods in Ecology and Evolution 4: Khabbazian M, Kriebel R, Rohe K, Ané C Fast and accurate detection of evolutionary shifts in Ornstein-Uhlenbeck models. In: Wiley Online Library. King R Predicted and observed maximum prey size snake size allometry. Functional Ecology 16: Lillywhite H, Henderson R Behavioral and functional ecology of arboreal snakes. Snakes: ecology and behavior:1-48. Lillywhite H, LaFrentz J, Lin Y, Tu M-C The cantilever abilities of snakes. Journal of Herpetology: Lindell L The evolution of vertebral number and body size in snakes. Functional Ecology: Losos JB Adaptive radiation, ecological opportunity, and evolutionary determinism. Am Nat 175: Losos JB Ecomorphology, performance capability, and scaling of West Indian Anolis lizards: an evolutionary analysis. Ecological Monographs: Losos JB Lizards in an evolutionary tree: ecology and adaptive radiation of anoles: Univ of California Press. Losos JB, Jackman TR, Larson A, de Queiroz K, Rodrı guez-schettino L Contingency and determinism in replicated adaptive radiations of island lizards. Science 279: Luiselli L Resource partitioning and interspecific competition in snakes: the search for general geographical and guild patterns. Oikos 114:
147 Mahler DL, Ingram T, Revell LJ, Losos JB Exceptional convergence on the macroevolutionary landscape in island lizard radiations. Science 341: Maina J What it takes to fly: the structural and functional respiratory refinements in birds and bats. Journal of Experimental Biology 203: Moermond TC Habitat constraints on the behavior, morphology, and community structure of Anolis lizards. Ecology: Ozanne C, Anhuf D, Boulter S, Keller M, Kitching R, Körner C, Meinzer F, Mitchell A, Nakashizuka T, Dias PS Biodiversity meets the atmosphere: a global view of forest canopies. Science 301: Pennell MW, FitzJohn RG, Cornwell WK A simple approach for maximizing the overlap of phylogenetic and comparative data. Methods in Ecology and Evolution. Pianka ER Niche overlap and diffuse competition. Proceedings of the National Academy of Sciences 71: Pizzatto L, Almeida-Santos SM, Shine R Life-history adaptations to arboreality in snakes. Ecology 88: Pough FH Feeding mechanisms, body size, and the ecology and evolution of snakes. Introduction to the symposium. American Zoologist 23: Rand AS Ecological distribution in anoline lizards of Puerto Rico. Ecology: Reinert H Habitat selection in snakes. Snakes: ecology and behavior: Reinert HK Radiotelemetric field studies of pitvipers: data acquisition and analysis. Biology of the pitvipers: Revell LJ phytools: an R package for phylogenetic comparative biology (and other things). Methods in Ecology and Evolution 3:
148 Richman AD, Price T Evolution of ecological differences in the Old World leaf warblers. Nature 355: Ricklefs RE Evolutionary diversification, coevolution between populations and their antagonists, and the filling of niche space. Proceedings of the National Academy of Sciences 107: Ricklefs RE, Travis J A morphological approach to the study of avian community organization. The Auk: Schluter D The ecology of adaptive radiation: OUP Oxford. Schoener TW Resource partitioning in ecological communities. Science 185: Shaw DC Vertical organization of canopy biota. Forest canopies, 2nd edn. Elsevier, London: Shine R, Wall M Interactions between locomotion, feeding, and bodily elongation during the evolution of snakes. Biological Journal of the Linnean Society 95: Smith, S.A., O Meara, B.C., TreePL: divergence time estimation using penalized likelihood for large phylogenies. Bioinformatics 28, Stayton CT What does convergent evolution mean? The interpretation of convergence and its implications in the search for limits to evolution. Interface Focus 5: Team RDC R In: R Project for Statistical Computing Vienna, Austria. terhorst CP, Miller TE, Powell E When can competition for resources lead to ecological equivalence? Evol. Ecol. Res. 12: Toft CA Resource partitioning in amphibians and reptiles. Copeia:1-21. Uetz P, Hošek J The Reptile Database In. 140
149 Williams EE The origin of faunas. Evolution of lizard congeners in a complex island fauna: a trial analysis. In. Evol Biol: Springer. p Yi H, Norell MA The burrowing origin of modern snakes. Science advances 1:e Yoder JB, Clancey E, Des Roches S, Eastman JM, Gentry L, Godsoe W, Hagey TJ, Jochimsen D, Oswald BP, Robertson J, et al Ecological opportunity and the origin of adaptive radiations. J Evol Biol 23:
150 Supporting Information Table S3.1. Habitat use of sampled snakes. Taxonomic nomenclature follows the current classification indexed in the Reptile Database ( For some species, references may reflect outdated taxonomic status. Individual species are coded for habitat association according to Table 3.1. References for this table are listed below. Habitat use for species without a reference were inferred from sister taxa. File 3.1. Description of substituted taxa. 142
151 Chapter 4. Striking from a Limb: Context, Morphology, and Strike Performance in a Prehensile-tailed Arboreal Snake, Corallus hortulanus Abstract Whole-organism performance varies with ecological and behavioural context and arboreal environments place unique functional demands on organisms, whereby animals must remain stable while negotiating complex, precarious surfaces at often considerable heights. We measured strike performance under two behavioural contexts, predatory and defensive, in an arboreal snake, Corallus hortulanus, to determine if acceleration, velocity, and target distance differ between individuals that use their prehensile tails to perch compared with those that have their tails constrained. We test the hypothesis that prehensile tails provide arboreal snakes with an anchor for support from which they can launch fast strikes and incorporate their entire trunk in striking such that more distance is covered between the snake and its target. Furthermore, we posit that predatory and defensive strike kinematics is affected differently by tail constraints. Prehensile tails did not allow snakes to strike with greater velocity and acceleration. However, during defensive strikes, acceleration greatly decreased in trials when their tails were constrained relative to unconstrained trials. Treeboas also launched predatory strikes at significantly shorter distances than defensive strikes, suggesting that acceleration is maximized and maintained 143
152 during predatory strikes to cover shorter distances quicker. This study demonstrates that behavioural and ecological context both contribute to observed variation in striking performance, and highlights the dynamic role of morphology in determining performance in different contexts. 144
153 Introduction An organism s morphology is fashioned by selection to meet functional demands imposed by its environment. Structural habitat is particularly important because it varies both within and among different environments, thereby challenging an organism s performance in different contexts (Rand 1964; Irschick & Losos 1999). The three-dimensional configuration of arboreal environments is especially challenging since surfaces used by organisms for support and locomotion vary in size, mass, density, and incline, and are often interspersed with gaps and obstructions. Maneuvering and performing ecological tasks within this habitat thus requires operating with great stability. Consequently, arboreal organisms exhibit traits such as claws and toe pads (Cartmill 1974; Hanna & Barnes, 1991; Irschick et al. 1996; Wolff & Gorb 2014), modified limbs for grasping (Manzano et al. 2008; Herrel et al. 2012; Sustaita et al. 2013), and prehensile tails (Emmons& Gentry 1983) which aid them in navigating these complex environments and enable other key performance traits. Whole-organism performance (i.e. measurements of individuals conducting dynamic, ecologically relevant behaviors such as jumping, flying, or biting; Lailvaux & Husak 2014) provides a direct and intuitive link with survival and fitness, and is therefore subject to a variety of selection pressures (Husak& Fox 2008; Irschick et al. 2008). However, the importance and utility of a particular performance trait varies depending on ecological context (Irschick and Garland, 2001). For example, Crotaphytus collaris lizards do not always move at their maximum sprint capacities in nature, and will modify their speed depending on whether they are foraging, escaping from a predator, or defending a territory (Husak& Fox, 2006). Given that individuals may alter the kinetic or kinematic aspects of a given performance trait depending on the scenario 145
154 at hand, ecological context is likely to be an important contributor to overall variation in the evolution and expression of whole-organism performance capacities. Striking is a performance trait used by a variety of organisms during several important ecological contexts, most commonly predation and defense. Within snakes, for example, strikes occur either in the course of a predation attempt (Kardong 1986; Vincent et al. 2005; Cundall et al. 2007) or as a defensive mechanism against a perceived threat (Whitaker et al. 2000; LaDuc 2002; Herrel et al. 2011). Accordingly, predatory and defensive strikes have different causes and consequences and are thus likely subject to different selection pressures which may diverge or converge (Lailvaux& Kasumovic 2011). For example, venomous snakes meter and expend different quantities of venom depending on strike context (Hayes et al. 2002). Striking is used predominately by ambush foragers that feed on active, mobile prey (Huey& Pianka 1981) where a quick, unforeseen attack (but see devries et al. 2012) is necessary to provide an element of surprise and thereby increase prey capture success. For ambush predators feeding on highly evasive prey, their predatory strikes are accompanied by fast acceleration to minimize the time prey has to escape (Higham 2007). However, some taxa have also evolved prey immobilization techniques such (i.e., constriction, envenomation, webbing, etc.) to mitigate the threat of prey retaliation and increase prey capture. Strike success may be less important in defensive strikes since it functions primarily to encourage predators to keep their distance, as evidenced by mock strikes (Whitaker et al. 2000; Figueroa personal observation). As such, distance to target is likely a key component in striking, and should differ depending on whether snakes are attempting to maximize prey capture or deter predators. While acceleration and velocity may also vary between strike types, we currently lack a proper understanding of the kinematic differences between predatory and defensive strikes. 146
155 Kinematic analyses of the strikes of terrestrial snakes show a contrast between: 1) a kinematically active region of snake morphology that exhibits changes in posture and displacement; and 2) a kinematically fixed region that experiences no displacement, but instead serves to establish a secure purchase with the ground to accelerate and generate high momentum of the active region towards strike targets (Kardong& Bels 1998; Cundall 2002). Consequently, fast strikers exhibit modifications to these two areas, specifically reduction of mass in their anterior regions that attain the highest velocity, and increase in mass of their posterior regions (Cundall 2002). Since snakes engage a considerable portion of their trunk in striking, they require a stable support from which to launch and propel their strikes. Prehensile tails were accompanied by lengthening of the tail and independently evolved in arboreal descendants of heavy-body terrestrial taxa with short tails (viz., boas, pythons, and vipers; Feldman & Meiri 2013) and likely function to provide adequate support to launch rapid strikes and also provide the advantage of freeing up the entire trunk for use in striking (Herrel et al. 2011). However, arboreal environments may hinder strike performance since many supports (i.e., thin/short/weak branches or leaves) are unstable and do not provide a reliable foundation for launching a strike. Given the potential for kinematic variation between strike types, particularly with regard to target distance, it may be that prehensile tails are used to a greater or lesser extent in predatory versus defensive strikes. Thus far, no study has explicitly tested the direct functional role of prehensile tails in affecting strike kinematics in arboreal snakes. Although previous studies have examined strike behaviour in arboreal snakes with prehensile tails (Shine et al. 2002; Herrel et al. 2011) and one on a non-arboreal snake with a prehensile tail (Smith et al. 2002), neither of these studies considered whether prehensile tails influence strike kinematics. 147
156 We tested whether predatory and defensive strike kinematics differ between Corallus hortulanus (Linnaeus 1758) that were able to use their prehensile tails for perching compared with those that were experimentally prevented from using their prehensile tails during the extension phase (i.e., period from initiation of forward movement to target contact; Kardong & Bels 1998). We prevented snakes from using their tails by constraining their tails with wooden dowels. We were specifically interested in addressing the following three hypotheses: 1) Prehensile tails affect general strike performance by allowing snakes to strike with greater velocity and acceleration; 2) Prehensile tail constraint affects predatory and defensive strike kinematics differently; and 3) Distance to targets are shorter in predatory strikes than defensive strikes. Materials and methods Snakes and husbandry We tested strike performance in 15 male C. hortulanus acquired through a commercial supplier. Previous studies of snake strike kinematics achieved significant results with similar or lower sample sizes (LaDuc 2002; Vincent et al, 2005; Young 2010). Each snake was maintained within separate 10 ga. glass aquariums with bark mulch substrate, a wooden dowel perch, and a heat source (75W light bulb) on a 12L:12D photoperiod. We provided snakes with water ad libitum and fed them freshly-killed mice once a week. Upon acquisition, we measured each snake s snout-vent length (SVL) to the nearest 0.01 cm using digital Mitutoyo calipers (Chicago, 148
157 IL, USA), and weighed individual snakes to the nearest 0.05 g using a Pesola scale (Barr, Switzerland). Tail Treatment To test the effect prehensile tails have on strike performance and prey capture, we tested each individual using two treatments: 1) unconstrained (Fig. 4.1A); and 2) constrained (Fig. 4.1B). For the constrained treatment, we splinted each snake s tail by taping two, thin wooden dowels to the lateral sides of the tail from the cloaca to the tail tip. After filming the trials, the wooden dowels were removed and reattached before subsequent constrained trials. Kinematics The trial arena consisted of a 92x32x43 cm glass aquarium where we placed snakes on a wooden dowel perch elevated 20 cm above the aquarium floor. All strikes were oriented parallel to the length of the aquarium and along the horizontal plane. For predatory strikes, we placed a single live mouse in the aquarium and allowed it to roam freely. We chose this experimental design because previous accounts on treeboas report them as striking prey from above in the wild (Henderson 2002; Yorks et al. 2003). For defensive strikes, we waved a glove in front of the snakes. We filmed snakes for defensive strikes at least every other day with no more than five defensive strikes for each snake per day, and at least once a week for predatory strikes. The project design resulted in four treatments: 1) unconstrained-predatory strike; 2) unconstraineddefensive strike; 3) constrained-predatory strike; and 4) constrained-defensive strike. 149
 and the three axes to")
 Photograph capturing predatory strike of a snake with tail unconstrained. Colored squares in the background were used to calibrate distance in ProAnalyst.")
158 Figure 4.1. Photographs captured from video stills showing the lateral and ventral views (mirror mounted above the snake at 45 relative to the cage floor) and the three axes to facilitate three-dimensional analyses of predatory and defensive strikes of adult male Corallus hortulanus. A) Photograph capturing predatory strike of a snake with tail unconstrained. Colored squares in the background were used to calibrate distance in ProAnalyst. B) Photograph captured from video still showing the lateral and ventral views (mirror mounted above the snake at 45 relative to the cage floor) of a defensive strike and showing splinted tail (labelled in photograph). A z-axis y-axis x-axis B Splint 150
CLADISTICS Student Packet SUMMARY Phylogeny Phylogenetic trees/cladograms
 CLADISTICS Student Packet SUMMARY PHYLOGENETIC TREES AND CLADOGRAMS ARE MODELS OF EVOLUTIONARY HISTORY THAT CAN BE TESTED Phylogeny is the history of descent of organisms from their common ancestor. Phylogenetic
Lecture 11 Wednesday, September 19, 2012
 Lecture 11 Wednesday, September 19, 2012 Phylogenetic tree (phylogeny) Darwin and classification: In the Origin, Darwin said that descent from a common ancestral species could explain why the Linnaean
Dynamic evolution of venom proteins in squamate reptiles. Nicholas R. Casewell, Gavin A. Huttley and Wolfgang Wüster
 Dynamic evolution of venom proteins in squamate reptiles Nicholas R. Casewell, Gavin A. Huttley and Wolfgang Wüster Supplementary Information Supplementary Figure S1. Phylogeny of the Toxicofera and evolution
Introduction to phylogenetic trees and tree-thinking Copyright 2005, D. A. Baum (Free use for non-commercial educational pruposes)
") Introduction to phylogenetic trees and tree-thinking Copyright 2005, D. A. Baum (Free use for non-commercial educational pruposes) Phylogenetics is the study of the relationships of organisms to each other.
Introduction to phylogenetic trees and tree-thinking Copyright 2005, D. A. Baum (Free use for non-commercial educational pruposes) Phylogenetics is the study of the relationships of organisms to each other.
Phylogeny of snakes (Serpentes): combining morphological and molecular data in likelihood, Bayesian and parsimony analyses
: combining morphological and molecular data in likelihood, Bayesian and parsimony analyses") Systematics and Biodiversity 5 (4): 371 389 Issued 20 November 2007 doi:10.1017/s1477200007002290 Printed in the United Kingdom C The Natural History Museum Phylogeny of snakes (Serpentes): combining morphological
Systematics and Biodiversity 5 (4): 371 389 Issued 20 November 2007 doi:10.1017/s1477200007002290 Printed in the United Kingdom C The Natural History Museum Phylogeny of snakes (Serpentes): combining morphological
Phylogenomics of Snakes
 Jeffrey W Streicher, Department of Life Sciences, The Natural History Museum, London, UK Sara Ruane, Department of Biological Sciences, Rutgers University, Newark, New Jersey, USA Advanced article Article
Testing Phylogenetic Hypotheses with Molecular Data 1
 Testing Phylogenetic Hypotheses with Molecular Data 1 How does an evolutionary biologist quantify the timing and pathways for diversification (speciation)? If we observe diversification today, the processes
Species: Panthera pardus Genus: Panthera Family: Felidae Order: Carnivora Class: Mammalia Phylum: Chordata
 CHAPTER 6: PHYLOGENY AND THE TREE OF LIFE AP Biology 3 PHYLOGENY AND SYSTEMATICS Phylogeny - evolutionary history of a species or group of related species Systematics - analytical approach to understanding
Modern Evolutionary Classification. Lesson Overview. Lesson Overview Modern Evolutionary Classification
 Lesson Overview 18.2 Modern Evolutionary Classification THINK ABOUT IT Darwin s ideas about a tree of life suggested a new way to classify organisms not just based on similarities and differences, but
This article appeared in a journal published by Elsevier. The attached copy is furnished to the author for internal non-commercial research and
 This article appeared in a journal published by Elsevier. The attached copy is furnished to the author for internal non-commercial research and education use, including for instruction at the authors institution
An Initial Estimate toward Identifying and Numbering Extant Tuatara, Amphisbaena, and Snake Kinds
 Answers Research Journal 7 (2014):31 47. www.answersingenesis.org/arj/v7/tuatara-amphisbaena-snake-kinds.pdf An Initial Estimate toward Identifying and Numbering Extant Tuatara, Amphisbaena, and Snake
INQUIRY & INVESTIGATION
 INQUIRY & INVESTIGTION Phylogenies & Tree-Thinking D VID. UM SUSN OFFNER character a trait or feature that varies among a set of taxa (e.g., hair color) character-state a variant of a character that occurs
Peng GUO 1, 2*, Qin LIU 1, 2, Jiatang LI 3, Guanghui ZHONG 2, Yueying CHEN 3 and Yuezhao WANG Introduction. 2. Material and Methods
 Asian Herpetological Research 2012, 3(4): 334 339 DOI: 10.3724/SP.J.1245.2012.00334 Catalogue of the Type Specimens of Amphibians and Reptiles in the Herpetological Museum of the Chengdu Institute of Biology,
UNIT III A. Descent with Modification(Ch19) B. Phylogeny (Ch20) C. Evolution of Populations (Ch21) D. Origin of Species or Speciation (Ch22)
 B. Phylogeny (Ch20) C. Evolution of Populations (Ch21) D. Origin of Species or Speciation (Ch22)") UNIT III A. Descent with Modification(Ch9) B. Phylogeny (Ch2) C. Evolution of Populations (Ch2) D. Origin of Species or Speciation (Ch22) Classification in broad term simply means putting things in classes
UNIT III A. Descent with Modification(Ch9) B. Phylogeny (Ch2) C. Evolution of Populations (Ch2) D. Origin of Species or Speciation (Ch22) Classification in broad term simply means putting things in classes
The Making of the Fittest: LESSON STUDENT MATERIALS USING DNA TO EXPLORE LIZARD PHYLOGENY
 The Making of the Fittest: Natural The The Making Origin Selection of the of Species and Fittest: Adaptation Natural Lizards Selection in an Evolutionary and Adaptation Tree INTRODUCTION USING DNA TO EXPLORE
Bayesian mixed models and the phylogeny of pitvipers (Viperidae: Serpentes)
") Molecular Phylogenetics and Evolution 39 (2006) 91 110 www.elsevier.com/locate/ympev Bayesian mixed models and the phylogeny of pitvipers (Viperidae: Serpentes) Todd A. Castoe, Christopher L. Parkinson
Molecular Phylogenetics and Evolution 39 (2006) 91 110 www.elsevier.com/locate/ympev Bayesian mixed models and the phylogeny of pitvipers (Viperidae: Serpentes) Todd A. Castoe, Christopher L. Parkinson
muscles (enhancing biting strength). Possible states: none, one, or two.
. Possible states: none, one, or two.") Reconstructing Evolutionary Relationships S-1 Practice Exercise: Phylogeny of Terrestrial Vertebrates In this example we will construct a phylogenetic hypothesis of the relationships between seven taxa
Reconstructing Evolutionary Relationships S-1 Practice Exercise: Phylogeny of Terrestrial Vertebrates In this example we will construct a phylogenetic hypothesis of the relationships between seven taxa
Bio 1B Lecture Outline (please print and bring along) Fall, 2006
 Fall, 2006") Bio 1B Lecture Outline (please print and bring along) Fall, 2006 B.D. Mishler, Dept. of Integrative Biology 2-6810, bmishler@berkeley.edu Evolution lecture #4 -- Phylogenetic Analysis (Cladistics) -- Oct.
Bio 1B Lecture Outline (please print and bring along) Fall, 2006 B.D. Mishler, Dept. of Integrative Biology 2-6810, bmishler@berkeley.edu Evolution lecture #4 -- Phylogenetic Analysis (Cladistics) -- Oct.
 Volume 49(11):115 153, 2009 www.mz.usp.br/publicacoes www.revistasusp.sibi.usp.br www.scielo.br/paz Molecular phylogeny of advanced snakes (Serpentes, Caenophidia) with an emphasis on South American Xenodontines:
Diversification rates are more strongly related to microhabitat than climate in squamate reptiles (lizards and snakes)
") ORIGINAL ARTICLE doi:10.1111/evo.13305 Diversification rates are more strongly related to microhabitat than climate in squamate reptiles (lizards and snakes) Melissa Bars-Closel, 1,2 Tiana Kohlsdorf, 1
ORIGINAL ARTICLE doi:10.1111/evo.13305 Diversification rates are more strongly related to microhabitat than climate in squamate reptiles (lizards and snakes) Melissa Bars-Closel, 1,2 Tiana Kohlsdorf, 1
Phylogeny Reconstruction
 Phylogeny Reconstruction Trees, Methods and Characters Reading: Gregory, 2008. Understanding Evolutionary Trees (Polly, 2006) Lab tomorrow Meet in Geology GY522 Bring computers if you have them (they will
Geo 302D: Age of Dinosaurs LAB 4: Systematics Part 1
 Geo 302D: Age of Dinosaurs LAB 4: Systematics Part 1 Systematics is the comparative study of biological diversity with the intent of determining the relationships between organisms. Humankind has always
Which Came First: The Lizard or the Egg? Robustness in Phylogenetic Reconstruction of Ancestral States
 RESEARCH ARTICLE Which Came First: The Lizard or the Egg? Robustness in Phylogenetic Reconstruction of Ancestral States APRIL M. WRIGHT 1 *, KATHLEEN M. LYONS 1, MATTHEW C. BRANDLEY 2,3, AND DAVID M. HILLIS
History of Lineages. Chapter 11. Jamie Oaks 1. April 11, Kincaid Hall 524. c 2007 Boris Kulikov boris-kulikov.blogspot.
 History of Lineages Chapter 11 Jamie Oaks 1 1 Kincaid Hall 524 joaks1@gmail.com April 11, 2014 c 2007 Boris Kulikov boris-kulikov.blogspot.com History of Lineages J. Oaks, University of Washington 1/46
1 EEB 2245/2245W Spring 2014: exercises working with phylogenetic trees and characters
 1 EEB 2245/2245W Spring 2014: exercises working with phylogenetic trees and characters 1. Answer questions a through i below using the tree provided below. a. The sister group of J. K b. The sister group
Sparse Supermatrices for Phylogenetic Inference: Taxonomy, Alignment, Rogue Taxa, and the Phylogeny of Living Turtles
 Syst. Biol. 59(1):42 58, 2010 c The Author(s) 2009. Published by Oxford University Press, on behalf of the Society of Systematic Biologists. All rights reserved. For Permissions, please email: journals.permissions@oxfordjournals.org
17.2 Classification Based on Evolutionary Relationships Organization of all that speciation!
 Organization of all that speciation! Patterns of evolution.. Taxonomy gets an over haul! Using more than morphology! 3 domains, 6 kingdoms KEY CONCEPT Modern classification is based on evolutionary relationships.
Molecular Systematics and Evolution of Regina and the Thamnophiine Snakes
 Molecular Phylogenetics and Evolution Vol. 21, No. 3, December, pp. 408 423, 2001 doi:10.1006/mpev.2001.1024, available online at http://www.idealibrary.com on Molecular Systematics and Evolution of Regina
Monograph. ZOOTAXA
 Zootaxa 3829 (1): 001 081 www.mapress.com/zootaxa/ Copyright 2014 Magnolia Press Monograph http://dx.doi.org/10.11646/zootaxa.3829.1.1 http://zoobank.org/urn:lsid:zoobank.org:pub:75210cdc-ac6a-4624-a6f1-1bc969bc7caa
Title: Phylogenetic Methods and Vertebrate Phylogeny
 Title: Phylogenetic Methods and Vertebrate Phylogeny Central Question: How can evolutionary relationships be determined objectively? Sub-questions: 1. What affect does the selection of the outgroup have
Evaluating Fossil Calibrations for Dating Phylogenies in Light of Rates of Molecular Evolution: A Comparison of Three Approaches
 Syst. Biol. 61(1):22 43, 2012 c The Author(s) 2011. Published by Oxford University Press, on behalf of the Society of Systematic Biologists. All rights reserved. For Permissions, please email: journals.permissions@oup.com
Phylogeographic assessment of Acanthodactylus boskianus (Reptilia: Lacertidae) based on phylogenetic analysis of mitochondrial DNA.
 based on phylogenetic analysis of mitochondrial DNA.") Zoology Department Phylogeographic assessment of Acanthodactylus boskianus (Reptilia: Lacertidae) based on phylogenetic analysis of mitochondrial DNA By HAGAR IBRAHIM HOSNI BAYOUMI A thesis submitted in
Zoology Department Phylogeographic assessment of Acanthodactylus boskianus (Reptilia: Lacertidae) based on phylogenetic analysis of mitochondrial DNA By HAGAR IBRAHIM HOSNI BAYOUMI A thesis submitted in
Cladistics (reading and making of cladograms)
") Cladistics (reading and making of cladograms) Definitions Systematics The branch of biological sciences concerned with classifying organisms Taxon (pl: taxa) Any unit of biological diversity (eg. Animalia,
Cladistics (reading and making of cladograms) Definitions Systematics The branch of biological sciences concerned with classifying organisms Taxon (pl: taxa) Any unit of biological diversity (eg. Animalia,
Introduction to Cladistic Analysis
 3.0 Copyright 2008 by Department of Integrative Biology, University of California-Berkeley Introduction to Cladistic Analysis tunicate lamprey Cladoselache trout lungfish frog four jaws swimbladder or
The phylogenetic distribution of the ampulla ureter and ampulla urogenital uriniferous papilla in the Serpentes
 Accepted on 20 April 2010 J Zool Syst Evol Res doi: 10.1111/j.1439-0469.2010.00576.x 1 Department of Biology, Saint Louis University, St Louis, MO; 2 Department of Biological Sciences, Arkansas State University,
COUNTING VENTRAL SCALES IN ASIAN ANILIOID SNAKES
 HERPETOLOGICAL JOURNAL, Vol. 16, pp. 259-263 (2006) COUNTING VENTRAL SCALES IN ASIAN ANILIOID SNAKES DAVID J. GOWER AND JONATHAN D. ABLETT Department of Zoology, The Natural History Museum, London, UK
A review of the systematics and taxonomy of Pythonidae: an ancient serpent lineage
 bs_bs_banner Zoological Journal of the Linnean Society, 2015. With 8 figures A review of the systematics and taxonomy of Pythonidae: an ancient serpent lineage DAVID G. BARKER 1, TRACY M. BARKER 1, MARK
GEODIS 2.0 DOCUMENTATION
 GEODIS.0 DOCUMENTATION 1999-000 David Posada and Alan Templeton Contact: David Posada, Department of Zoology, 574 WIDB, Provo, UT 8460-555, USA Fax: (801) 78 74 e-mail: dp47@email.byu.edu 1. INTRODUCTION
Molecular phylogeny of elapid snakes and a consideration of their biogeographic history
 Biological Journal of the Linnean Society (1998), 63: 177 203. With 4 figures Molecular phylogeny of elapid snakes and a consideration of their biogeographic history J. SCOTT KEOGH 1 School of Biological
Fig Phylogeny & Systematics
 Fig. 26- Phylogeny & Systematics Tree of Life phylogenetic relationship for 3 clades (http://evolution.berkeley.edu Fig. 26-2 Phylogenetic tree Figure 26.3 Taxonomy Taxon Carolus Linnaeus Species: Panthera
LABORATORY EXERCISE 7: CLADISTICS I
 Biology 4415/5415 Evolution LABORATORY EXERCISE 7: CLADISTICS I Take a group of organisms. Let s use five: a lungfish, a frog, a crocodile, a flamingo, and a human. How to reconstruct their relationships?
5 Anilius scytale 6 Boa constrictor 7 Boa constrictor 8 Corallus batesii ANILIIDAE BOIDAE BOIDAE BOIDAE
 1 Contact: Ross@BiodiversityGroup.org [fieldguides.fieldmuseum.org] [890] version 1: 5/2017 (Juv.) = juvenile; = male; = female; ** = first country record in Ecuador - Authors maintain rights for all photographs
Department of Biology, University of Central Florida, 4000 Central Florida Blvd., Orlando, FL 32816, USA 2
 Zoological Journal of the Linnean Society, 2009, 156, 617 640. With 2 figures Morphological and molecular evidence for phylogeny and classification of South American pitvipers, genera Bothrops, Bothriopsis,
COMPARING DNA SEQUENCES TO UNDERSTAND EVOLUTIONARY RELATIONSHIPS WITH BLAST
 COMPARING DNA SEQUENCES TO UNDERSTAND EVOLUTIONARY RELATIONSHIPS WITH BLAST In this laboratory investigation, you will use BLAST to compare several genes, and then use the information to construct a cladogram.
Molecular Phylogenetics and Evolution
 Molecular Phylogenetics and Evolution 59 (2011) 623 635 Contents lists available at ScienceDirect Molecular Phylogenetics and Evolution journal homepage: www.elsevier.com/locate/ympev A multigenic perspective
These small issues are easily addressed by small changes in wording, and should in no way delay publication of this first- rate paper.
 Reviewers' comments: Reviewer #1 (Remarks to the Author): This paper reports on a highly significant discovery and associated analysis that are likely to be of broad interest to the scientific community.
Ch 1.2 Determining How Species Are Related.notebook February 06, 2018
 Name 3 "Big Ideas" from our last notebook lecture: * * * 1 WDYR? Of the following organisms, which is the closest relative of the "Snowy Owl" (Bubo scandiacus)? a) barn owl (Tyto alba) b) saw whet owl
Comparing DNA Sequences Cladogram Practice
 Name Period Assignment # See lecture questions 75, 122-123, 127, 137 Comparing DNA Sequences Cladogram Practice BACKGROUND Between 1990 2003, scientists working on an international research project known
TOPIC CLADISTICS
 TOPIC 5.4 - CLADISTICS 5.4 A Clades & Cladograms https://upload.wikimedia.org/wikipedia/commons/thumb/4/46/clade-grade_ii.svg IB BIO 5.4 3 U1: A clade is a group of organisms that have evolved from a common
What are taxonomy, classification, and systematics?
 Topic 2: Comparative Method o Taxonomy, classification, systematics o Importance of phylogenies o A closer look at systematics o Some key concepts o Parts of a cladogram o Groups and characters o Homology
LABORATORY EXERCISE 6: CLADISTICS I
 Biology 4415/5415 Evolution LABORATORY EXERCISE 6: CLADISTICS I Take a group of organisms. Let s use five: a lungfish, a frog, a crocodile, a flamingo, and a human. How to reconstruct their relationships?
Comparing DNA Sequence to Understand
 Comparing DNA Sequence to Understand Evolutionary Relationships with BLAST Name: Big Idea 1: Evolution Pre-Reading In order to understand the purposes and learning objectives of this investigation, you
A New Species of the Genus Elaphe (Squamata: Colubridae) from Zoige County, Sichuan, China
 from Zoige County, Sichuan, China") Asian Herpetological Research 2012, 3(1): 38 45 DOI: 10.3724/SP.J.1245.2012.00038 A New Species of the Genus Elaphe (Squamata: Colubridae) from Zoige County, Sichuan, China Song HUANG 1, 2, 3*, Li DING
Asian Herpetological Research 2012, 3(1): 38 45 DOI: 10.3724/SP.J.1245.2012.00038 A New Species of the Genus Elaphe (Squamata: Colubridae) from Zoige County, Sichuan, China Song HUANG 1, 2, 3*, Li DING
COMPARING DNA SEQUENCES TO UNDERSTAND EVOLUTIONARY RELATIONSHIPS WITH BLAST
 Big Idea 1 Evolution INVESTIGATION 3 COMPARING DNA SEQUENCES TO UNDERSTAND EVOLUTIONARY RELATIONSHIPS WITH BLAST How can bioinformatics be used as a tool to determine evolutionary relationships and to
6. The lifetime Darwinian fitness of one organism is greater than that of another organism if: A. it lives longer than the other B. it is able to outc
 1. The money in the kingdom of Florin consists of bills with the value written on the front, and pictures of members of the royal family on the back. To test the hypothesis that all of the Florinese $5
Snake relationships revealed by slow-evolving proteins: a preliminary survey
 J. Zool. Lond. (1996) 240 1-28 Snake relationships revealed by slow-evolving proteins: a preliminary survey H. G. DOWLNG. C. A. HASS. 2. 3 S. BLAR HEDGES 2. 3 AND R. HGHTON 2 Rendalia Biologists Talladega
Python phylogenetics: inference from morphology and mitochondrial DNA
 Biological Journal of the Linnean Society, 2008, 93, 603 619. With 5 figures Python phylogenetics: inference from morphology and mitochondrial DNA LESLEY H. RAWLINGS, 1,2 DANIEL L. RABOSKY, 3 STEPHEN C.
Evolution of Birds. Summary:
 Oregon State Standards OR Science 7.1, 7.2, 7.3, 7.3S.1, 7.3S.2 8.1, 8.2, 8.2L.1, 8.3, 8.3S.1, 8.3S.2 H.1, H.2, H.2L.4, H.2L.5, H.3, H.3S.1, H.3S.2, H.3S.3 Summary: Students create phylogenetic trees to
A Mitochondrial DNA Phylogeny of Extant Species of the Genus Trachemys with Resulting Taxonomic Implications
 NOTES AND FIELD REPORTS 131 Chelonian Conservation and Biology, 2008, 7(1): 131 135 Ó 2008 Chelonian Research Foundation A Mitochondrial DNA Phylogeny of Extant Species of the Genus Trachemys with Resulting
ON COLOMBIAN REPTILES AND AMPHIBIANS COLLECTED BY DR. R. E. SCHULTES. By BENJAMIN SHREVE Museum of Comparative Zoology, cambridge, U. S. A.
 HERPETOLOGIA ON COLOMBIAN REPTILES AND AMPHIBIANS COLLECTED BY DR. R. E. SCHULTES By BENJAMIN SHREVE Museum of Comparative Zoology, cambridge, U. S. A. From Dr. Richard Evans Schultes, who has been engaged
Department of Biology, University of Central Florida, 4000 Central Florida Blvd, Orlando, Florida , USA 2
 Zoological Journal of the Linnean Society, 2007, 151, 809 831. With 5 figures Higher-level phylogeny of Asian and American coralsnakes, their placement within the Elapidae (Squamata), and the systematic
The Molecular Evolution of Snakes as Revealed by Mitogenomic Data DESIRÉE DOUGLAS
 The Molecular Evolution of Snakes as Revealed by Mitogenomic Data DESIRÉE DOUGLAS Department of Cell and Organism Biology Division of Evolutionary Molecular Systematics Lund University 2008 A doctoral
Molecular Phylogenetics of Squamata: The Position of Snakes, Amphisbaenians, and Dibamids, and the Root of the Squamate Tree
 Syst. Biol. 53(5):735 757, 2004 Copyright c Society of Systematic Biologists ISSN: 1063-5157 print / 1076-836X online DOI: 10.1080/10635150490522340 Molecular Phylogenetics of Squamata: The Position of
1 EEB 2245/2245W Spring 2017: exercises working with phylogenetic trees and characters
 1 EEB 2245/2245W Spring 2017: exercises working with phylogenetic trees and characters 1. Answer questions a through i below using the tree provided below. a. Identify the taxon (or taxa if there is more
DATA SET INCONGRUENCE AND THE PHYLOGENY OF CROCODILIANS
 Syst. Biol. 45(4):39^14, 1996 DATA SET INCONGRUENCE AND THE PHYLOGENY OF CROCODILIANS STEVEN POE Department of Zoology and Texas Memorial Museum, University of Texas, Austin, Texas 78712-1064, USA; E-mail:
The following two passages are both tough biology texts. Use them for additional practice with difficult Natural Science passages in the Reading
 The following two passages are both tough biology texts. Use them for additional practice with difficult Natural Science passages in the Reading section. PASSAGE 1 45 NATURAL SCIENCE: 5 10 15 20 25 30
Bioinformatics: Investigating Molecular/Biochemical Evidence for Evolution
 Bioinformatics: Investigating Molecular/Biochemical Evidence for Evolution Background How does an evolutionary biologist decide how closely related two different species are? The simplest way is to compare
The phylogeny and classification of caenophidian snakes inferred from seven nuclear protein-coding genes
 C. R. Biologies 330 (2007) 182 187 http://france.elsevier.com/direct/crass3/ Evolution / Évolution The phylogeny and classification of caenophidian snakes inferred from seven nuclear protein-coding genes
HAWAIIAN BIOGEOGRAPHY EVOLUTION ON A HOT SPOT ARCHIPELAGO EDITED BY WARREN L. WAGNER AND V. A. FUNK SMITHSONIAN INSTITUTION PRESS
 HAWAIIAN BIOGEOGRAPHY EVOLUTION ON A HOT SPOT ARCHIPELAGO EDITED BY WARREN L. WAGNER AND V. A. FUNK SMITHSONIAN INSTITUTION PRESS WASHINGTON AND LONDON 995 by the Smithsonian Institution All rights reserved
Supplementary Materials for
 advances.sciencemag.org/cgi/content/full/1/10/e1500743/dc1 The PDF file includes: Supplementary Materials for The burrowing origin of modern snakes Hongyu Yi and Mark A. Norell Published 27 November 2015,
Systematics and taxonomy of the genus Culicoides what is coming next?
 Systematics and taxonomy of the genus Culicoides what is coming next? Claire Garros 1, Bruno Mathieu 2, Thomas Balenghien 1, Jean-Claude Delécolle 2 1 CIRAD, Montpellier, France 2 IPPTS, Strasbourg, France
Molecular Phylogenetics and Evolution
 Molecular Phylogenetics and Evolution 54 (2010) 150 161 Contents lists available at ScienceDirect Molecular Phylogenetics and Evolution journal homepage: www.elsevier.com/locate/ympev Phylogenetic relationships
Original language: English AC27 Doc CONVENTION ON INTERNATIONAL TRADE IN ENDANGERED SPECIES OF WILD FAUNA AND FLORA
 Original language: English AC27 Doc. 19.3 CONVENTION ON INTERNATIONAL TRADE IN ENDANGERED SPECIES OF WILD FAUNA AND FLORA Twenty-seventh meeting of the Animals Committee Veracruz (Mexico), 28 April 3 May
Article.
 Zootaxa 4040 (1): 031 047 www.mapress.com/zootaxa/ Copyright 2015 Magnolia Press Article http://dx.doi.org/10.11646/zootaxa.4040.1.3 http://zoobank.org/urn:lsid:zoobank.org:pub:0e373e9a-9e9c-42a3-8e73-75a365762d47
Original language: English PC22 Doc. 10 CONVENTION ON INTERNATIONAL TRADE IN ENDANGERED SPECIES OF WILD FAUNA AND FLORA
 Original language: English PC22 Doc. 10 CONVENTION ON INTERNATIONAL TRADE IN ENDANGERED SPECIES OF WILD FAUNA AND FLORA Twenty-second meeting of the Plants Committee Tbilisi (Georgia), 19-23 October 2015
Interpreting Evolutionary Trees Honors Integrated Science 4 Name Per.
 Interpreting Evolutionary Trees Honors Integrated Science 4 Name Per. Introduction Imagine a single diagram representing the evolutionary relationships between everything that has ever lived. If life evolved
Dipsas trinitatis (Trinidad Snail-eating Snake)
") Dipsas trinitatis (Trinidad Snail-eating Snake) Family: Dipsadidae (Rear-fanged Snakes) Order: Squamata (Lizards and Snakes) Class: Reptilia (Reptiles) Fig. 1. Trinidad snail-eating snake, Dipsas trinitatis.
Dipsas trinitatis (Trinidad Snail-eating Snake) Family: Dipsadidae (Rear-fanged Snakes) Order: Squamata (Lizards and Snakes) Class: Reptilia (Reptiles) Fig. 1. Trinidad snail-eating snake, Dipsas trinitatis.
Evolution of Agamidae. species spanning Asia, Africa, and Australia. Archeological specimens and other data
 Evolution of Agamidae Jeff Blackburn Biology 303 Term Paper 11-14-2003 Agamidae is a family of squamates, including 53 genera and over 300 extant species spanning Asia, Africa, and Australia. Archeological
Squamates of Connecticut. May 11th 2017
 Squamates of Connecticut May 11th 2017 Announcements Should have everyone s hypotheses in my inbox Did anyone else not receive my feedback? Assignment #3, Project Proposal, due tomorrow at 5pm Next week:
Evolution of Biodiversity
 Long term patterns Evolution of Biodiversity Chapter 7 Changes in biodiversity caused by originations and extinctions of taxa over geologic time Analyses of diversity in the fossil record requires procedures
Kazumi Matsubara 1,2,5*, Chizuko Nishida 3, Yoichi Matsuda 2,4 and Yoshinori Kumazawa 1
 Matsubara et al. Zoological Letters (2016) 2:19 DOI 10.1186/s40851-016-0056-1 RESEARCH ARTICLE Open Access Sex chromosome evolution in snakes inferred from divergence patterns of two gametologous genes
Required and Recommended Supporting Information for IUCN Red List Assessments
 Required and Recommended Supporting Information for IUCN Red List Assessments This is Annex 1 of the Rules of Procedure for IUCN Red List Assessments 2017 2020 as approved by the IUCN SSC Steering Committee
Snake body size frequency distributions are robust to the description of novel species
 Snake body size frequency distributions are robust to the description of novel species Bryan Maritz, 1,2, Mimmie Kgaditse, 2 and Graham John Alexander 2 1 Department of Biodiversity and Conservation Biology,
Phylogenetic relationships of horned lizards (Phrynosoma) based on nuclear and mitochondrial data: Evidence for a misleading mitochondrial gene tree
 based on nuclear and mitochondrial data: Evidence for a misleading mitochondrial gene tree") Molecular Phylogenetics and Evolution 39 (2006) 628 644 www.elsevier.com/locate/ympev Phylogenetic relationships of horned lizards (Phrynosoma) based on nuclear and mitochondrial data: Evidence for a misleading
Molecular Phylogenetics and Evolution 39 (2006) 628 644 www.elsevier.com/locate/ympev Phylogenetic relationships of horned lizards (Phrynosoma) based on nuclear and mitochondrial data: Evidence for a misleading
Caecilians (Gymnophiona)
") Caecilians (Gymnophiona) David J. Gower* and Mark Wilkinson Department of Zoology, The Natural History Museum, London SW7 5BD, UK *To whom correspondence should be addressed (d.gower@nhm. ac.uk) Abstract
Caecilians (Gymnophiona) David J. Gower* and Mark Wilkinson Department of Zoology, The Natural History Museum, London SW7 5BD, UK *To whom correspondence should be addressed (d.gower@nhm. ac.uk) Abstract
Parallel selective pressures drive convergent diversification of phenotypes in pythons and boas
 LETTER Ecology Letters, (2016) 19: 800 809 doi: 10.1111/ele.12620 Parallel selective pressures drive convergent diversification of phenotypes in pythons and boas Damien Esquerre* and J. Scott Keogh Division
8/19/2013. Topic 5: The Origin of Amniotes. What are some stem Amniotes? What are some stem Amniotes? The Amniotic Egg. What is an Amniote?
 Topic 5: The Origin of Amniotes Where do amniotes fall out on the vertebrate phylogeny? What are some stem Amniotes? What is an Amniote? What changes were involved with the transition to dry habitats?
Subdomain Entry Vocabulary Modules Evaluation
 Subdomain Entry Vocabulary Modules Evaluation Technical Report Vivien Petras August 11, 2000 Abstract: Subdomain entry vocabulary modules represent a way to provide a more specialized retrieval vocabulary
Dissecting the major African snake radiation: a molecular phylogeny of the Lamprophiidae Fitzinger (Serpentes, Caenophidia)
") Zootaxa 1945: 51 66 (2008) www.mapress.com/zootaxa/ Copyright 2008 Magnolia Press ISSN 1175-5326 (print edition) ZOOTAXA ISSN 1175-5334 (online edition) Dissecting the major African snake radiation: a
Zootaxa 1945: 51 66 (2008) www.mapress.com/zootaxa/ Copyright 2008 Magnolia Press ISSN 1175-5326 (print edition) ZOOTAXA ISSN 1175-5334 (online edition) Dissecting the major African snake radiation: a
Squamates of Connecticut
 Squamates of Connecticut Reptilia Turtles are sisters to crocodiles and birds Yeah, birds are reptiles, haven t you watched Jurassic Park yet? Lizards and snakes are part of one clade called the squamates
MULTIGENE PHYLOGENETIC ANALYSIS OF PITVIPERS, WITH COMMENTS ON THEIR BIOGEOGRAPHY
 MULTIGENE PHYLOGENETIC ANALYSIS OF PITVIPERS, WITH COMMENTS ON THEIR BIOGEOGRAPHY CHRISTOPHER L. PARKINSON 1, JONATHAN A. CAMPBELL 2, AND PAUL T. CHIPPINDALE 2 ABSTRACT: Recent attempts to determine the
Horned lizard (Phrynosoma) phylogeny inferred from mitochondrial genes and morphological characters: understanding conflicts using multiple approaches
 phylogeny inferred from mitochondrial genes and morphological characters: understanding conflicts using multiple approaches") Molecular Phylogenetics and Evolution xxx (2004) xxx xxx MOLECULAR PHYLOGENETICS AND EVOLUTION www.elsevier.com/locate/ympev Horned lizard (Phrynosoma) phylogeny inferred from mitochondrial genes and morphological
Molecular Phylogenetics and Evolution xxx (2004) xxx xxx MOLECULAR PHYLOGENETICS AND EVOLUTION www.elsevier.com/locate/ympev Horned lizard (Phrynosoma) phylogeny inferred from mitochondrial genes and morphological
 This article was originally published in a journal published by Elsevier, and the attached copy is provided by Elsevier for the author s benefit and for the benefit of the author s institution, for non-commercial
Analysis of CR1 repeats in the zebra finch genome
 Analysis of CR1 repeats in the zebra finch genome George E. Liu, Yali Hou* and Twain Brown Bovine Functional Genomics Laboratory, ANRI, ARS, USDA, Beltsville, Maryland 20705, USA *Also affiliated with
Do the traits of organisms provide evidence for evolution?
 PhyloStrat Tutorial Do the traits of organisms provide evidence for evolution? Consider two hypotheses about where Earth s organisms came from. The first hypothesis is from John Ray, an influential British
PHYLOGENETIC TAXONOMY*
 Annu. Rev. Ecol. Syst. 1992.23:449~0 PHYLOGENETIC TAXONOMY* Kevin dd Queiroz Division of Amphibians and Reptiles, United States National Museum of Natural History, Smithsonian Institution, Washington,
Phylogenetic systematics, biogeography, and evolutionary ecology of the true crocodiles (Eusuchia: Crocodylidae: Crocodylus)
") Louisiana State University LSU Digital Commons LSU Master's Theses Graduate School 2007 Phylogenetic systematics, biogeography, and evolutionary ecology of the true crocodiles (Eusuchia: Crocodylidae:
Louisiana State University LSU Digital Commons LSU Master's Theses Graduate School 2007 Phylogenetic systematics, biogeography, and evolutionary ecology of the true crocodiles (Eusuchia: Crocodylidae:
K. L. SANDERS,*M.S.Y.LEE,* R. LEYS, R. FOSTER* & J. SCOTT KEOGHà. Abstract. Keywords: Introduction
 doi: 10.1111/j.1420-9101.2008.01525.x Molecular phylogeny and divergence dates for Australasian elapids and sea snakes (hydrophiinae): evidence from seven genes for rapid evolutionary radiations K. L.
Modern taxonomy. Building family trees 10/10/2011. Knowing a lot about lots of creatures. Tom Hartman. Systematics includes: 1.
 Modern taxonomy Building family trees Tom Hartman www.tuatara9.co.uk Classification has moved away from the simple grouping of organisms according to their similarities (phenetics) and has become the study
Systematics, Taxonomy and Conservation. Part I: Build a phylogenetic tree Part II: Apply a phylogenetic tree to a conservation problem
 Systematics, Taxonomy and Conservation Part I: Build a phylogenetic tree Part II: Apply a phylogenetic tree to a conservation problem What is expected of you? Part I: develop and print the cladogram there