Université Paris Descartes, 12 rue de l Ecole de Médecine Paris, France
|
|
|
- Kenneth Merritt
- 5 years ago
- Views:
Transcription
1 First posted online on 12 September 2012 as /jeb J Exp Biol Advance Access Online the most Articles. recent version First posted at online on 12 September 2012 as doi: /jeb Access the most recent version at 1 Transition from leg to wing forces during take-off in birds Pauline Provini 1, 2 ; Bret W. Tobalske 3 ; Kristen E. Crandell 3 ; Anick Abourachid 1 1 Muséum National d Histoire Naturelle, EGB, UMR 7179, 55 rue Buffon Paris, France 2 Université Paris Descartes, 12 rue de l Ecole de Médecine Paris, France 3 Field Research Station at Fort Missoula, Division of Biological Sciences, University of Montana, Missoula, MT 59812, USA Corresponding Author: P. Provini provini@mnhn.fr Telephone: Summary Take-off mechanics are fundamental to the ecology and evolution of flying animals. Recent research reveals that initial take-off velocity in birds is driven mostly by hindlimbs forces. However, the contribution of the wings during the transition to air is unknown. To investigate this transition, we integrated measures of both leg and wing forces during take-off and the first three wingbeats in zebra finch (Taeniopygia guttata, 15g, N=7) and diamond dove (Geopelia cuneata, 50g, N=3). We measured ground-reaction forces produced by the hindlimbs using a perch mounted on a force-plate, whole body and wing kinematics using high-speed video, and aerodynamic forces using particle image velocimetry (PIV). Take-off performance was generally similar between species. When birds were perched, an acceleration peak produced by the legs contributed to 85±1% of the whole body resultant acceleration in finch and 77±6% in dove. At lift-off, coincident with the start of the first downstroke, the percentage of hindlimb contribution to initial flight velocity was 93.6±0.6% 1 Copyright (C) Published by The Company of Biologists Ltd
2 in finch and 95.2±0.4% in dove. In finch, the first wingbeat produced 57.9±3.4% of the lift created during subsequent wingbeats compared to 62.5±2.2% in dove. Advance ratios were < 0.5 in both species, even when taking self-convection of shed vortices into account, so it was likely that wing-wake interactions dominated aerodynamics during wingbeats 2 and 3. These results underscore the relatively low contribution of the wings to initial take-off, and reveal a novel transitional role for the first wingbeat in terms of force production Key-words: Zebra finch (Taeniopygia guttata) Diamond dove (Geopelia cuneata) Force Take-off Hindlimb Forelimb Velocity Acceleration Particle image velocimetry (PIV) 45 2
3 Introduction Take-off initiates flight, and so plays a prominent role in the biology of flying birds. In living birds, take-off has an important function in predator-prey interactions, foraging, mate finding, and many other ecologically pertinent tasks. In addition, take-off was also a key component of the evolutionary origin of flight. Indeed, among the three main hypotheses proposed for the origin of flight in birds a transition between the substrate and the air is necessary before any possible kind of flight is accomplished, regardless of the substrate from which take-off takes place. These include the traditional arboreal versus cursorial origins, (Ostrom, 1974; Padian, 1987), and an alternative hypothesis involving wing assisted incline running (Dial, 2003). Thus, the debate about the origin of flight is closely linked to the ability to perform an effective take-off, and thus also to the contributions and coordination of the forelimbs and hindlimbs during this phase. To date, only a small number of studies have focused on the mechanics of take-off in extant birds (Simpson, 1983; Heppner and Anderson, 1985; Dial and Biewener, 1993b; Bonser and Rayner, 1996; Tobalske et al., 2004; Berg and Biewener, 2010) and even fewer have done so in the context of the origin of avian flight (Gatesy and Dial, 1993; Earls, 2000; Dial et al., 2008). Furthermore, the majority of studies that have explored take-off in extant birds have either emphasized aerial performance and consequently focused on the use of wings during take-off (Norberg and Norberg, 1971; Simpson, 1983; Heppner and Anderson, ; Tobalske and Dial, 2000; Askew, 2001; Berg and Biewener, 2010) or have focused on the legs exclusively (Heppner and Anderson, 1985; Bonser and Rayner, 1996). Only two studies have considered both locomotor systems during take-off (Earls, 2000; Tobalske et al., 2004). Kinematic and force plate analyses of birds with very different body shape and ecology (European starling (Sturnus vulgaris); Japanese quail (Coturnix coturnix) and rufous hummingbird (Selasphorus rufus), reveal that the hindlimbs rather than 3
4 the forelimbs are the primary accelerators during take-off. Because these prior studies have shown that the hindlimbs dominate, our effort in the present study is to compare in greater detail the relative contributions of legs and wings to take-off performance. Here, we directly measure the contribution to force production of both legs and wings to gain an understanding of the interaction between legs and wings in reference to timing and aerodynamic forces. We chose two species for our investigation: zebra finch (Taeniopygia guttata) and diamond dove (Geopelia cuneata) because of their dissimilar wing shapes and upstroke kinematics. Zebra finches are passerine birds with rounded wings of low aspect ratio. They present a highly flexed posture during upstroke, commonly named a feathered upstroke (Tobalske et al., 1999; Tobalske et al., 2003). In contrast, diamond doves are columbids, have a pointed, high aspect-ratio wing, and use a tip-reversal upstroke during slow flight (Tobalske et al., 2003). We hypothesized this variation in wing kinematics may be crucial, as positioning the wings during the first upstroke appears to play a prominent role in the initial phase of take-off. Tip-reversal upstroke may enhance aerodynamic force production at this critical phase, even prior to the first downstroke. Indeed, it has been found that wings of birds using a tip-reversal upstroke (as pigeons, rock dove, Columba livia) are capable of producing substantial aerodynamic forces in the upstroke posture (Crandell and Tobalske, 2011). Moreover, pigeons can generate aerodynamic forces during tip-reversal upstroke in low speed turns (Ros et al., 2011) We combined kinematic and dynamic analyses with particle image velocimetry (PIV) focusing on the first three wingbeats after lift-off. Previous analysis of starling and quail (Earls, 2000) measured take-off from a flat platform, which may heavily influence aerodynamic performance via complex interactions with the ground (Doligalski et al., 1994; Han and Cho, 2005). Thus our recordings were performed for a take-off from a perch. Our 4
5 95 96 novel exploration of aerodynamic performance will allow us to provide a more comprehensive understanding of the transition from terrestrial to aerial forces during take-off Materials and Methods Animals Seven zebra finch (Taeniopygia guttata; 15.4±1.8g, mean body mass (m) ± s.d.) and three diamond dove (Geopelia cuneata; 51.0±5.1g,) were purchased from commercial dealers, housed in flight cages, and provided with food and water ad libitum. Kinematics and force data collection were performed at the Muséum National d Histoire Naturelle in Paris for three of the seven zebra finches. Kinematics, force and particle image velocimetry (PIV) data collection were performed at the Field Research Station in Missoula, Montana, USA, for four zebra finch and all three diamond dove. The animals were trained to take-off from a perch at a climb angle of ~45 degrees. All care and experimental procedures were approved by the University of Montana IACUC. We obtained morphometrics of these animals using standard techniques with the wings spread as in mid-downstroke (Tobalske et al., 2004) (Table 1). Herein, we report single wing length (cm), body width between the wings (cm), single wing projected surface area (cm 2 ), average wing chord (calculated as the width of the wing at one third away from shoulder; cm), aspect ratio (wing span divided by average wing chord, dimensionless) and tarsometatarsus length (cm) Kinematics In Paris, four digital high-speed video cameras (AVT Pike F-032B, Alliance Vision Technologies, Stadtroda, Germany) were positioned around the perch and take-offs were recorded at 200 Hz with a shutter speed of 300µs. The cameras were set in lateral, dorsal, oblique-frontal and frontal views and the overlapping fields of view of the cameras enabled a 5
6 three-dimensional reconstruction of the bird s movements during take-off, as well as during three complete wingbeat cycles after take-off. A checkerboard composed of 81 squares of 10mm 10mm was used to calibrate the cameras and scale the images. A MatLab (R2011b, Mathworks, Inc., Natick, MA, USA) custom M-file (Loco 3.3, Paul-Antoine Libourel MNHN) was used to extract the edge of the animal (head, tail and wings excluded) and calculate the coordinates of the centre of gravity from this shape (Fig. S1). The tip of the 9 th primary of the left wing was digitized for the same trials. The digitization provided four sets of 2D coordinates for the centre of gravity and for the tip of the wing, used to calculate the 3D coordinates with a direct linear transform (DLT) routine (Hartley and Sturm, 1997). In Missoula, methods were similar, but we used four synchronized cameras, recording at 500 Hz and with a shutter speed of 143 µs. These included two Photron 1024 PCI (Photron, Inc., San Diego, CA, USA), one Photron SA-3, and one Phantom MiroEx4 (Vision Research Inc., Wayne, NJ, USA). The reconstruction of the centre of gravity of the shape formed by the edge of the bird was used as a proxy for the bird s centre of mass. A calculation of the actual centre of mass position using the multiple suspension method (Abourachid, 1993) for three zebra finches revealed that this centre of mass approximation was satisfactory: distance between the centre of gravity of the edge of the shape and the actual centre of mass: 6.4 mm ± 3.9, less than 7% of total length of the bird and less than 15% of maximal body width of the bird (Fig. S1). As birds flew within a vertical plane, approximately perpendicular to the perch, this point was used to calculate the two-dimensional trajectory of the animal (Fig. S2). The trajectory of the animals was imposed by perch placement, set 0.75 m apart and inclined so that a line connecting the perches would be at 45 degrees above horizontal. Otherwise, the chosen flight path was not constrained, and variability of both the trajectory and body angle was relatively small. The mean magnitude of absolute deviations from the trajectory was 6.7±3.2 cm and varied from zero to 13.5±3.3 cm for zebra finch. In diamond 6
7 dove, the mean magnitude of absolute deviations from the trajectory was 5.4±3.6 cm and varied from zero to 10.9±3.8 cm. Body orientation was 16±5 degrees from horizontal for the zebra finch and 21±4 degrees for diamond dove (Fig. S2). The component and resultant velocities (m.s -1 ) and accelerations (m.s -2 ) were calculated as the first and second derivatives of the trajectory, respectively. A MatLab (R2011b, The Mathworks, Inc., Natick, MA, USA) script allowed the reconstruction of the global orientation of the digitized shape, which was used to calculate the body angle (in degrees), corresponding to the angle between the body and the horizontal (Fig. S2). The vertical trajectory of the tip of the 9 th primary was used to define flight phases as it describes a succession of local maxima and minima that match upstroke/downstroke transition (USDS) and downstroke/upstroke transition (DSUS), respectively. The average of the wingbeat duration was calculated at different take-off phases. The beginning of the first upstroke was extracted (FW, first use of the wings ) as well as Lift-off (LO) corresponding to the last touch of the perch by the toes. In our analysis, take-off was divided into four phases (Fig. 1E): 1) start take-off (t 0 ) when the bird is motionless on the perch, with folded wings and initiates countermovement, 2) wing and leg extension when the bird is still on the perch, 3) first downstroke and foot loses contact with perch (lift off, LO), 4) subsequent wingbeats with leg retraction against the body. 164 We calculated resultant acceleration using kinematic data ( ), with gravitational 165 acceleration (g, 9.8 m s 2 ) added to the vertical kinematic component ( ): Where = forward kinematic acceleration and = lateral kinematic acceleration. We calculated average kinematic acceleration on the first upstroke duration (t up, in ms). (1) 169 Average was compared to resultant acceleration calculated from the average ground 7
8 170 reaction force ( see below) during this period. Resultant acceleration calculated from the 171 kinematics was also averaged on the duration of each wingbeat (t wb, in ms) from the start of 172 upstroke to the start of the next upstroke). This average was compared to resultant acceleration calculated using PIV data ( Ground-reaction forces see below). 176 In Paris, a wooden perch 1.5 cm in diameter and 8.5 cm long was mounted on a force platform (Kistler Squirrel force plate (Kistler France, Les Ulis, France, resolution ± 0.01N) with a top plate of 20cm 10cm and attached to a charge amplifier (Kistler type 9865). It was used to record the vertical and horizontal ground-reaction forces exerted on the perch at 400 Hz, using BioWare Software Version 4.0.x Type 2812A (Kistler France). The force perch in Montana was 1.3 cm in diameter, 7 cm long. It was covered in sandpaper to provide traction. The perch was mounted with its axis in line with the surface of a custom Bertec force plate (15 x 15 cm platform, 200 Hz resonant frequency, Bertec Corp., Columbus, OH, USA). Forces on the Bertec plate were digitally amplified 10x (Bertec AM6800) and recorded at 500 Hz using Chart software v4.5 (ADInstruments, Inc., Colorado Springs, CO, USA) and a Powerlab 8 SP A/D converter (ADInstruments Inc.). Forces were filtered using a zero phase shift low-pass (50Hz) Butterworth filter. The resultant acceleration, measured using the force plate ( was calculated: Where F x = forward force, F y = lateral force, F z = vertical force. For comparison with average during the first upstroke (i.e., during ground contact), we averaged on t up. (2) 8
9 To measure the relative hindlimb contribution to initial resultant flight velocity (i.e., percent of comprised by ) at lift off (LO), we followed the methods of Earls (Earls, 2000) 196 and integrated with respect to time (t) from the beginning of take-off (t 0 ) to LO: 197 (3) Particle Image Velocimetry (PIV) To compare aerodynamics with associated wingbeat kinematics, we used a synchronized high-speed video camera (Photron 1024 PCI (Photron USA Inc., San Diego, CA, USA)) sampling at 500 Hz, and located lateral to the animal. Data acquisition and analysis of PIV was performed using a LaVison GmBH (Goettingen, Germany) PIV system running DaVis 7.1 software. A dual-cavity pulsed 50-mJ Nd: YAG laser was used to illuminate a flow field of 3 mm thick, with planar dimensions spanning a field of cm. The illumination field was cranial to the bird, parasagittal and mid-wing at the middle of downstroke (Spedding et al., 2003; Warrick et al., 2005). We seeded the air with particles of olive oil (<1 µm in diameter) generated at a rate of particles s 1 using a vaporizer fitted with a Laskin nozzle. Particle illumination was recorded using a pixel, chargedcoupled-device (CCD) camera placed perpendicular to the illumination field, and PIV samples were obtained at 5 Hz. To calculate particle velocity, we used cross-correlation of paired images with an elapsed time between images ( t) of 500 µs. Average particle separation was 6 pixels in the centre of the animal s wake. We employed an adaptive multipass filter with an initial interrogation area of pixels and final area of pixels with 50% overlap. Vector fields were post processed using a median filter (strong removal if difference relative to average >3 r.m.s. of neighbours and iterative reinsertion if <3 r.m.s. of neighbours), removal of groups with <5 vectors, fill of all empty spaces by interpolation, and one pass of 3 3 smoothing. Subsequent analysis focused upon vortex cores. 9
10 We used streamlines, drawn with vectors expressed relative to average velocity, to inform our selection of regions of vorticity (ω, in s 1 ), which is a measure of local change in velocity in the flow field (Spedding et al. 2003). We treated as background noise and masked from subsequent analysis ω <3s.d. of ω in the free-stream. To measure circulation (Γ, m 2 s 1 ) in vortex cores, we used methods adapted from Spedding et al. (Spedding et al., 2003). We integrated all same-sign ω in a given PIV field within 1.5 chord lengths of peak ω to measure Γ (e.g., Fig. 3). We considered each negatively-signed vortex core deposited in the wake during early downstroke to represent the cross section of a starting vortex shed from the trailing edge of the wing, equal in magnitude but opposite in sign from the bound vortex on the wing as lift development began during downstroke. Similarly, we considered each positively signed vortex core deposited in the wake during late downstroke to represent the cross-section of an ending vortex shed from the trailing edge of the wing. We estimated average lift during the entire wingbeat (L) by coupling our PIV data with separately acquired three-dimensional kinematic data for the same test subjects ((Spedding et al., 2003; Warrick et al., 2005; Tobalske and Dial, 2007) see Kinematics, above). Note that L includes vertical (weight support) and horizontal (thrust) components. Average L was estimated: where ρ is air density (air density in Missoula at 1000 m in altitude is 1.06±0.01kg.m -3 ), A is the area swept by the two wings during each downstroke, not including the body, c is addedmass coefficient (Dabiri, 2005), S is average diameter of observed vortex cores, and V vort is self-induced vortex velocity (Dabiri, 2005). Following Spedding et al. (Spedding et al., 2003) and Warrick et al. (Warrick et al., 2005), we assumed that a single vortex loop shed per downstroke and that no contraction occurred during wake development. We assumed c=0.72 as the added-mass coefficient previously reported for an elliptical vortex (Dabiri, 2005). We 10
11 measured V vort as observed rate of translation of ωmax in the subset (N=37 for zebra finch and N=42 for diamond dove) of our PIV samples in which the same vortex core appeared in consecutive images. We also measured the magnitude and angle from horizontal for induced velocity (m s -1 ) in the middle of the shed vortices (Tobalske and Dial, 2007) We estimated average acceleration using the PIV data ( acceleration due to aerodynamic force produced during each wingbeat: ), which was the Advance ratio To provide insight into the potential for wing-wake interaction and other unsteady aerodynamic effects (Spedding, 1993; Dickinson et al., 1999) to dominate wing function during take-off, we calculated advance ratio (dimensionless) using kinematic data (J K ) and using kinematics coupled with PIV data (J PIV ). Advance ratio in aeronautical engineering is an expression of aircraft velocity divided by the tip velocity of the aircraft s propeller, or, equivalently, distance travelled by the aircraft relative to the excursion of the propeller tip during one revolution (Vogel, 1994). Rather than assume sinusoidal motion of the oscillating wing as is traditionally done when adapting propeller equations to model advance ratio in animals that oscillate their wings (Ellington, 1984; Vogel, 1994), we used observed threedimensional wingtip velocity relative to the bird (V wtip ). Thus: and (7) Where D wake = the average distance (m) between vortices in the wake. Note that Eq. (7) includes the contribution of self-convection of shed vortices: 11
12 J PIV was undefined for wingbeat one, as it lacks a previously shed vortex (D wake was undefined) Statistics To test for differences in the timing of first downstroke and LO, we used two-way repeated measures ANOVA with time and individual as factors and taking into account the trial repetition and species We also used two-way repeated measures ANOVA to test for a statistically-significant difference between wingbeat 1 and subsequent wingbeats for L, angle magnitude of induced velocity in the wake and J K. Wingbeat and individuals were used as factor and the trial repetition was also taken into account for both species. Lastly, t-tests were used to compare data sets coming from kinematic analysis with data sets coming from ground reaction force or aerodynamic analyses. All statistical tests were performed using R (Package stats version (R Development Core Team, 2010)). Throughout, we report mean ± s.d.. Results Kinematics During the preparation to take-off each bird crouched from a standing position. This counter movement (starting at time t 0 ) was visible in both species but was more evident in diamond dove, with a lower body angle before LO (16.3±5.3 degrees) compared with the zebra finch (20.1±7.3 degrees) (Fig. S2). During the second phase of take-off, the birds start extending their hindlimbs and forelimbs. This happened at 28.3±7.6 ms before LO in zebra finch compared to 38.9±8.10ms before LO in diamond dove. This is about 80% and 60% of the time from the start of counter movement (t 0 ) to LO in the zebra finch and diamond dove, 12
13 respectively. Both species started their first downstroke after their feet were completely off the perch (2 ms delay in the zebra finch, 6 ms in the diamond dove). However, these differences in timing were not statistically significant (zebra finch: ANOVA: factor=timing: F 1,26 =0.01; P>0.9; factor=individuals: F 1,3 =0.02; P>0.7; in diamond dove: ANOVA: factor=timing: F 1,9 =4.9; P>0.06; factor=individuals: F 1,2 =0.04; P>0.2) and, it should be noted that 2 ms was the margin of error for our video sampling at 500 Hz. The first wingbeat ends 24.5±6.1ms after lift-off in zebra finch compared to 37.9±6.2 ms in diamond dove. In zebra finch, each wingbeat lasts approximately 50ms, compared to 70ms in diamond dove. These durations are nearly equivalent in terms of the total wingbeat cycle, at 52.3% in the zebra finch and 54.1% in the diamond dove. In both species, V RK increased during the first two phases of take-off (Fig. 1A, C). In zebra finch the V RK increased from 0.03±0.03m.s -1 at t 0 to 1.74±0.3m.s -1 at LO. In diamond dove, the V RK increased from 0.04±0.1m.s -1 to 1.29±0.1m.s -1 at LO. After LO, V RK remained fairly constant during the first three wingbeats and reached 1.8±0.6m.s -1 in zebra finch and 1.7±0.1m.s -1 in diamond dove. The at LO corresponded to 92.3±4.2% of the maximal V RK reached during the first wingbeat in zebra finch and 79.4±3.9% in diamond dove. The acceleration profile shows a peak during the perching phase of take-off. In zebra finch, reached 47.2±14.4 m.s -2 (4.8 body weight), and occurred 28.3±6.0 ms before LO (Fig. 1B). In diamond dove, reached 26.7±3.2m.s -2 (2.7 body weight) and occurred ±7.9 ms before LO (Fig. 1D). These times are 80.6 % and 76.5% of the interval between t 0 and LO in zebra finch and diamond dove, respectively. Force production of legs 316 The produced during take-off, calculated using ground-reaction force, was ±7.5 m.s -2 in zebra finch, compared to 26.7±7.0 m.s -2 in diamond dove (Fig.2A, C). Thus, 13
14 318 the maximal leg force produced by the animal corresponds to 4.9±0.7 body weight for zebra 319 finch and 2.7±0.3 body weight for diamond dove. Average during the first upstroke was 35.5±18.0 m.s -2 in zebra finch and 25.2±8.8 m.s -2 in diamond dove (Fig. 4). The peak was 1.78±0.6 m.s -1 at LO in zebra finch and 1.2±0.4 m.s -1 in diamond dove (Fig. 2 B, D) Force production of the wings. For zebra finch, the first wingbeat produced significantly less L than the second and third ones (ANOVA: factor = wingbeat: F 1, 27 =16.03; P < 0.001; factor=individuals: F 1, 3 = 0.9; P > 0.1). Therefore, for the first wingbeat, L represented 0.9±0.4 body weight, whereas it comprised 1.4±0.6 body weight for the second wingbeat and 1.7±0.2 for the third one. The produced during the first wingbeat was 58±3.4% of that during the second and third wingbeats (Fig. 4A). Considering the relevant variables for estimating L (Eq. 4; Table 2A) the differences were due to less circulation (Γ), a smaller area (A) of the vortex loop and a lower induced velocity during the first wingbeat, compared to the subsequent wingbeats. Angle of the induced velocity in the wake for all three wingbeats was not significantly different among wingbeats (ANOVA: factor = wingbeat: F 1, 18 = 0.11; P > 0.7; factor=individuals: F 3, 18 = 2.3; P < 0.1). Although the general trend was for induced velocity to increase with wingbeat number, high variability meant that induced velocity of the first wingbeat, 3.9±1.8 m s -1, was not significantly less than the second (5.1±2.3m s -1 ) and third wingbeat (5.1±1.6 m s -1 ) For diamond dove, the first wingbeat also produced significantly less L than the subsequent ones (ANOVA: factor = wingbeat: F 1, 35 =5.6; P < 0.05; factor=individuals: F 1, 2 = 1.6; P>0.2). For the first wingbeat, L was 0.9±0.3 body weight, 1.1±0.0.3 for the second wingbeat, and 1.7±0.6 for the third wingbeat. The first wingbeat comprised 63±5.2% of produced during the subsequent wingbeats (Fig. 4B). As in the finch, less L was associated with less Γ and a lower induced velocity in wingbeat 1 (Table 2B). Angle of the 14
15 induced velocity for the first wingbeat was significantly lower than the second (ANOVA: factor = wingbeat: F 1, 23 = 43.5; P< 0.001; factor=individuals: F 2, 23 = 1.8; P > 0.1). Induced velocity for the first wingbeat was 4.4±1.3m s -1, and 5.2±1.1m s -1 for the second wingbeat. These values were statistically different (ANOVA: factor = wingbeat: F 1, 32 = 8.7; P < ; factor = individual: F 2, 32 = 2.8; P > 0. 07) Comparison of wing and leg contributions During the first phase of take-off, when the bird was on the perch with folded wings, was similar to in both species (for zebra finch: T-test: df = 13, P > 0. 7; for diamond dove: T-test: df = 12, P > 0.5) (Fig 2B, D). Both followed a similar pattern in both species (for zebra finch: t-test: df = 13, P > 0. 6; for diamond dove: t-test: df = 12, P > 0.21) (Fig. 2A, C). This means that during the first phase of take-off the legs are responsible for the entire resultant velocity and resultant acceleration. During the second phase of take-off, when the wings were unfolded, was lower than, 34.56±7.9 m.s -2 for compared to 43.63±6.45 m.s -2 for in zebra finch, and 24.51±3.18 m.s -2 for the compared to 33.21±1.8 m.s -2 for in diamond dove (Fig. 4A, B). Moreover, at LO, was 93.6±0.6% of the in zebra finch, and 95.2±0.4% of in diamond dove (Fig 2B, D). Average during the second phase of take-off was significantly different from (for zebra finch: t-test: df = 13, P < 0.05; for diamond dove: t test: df = 12, P < 0.05). After LO, the during the first wingbeat was significantly different from (for zebra finch: t-test: df = 13, P < 0.001; for diamond dove: t-test: df = 12, P < 0.001). But we can notice that for wingbeat 1, is approximately equal to the sum of and. 15
16 367 During the following wingbeats (Fig.4) there was no significant difference in the 368 compared with (for the second wingbeat in zebra finch: t-test: df = 13, P = 0.37; for diamond dove: t-test: df = 12, P = 0.20). Advance ratio measured using kinematics (J K ) did not differ significantly between wingbeats (for zebra finch: ANOVA: factor = wingbeat: F 2,3 = 3.0; P > 0.1; factor=individuals: F 1,3 = 0.14; P > 0.7; for diamond dove: ANOVA: factor = wingbeat: F 2,3 = 0.65; P > 0.5; factor=individuals : F 1,3 = 0.03; P > 0.8), or among species (ANOVA: factor = species: F 1,14 = ; P > 0.09; factor=individuals : F 1,14 = 0.14; P > 0.7). But J PIV was significantly larger in zebra finch (~ 0.40) compared with diamond dove (~0.30) during wingbeats 2 and 3 (t-test: df = 5, P < ), and J PIV was always greater than J K (ttest: df = 11, P < ) which varied from (Table 2). Discussion The wings of birds have historically been considered as the primary force producers during take-off (Rüppell, 1975; Heppner and Anderson, 1985). However, more recent studies (Earls, 2000; Tobalske, 2004; Berg and Biewener, 2010) agree that the legs play a key role in producing the acceleration needed for take-off. By combining three different data sets to calculate force production we were able to assess the relative role of both hindlimbs and forelimbs through take-off in two new species of birds with different wing shape and ecology Our data show that in zebra finch, a small passerine, and in diamond dove, a small columbid, the hindlimbs and forelimbs are successively used, with hindlimb dominance in the first phases of take-off providing initial acceleration, and coordinated use of wings to maintain velocity through the first three wingbeats. Despite dramatic differences in body size, wing morphology (Table 1) and slow-flight kinematics (Tobalske, 2007), we did not observe significant differences between species in aerodynamic force produced. Rather, the most 16
17 prominent difference between birds was observed at the initial acceleration - due almost exclusively to the hindlimbs - and subsequent flight velocity upon leaving the perch, both of which were greater in the zebra finch versus the dove data ( During the first phase of take-off, the resultant acceleration calculated from the force was not significantly different from the resultant acceleration calculated from the 398 kinematic data ( Figs 1 and 2), indicating that legs were wholly responsible for the acceleration while on contact with the perch during preparation to take-off. An acceleration peak is observed in both species, with a magnitude four times greater than that observed after lift-off (LO). We can notice that this acceleration peak occurred at the transition between the first and the second phase of take-off in zebra finch (28.3±6.0 ms before lift-off) whereas it happened slightly after the beginning of the first upstroke in diamond dove (15.35±4.2ms after the beginning of the second phase) (Fig. 1B and D). For both birds, this acceleration peak occurs while still on the perch. The observed maximal vertical force production (F z ) was greater than what is reported in other studies: from body weight in the pigeon compared to in diamond dove and in zebra finch (Clark and Alexander, 1975; Heppner and Anderson, 1985; Bonser and Rayner, 1996). We also observed that relative hindlimb forces produced by the dove (50 g) were 55±2.5% lower than the finch (15 g), which was consistent with the hypothesis that the maximal acceleration generated across species should be inversely proportional to body weight (Bonser and Rayner, 1996). In the second phase of take-off, corresponding to the first upstroke, the average represented 93±0.6% of the resultant acceleration calculated from the kinematic data for zebra finch and 92.1±0.4% for diamond dove (Fig. 4). This indicates a combined action of the hindlimbs with the forelimbs, although the hindlimbs dominated. The wings started to unfold at the same moment as the acceleration profiles of ground reaction forces and kinematics start 17
18 to diverge (Fig. 2A, C). We can suggest that forces produced by the wings (Crandell and Tobalske, 2011; Ros et al., 2011) may be responsible for a part of the observed disparity between ground reaction forces and observed kinematics in diamond dove. However, it seems unlikely that zebra finch is generating an aerodynamically-active upstroke, as the species uses a flexed-wing upstroke (Tobalske et al., 1999), and no aerodynamic activity was visible in the wake. The bird s body is rotating upward as legs are extending and this rotational kinematics 423 acceleration might be added inappropriately to our linear thus leading to an overestimation of its magnitude. In any case, our data show that in both species, the initial acceleration peak is predominantly due to the hindlimbs, with the legs contributing to approximately 70-80% of produced during the second phase of take-off. Surprisingly, despite large differences in leg and wing morphology (Table 1), both species appear to promote similar tactics of wing and leg use. However, in comparing maximal velocity of the first wingbeat (V RK ) to that produced by the legs (V FP ) at LO, an interesting pattern emerges. In zebra finch, 92.3±4.2% of the maximal velocity was reached by LO, and only 79.36±3.9% in diamond dove (Fig 2B, D). Observed velocities produced by the leg forces were on the high end of the range that has previously been reported for European starling, Japanese quail, rufous hummingbird, and pigeon; for which the percentage of velocity reached at LO corresponds to between 59% and 90% of the velocity achieved at the next upstroke/downstroke transition (Earls, 2000; Tobalske, 2004; Berg and Biewener, ). In comparing magnitude of resultant acceleration previously reported with data from the present study, we see that both the zebra finch (4.4m.s -2 ) and diamond dove (3.4m.s -2 ) were near the European starling (4.3m.s -2 ) (Earls, 2000). All three of these species are ecological generalists in their respective habitats, and legs contribute to 92%, 79%, and 95% of total velocity respectively by take-off. In contrast, the resultant acceleration of a highly specialized aerial bird, the rufous hummingbird, is 1.78m.s -2 with legs contributing to only 18
19 % of total velocity (Tobalske et al., 2004). On the other end of the spectrum, the Japanese quail, a ground specialist, produces an acceleration maximum of 8.3m.s -2, contributing to 89% body velocity. This continuum suggests the interaction between wings and legs should be framed in an ecological context, and merits further exploration with a larger sample size. In both zebra finch and diamond dove, the beginning of the first downstroke occurs approximately a few milliseconds after the bird leaves the perch, resulting in a discrete succession in the use of the hindlimbs and forelimbs. However, we can concede that the relative timing of the different phases of take-off is closely related to the animal s state of stress. Informally, we observed that the more the bird was stressed, the earlier the wings would start to be used which is consistent with the previous studies on take-off (Earls, 2000; Tobalske et al., 2004). In this study, only trials with spontaneous, unstressed take-off were analyzed, resulting in a low variability in the timing of take-off phases. In the aerial phase of take-off, our data show that during the first wingbeat, the acceleration calculated from the PIV data ( ) represented only 24.8±4.2% of in zebra finch and 29.9±3.6% in diamond dove. This further demonstrates that during the first wingbeat, the resultant acceleration is mostly due to the hindlimb contribution, with wings contributing to about 30% of this acceleration. Moreover, we can note that lift production (L) during the first wingbeat represents only 58±3.4% of the force produced by the subsequent wingbeats in zebra finch and 63±5.2 in diamond dove. Both finch and dove did not produce enough force in the first wingbeat to support bodyweight in the air (0.9 ± 0.4 and 0.9 ± 0.3 bodyweight respectively), but, given the large standard deviations (Fig. 4), they may have supported body weight some of the time. Regardless, this minimal force production was not enough to accelerate quickly without relying on the initial acceleration of the legs. This is compensated by the following wingbeats, where force production increased well above that required for support of body weight (1.4 and 1.7 for finch and 1.1 and 1.7 for dove), 19
20 indicating force used toward net acceleration. Relatively large standard deviations for L and may also be linked to motivational differences between trials. Both bird species follow a general pattern in force production by the wings, producing near minimal required to counter gravity and then increasing with subsequent wingbeats. This implies that generalist birds may have tuned the timing and magnitude of force production by the wings to accommodate neuromuscular, aerodynamic or environmental constraints. Our estimates of lift that increase with each wingbeat during take-off are consistent with direct measures of muscle activity in pigeons in which the pectoralis muscles are recruited at lower levels and produce lower force during the first wingbeat compared with subsequent wingbeats (Dial and Biewener, 1993a; Tobalske and Biewener, 2008). Several mechanisms may explain this variation in force production. One hypothesis we suggest is the birds may capitalize on a mechanism similar to wake-recapture (Sane, 2003) the subsequent wingbeats are capable of capitalizing on induced flow from previous wingbeats. If this is the case, the first wingbeat is incapable of benefiting from induced flow, and may, therefore, exhibit weaker lift. Our observed low advance ratios (J K and J PIV ; Table 2) suggest that wings may interact with previously shed circulation in the wake (Spedding, 1993). Even accounting for the contribution of self-convection of shed vortices away from the flying animal (V vort ), advance ratios were considerably less than 1 (J PIV, Table 2). This revealed that the wingtips were always moving much further than the body during a given wingbeat. Another possible influence is the orientation of the body relative to the wake changes from first to subsequent wingbeats (Table 2; S2), and body angle may initially be in an unfavorable orientation. In this case, angle of induced downwash in the finch was not statistically different from the first to subsequent wingbeats, but diamond dove angle of induced velocity was different, suggesting doves may be under pressure to reorient their body, but not finches. Finally, there may be a need to provide enough space for the wings to complete a full downstroke without hitting the 20
21 substratum and risking wing damage (Heppner and Anderson, 1985). Thus, the wings are spatially limited and complete a smaller arc. Clearly, further studies of potential unsteady aerodynamic performance and the interactions between substrate and air are necessary. In the zebra finch, the acceleration produced by the wings during the first wingbeat ( and represents a lower proportion of the acceleration produced during the subsequent wingbeats than in diamond dove (Figs. 2 and 4). Diamond doves use a tip-reversal upstroke, and we hypothesize that this style of upstroke is aerodynamically active (Crandell and Tobalske, 2011; Ros et al., 2011). Tip-reversal may provide an earlier onset of useful aerodynamic force production during the first wingbeat in diamond dove. Due to the interaction of body mass with acceleration in the present study, this suggestion must be interpreted as tentative. It would be useful to test this hypothesis within a clade that exhibits variation in body mass and upstroke style. During take-off, the amount of acceleration produced by the hindlimbs is much higher than the acceleration produced by the forelimbs. It can be linked to the fact that it is more efficient to push against the ground than against the air (Dickinson et al., 2000). These data emphasize the prominent role of the hindlimbs in all avian locomotor behaviors except flight (Dial, 2003; Abourachid et al., 2011; Provini et al., 2012). This work suggests that during the transitional first wingbeat timing coordination exists between wings and legs, which can be seen as anatomical and neuromuscular systems, previously identified as modules in birds (Gatesy and Dial, 1996). Our results combined with previous work (Earls, 2000; Tobalske et al., 2004) support the general conclusion underscoring the prominent role of hindlimbs during take-off in a phylogenetically, morphologically and ecologically diverse array of birds. More extensive phylogenetic analysis is warranted to test the generality of the hypothesis of a universal hindlimb drive during take-off in birds. But, if this pattern is universal, this would provide support for the leaping model for the origin of flight (Garner et al., 1999). Indeed, in 21
22 cursorial theropod dinosaurs, powerful hindlimbs would have been a useful preadaptation to a hindlimb driven take-off. Moreover, in our study, we see incremental use of the flight apparatus for the first wingbeat, as suggested by the work of Jackson et al. (Jackson and Dial, 2011) on WAIR (wing-assisted incline running) where birds use rapid flapping of the wings to run up inclined surfaces. Even though we studied a standing take-off instead of WAIR, our data suggest that incremental use of the pectoralis muscle can modulate leg performance and contribute to weight support, and thus is a relevant model for the evolutionary origin of flapping. Therefore, our results may provide novel insights on the origin of avian flight as they are consistent with both leaping and WAIR models (Garner et al., 1999; Dial, 2003) with a hindlimb driven take-off assisted by a gradual use of the forelimb through the first wingbeats. List of symbols PIV USDS DSUS FW LO c g m t t 0 t up t wb A D wake F X F Y F Z J k J PIV L S particle image velocimetry upstroke/downstroke transition downstroke/upstroke transition First use of the wings Lift-off vortex added mass coefficient gravitational acceleration body mass time start of take-off with countermovement 1 st upstroke duration full wingbeat duration loop area of wake vortex distance between shed vortices forward force lateral force vertical force advance ratio from kinematics advance ratio from kinematics and aerodynamics average lift width of wake vortex velocity calculated using data from force plate 22
23 t ω Γ ρ velocity calculated using kinematic data Self-convection velocity of shed vortices Acceleration calculated using data from force plate Acceleration calculated using kinematics Average acceleration calculated from PIV and kinematics Forward acceleration calculated from kinematics Lateral acceleration calculated from kinematics Vertical acceleration calculated from kinematics elapsed time between PIV paired images vorticity circulation air density Acknowledgments We are grateful to Paul-Antoine Libourel, Hugues Clamouze and Brandon Jackson for their help during the experiments. Thanks to Bieke Van Hooydonck and Anthony Herrel for the force platform used in Paris. Thanks to Camille Dégardin for her help with the illustrations. This research was supported by grants from the UMR 7179, ATM Formes (MNHN) and from ED-FdV and Bettencourt-Schueller foundation fellowships as well as NSF grants IOS and IOS References Abourachid, A. (1993). Mechanics of standing in birds - Functional explanation of lameless problems in giant turkeys. British Poultry Science 34, Abourachid, A., Hackert, R., Herbin, M., Libourel, P. A., Lambert, F., Gioanni, H., Provini, P., Blazevic, P. and Hugel, V. (2011). Bird terrestrial locomotion as revealed by 3D kinematics. Zoology 114, Askew, G. N., Marsh, R. L., Ellington, C. P. (2001). The mechanical power output of the flight muscles of blue-breasted quail (Coturnix chinensis) during take-off. Journal of Experimental Biology 204,
24 Berg, A. M. and Biewener, A. A. (2010). Wing and body kinematics of takeoff and landing flight in the pigeon (Columba livia). Journal of Experimental Biology 213, Bonser, R. H. C. and Rayner, J. M. V. (1996). Measuring leg thrust forces in the common starling. Journal of Experimental Biology 199, Clark, J. and Alexander, R. M. (1975). Mechanics of running by quail (Coturnix). Journal of Zoology 176, Crandell, K. E. and Tobalske, B. W. (2011). Aerodynamics of tip-reversal upstroke in a revolving pigeon wing. Journal of Experimental Biology 214, Dabiri, J. O. (2005). On the estimation of swimming and flying forces from wake measurements. Journal of Experimental Biology 208, Dial, K. P. (2003). Wing-assisted incline running and the evolution of flight. Science 299, Dial, K. P. and Biewener, A. A. (1993a). Pectoralis-muscle force and power output during different modes of flight in Pigeons (Columbia livia). Journal of Experimental Biology 176, Dial, K. P. and Biewener, A. A. (1993b). Pectoralis muscle force and power output during different modes of flight in Pigeons (Columbia livia). Journal of Experimental Biology 176, Dial, K. P., Jackson, B. E. and Segre, P. (2008). A fundamental avian wing-stroke provides a new perspective on the evolution of flight. Nature (London) 451, Dickinson, M. H., Lehmann, F. O. and Sane, S. P. (1999). Wing rotation and the aerodynamic basis of insect flight. Science 284, Dickinson, M. H., Farley, C. T., Full, R. J., Koehl, M. A. R., Kram, R. and Lehman, S. (2000). How animals move: An integrative view. Science 288, Doligalski, T. L., Smith, C. R. and Walker, J. D. A. (1994). Vortex interactions with walls. Annual Review of Fluid Mechanics 26,
25 Earls, K. D. (2000). Kinematics and mechanics of ground take-off in the starling Sturnis Sturnus vulgaris and the quail Coturnix coturnix. Journal of Experimental Biology 203, Ellington, C. P. (1984). The aerodynamics of hovering insect flight.4. Aerodynamic mechanisms. Philosophical Transactions of the Royal Society of London Series B-Biological Sciences 305, 79-&. Garner, J. P., Taylor, G. K. and Thomas, A. L. R. (1999). On the origins of birds: the sequence of character acquisition in the evolution of avian flight. Proceedings of the Royal Society of London Series B Biological Sciences 266, Gatesy, S. M. and Dial, K. P. (1993). Tail muscle-activity patterns in walking and flying pigeons (Columbia livia). Journal of Experimental Biology 176, Gatesy, S. M. and Dial, K. P. (1996). Locomotor modules and the evolution of avian flight. Evolution 50, Han, C. and Cho, J. (2005). Unsteady trailing vortex evolution behind a wing in ground effect. Journal of Aircraft 42, Hartley, R. and Sturm, P. (1997). Triangulation. Comput Vis Image Underst 68, Heppner, F. H. and Anderson, J. G. T. (1985). Leg thrust important in flight take-off in pigeon. Journal of Experimental Biology 114, Jackson, B. E. and Dial, K. P. (2011). Scaling of mechanical power output during burst escape flight in the Corvidae. Journal of Experimental Biology 214, Norberg, R. A. and Norberg, U. M. (1971). Take-off and landing and flight speed during fishing flights of Gavia stellata. Ornis Scandinavica 2, Ostrom, J. H. (1974). Archaeopteryx and the origin of flight. Quarterly Rev. Biol. 49, Padian, K. (1987). A comparative phylogenetic and functional approach to the origin of vertebrate flight. Cambridge: Cambridge University Press. Provini, P., Goupil, P., Hugel, V. and Abourachid, A. (2012). Walking, paddling, waddling: 3D kinematics of Anatidae locomotion (Callonetta leucophrys). Journal of Experimental Zoology 317,
26 R Development Core Team. (2010). R: A Language and Environment for Statistical Computing. R Foundation for Statistical Computing. Ros, I. G., Bassman, L. C., Badger, M. A., Pierson, A. N. and Biewener, A. A. (2011). Pigeons steer like helicopters and generate down- and upstroke lift during low speed turns. Proceedings of the National Academy of Sciences of the United States of America 108, Rüppell, G. (1975). Bird flight. Bird flight., Sane, S. P. (2003). The aerodynamics of insect flight. Journal of Experimental Biology 206, Simpson, S. F. (1983). The flight mechanism of the pigeon Columbia livia during take-off. Journal of Zoology 200, Spedding, G. R. (1993). On the significance of unsteady effects in the aerodynamic performance of flying animals. Contemporary Mathematics 141, Spedding, G. R., Rosen, M. and Hedenstrom, A. (2003). A family of vortex wakes generated by a thrush nightingale in free flight in a wind tunnel over its entire natural range of flight speeds. Journal of Experimental Biology 206, Tobalske, B. W. (2007). Biomechanics of bird flight. Journal of Experimental Biology 210, Tobalske, B. W. and Dial, K. P. (2000). Effects of body size on take-off flight performance in the Phasianidae (Aves). Journal of Experimental Biology 203, Tobalske, B. W. and Dial, K. P. (2007). Aerodynamics of wing-assisted incline running in birds. Journal of Experimental Biology 210, Tobalske, B. W. and Biewener, A. A. (2008). Contractile properties of the pigeon supracoracoideus during different modes of flight. Journal of Experimental Biology 211, Tobalske, B. W., Peacock, W. L. and Dial, K. P. (1999). Kinematics of flap-bounding flight in the zebra finch over a wide range of speeds. Journal of Experimental Biology 202,
27 Tobalske, B. W., Hedrick, T. L. and Biewener, A. A. (2003). Wing kinematics of avian flight across speeds. Journal of Avian Biology 34, Tobalske, B. W., Altshuler, D. L. and Powers, D. R. (2004). Take-off mechanics in hummingbirds (Trochilidae). Journal of Experimental Biology 207, Tobalske, B. W., Altshuler, D. L., Powers, D. R. (2004). Take-off mechanics in hummingbirds (Trochilidae). Journal of Experimental Biology 207, Vogel, S. (1994). Life in moving fluids: the physical biology of flow,. Princeon, New Jersey. Warrick, D. R., Tobalske, B. W. and Powers, D. R. (2005). Aerodynamics of the hovering hummingbird. Nature 435, Table Table 1: Morphometric parameters of zebra finch (Taeniopygia guttata) and diamond dove (Geopelia cuneata) Species Wing Length (cm) Body Width (cm) Wing Area (cm 2 ) Wing Chord (cm) Aspect Ratio Tarsometatarsus Length (cm) Zebra Finch 7.5 ± ± ± ± ± ± 0.03 Diamond Dove 12.0 ± ± ± ± ± ± 0.1 Table 2: Aerodynamic parameters for the first three wingbeats after LO in zebra finch (Taeniopygia guttata) (A) and diamond dove (Geopelia cuneata) (B). Diamond dove data for wingbeat three come from another experiment with the same methods but where birds were using level flight instead of climbing flight. A zebra finch (Taeniopygia guttata) Wingbeat 1 Wingbeat 2 Wingbeat 3 Mean ± s.d. Mean ± s.d. Mean ± s.d. A (cm²) ± ± ±6.5 Γ, m² s 1 (+) 0.35± ± ±0.02 Γ, m² s 1 (-) -0.36± ± ±0.1 27
28 S (mm) 0.01± ± ±0.001 V vort (m.s -1 ) 0.59± ± ±0.05 t o (ms) 44.94± ± ±3.8 Angle of induced velocity to horizontal (degrees) 63.57± ± ±4.9 Magnitude of induced velocity (m.s -1 ) 3.9± ± ±1.6 V wtip (m.s -1 ) 6.0± ± ±0.5 D wake (m) ± J K 0.32± ± ±0.03 J PIV ± ±0.03 B diamond dove (Geopelia cuneata) Wingbeat 1 Wingbeat 2 Wingbeat 3 * Mean ± s.d. Mean ± s.d. Mean ± s.d. A (cm²) ± ± ±40.4 Γ, m² s 1 (+) 0.58± ± ±0.1 Γ, m² s 1 (-) -0.76± ± ±0.1 S (mm) 0.01± ± ±0.001 V vort (m s -1 ) 0.87± ± ±0.05 t o (ms) 64.0± ± ±2.3 Angle of induced velocity to horizontal (degrees) 54.92± ± ±10.1 Magnitude of induced velocity (m.s -1 ) 4.37± ± ±0.8 V wtip (m.s -1 ) 9.1± ± ±0.6 D wake (m) ±0 0.20±0.01 J K 0.20± ± ±0.02 J PIV ± ±0.02 Figures Fig. 1) A and C, velocity and B and D, acceleration, calculated from the displacement of the geometric center of the animal during take-off in zebra finch (Taeniopygia guttata), A and B and diamond dove (Geopelia cuneata), C and D. N=7 birds in zebra finch and N=3 in diamond dove with 5 trials within each bird. Envelopes illustrate the variability, defined as the maximum-minimum range across all trials. E) Sketch of the upstroke/downstroke succession during take-off. In orange the horizontal component, in green the vertical component, in blue, the resultant ( and ( 28
29 USDS: upstroke/downstroke transition; DSUS: downstroke/upstroke transition; LO: lift-off, FW: first use of the wings Fig. 2) Resultant acceleration ( and resultant velocity, calculated from the kinematic data (in blue) and from the force measurements ( finch (Taeniopygia guttata) (A) and diamond dove (Geopelia cuneata) (B). in pink) in zebra Fig. 3) Particle image velocimetry. A and C, velocity vectors, expressed relative to average velocity, and with background vorticity (ω), B and D, Streamlines associated with the vector field. Broken lines indicate regions sampled for ω (red=starting vortex, blue=ending vortex) in zebra finch (Taeniopygia guttata) (A and B) and diamond dove (Geopelia cuneata) (C and D). Grey circle highlights the location of the take-off perch. Fig. 4) Category plot of the acceleration produced during the first three wingbeats in zebra finch (Taeniopygia guttata) (A) and in diamond dove (Geopelia cuneata) (B). In blue, resultant acceleration calculated from kinematic data ( for 5 trials in N=7 zebra finches and N=3 diamond doves during the first upstroke and during each wingbeat. In pink, resultant acceleration calculated from the force data ( for 5 trials in N=7 zebra finches and N=3 diamond doves during the first upstroke and first wingbeat. In orange, resultant acceleration calculated from PIV data ( doves and 42 wingbeats. with N=4 zebra finches and 37 wingbeats and N=3 diamond Electronic supplementary material Supplemental Figure S1: Drawing of a zebra finch (Taeniopygia guttata) with the position of the digitized landmarks and the edge of the animal used to calculate the position of the 29
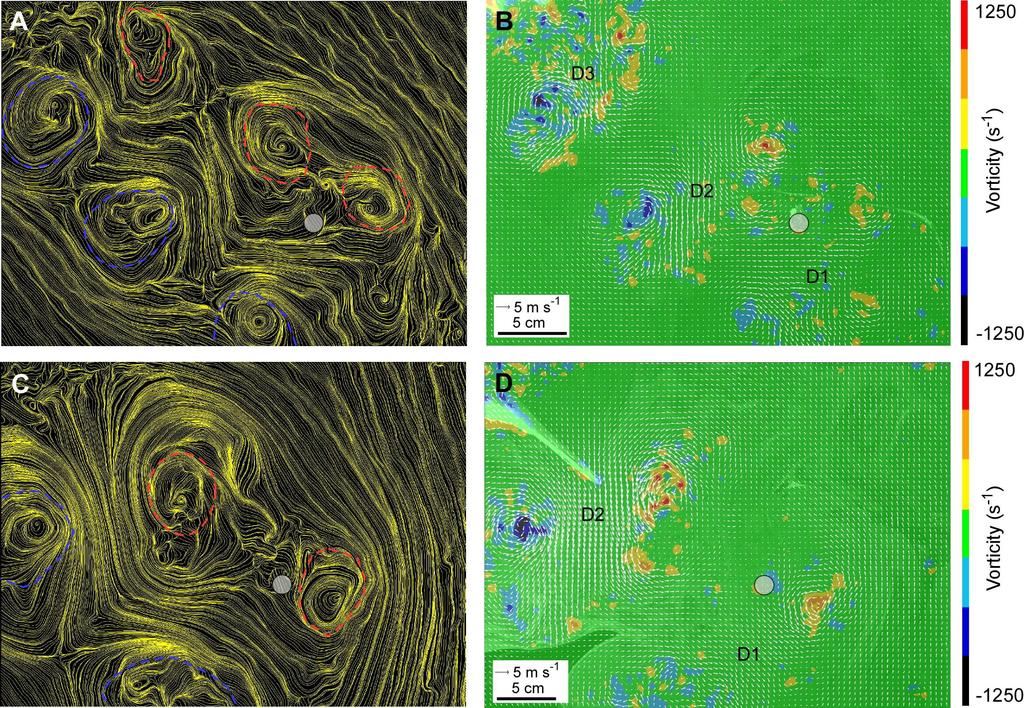
30 geometric center. The position of the center of mass estimated using the multiple suspension method is represented by a circle Supplementary Figure S2: A) Vertical trajectory of the center of mass over time in zebra finch (Taeniopygia guttata) (purple) and diamond dove (Geopelia cuneata) (pink) and B) Body orientation in zebra finch (purple) and diamond dove (pink). Time zero is at lift-off. 30
31
32
33
RESEARCH ARTICLE Transition from leg to wing forces during take-off in birds
 4115 The Journal of Experimental Biology 215, 4115-4124 212. Published by The Company of Biologists Ltd doi:1.1242/jeb.74484 RESEARCH ARTICLE Transition from leg to wing forces during take-off in birds
Transition from wing to leg forces during landing in birds
 214. Published by The Company of Biologists Ltd (214) 217, 2659-2666 doi:1.1242/jeb.14588 RESEARCH ARTICLE Transition from wing to leg forces during landing in birds Pauline Provini 1,2,3, Bret W. Tobalske
KINEMATICS OF FLAP-BOUNDING FLIGHT IN THE ZEBRA FINCH OVER A WIDE RANGE OF SPEEDS
 The Journal of Experimental Biology 22, 1725 1739 (1999) Printed in Great Britain The Company of Biologists Limited 1999 JEB192 1725 KINEMATICS OF FLAP-BOUNDING FLIGHT IN THE ZEBRA FINCH OVER A WIDE RANGE
Commentary Biomechanics of bird flight
 3135 The Journal of Experimental Biology 210, 3135-3146 Published by The Company of Biologists 2007 doi:10.1242/jeb.000273 Commentary Biomechanics of bird flight Bret W. Tobalske Department of Biology,
The wing of Archaeopteryx as a primary thrust generator
 Page 1 of 5 The wing of Archaeopteryx as a primary thrust generator Nature 399, pp. 60-62 (1999) Macmillan Publishers Ltd. PHILLIP BURGERS* AND LUIS M. CHIAPPE * San Diego Natural History Museum, PO Box
RESEARCH ARTICLE The broad range of contractile behaviour of the avian pectoralis: functional and evolutionary implications
 2354 The Journal of Experimental Biology 214, 2354-2361 211. Published by The Company of Biologists Ltd doi:1.1242/jeb.52829 RESEARCH ARTICLE The broad range of contractile behaviour of the avian pectoralis:
Modeling and Control of Trawl Systems
 Modeling and Control of Trawl Systems Karl-Johan Reite, SINTEF Fisheries and Aquaculture Supervisor: Professor A. J. Sørensen * Advisor: Professor H. Ellingsen * * Norwegian University of Science and Technology
RESEARCH ARTICLE Ontogeny of lift and drag production in ground birds
 717 The Journal of Experimental Biology 14, 717-75 11. Published by The Company of Biologists Ltd doi:1.14/jeb.51177 RESEARCH ARTICLE Ontogeny of lift and drag production in ground birds Ashley M. Heers*,
EFFECTS OF BODY SIZE ON TAKE-OFF FLIGHT PERFORMANCE IN THE PHASIANIDAE (AVES)
") The Journal of Experimental Biology 23,3319 3332 (2) Printed in Great Britain The Company of Biologists Limited 2 JEB2895 3319 EFFECTS OF BODY SIZE ON TAKE-OFF FLIGHT PERFORMANCE IN THE PHASIANIDAE (AVES)
The Journal of Experimental Biology 23,3319 3332 (2) Printed in Great Britain The Company of Biologists Limited 2 JEB2895 3319 EFFECTS OF BODY SIZE ON TAKE-OFF FLIGHT PERFORMANCE IN THE PHASIANIDAE (AVES)
Barney to Big Bird: The Origin of Birds. Caudipteryx. The fuzzy raptor. Solnhofen Limestone, cont d
 Barney to Big Bird: The Origin of Birds Caudipteryx The fuzzy raptor The discovery of feathered dinosaurs in Liaoning, China, has excited the many paleontologists who suspected a direct link between dinosaurs
Three-dimensional kinematics of hummingbird flight
 2368 The Journal of Experimental iology 21, 2368-2382 Published by The Company of iologists 27 doi:1.1242/jeb.5686 Three-dimensional kinematics of hummingbird flight ret W. Tobalske 1, *, Douglas R. Warrick
Comparative Physiology 2007 Second Midterm Exam. 1) 8 pts. 2) 14 pts. 3) 12 pts. 4) 17 pts. 5) 10 pts. 6) 8 pts. 7) 12 pts. 8) 10 pts. 9) 9 pts.
 8 pts. 2) 14 pts. 3) 12 pts. 4) 17 pts. 5) 10 pts. 6) 8 pts. 7) 12 pts. 8) 10 pts. 9) 9 pts.") Name: Comparative Physiology 2007 Second Midterm Exam 1) 8 pts 2) 14 pts 3) 12 pts 4) 17 pts 5) 10 pts 6) 8 pts 7) 12 pts 8) 10 pts 9) 9 pts Total 1. Cells I and II, shown below, are found in the gills
Name: Comparative Physiology 2007 Second Midterm Exam 1) 8 pts 2) 14 pts 3) 12 pts 4) 17 pts 5) 10 pts 6) 8 pts 7) 12 pts 8) 10 pts 9) 9 pts Total 1. Cells I and II, shown below, are found in the gills
It Is Raining Cats. Margaret Kwok St #: Biology 438
 It Is Raining Cats Margaret Kwok St #: 80445992 Biology 438 Abstract Cats are known to right themselves by rotating their bodies while falling through the air and despite being released from almost any
Effects of Flight Speed upon Muscle Activity in Hummingbirds
 Digital Commons @ George Fox University Faculty Publications - Department of Biology and Chemistry Department of Biology and Chemistry 21 Effects of Flight Speed upon Muscle Activity in Hummingbirds Bret
Recall: The Earliest Thoughts about Flying Took place before the days of science.
 Recall: The Earliest Thoughts about Flying Took place before the days of science. Before man began to investigate with carefully planned experiments, and to figure things out in an orderly fashion. Men
RESEARCH ARTICLE Ontogeny of aerodynamics in mallards: comparative performance and developmental implications
 3693 The Journal of Experimental iology 215, 3693-372 212. Published by The Company of iologists Ltd doi:1.1242/jeb.6218 RESERCH RTICLE Ontogeny of aerodynamics in mallards: comparative performance and
8/19/2013. Topic 14: Body support & locomotion. What structures are used for locomotion? What structures are used for locomotion?
 Topic 4: Body support & locomotion What are components of locomotion? What structures are used for locomotion? How does locomotion happen? Forces Lever systems What is the difference between performance
Morphology, Velocity, and Intermittent Flight in Birds 1
 AMER. ZOOL., 41:177 187 (2001) Morphology, Velocity, and Intermittent Flight in Birds 1 BRET W. TOBALSKE 2 Department of Biology, University of Portland, 5000 North Willamette Boulevard, Portland, Oregon
Accepted Manuscript. News & Views. Primary feather vane asymmetry should not be used to predict the flight capabilities of feathered fossils
 Accepted Manuscript News & Views Primary feather vane asymmetry should not be used to predict the flight capabilities of feathered fossils Xia Wang, Robert L. Nudds, Colin Palmer, Gareth J. Dyke PII: S2095-9273(17)30453-X
Effects of Flight Speed upon Muscle Activity in Hummingbirds
 Effects of Flight Speed upon Muscle Activity in Hummingbirds The Harvard community has made this article openly available. Please share how this access benefits you. Your story matters Citation Tobalske,
SOAR Research Proposal Summer How do sand boas capture prey they can t see?
 SOAR Research Proposal Summer 2016 How do sand boas capture prey they can t see? Faculty Mentor: Dr. Frances Irish, Assistant Professor of Biological Sciences Project start date and duration: May 31, 2016
Moult, flight performance and wingbeat kinematics during take-off in European starlings Sturnus ulgaris
 JOURNAL OF AVIAN BIOLOGY 34: 371 378, 2003 Moult, flight performance and wingbeat kinematics during take-off in European starlings Sturnus ulgaris Emma V. Williams and John P. Swaddle Williams, E. V. and
Low Speed Avian Maneuvering Flight
 Low Speed Avian Maneuvering Flight The Harvard community has made this article openly available. Please share how this access benefits you. Your story matters. Citation Accessed Citable Link Terms of Use
Representation, Visualization and Querying of Sea Turtle Migrations Using the MLPQ Constraint Database System
 Representation, Visualization and Querying of Sea Turtle Migrations Using the MLPQ Constraint Database System SEMERE WOLDEMARIAM and PETER Z. REVESZ Department of Computer Science and Engineering University
Research article Contractile properties of the pigeon supracoracoideus during different modes of flight
 17 The Journal of Experimental Biology 211, 17-179 Published by The Company of Biologists 28 doi:1.1242/jeb.7476 Research article Contractile properties of the pigeon supracoracoideus during different
The Effect of Aerial Exposure Temperature on Balanus balanoides Feeding Behavior
 The Effect of Aerial Exposure Temperature on Balanus balanoides Feeding Behavior Gracie Thompson* and Matt Goldberg Monday Afternoon Biology 334A Laboratory, Fall 2014 Abstract The impact of climate change
Back to basics - Accommodating birds in the laboratory setting
 Back to basics - Accommodating birds in the laboratory setting Penny Hawkins Research Animals Department, RSPCA, UK Helping animals through welfare science Aim: to provide practical information on refining
As a rebuttal to Darwin s (1859) explanation of the
 explanation of the") What Use Is Half a Wing in the Ecology and Evolution of Birds? KENNETH P. DIAL, ROSS J. RANDALL, AND TERRY R. DIAL The use of incipient wings during ontogeny in living birds reveals not only the function
What Use Is Half a Wing in the Ecology and Evolution of Birds? KENNETH P. DIAL, ROSS J. RANDALL, AND TERRY R. DIAL The use of incipient wings during ontogeny in living birds reveals not only the function
The biophysics of bird flight: functional relationships integrate aerodynamics, morphology, kinematics, muscles and sensors
 The biophysics of bird flight: functional relationships integrate aerodynamics, morphology, kinematics, muscles and sensors Journal: Manuscript ID cjz-2015-0103.r1 Manuscript Type: Review Date Submitted
BEHAVIOUR OF DOGS DURING OLFACTORY TRACKING
 J. exp. Biol. 180, 247-251 (1993) Printed in Great Britain The Company of Biologists Limited 1993 247 BEHAVIOUR OF DOGS DURING OLFACTORY TRACKING AUD THESEN, JOHAN B. STEEN* and KJELL B. DØVING Division
Contractile properties of the pigeon supracoracoideus during different modes of flight
 Contractile properties of the pigeon supracoracoideus during different modes of flight The Harvard community has made this article openly available. Please share how this access benefits you. Your story
Effects of size and behavior on aerial performance of two species of flying snakes (Chrysopelea)
") The Journal of Experimental Biology 2, 135-147 Published by The Company of Biologists 25 doi:.1242/jeb.15 135 Effects of size and behavior on aerial performance of two species of flying snakes (Chrysopelea)
The Journal of Experimental Biology 2, 135-147 Published by The Company of Biologists 25 doi:.1242/jeb.15 135 Effects of size and behavior on aerial performance of two species of flying snakes (Chrysopelea)
Comparative Evaluation of Online and Paper & Pencil Forms for the Iowa Assessments ITP Research Series
 Comparative Evaluation of Online and Paper & Pencil Forms for the Iowa Assessments ITP Research Series Catherine J. Welch Stephen B. Dunbar Heather Rickels Keyu Chen ITP Research Series 2014.2 A Comparative
Effects of size and behavior on aerial performance of two species of flying snakes (Chrysopelea)
") The Journal of Experimental Biology 2, 135-1 Published by The Company of Biologists 25 doi:.122/jeb.15 135 Effects of size and behavior on aerial performance of two species of flying snakes (Chrysopelea)
The Journal of Experimental Biology 2, 135-1 Published by The Company of Biologists 25 doi:.122/jeb.15 135 Effects of size and behavior on aerial performance of two species of flying snakes (Chrysopelea)
Effects of a Pre-Molt Calcium and Low-Energy Molt Program on Laying Hen Behavior During and Post-Molt
 Animal Industry Report AS 655 ASL R2446 2009 Effects of a Pre-Molt Calcium and Low-Energy Molt Program on Laying Hen Behavior During and Post-Molt Emily R. Dickey Anna K. Johnson George Brant Rob Fitzgerald
Supplementary Fig. 1: Comparison of chase parameters for focal pack (a-f, n=1119) and for 4 dogs from 3 other packs (g-m, n=107).
 and for 4 dogs from 3 other packs (g-m, n=107).") Supplementary Fig. 1: Comparison of chase parameters for focal pack (a-f, n=1119) and for 4 dogs from 3 other packs (g-m, n=107). (a,g) Maximum stride speed, (b,h) maximum tangential acceleration, (c,i)
Supplementary Fig. 1: Comparison of chase parameters for focal pack (a-f, n=1119) and for 4 dogs from 3 other packs (g-m, n=107). (a,g) Maximum stride speed, (b,h) maximum tangential acceleration, (c,i)
The Secret Life of Birds
 The Secret Life of Birds Revealed Marilyn Ellis, OMN, CIG Oregon Master Naturalist Certified Interpretive Guide You can be a birdwatcher without. 1. Knowing what species they are by name OR 2. Recognizing
HEAD-BOBBING IN PIGEONS: HOW STABLE IS THE HOLD PHASE?
 The Journal of Experimental Biology 203, 935 940 (2000) Printed in Great Britain The Company of Biologists Limited 2000 JEB2500 935 HEAD-BOBBING IN PIGEONS: HOW STABLE IS THE HOLD PHASE? NIKOLAUS F. TROJE*
ANTHR 1L Biological Anthropology Lab
 ANTHR 1L Biological Anthropology Lab Name: DEFINING THE ORDER PRIMATES Humans belong to the zoological Order Primates, which is one of the 18 Orders of the Class Mammalia. Today we will review some of
The energetic cost of variations in wing span and wing asymmetry in the zebra finch Taeniopygia guttata
 The Journal of Experimental Biology 27, 3977-3984 Published by The Company of Biologists 24 doi:1.1242/jeb.1235 3977 The energetic cost of variations in wing span and wing asymmetry in the zebra finch
Evolution in Action: Graphing and Statistics
 Evolution in Action: Graphing and Statistics OVERVIEW This activity serves as a supplement to the film The Origin of Species: The Beak of the Finch and provides students with the opportunity to develop
Specialized primary feathers produce tonal sounds during flight in rock pigeons. Department, University of Puget Sound, Tacoma, WA 98416, USA
 First posted online on 13 May 2016 as 10.1242/jeb.131649 J Exp Biol Advance Access the Online most recent Articles. version First at http://jeb.biologists.org/lookup/doi/10.1242/jeb.131649 posted online
Applicability of Earn Value Management in Sri Lankan Construction Projects
 Applicability of Earn Value Management in Sri Lankan Construction Projects W.M.T Nimashanie 1 and A.A.D.A.J Perera 2 1 National Water Supply and Drainage Board Regional Support Centre (W-S) Mount Lavinia
Video Assignments. Microraptor PBS The Four-winged Dinosaur Mark Davis SUNY Cortland Library Online
 Video Assignments Microraptor PBS The Four-winged Dinosaur Mark Davis SUNY Cortland Library Online Radiolab Apocalyptical http://www.youtube.com/watch?v=k52vd4wbdlw&feature=youtu.be Minute 13 through minute
Answers to Questions about Smarter Balanced 2017 Test Results. March 27, 2018
 Answers to Questions about Smarter Balanced Test Results March 27, 2018 Smarter Balanced Assessment Consortium, 2018 Table of Contents Table of Contents...1 Background...2 Jurisdictions included in Studies...2
Using Physics for Motion Retargeting
 Thesis Submitted to Utrecht University for the degree of Master of Science Supervisor: drs. Arno Kamphuis INF/SCR-10-13 Utrecht University Department of Computer Science MSc Program: Game and Media Technology
Active sensing. Ehud Ahissar
 Active sensing Ehud Ahissar 1 Active sensing Passive vs active sensing (touch) Comparison across senses Basic coding principles -------- Perceptual loops Sensation-targeted motor control Proprioception
Optoacoustic imaging of an animal model of prostate cancer
 Optoacoustic imaging of an animal model of prostate cancer Michelle P. Patterson 1,2, Michel G. Arsenault 1, Chris Riley 3, Michael Kolios 4 and William M. Whelan 1,2 1 Department of Physics, University
Effective Vaccine Management Initiative
 Effective Vaccine Management Initiative Background Version v1.7 Sep.2010 Effective Vaccine Management Initiative EVM setting a standard for the vaccine supply chain Contents 1. Background...3 2. VMA and
The relationship between limb morphology, kinematics, and force during running: the evolution of locomotor dynamics in lizardsbij_
 Biological Journal of the Linnean Society, 2009, 97, 634 651. With 7 figures REVIEW The relationship between limb morphology, kinematics, and force during running: the evolution of locomotor dynamics in
University of Pennsylvania. From Perception and Reasoning to Grasping
 University of Pennsylvania GRASP LAB PR2GRASP: From Perception and Reasoning to Grasping Led by Maxim Likhachev Kostas Daniilides Vijay Kumar Katherine J. Kuchenbecker Jianbo Shi Daniel D. Lee Mark Yim
Do the traits of organisms provide evidence for evolution?
 PhyloStrat Tutorial Do the traits of organisms provide evidence for evolution? Consider two hypotheses about where Earth s organisms came from. The first hypothesis is from John Ray, an influential British
$? 479 THE FUNCTION OF M. DEPRESSOR CAUDAE AND M. CAUDOFEMORALIS IN PIGEONS
 Oct.1 $? 479 THE FUNCTION OF M. DEPRESSOR CAUDAE AND M. CAUDOFEMORALIS IN PIGEONS BY HARVEY I. FISHER THE usual method of determining the function of a muscle is by gross dissection and study of attachments.
FCI LT LM UNDERGROUND
 FCI LT LM UNDERGROUND Faulted Circuit Indicator for Underground Applications Catalogue # s #29 6028 000 PPZ, #29 6015 000 PPZ, #29 6228 000, #29 6215 000 Description The Navigator LT LM (Load Tracking,
FOOTEDNESS IN DOMESTIC PIGEONS
 FOOTEDNESS IN DOMESTIC PIGEONS I BY HARVEY I. FISHER N studies of the landing forces of Domestic Pigeons (Columba Zivia) it was noted (Fisher, 1956a, 19566) that the birds did not always land si- multaneously
DALE RITTER Department of Ecology and Evolutionary Biology, Box G, Walter Hall, Brown University, Providence, RI 02912, USA. Accepted 27 June 1995
 The Journal of Experimental Biology 9, 77 9 (995) Printed in Great Britain The Company of Biologists Limited 995 JEB993 77 EPAXIAL MUSCLE FUNCTION DURING LOCOMOTION IN A LIZARD (VARANUS SALVATOR) AND THE
from an experimental bag net SHIODE, DAISUKE; TAKAHASHI, MUTSUKI Proceedings of the 6th Internationa SEASTAR2000 workshop) (2011): 31-34
 (2011): 31-34") Development of sea turtle releasing Titlenet/pound net fisheries 2 - practic from an experimental bag net SHIODE, DAISUKE; TAKAHASHI, MUTSUKI Author(s) FUXIANG; TOKAI, TADASHI; KOBAYASHI, ABE, OSAMU Proceedings
Development of sea turtle releasing Titlenet/pound net fisheries 2 - practic from an experimental bag net SHIODE, DAISUKE; TAKAHASHI, MUTSUKI Author(s) FUXIANG; TOKAI, TADASHI; KOBAYASHI, ABE, OSAMU Proceedings
Effects of Cage Stocking Density on Feeding Behaviors of Group-Housed Laying Hens
 AS 651 ASL R2018 2005 Effects of Cage Stocking Density on Feeding Behaviors of Group-Housed Laying Hens R. N. Cook Iowa State University Hongwei Xin Iowa State University, hxin@iastate.edu Recommended
Introduction to phylogenetic trees and tree-thinking Copyright 2005, D. A. Baum (Free use for non-commercial educational pruposes)
") Introduction to phylogenetic trees and tree-thinking Copyright 2005, D. A. Baum (Free use for non-commercial educational pruposes) Phylogenetics is the study of the relationships of organisms to each other.
Introduction to phylogenetic trees and tree-thinking Copyright 2005, D. A. Baum (Free use for non-commercial educational pruposes) Phylogenetics is the study of the relationships of organisms to each other.
Writing Simple Procedures Drawing a Pentagon Copying a Procedure Commanding PenUp and PenDown Drawing a Broken Line...
 Turtle Guide Contents Introduction... 1 What is Turtle Used For?... 1 The Turtle Toolbar... 2 Do I Have Turtle?... 3 Reviewing Your Licence Agreement... 3 Starting Turtle... 3 Key Features... 4 Placing
Vertebrates. Vertebrates are animals that have a backbone and an endoskeleton.
 Vertebrates Vertebrates are animals that have a backbone and an endoskeleton. The backbone replaces the notochord and contains bones called vertebrae. An endoskeleton is an internal skeleton that protects
ANS 490-A: Ewe Lamb stemperament and Effects on Maze Entry, Exit Order and Coping Styles When Exposed to Novel Stimulus
 Animal Industry Report AS 663 ASL R3182 2017 ANS 490-A: Ewe Lamb stemperament and Effects on Maze Entry, Exit Order and Coping Styles When Exposed to Novel Stimulus Emily Strong Iowa State University Samaneh
How Does Photostimulation Age Alter the Interaction Between Body Size and a Bonus Feeding Program During Sexual Maturation?
 16 How Does Photostimulation Age Alter the Interaction Between Body Size and a Bonus Feeding Program During Sexual Maturation? R A Renema*, F E Robinson*, and J A Proudman** *Alberta Poultry Research Centre,
Lab 6: Energizer Turtles
 Lab 6: Energizer Turtles Screen capture showing the required components: 4 Sliders (as shown) 2 Buttons (as shown) 4 Monitors (as shown) min-pxcor = -50, max-pxcor = 50, min-pycor = -50, max-pycor = 50
Proceedings of the International Sy. SEASTAR2000 Workshop) (2004):
 (2004):") Title A new technique for monitoring graz turtles (Eretmochelys imbricata) us Author(s) OKUYAMA, JUNICHI; SHIMIZU, TOMOHITO KENZO; ARAI, NOBUAKI Proceedings of the International Sy Citation SEASTAR2 and
Title A new technique for monitoring graz turtles (Eretmochelys imbricata) us Author(s) OKUYAMA, JUNICHI; SHIMIZU, TOMOHITO KENZO; ARAI, NOBUAKI Proceedings of the International Sy Citation SEASTAR2 and
Migration. Migration = a form of dispersal which involves movement away from and subsequent return to the same location, typically on an annual basis.
 Migration Migration = a form of dispersal which involves movement away from and subsequent return to the same location, typically on an annual basis. To migrate long distance animals must navigate through
Biol 160: Lab 7. Modeling Evolution
 Name: Modeling Evolution OBJECTIVES Help you develop an understanding of important factors that affect evolution of a species. Demonstrate important biological and environmental selection factors that
PEREGRINE FALCON HABITAT MANAGEMENT GUIDELINES ONTARIO MINISTRY OF NATURAL RESOURCES
 PEREGRINE FALCON HABITAT MANAGEMENT GUIDELINES ONTARIO MINISTRY OF NATURAL RESOURCES December 1987 2 Table of Contents Page Introduction...3 Guidelines...4 References...7 Peregrine Falcon Nest Site Management
Mechanical Characteristics of Rat Vibrissae: Resonant Frequencies and Damping in Isolated Whiskers and in the Awake Behaving Animal
 6510 The Journal of Neuroscience, July 23, 2003 23(16):6510 6519 Behavioral/Systems/Cognitive Mechanical Characteristics of Rat Vibrissae: Resonant Frequencies and Damping in Isolated Whiskers and in the
CLADISTICS Student Packet SUMMARY Phylogeny Phylogenetic trees/cladograms
 CLADISTICS Student Packet SUMMARY PHYLOGENETIC TREES AND CLADOGRAMS ARE MODELS OF EVOLUTIONARY HISTORY THAT CAN BE TESTED Phylogeny is the history of descent of organisms from their common ancestor. Phylogenetic
IQ Range. Electrical Data 3-Phase Power Supplies. Keeping the World Flowing
 IQ Range Electrical Data 3-Phase Power Supplies Keeping the World Flowing Contents Section Page Introduction 3 50 Hz 380 V 5 0 V 6 415 V 7 4 V 8 500 V 9 6 V 60 Hz 8 V 11 2 V 0 V 13 4 V 14 460 V 15 480
Appendix A Literature Review
 Appendix A Literature Review 1. Introduction Morphological characteristics of aggregates have significant influence on the performance of construction materials such as HMA and hydraulic PCC. Consequently,
Shedding Light on the Dinosaur-Bird Connection
 Shedding Light on the Dinosaur-Bird Connection This text is provided courtesy of the American Museum of Natural History. When people think of dinosaurs, two types generally come to mind: the huge herbivores
Trends and challenges in Engineering geodesy
 Trends and challenges in Engineering geodesy Rudolf STAIGER rudolf.staiger@hs-bochum.de International Federation of Surveyors Féderation Internationale des Géomètres Internationale Vereinigung der Vermessungsingenieure
Penn Vet s New Bolton Center Launches Revolutionary Robotics-Controlled Equine Imaging System New technology will benefit animals and humans
 Contacts: Louisa Shepard, Communications Specialist for New Bolton Center 610-925-6241, lshepard@vet.upenn.edu Ashley Berke, Penn Vet Director of Communications 215-898-1475, berke@vet.upenn.edu For Immediate
Population Dynamics: Predator/Prey Teacher Version
 Population Dynamics: Predator/Prey Teacher Version In this lab students will simulate the population dynamics in the lives of bunnies and wolves. They will discover how both predator and prey interact
Flea Jump page 1.01 RR Lew
 Flea Jump page 1.01 RR Lew Flea Biology How high can a flea jump? About 20 cm or so, similar to the height that a human can jump. The real question is why do humans and fleas (and other organisms) all
Rapid City, South Dakota Waterfowl Management Plan March 25, 2009
 Waterfowl Management Plan March 25, 2009 A. General Overview of Waterfowl Management Plan The waterfowl management plan outlines methods to reduce the total number of waterfowl (wild and domestic) that
Human-Animal Interactions in the Turkey Industry
 Human-Animal Interactions in the Turkey Industry Dr. Naomi A. Botheras 1, Ms. Jessica A. Pempek 2, Mr. Drew K. Enigk 2 1 PI, 222E Animal Sciences Building, 2029 Fyffe Court, Columbus, OH 43210 (614) 292-3776;
Lecture 1: Turtle Graphics. the turtle and the crane and the swallow observe the time of their coming; Jeremiah 8:7
 Lecture 1: Turtle Graphics the turtle and the crane and the sallo observe the time of their coming; Jeremiah 8:7 1. Turtle Graphics The turtle is a handy paradigm for the study of geometry. Imagine a turtle
DO BROWN-HEADED COWBIRDS LAY THEIR EGGS AT RANDOM IN THE NESTS OF RED-WINGED BLACKBIRDS?
 Wilson Bull., 0(4), 989, pp. 599605 DO BROWNHEADED COWBIRDS LAY THEIR EGGS AT RANDOM IN THE NESTS OF REDWINGED BLACKBIRDS? GORDON H. ORTANS, EIVIN RDSKAPT, AND LES D. BELETSKY AssrnAcr.We tested the hypothesis
FPGA-based Emotional Behavior Design for Pet Robot
 FPGA-based Emotional Behavior Design for Pet Robot Chi-Tai Cheng, Shih-An Li, Yu-Ting Yang, and Ching-Chang Wong Department of Electrical Engineering, Tamkang University 151, Ying-Chuan Road, Tamsui, Taipei
INTRODUCTION & MEASURING ANIMAL BEHAVIOR
 INTRODUCTION & MEASURING ANIMAL BEHAVIOR Photo courtesy: USDA What is behavior? Aggregate of responses to internal and external stimuli - Dictionary.com The action, reaction, or functioning of a system,
How do low-quality females know they re low-quality and do they always prefer low-quality mates?
 Introduction: How do low-quality females know they re low-quality and do they always prefer low-quality mates? The relatively young field of condition-dependent variation in female mate preferences has
Sensitive and selective analysis of fipronil residues in eggs using Thermo Scientific GC-MS/MS triple quadrupole technology
 APPLICATION NOTE 10575 Sensitive and selective analysis of fipronil residues in eggs using Thermo Scientific GC-MS/MS triple quadrupole technology Authors Cristian Cojocariu, 1 Joachim Gummersbach, 2 and
muscles (enhancing biting strength). Possible states: none, one, or two.
. Possible states: none, one, or two.") Reconstructing Evolutionary Relationships S-1 Practice Exercise: Phylogeny of Terrestrial Vertebrates In this example we will construct a phylogenetic hypothesis of the relationships between seven taxa
Reconstructing Evolutionary Relationships S-1 Practice Exercise: Phylogeny of Terrestrial Vertebrates In this example we will construct a phylogenetic hypothesis of the relationships between seven taxa
SEASONAL PATTERNS OF NESTING IN THE RED-WINGED BLACKBIRD MORTALITY
 Condor, 80:290-294 0 The Cooper Ornithological Society 1978 SEASONAL PATTERNS OF NESTING IN THE RED-WINGED BLACKBIRD MORTALITY DONALD F. CACCAMISE It is likely that birds adjust their reproductive period
5 State of the Turtles
 CHALLENGE 5 State of the Turtles In the previous Challenges, you altered several turtle properties (e.g., heading, color, etc.). These properties, called turtle variables or states, allow the turtles to
NAME: DATE: SECTION:
 NAME: DATE: SECTION: MCAS PREP PACKET EVOLUTION AND BIODIVERSITY 1. Which of the following observations best supports the conclusion that dolphins and sharks do not have a recent common ancestor? A. Dolphins
From Reptiles to Aves
 First Vertebrates From Reptiles to Aves Evolutions of Fish to Amphibians Evolution of Amphibians to Reptiles Evolution of Reptiles to Dinosaurs to Birds Common Ancestor of Birds and Reptiles: Thecodonts
Successful rearing for a good production in laying period
 Successful rearing for a good production in laying period Paul GRIGNON DUMOULIN ISA Technical Service Coordinator PIX, june 2018 Introduction Good layer productivity is strongly influenced by management
STANDARD OPERATING PROCEDURE
 Page 1 of 5 Version 4.0 STANDARD OPERATING PROCEDURE TITLE: 28-point Neuroscore Test CATEGORY: Behavioral Assay Introduction Goal: This document aims to provide the reader information on how to conduct
4B: The Pheasant Case: Handout. Case Three Ring-Necked Pheasants. Case materials: Case assignment
 4B: The Pheasant Case: Handout Case Three Ring-Necked Pheasants As you can see, the male ring-necked pheasant is brightly colored. The white ring at the base of the red and green head stand out against
Evolution of Birds. Summary:
 Oregon State Standards OR Science 7.1, 7.2, 7.3, 7.3S.1, 7.3S.2 8.1, 8.2, 8.2L.1, 8.3, 8.3S.1, 8.3S.2 H.1, H.2, H.2L.4, H.2L.5, H.3, H.3S.1, H.3S.2, H.3S.3 Summary: Students create phylogenetic trees to
All Dogs Parkour Exercises (Interactions) updated to October 6, 2018
 updated to October 6, 2018") All Dogs Parkour Exercises (Interactions) updated to October 6, 2018 NOTE: Minimum/maximum dimensions refer to the Environmental Feature (EF) being used. NOTE: The phrase "stable and focused" means the
All Dogs Parkour Exercises (Interactions) updated to October 6, 2018 NOTE: Minimum/maximum dimensions refer to the Environmental Feature (EF) being used. NOTE: The phrase "stable and focused" means the
STUDY BEHAVIOR OF CERTAIN PARAMETERS AFFECTING ASSESSMENT OF THE QUALITY OF QUAIL EGGS BY COMPUTER VISION SYSTEM
 STUDY BEHAVIOR OF CERTAIN PARAMETERS AFFECTING ASSESSMENT OF THE QUALITY OF QUAIL EGGS BY COMPUTER VISION SYSTEM Zlatin Zlatev, Veselina Nedeva Faculty of Technics and Technologies, Trakia University Graf
Ames, IA Ames, IA (515)
") BENEFITS OF A CONSERVATION BUFFER-BASED CONSERVATION MANAGEMENT SYSTEM FOR NORTHERN BOBWHITE AND GRASSLAND SONGBIRDS IN AN INTENSIVE PRODUCTION AGRICULTURAL LANDSCAPE IN THE LOWER MISSISSIPPI ALLUVIAL
BENEFITS OF A CONSERVATION BUFFER-BASED CONSERVATION MANAGEMENT SYSTEM FOR NORTHERN BOBWHITE AND GRASSLAND SONGBIRDS IN AN INTENSIVE PRODUCTION AGRICULTURAL LANDSCAPE IN THE LOWER MISSISSIPPI ALLUVIAL
The EVM + AGILE Anthology
 The EVM + AGILE Anthology Ray W. Stratton, PMP, EVP Management Technologies raystratton@mgmt-technologies.com Project Management Institute California Inland Empire Chapter 17 February 2015 Who is this
Case Study: SAP Implementation in Poultry (Hatcheries) Industry
 Industry") Case Study: SAP Implementation in Poultry (Hatcheries) Industry Applies to: Live Stock industries that deal with the poultry breeding and feed manufacturing processes. Poultry segment is involved in the
Case Study: SAP Implementation in Poultry (Hatcheries) Industry Applies to: Live Stock industries that deal with the poultry breeding and feed manufacturing processes. Poultry segment is involved in the
Factors Affecting Breast Meat Yield in Turkeys
 Management Article The premier supplier of turkey breeding stock worldwide CP01 Version 2 Factors Affecting Breast Meat Yield in Turkeys Aviagen Turkeys Ltd Introduction Breast meat, in the majority of