Comparison of ground pressure distribution between claws of Holstein and Jersey cows, using a computerized human pressure mat system.
|
|
|
- Colleen King
- 5 years ago
- Views:
Transcription
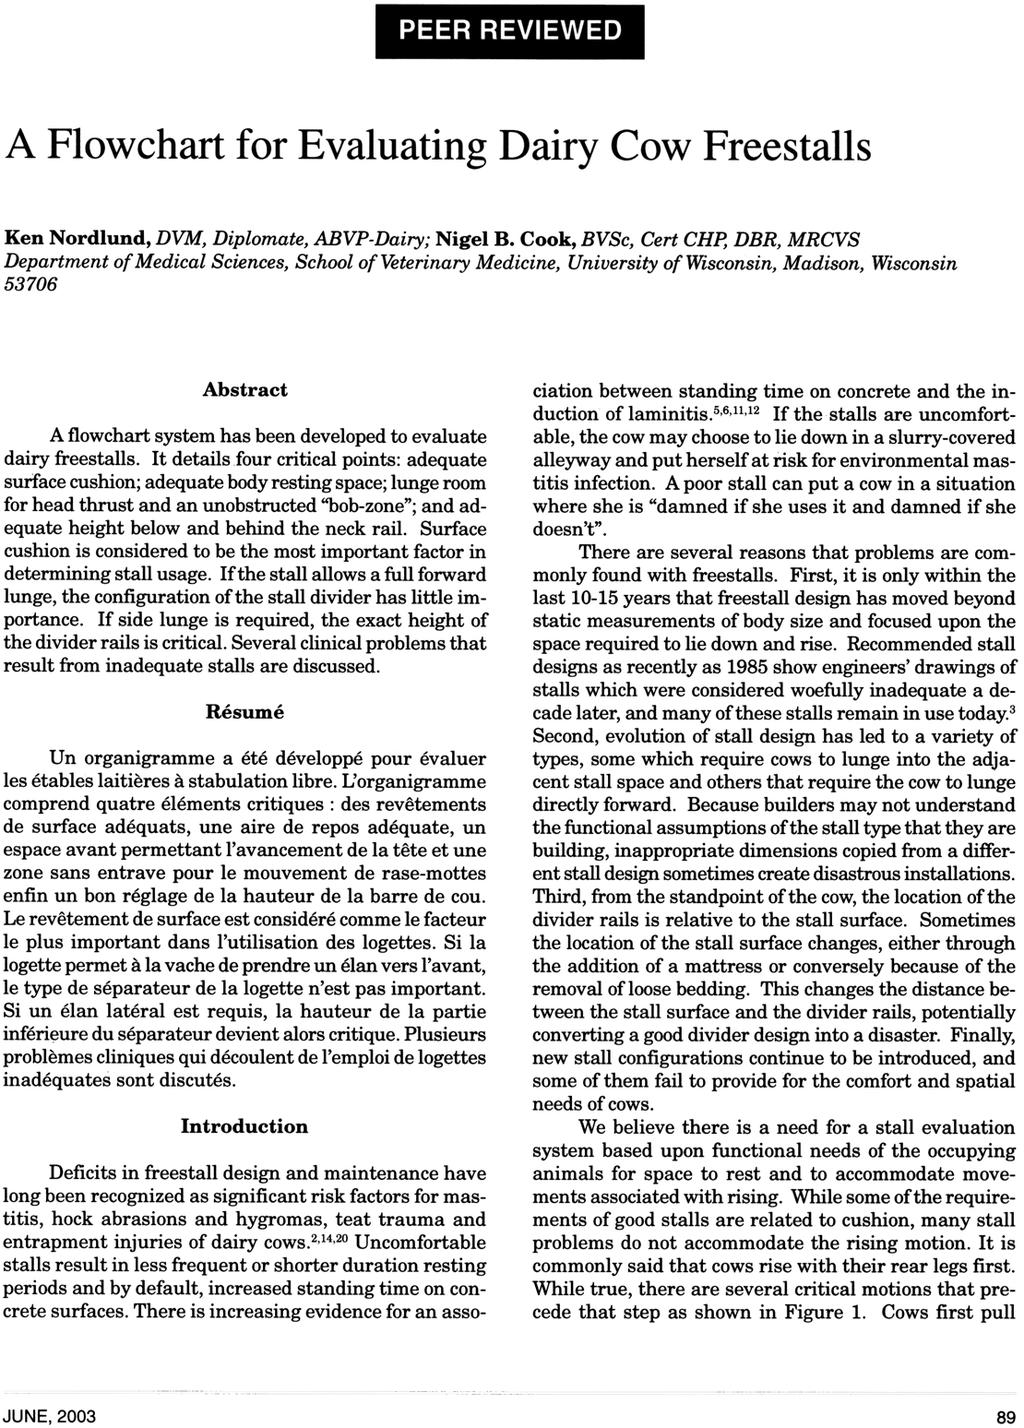
1
2 Comparison of ground pressure distribution between claws of Holstein and Jersey cows, using a computerized human pressure mat system. Matt D. Miesner, DVM, MS The Ohio State University College of Veterinary Clinical Sciences Objectives: The primary objective of the project was to determine if Jersey cows are less likely to suffer lameness from sole lesions than Holsteins, merely due to the reduction in pressure applied to the ground. Lower pressures would lessen fatigue on hoof wall and sole support structures and therefore reduce the trauma to the vascular corium. A secondary objective was to determine differences and similarities of pressure distribution between limbs and claws of cows, using a mat pressure system designed for human use. The third objective was to determine if differences in pressure across the soles of individual claws could explain the location of the majority of sole lesions seen clinically. Design: Sixteen mature dairy cows were used, comprised of eight Jersey and eight Holstein cows. All cows belonged to the same farm and were evaluated the same day on the farm. The dairy farm maintains approximately one hundred and ten cows, of which consist of about forty five percent Jersey and the remainder being Holstein. All cows are commingled and managed the same. The herd is trimmed three times per year; winter, spring, and late summer. All cows used in the study were determined to be sound by clinical observation of two of the investigators as well as the herdsman. All cattle evaluated had been trimmed three to five weeks prior to data collection. All cows were currently in the milking string and maintained and fed on concrete flooring. The pressure instrumentation used to collect and analyze the ground reaction pressures is commonly used in human foot pressure evaluation. The system consists of a pressure sensor mat which feeds information into a computerized program in real time movie frames. The movies are recorded and stored in a patient database for further analysis. The pressure mat was placed on a flat, level surface of concrete flooring at the farm. To limit shear forces as well as protect the mat from the sharpness of the cows claws, a thin rubber mat was places over the sensor. The sensor mat was then calibrated at a known weight over a surface area representative of a cow s hoof print. All cows on the farm are already trained to lead, so the test subjects were walked across the mat obtaining a 200 frame movie containing a front and rear hoof reading. The cow was turned around and the opposite front and rear limbs were recorded in a separate 200 frame movie. The movies were analyzed and data for combined claw surface area, stride time, and peak claw pressure were reviewed for each hoof. Peak pressures were collected for medial and lateral claws individually as well as three individual regions of each claw, cranial (toe), middle, and caudal (heel).
3 Results: No statistically significant results were achieved for mean time of stride indicating all cows were walking at similar speeds while recording the data. This is important to limit disparity of forces while collecting the data. Significant differences (P<0.05) were obtained for surface area both between breeds and front vs. hind within respective breeds. Holsteins had a larger mean contact surface area than Jerseys, more apparent in the front claws (P=0.003) than the hind (P=0.05). Mean surface area difference between front and hind claws within breeds varied more in Holsteins than Jerseys, although statistical significance was not achieved in either breed. Pressure analysis began with comparing left and right limbs within breeds for any statistically significant differences which may prevent combining left and right limb data within each breed before comparing to the opposite breed. Combining data of the left and right limbs would increase the statistical power of comparison. Holstein cows had higher mean pressures in the front limbs than Jerseys but not a statistically significant difference (p=0.57). Actually the front medial claw of the Jerseys had the highest mean pressures of the individual claws of the font feet of both breeds. Jersey cows would bare the majority of the weight on the medial claw compared to the lateral claw (P=0.004). Holsteins showed a more equal distribution of weight between the medial and lateral claws (P=0.46). Hind claw pressure analysis demonstrated that Holsteins again had a higher mean pressure than Jerseys, although also not statistically different (P=0.33). Despite Holsteins having higher mean pressures in the lateral versus the medial claw (P=0.003), Jerseys demonstrated no significant variation in favor of higher lateral claw pressure (P=0.66). Comparison of hind lateral claw pressure between breeds, demonstrated a significant difference (P=0.05) in favor of higher pressures in the Holstein cows. Analysis of regions of individual claws was performed to determine if there were focal areas of pressure differences that may coincide with clinical observations of high risk areas for sole lesions. Indeed the most consistent differences indicated that the highest pressures were seen in the posterior regions of the lateral claws in the hind limbs, consistent with the formation of sole (Rusterholtz) ulcers. The Holstein cows had the highest pressures in this region (P=0.05).


4 Ohio Dairy Vets, January 7-8, Change in DMI > absolute amount Cow behavior, pen moves, stocking rates, and health Ken Nordlund, DVM School of Veterinary Medicine University of Wisconsin Grummer, et. al, 2004 Emerging from the shadow of the nutritionists... Topics Herd average vs. disease outliers Cow behavior basics Pen moves and intervals Space - Stocking density


5 Ohio Dairy Vets, January 7-8, 2005 Relative frequency 2 Herd average vs disease outlier Topics Herd average vs disease outlier Cow behavior basics Standard deviations from the mean Older cow behavior papers Cows form dominance hierarchies, strongly associated with age, body size, and seniority in herd Dickson, 1970 About 1 week required to re-establish dominance hierarchy Schein, 1977 Usually 2.5-5% milk drop due to social disturbance Albright, 1978 Early lactation cows show more effect than others Konggaard & Krohn, 1978 Some terms to impress. Crepuscular: active at twilight hours of dawn and dusk Allelomimetic: all do the same thing all at the same time Barrows (2001), Animal Behavior Desk Reference, CRC Press Barrows (2001), Animal Behavior Desk Reference, CRC Press
 Anim. Prod.")
 Anim. Prod.")
6 Ohio Dairy Vets, January 7-8, Do cows behave differently in freestall barns? Behavior on grass vs. confinement Herd of 190 Holstein cows Pasture May September Freestall confinement October - April Lying, feeding, and agonistic interactions monitored Miller & Wood-Gush, (1991) Anim. Prod. 53: Synchrony of feeding behavior Synchrony of lying behavior % of herd Indoors Pasture % of herd Indoors Pasture :00 9:00 10:00 11:00 Time of day 12:00 13:00 14:00 15:00 16:00 17:00 18:00 19:00 20:00 21:00 22:00 23:00 24:00:00 1:00 2:00 3:00 4:00 Miller & Wood-Gush, (1991) Anim. Prod. 53: :00 0 8:00 9:00 10:00 11:00 12:00 13:00 14:00 15:00 16:00 17:00 18:00 19:00 20:00 21:00 Time of day Miller & Wood-Gush, (1991) Anim. Prod. 53: :00 23:00 24:00:00 1:00 2:00 3:00 4:00 5:00 Numbers of agonistic (conflict) interactions 10 Agonistic Interactions per cow per hour Grass Housed Miller & Wood-Gush, (1991) Anim. Prod. 53:
7 Ohio Dairy Vets, January 7-8, Stabilization of social hierarchy Two groups of 16 cows established (A & B) How long until rank is stabilized? After 5 weeks, 8 cows from each to a third group ( C) Monitored number and character of agonistic interactions Physical: Bunting, pushing, fighting Non-physical: Threatening, avoiding Kondo & Hurnik, (1990) Appl. An. Behav. Sci 27: Numbers of agonistic interactions Character of agonistic interactions No. interactions A B C % Day following move Kondo & Hurnik, (1990) Appl. An. Behav. Sci 27: Physical Non-physical Day following move Kondo & Hurnik, (1990) Appl. An. Behav. Sci 27: Other key points 3 rank orders described: dominance, leadership, and parlor entrance order (Lamb, 1975) Original resident cows maintain rank after new animals added (Schein & Fohrman,1955) Complete reversal of rank when dominant cow removed and new cow added (Hook, 1965) Other key points Cows losing weight will drop in rank compared to pen mates gaining weight (Arave, 1974) Dominant cows show little milk drop after move, but middle-rank and subordinates drop 3.8 and 5.5% in first 2 weeks (Hasegawa, 1997)


8 Ohio Dairy Vets, January 7-8, Topics Herd average vs. disease outliers Cow behavior basics Pen moves and intervals Pen Move Factors Number of periparturient moves Familiarity with facilities Duration of stay Pen moves All pen changes are not equal Periparturient and low rank most vulnerable Proximity Familiarity with pen features: Water source Stalls Milking parlor Headlocks, etc 3-5% reduction in DMI with head locks Batchelder, 2000 No difference in DMI or milk yield in trained cows with a switch back design Brouk et al., 2003 If new arrivals have not been trained, an area without headlocks should be available in the receiving pens. Pen moves All pen changes are not equal Periparturient and low rank most vulnerable Proximity Familiarity with pen features Duration of stay
9 Ohio Dairy Vets, January 7-8, Duration of stay: Kansas Intervals between pen entries Far-off dry cow (-60 to 21) Close-up dry cow freestalls (-21 to 3) Maternity pen bedded pack (-3 to 0) Colostrum pen bedded pack (0 to 3) Fresh Pen Freestalls (3 to 14 days) Lactation groups Weekly entries into pen etc. Daily entries into pen Smith, J. F., 2001, Special Needs Facilities, KSU publication Fresh cow / sick pen Grouping Duration of Stay in Pre-fresh Group Dry Cows Lactating Cows Dry Cows Lactating Cows Far-Off Dry Pre- Fresh Dry 1 st Lact Far-Off Dry Pre- Fresh Dry Sick Pen Mature Maternity Colostrum Days in Milk Pen Pen Days in Milk Effect of Days in Pre-Fresh Pen on Subsequent Milk Yield Outcome Adequate Pre-Fresh (9 days or more) Short Pre-Fresh (less than 9 days) Advantage Lactation 1 number of cows milk, lbs/lactation Lactation 2+ number of cows milk, lbs/lactation Calculated from data in Robinson et al., JDS 84:2273, 2001 Pre-fresh pen Movement into pen usually weekly, not daily Probably 2 days of social disruption, followed by 5 days of stability Heifers show most benefit of longer duration stay in pre-fresh pen Time of stay had much less effect on mature cows
 Long ( 3+ days) Herd L (4.")
 number of calvings 34 129 --- sold or dead by 85 DIM, % 2.9 9.3 3.")
10 Ohio Dairy Vets, January 7-8, Maternity Pen Grouping Dry Cows Lactating Cows Far-Off Dry Pre- Fresh Dry Maternity Days in Milk Pen Effect on Short or Long Maternity Pen Stays on Post- Partum Cow Performance in Two Dairy Herds Estimating average days in pen Length of maternity pen stay: Outcome Short ( < 48 hours) Long ( 3+ days) Herd L (4.5 average days in maternity pen) Advantage to short stay number of calvings sold or dead by 60 DIM, % X ME milk at 1st test, lbs 20,777 20, lbs Herd S (5.9 average days in maternity pen) number of calvings sold or dead by 85 DIM, % X Get estimate of average # cows in maternity pen Estimate average # calvings per day by dividing yearly total by 365 Divide: average # cows in pen average # of calvings per day subclinical ketosis, % X displaced abomasum, % X Oetzel, unpublished data, 2003 Problem Herd Investigation: October 29, cow Holstein herd Milk yield 20,000 lbs RHA 15% annual incidence of DA s 13% annual death losses 42% turnover rate
 cows tested, number 7 13 cows with NEFA >.40 meq/l 0 4 cows with NEFA >.40 meq/l, % 0% 31% 1 All cows calved more than 48 hours after the blood sample was collected.")

11 Ohio Dairy Vets, January 7-8, Plasma NEFA 1 by Pen Location in a Commercial Dairy 2 Location of cow at sampling: Outcome Dry cow pen Maternity pack Maternity Herd V (7 average days in maternity) cows tested, number 7 13 cows with NEFA >.40 meq/l 0 4 cows with NEFA >.40 meq/l, % 0% 31% 1 All cows calved more than 48 hours after the blood sample was collected. 2 Herd data: 44% prevalence of subclinical ketosis in the post-fresh pen, 15% annual incidence of displaced abomasum, and 13% annual death loss. Oetzel, unpublished data, 2003 Pre-Fresh NEFA by Pen and Days to Calving NEFA, meq/l Pre-Fresh NEFA by Pen and Days to Calving Days relative to calving Pen moves near calving time Intake is disrupted for low-rank cows NEFA and fatty liver before calving Type II ketosis after calving Fatty liver related to infectious and metabolic disease and future reproductive consequences Dry Pen Maternity Pen Oetzel, unpublished data, 2003 Approaches to maternity areas Overcrowded Move Move cow in a to to cow calving colostrum prefresh at 15 pen pen days pen and misjudge date Skilled people can select cows and limit time to 2 days or less for 95% of calvings Move cows only when labor has begun, i.e., feet showing
12 Ohio Dairy Vets, January 7-8, Approaches to maternity areas All-in, all-out pen Skilled people can select cows and limit time to 2 days or less for 95% of calvings Move cows only when labor has begun, i.e., feet showing Multiple, bedded materinity packs, all-in, all out Fresh cow / sick pen Grouping Why a sick pen? Dry Cows Far-Off Dry Pre- Fresh Dry Lactating Cows 1 st Lact Mature Sick Pen Maternity Colostrum Days in Milk Pen Pen Isolation of pathogen-shedding animals Probably effective only for specific mastitis problems (S. aureus, Mycoplasma) Too late for most respiratory and enteric pathogens Primary reason is to reduce antibiotic risk to bulk tank Alternatives? Leave treated cow where she was identified High risk because of antibiotic with-holding Requires consistent discipline in the parlor Leave in place, but treat with no-discard products Naxcel / Excenel Consider especially for low rank cows, i.e. heifers and known timid cows Topics Herd average vs. disease outliers Cow behavior basics Pen moves and intervals Space and stocking density
13 Ohio Dairy Vets, January 7-8, Space and stocking density Stall usage and lameness Density of airborne bacteria and respiratory disease Feeding behavior Production impact Space and stocking density Stall usage Effect of Overstocking on Aggressive Behavior and Lying Time Overstocking and Lying Stocking Rate, % of stalls Lying Time / hrs Number of Evictions / day Friend, et. al., 1977 Change in total lying compared to 100% stocking (mins) Degree of overstocking Compensation * Wierenga & Hopster, 1990 Freestall Lying (mins) High Ranking Cows Day Evening Night Low Ranking Cows * * Wierenga & Hopster, 1990 * * Survival Time to Lameness Percent of subgroup High Rank Low Rank Weeks after calving Galindo & Broom, (2000) Res. Vet. Sci 69:75-79


14 Ohio Dairy Vets, January 7-8, Space and stocking density Stall usage and lameness Density of airborne bacteria and respiratory disease Typical bacterial counts in air Outdoor air = cfu/m 3 Clean office air = 1,000 cfu/m 3 Well ventilated barn = 10-15,000 cfu/m 3 Chronic pneumonia barn = > 500,000 cfu/m 3 Ongoing pneumonia in startup dairy 60 Number of Cows with Pneumonia by stage of lactation North Dairy South Dairy Number DIM >450


15 Ohio Dairy Vets, January 7-8, C = N R x V q r + q s + q d + q v, where C = cfu / m 3 of air, N = number of animals V = volume of air in building R = release of organisms q = clearance by inspiration (r), sedimentation (s), dessication (d), and ventilation (v). Cfu per m 3, adjusted for stacking on high-density plates Close-up Pen Hospital Pen Fresh Pen East Lact.Barn North est. 14,177 5,042 7, ,000 South est. 500,000 6,404 16,662 Not done Airborne bacteria High counts without pathogens will not cause disease Environments that allow concentration of normal bacteria will also allow pathogens to accumulate If pathogen-shedding animals are introduced to the space, the environment becomes a risk Primary recommendation Eliminate overstocking of the closeup pens by either expanding the barn or by reducing length of dry period

16 Ohio Dairy Vets, January 7-8, Pneumonia cases per month Space and stocking density Change in dry period length implemented in mid-november Stall usage and lameness 20 Density of airborne bacteria and 15 North Dairy Pneumonia Cows Culled North Dairy Pneumonia Cows Retained respiratory disease 10 Feeding behavior 5 0 Jan-02 Feb-02 Mar-02 Apr-02 May-02 Jun-02 Jul-02 Aug-02 Sep-02 Oct-02 Nov-02 Dec-02 Jan-03 Feb-03 Mar-03 Apr-03 May-03 Jun-03 Jul-03 Aug-03 Sep-03 Oct-03 Nov-03 Dec-03 Competing drives at feedbunk Hunger (time, milking, palatability, etc) Allelomimetic (herding instincts) Space (physical space, personal space, rank) Effect of increasing feed space on feeding behavior within 90 min of fresh feed delivery Post-Feeding Feeding Activity at 1.0m / cow y = 0.48x R 2 = Post-Feeding Feeding Activity at 0.5m / cow DeVries et al., 2004 Primary & Secondary Peaks in Feed Bunk Utilization Agonistic Interactions per cow per hour Proportion of feed bunk spaces filled :12 milking Secondary Peak 16:02 all back 18:19 push 23:03 all back Secondary Peak 8:20 feed delivery 7:46 all back 6:50 0:07 push up push up 4:47 push up Primary Peak 9:44 push up Total Agonistic Interactions per Cow a b :14 push up 17:44 push up Row Pen 3-Row Pen :52 11:52 12:52 13:52 21:50 16:47 push up milking 14:52 15:52 16:52 17:52 18:52 19:52 20:52 21:52 22:12 push up 22:52 23:52 0:52 1:52 2:52 3:52 4:52 5:52 6:52 6:20 milking 7:52 8:52 9:52 10:52 11:52 12:52 13:52 14:52 15:52 Three-row pens have more agonistic interactions per cow per hour than two-row pens (medians, p=0.008) Time Cook, Nordlund, et. al, in press
17 Ohio Dairy Vets, January 7-8, Preliminary Implications Pen Design & Feeding Behavior Tremendous drive to eat following milking More agonistic interactions at 3-row bunks Separating heifers more important in 3-row pens Rethink the 24 headlock design as all stalls are not used Space and stocking density Stall usage and lameness Density of airborne bacteria and respiratory disease Feeding behavior Production impact of stocking density Production Effect of Pre-Fresh Over- Stocking (Field Research Project) Pre-fresh pen stocking density ranged from 62 to 138% of stalls No overcrowding post-fresh First calf heifers grouped with the older cows (pre- and post-fresh) Pre-fresh overstocking lowered post-fresh milk yield for 1st lact Milk, lbs/day Pre-Fresh Stocking Density (presd) and Post-Fresh Milk Yield Modeled relationship; n=132 1 st Lactation Heifers Lose 1.6 lbs milk for each 10% increase in pre-fresh stocking density Days in Milk 80% presd 100% presd 120% presd P<.01 for effect of presd on milk yield Oetzel, unpublished data, 2003 Fixed size pens & variable size groups Optimal special needs stocking rate is ~ 85% Usually sized to fit a constant flow of normal numbers Bunching follows reproductive performance, expansion, etc. DOUBLING the area and stalls for special needs estimated to cost $60 per cow per year (Smith, KSU, 2001), UW-SVM Cow Comfort and Well-being Consortium Pfizer Animal Health Zinpro Corporation AgSource VitaPlus Corporation Merck-Merial Land O Lakes Inc. SVM Food Animal Fund
18 Survey of Practicing Veterinarian s Biosecurity Practices David E Anderson, DVM, MS, DACVS Head, Food Animal Medicine and Suregry College of Veterinary Medicine The Ohio State University Columbus, Ohio P: ; F: Anderson.670@osu.edu Purpose: To gain insight into current standards of practice regarding biosecurity protocols used by practicing veterinarians working on farms. Materials and Methods: An electronic survey was distributed using the e-lists of the American Association of Bovine Practitioners, American Association of Small Ruminant Practitioners, and a Llama Medicine Discussion Group. Practitioners were asked to provide details of biosecurity protocols they personally used when visitng client farms. Veterinarians were specifically asked not to discuss idealized protocols, were discouraged from projecting what they thought an optimal program would be, or to discuss any practice they were not actually performing. Instead, practitioners were asked to describe specifically what they actually do on a day-to-day basis for biosecurity and to make specific reference to practice type, state, country, coveralls/ aprons, boots, head covers, truck maintenance, separation of animals, facilities maintenance, needle use e.g. for vaccinations, instrument maintenance, any other specific item. STUDY POPULATION: Practice type: Bovine n=26 veterinarians / practices States / provinces, etc in survey: Idaho, New York, Utah, Quebec - Canada, Ohio, Ontario - Canada, Wisconsin, Pennsylvania, Michigan, Vermont, Munich - Germany, Nebraska, Skara Sweden, California, Quito Equador, Washington, and Texas. Practice Type: Mixed large animal n=27 veterinarians / practices States / provinces, etc in survey: New York, Virginia, Connecticut, North Carolina, Oregon, Florida, Wisconsin, Illinois, Pennsylvania, Washington, Zurich, Ohio, Georgia, and California.
19 COVERALL USE Practice type: Bovine n=26 veterinarians / practices Coveralls: 14 out of 26 (54%) changed coveralls between farms, sometimes between building on the same farm. 12 out of 26 (46 %) changed coveralls as needed based on appearance of cleanliness. Practice Type: Mixed large animal n=27 veterinarians / practices Coveralls: 13 out of 27 (48%) changed coveralls between every farm, 1 out of 27 (4%) changed coveralls between all cattle client farms, but only as needed based on cleanliness between small ruminant/camelid farms. 13 out of 27 farms (48 %) changed coveralls on an as-needed basis. BOOTS USE: Practice type: Bovine n=26 veterinarians / practices Boots: 22 out of 26 (85%) cleaned / disinfected boots between farms. 4 out of 26 (15%) cleaned boots as needed for clean appearance. Practice Type: Mixed large animal n=27 veterinarians / practices Boots: 22 out of 27 (81%) cleaned boots between every farm. Of those 22, 4 (15% of total) indicated use disposable boot covers, especially if a problem has been identified at the farm. 5 out of 27 (19%) cleaned boot son an as-needed basis. Of those 5, 2 cleaned boots after every cattle call, but only cleaned as needed for small ruminant farms. HEAD COVER Practice type: Bovine n=26 veterinarians / practices Head Cover: Only 2 respondents indicated hat use, both wore same hat to all farms without cleaning unless obviously dirty. Practice Type: Mixed large animal n=27 veterinarians / practices Head Cover: Only 2 respondents indicated hat use, both wore same hat to all farms without cleaning unless obviously dirty.
20 TRUCK MAINTENANCE: Practice type: Bovine n=26 veterinarians / practices Truck: 4 out of 26 (15%) washed truck regularly (1 daily, 3 weekly). 3 out of 26 (12%) did not use vehicle in animal areas. 19 out of 26 (73%) had no specific vehicle maintenance or cleaning program. Practice Type: Mixed large animal n=27 veterinarians / practices Truck: 5 out of 27 (19%) did not allow vehicle to drive onto farms. 2 out of 27 (7%) cleaned truck weekly. 20 out of 27 (74 %) had no specific truck maintenance plan. SEPARATION OF ANIMALS: Practice type: Bovine n=26 veterinarians / practices 4 out of 26 indicated isolation and testing of new arrivals. Practice Type: Mixed large animal n=27 veterinarians / practices 2 out of 27 indicated isolation and testing of new arrivals. FACILITIES: Practice type: Bovine n=26 veterinarians / practices Facilities: 3 out of 26 recommended boot buckets use by farm personnel, etc. Practice Type: Mixed large animal n=27 veterinarians / practices Facilities: No comments. NEEDLE USE: Practice type: Bovine n=26 veterinarians / practices Needle use: 8 out of 26 used one needle per cow. 9 out of 26 used for multiple cows (range, 1 needle per 4 head to 1 needle per 20 head). Practice Type: Mixed large animal n=27 veterinarians / practices
21 Needle use: 10 out of 27 used one needle per animal. 4 out of 27 used on multiple animals. INSTRUMENT MAINTENANCE: Practice type: Bovine n=26 veterinarians / practices Instruments: 11 out of 26 autoclave instruments. 6 out of 26 sanitize instruments before use. Practice Type: Mixed large animal n=27 veterinarians / practices Instruments: 4 out of 27 indicated that instruments are autoclave sterilized. 8 out of 27 sanitize instruments before use. OTHER COMMENTS Practice type: Bovine n=26 veterinarians / practices Other: Rectal sleeves are changed between pens Try not to leave windows down and spread flies Calvings use disposable garbage bag-like aprons, but no gloves Use sterile plastic OB sleeves plus surgery gloves after a good scrub changed between animals OB suits/aprons are washed in the washing machine with soap and hung to dry between all uses Work with the most susceptible populations first, then move to the sick animals Hands get washed 50% of the time Work with the most susceptible populations first, then move to the sick animals In swine industry, change completely between farms I let the individual client set the pace for this. If the client continues to buy cows from dealers, dispersal auctions dispi reasons! Use the clients' supplies as much as possible Use disposable gloves for many proceedures
22 Practice Type: Mixed large animal n=27 veterinarians / practices Use the clients' supplies as much as possible Avoid going to a CL farm and a non CL farm on the same day Always use gloves Use the clients' supplies as much as possible Work with the most susceptible populations first, then move to the sick animals Wash hands Wear a glove on non palpating hand Wash hands Use as much disposible equipment (gloves, boots, ultrasound, etc) as possible Eye ball health check of every animal every day Shear healthy sheep first then shear sick or sheep with known abcesses last
23
24
25
26
27
28
29
30
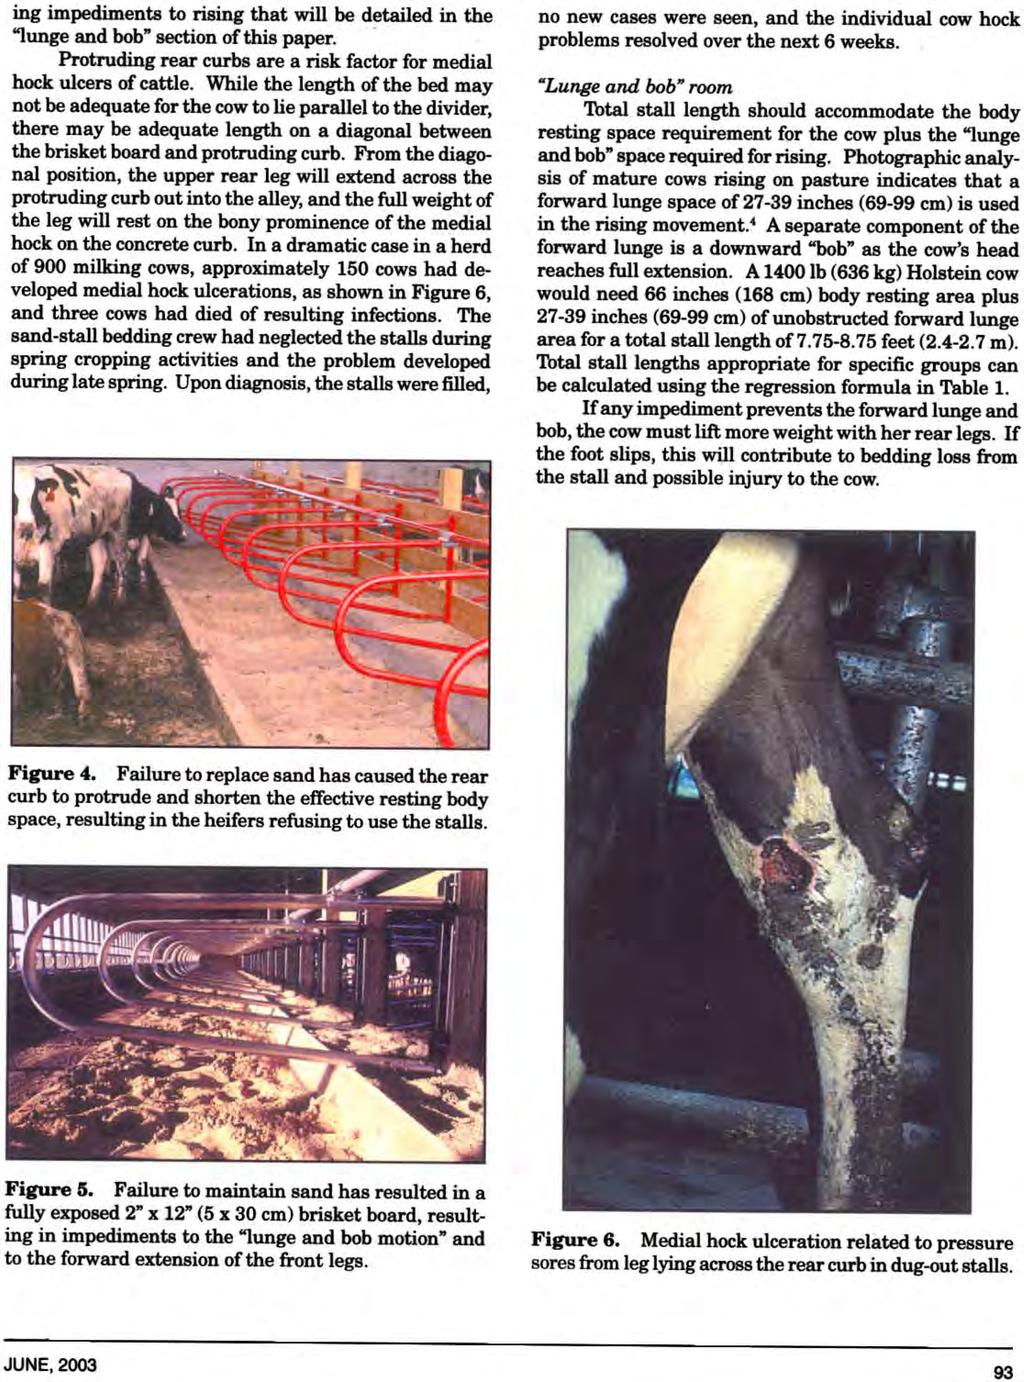
31 INTERACTION OF LAMENESS WITH SAND AND MATTRESS SURFACES IN DAIRY COW FREESTALLS K.V. Nordlund, N.B. Cook, and T.B. Bennett Department of Medical Sciences School of Veterinary Medicine University of Wisconsin-Madison Madison, Wisconsin Introduction Cook (2003) found a significantly lower prevalence of lameness in a group of Wisconsin dairy herds using sand stalls compared to those with other stall surfaces, which included rubber mats and rubber-crumb filled mattresses. The objective of this study was to identify behavioral differences between cows housed in free stalls bedded with deep sand (SAND) and cows housed in free stalls with rubber crumb mattresses (MAT). Materials and Methods Twelve Wisconsin dairy herds were selected to include six sand stall herds (SAND) and six mattress stall herds (MAT). All lactating cows in the entire herd were locomotion scored and the prevalence of clinical lameness was calculated. For one 24-hour period, the mature cow high group pen on each farm was video filmed. Ten cows in the pen were randomly selected, locomotion scored, and color marked. Using the video recordings, location in the pen (alley or stall), activity (standing, lying, feeding, drinking) and time spent performing each activity (to the nearest minute) was recorded for each marked cow. The data were analyzed using the mixed procedure of SAS. One way ANOVA was used to compare cow and herd level data and a mixed effect model was created to investigate differences in cow behavior between SAND cows and MAT cows. Results Mean (SE) lameness prevalence was significantly higher in MAT herds (24.0%, 2.1) than in SAND herds (11.1%, 1.3), (P<0.001). There were no significant differences in parity, days in milk at the day of visit, last DHIA recorded daily milk yield and last DHIA recorded ME305 milk yield between filmed cows in SAND herds and those in MAT herds. Cows with normal ambulation scores behaved similarly in both types of barn with respect to time spent milking, eating, socializing and lying down. However, there were significant differences in the amount of time spent standing in the stalls at all ambulation scores. Normal cows in MAT herds stood in stalls for 2.4h/d compared to cows in SAND herds that stood for 1.7h/d. Time up in stall for slightly lame cows in MAT herds was 4.4h/d compared to 2.1h/d in SAND herds (P<0.0001) and for moderately lame cows in MAT herds it was 6.1h/d compared to 1.8h/d in SAND herds (P=0.0183).
32 Figure 1. Daily time budgets for 120 cows, including time lying down in the stall (TDIS), time standing up in the stall (TUIS), time up in the alley (TUIA), time up feeding (TUF) and time up milking (TUM) for cows with locomotion score 1 (nonlame), locomotion score 2 (slightly lame) and locomotion score 3 (moderately lame), in both sand (SAND) and mattress (MAT) free stall barns. Daily Activity (Hours per day) TDIS TUIA TUF TUM TUIS MAT SAND Locomotion Score (1-3) Discussion Altered daily activity time budgets were identified in lame cows on mattress free stalls. Increased time spent standing in the stall compressed the time available to lame cows for other activities such as socializing, feeding and lying down. Changes in time budgets were not observed in lame cows on sand free stalls. We speculate that the behavior of lame cows changes on mattresses due to either increased pain or decreased security during either the lying or rising motions, in contrast to the unchanged behavior of lame cows on sand. References Cook, NB. Prevalence of lameness among dairy cattle in Wisconsin as a function of housing type and stall surface. JAVMA 2003; 223:
33 Vet Clin Food Anim 20 (2004) Using herd records to monitor transition cow survival, productivity, and health Kenneth V. Nordlund, DVM*, Nigel B. Cook, BVSc, MRCVS Department of Medical Sciences, Food Animal Production Medicine, School of Veterinary Medicine, University of Wisconsin, 2015 Linden Drive, Madison, WI 53706, USA Despite many innovations in transition cow management in the recent past, our ability to monitor change and evaluate the efficacy of programs at the farm level remains relatively crude. Herd managers implement new transition cow management practices and evaluate the response in their herd using a variety of monitors. Milk production monitors in early lactation are usually based upon average performance of the cows that calve in a short period of time and are easily skewed by small numbers of outlier cows. Other production monitors based upon Dairy Herd Improvement Association (DHIA) first test day information are frequently confounded by the variation in days in milk at first test day. Many dairies have health records that allow them to track changes in the number of disease events on their own dairy, but inconsistencies in case definition make it difficult to compare disease rates between farms. Because of these factors, it is important for dairy herd managers and their advisors to consider the potential pitfalls of the monitors that are in use and understand the limitations of each when interpreting them. Monitors of transition cow management programs should help us determine if the fresh dairy cow was well prepared for milk production and good health in the coming lactation. Appropriate monitors will focus on three areas; cows that die or are culled early in lactation, the productivity of the surviving cows in early lactation, and the rates of disease in the periparturient period. This article will review the strengths and weaknesses of traditional monitors, introduce new monitoring techniques where the performance of the individual cow is compared with her own performance in the prior lactation, and comment on ways to increase the value of health records for management. * Corresponding author. address: nordlund@wisc.edu (K.V. Nordlund) /04/$ - see front matter Ó 2004 Elsevier Inc. All rights reserved. doi: /j.cvfa
34 628 K.V. Nordlund, N.B. Cook / Vet Clin Food Anim 20 (2004) Surviving the transition period Herd removals in early lactation Because of widespread inconsistency in terminology, any discussion of herd removal is usually improved by defining terminology at the onset. DHIA organizations most commonly use turnover rate to measure overall culling. Turnover rate, a traditional term used in business inventory monitoring [1],is calculated by dividing the number of cows removed from the herd by the average number of cows in the herd during the same period and multiplying by 100 [2]. In contrast, cull rate has sometimes been defined with an epidemiologic perspective as the number of cows removed from the herd divided by the number of cows at risk of being removed, that is, the number of cows that remain in the herd plus the number that were removed [2]. Using these definitions, a 37% annual turnover rate is equivalent to a 27% annual cull rate. However, there are many examples in the literature where the terms are interchanged or presented without definition. In addition, other terms appear in the culling literature such as proportion removed from herd [3] and replacement rate [4]. Alternatives such as cows left herd, % appear in DHIA reports such as the Herd Summary 202 and use the number of cows in the herd at the most recent test date as the denominator [5]. In addition to variations in the denominator, variations in the numerator also appear. Most DHIA records include on-farm deaths in the annual turnover rate; however, the culling report in the recent National Animal Health Monitoring System s Dairy (NAHMS, 2002) survey does not include on-farm cow deaths among the culled cows [6]. All of these variations in terminology and method of calculation can confuse culling discussions. For consistency, we prefer to use the turnover rate method and include on-farm cow deaths in the numerator. Cows that leave the herd in the first 60 days after calving are usually removed because of disease or injury [6]. Therefore, removal rates within the first few months can serve as a critical monitor of the efficacy of transition cow management programs. There are exceptions to the general assumption that early lactation culled cows are the result of transition management failures, such as dairy sales and cows removed because of positive test results in Johne s disease eradication programs. In most situations, such exceptions are unusual. A substantial proportion of cows are removed from herds very early in lactation. Using removal records of 624,614 cows in Minnesota, Stewart showed that 24.5% of all herd removals left within 62 days of calving [7]. Using different criteria, the NAHMS (2002) study reports that 15.6% of all culls were removed by less than 50 days in milk (DIM) [6]. The lower values in the NAHMS report are possibly explained by the shortened DIM period and because on-farm deaths were not included among the culled cow population. The important points are that between one fifth and one quarter of all herd removals occur within 60 days of calving, these removals usually represent a transition cow health failure, and early
35 K.V. Nordlund, N.B. Cook / Vet Clin Food Anim 20 (2004) lactation culls represent a much greater economic loss than removal at the end of a normal lactation. Knowing that 25% of all removals leave the national dairy herd within 60 days of calving tells us very little about the magnitude of the problem on a specific farm. With annual turnover rates commonly ranging from 25% to 50%, the loss of 25% of all culled cows in less than 60 days could represent between 6% and 12% of the herd. In addition, the percentage of all removals in less than 60 days varies widely from herd to herd. We prefer to calculate early lactation culling as a herd turnover rate of cows removed before 60 days in milk (TOR \ 60 DIM). By presenting early culling losses as a percentage of the herd rather than as a percentage of culls, early lactation culls can be compared between farms on a more objective basis. Two farm examples are shown in Figs. 1 and 2. We have collected herd removal data from 51 Wisconsin dairy herds ranging in size from 34 to 1671 cows. Annual turnover rates range from 12% to 60% with a mean of 37%. The average herd has a TOR \ 60 DIM of 9.0%, and the range is from 0% to 27%. The cut points for the quartile of herds with the lowest culling were 31% for turnover rate and 6% for TOR \ 60 DIM. From these data, we view a loss of fewer than 6% of the herd in less than 60 DIM as the benchmark for high quality transition cow management programs. 14% 12% 10% 8% 6% 4% 2% 0% Percent of Herd >450 Lact 1 Lact 2+ DIM at Culling Fig. 1. Herd distribution of DIM at culling in a herd with excellent transition cow health.
36 630 K.V. Nordlund, N.B. Cook / Vet Clin Food Anim 20 (2004) % 12% 10% Percent of Herd 8% 6% 4% Lact 1 Lact 2+ 2% 0% >450 DIM at Culling Fig. 2. Herd distribution of DIM at culling from a dairy with severe transition cow disease problems. Although some industry experts have dismissed evaluation of overall herd turnover rates in favor of monitoring early lactation removals, herds with high TOR \ 60 DIM tend to have high overall turnover rates as shown in Fig. 3. This suggests that high overall turnover rates are associated with poor control of early lactation health. Indeed, only 15% of the herds with overall turnover rates less than 31% exceeded a 6% TOR \ 60 DIM. In contrast, 85% of the herds with herd turnover rates exceeding 31% also lost more than 6% of their herds within 60 days of calving. We accept that some herds will experience high turnover rates while maintaining good control of health, but from these data, they appear to be few in number. Herd removal reasons Anyone who has expressed concern to a dairy manager about the rate of early lactation removals will know that the herd manager will insist on a review of the reasons for which they were removed. Although the early lactation removal rate may be relatively high, most dairy managers will point out that not all were the result of clinical disease and may include heifers with blind quarters, bad temperaments, cows with enzyme-linked immunosorbent assay (ELISA)-positive tests for Johne s disease, and sometimes dairy sales. For the early lactation removal rate to be a useful benchmark of transition management programs, the crash exceptions must be quantified.
37 K.V. Nordlund, N.B. Cook / Vet Clin Food Anim 20 (2004) % Herd removed 0 to 60 days in milk y = x R 2 = , P< Turnover rate Fig. 3. Relationship between herd turnover rate and herd turnover rate by 60 days in milk for 51 Wisconsin dairy herds with mean (range) turnover rate of 37% (12 to 60%). DHIA recording systems offer a single choice of a limited number of removal reasons. However, many dairy managers want to keep a record of removal reasons to supplement the DHIA codes and there are several issues to consider for improving their interpretability. First, the list of codes should separate reasons that reflect the quality of health management from reasons that are somewhat random or uncontrolled. For example, mastitis should be separated from udder problems, which are usually conformational defects outside of management control. Second, the category disease tends to become a catch-all term for sick animals as well as removals due to test and cull programs. For example, a manager practicing a Johne s disease test and cull program will remove a cow because of a positive ELISA test and identify her as a disease removal. However, another cow with ketosis and metritis will also be coded as disease. Cows removed as part of test and cull programs should be identified as such, and not grouped under categories that imply problems in the transition cow program. Analysis of removal reasons is easily criticized because of the limitations of the single choice. Single reasons do not reflect that fact that a decision to cull a cow usually involves multiple factors and almost all involve production as part of the equation. In addition, one problem can lead to another problem, such as lameness leading to delayed conception and low production, any of which could be used as a single choice. Our experience in problem herd investigations suggests that multiplereason removal records provide a more valuable resource than single reason systems. For example, high somatic cell counts (SCC) is frequently
38 632 K.V. Nordlund, N.B. Cook / Vet Clin Food Anim 20 (2004) a secondary or tertiary reason for culling a cow, but may rarely be identified as a primary reason for removal. In efforts to summarize reasons for removal, we have valued each of multiple reasons equally, that is, a cow removed for mastitis and low production would be scored as 0.5 cows removed for mastitis and 0.5 for low production. A study of various weighting values for primary, secondary, and tertiary reasons has recommended moderate, not extreme, differences in value between removal reasons [8]. Some advisors dismiss any value in analysis of culling reasons, suggesting that current records of disease events provide a more timely monitor of health problems. However, this argument assumes that timely monitoring of health problems is the single use of culling records. We use removal reasons to develop a more complete economic estimate of the cost of a problem and find it helpful in discussions with herd managers to justify management interventions. For example, knowing that 5% of the herd was culled because of mastitis problems within the first 60 days after calving can help to justify the expenditure of expanded and improved dry cow housing. Without an estimate of the cost of culling related to specific problems, the full costs of the problem will usually be significantly underestimated. It is our opinion that veterinarians can become more effective advisors if they help to develop a defined set of multiple-reason culling codes for a dairy and provide periodic summaries in terms of both frequency and economics. Measuring productivity and health of cows in early lactation Single test day or snapshot monitors of production Traditional production monitors are not as robust as we would desire because they usually involve snapshots of the performance of a subgroup of the herd that happened to calve within a similar period of time. As such, they are vulnerable to being skewed by a small number of exceptional or mediocre cows. However, provided we are aware of the limitations of each, we can use them in combination with other monitors to yield useful information about the transition cow program. Peak milk Peak milk is the traditional monitor of early lactation production. By definition, peak milk is the highest single day production of a cow measured at DHIA test day. Although peak usually occurs within 75 days in milk, this interval represents a substantial time lag for a monitor of early lactation production. Alternatively, some DHIA services report Summit Milk, the average of the two highest production weights of the first three test days [5]. In traditional monthly testing programs, it is unlikely that the actual peak milk is measured, resulting in the reported peak being underestimated slightly. The primary advantages of peak milk are that it is established relatively early in lactation, is not influenced by days in milk of the herd, and it relates well to 305-day production.
39 K.V. Nordlund, N.B. Cook / Vet Clin Food Anim 20 (2004) Peak milk is influenced by several factors including age at freshening, lactation number, season of calving, and overall productivity. Table 1 shows the average peak milks and peak ratios associated with rolling herd average milk production in Wisconsin Holstein herds at different production levels [9]. It is commonly stated that every pound of additional peak milk or summit milk is associated with an extra 200 to 230 lbs of milk in the lactation [5,10]. Indeed, it is more. Regression analysis of the Wisconsin data shows each additional pound at peak is associated with an increased rolling herd average milk yield of 290 to 380 lbs. It is common to evaluate ratios of first-lactation cow peak milk to peak yields of cows in their second and greater lactation. The expected ratio is approximately 75%, typical of the highest producing herds in the industry. Peak ratios that approach 80% suggest that the first lactation cows are performing relatively better than the mature cows, and that problems affecting primarily mature cows are limiting production in early lactation. Conversely, peak ratios of 70% or less indicate relatively poor performance of first-lactation cows, and may indicate poor replacement rearing programs or unusual stresses on young cows as they begin their first lactation. The herd average peak milk values in DHIA herd summary reports usually represent the values for all cows currently lactating, except for cows less than 50 days in milk. Therefore, the herd average peak milk value may include peaks that occurred 10 months ago along with those recorded on the last test date. Likewise, dramatic changes in peak milk of recently calved cows may not change the average peak milk value. Because the value has such momentum, the average peak milk reported by DHIA is not a sensitive current indicator of recent performance. An alternative is to summarize peak milk over a shorter period of time, that is, peak milk of cows calving each month. Short-term averages may be skewed by outlier cows that suggest that transition cow programs have changed, but the real difference may be the quality of the cows that calved in Table 1 Rolling herd average milk, associated peaks, and peak ratios for Holstein herds in Wisconsin, 2003 Rolling herd average milk yield, lbs. (kg) First lactation peak milk, lbs. (kg) Later lactation peak milk, lbs. (kg) 11,672 (5,305) 50.3 (22.9) 63.3 (28.) 80 14,138 (6,425) 56.7 (25.8) 71.3 (32.4) 80 16,099 (7,318) 61.8 (28.1) 78.6 (35.7) 79 18,057 (8,208) 66.3 (30.1) 85.7 (39.0) 78 20,040 (9,109) 71.6 (32.5) 92.9 (42.2) 77 21,992 (9,996) 76.5 (34.8) 99.9 (45.4) 77 23,917 (10,871) 81.0 (36.8) (48.4) 76 25,829 (11,740) 85.7 (39.0) (51.6) 76 28,085 (12,765) 91.4 (41.5) (55.2) 75 31,465 (14,304) (46.0) (61.0) 76 Ratio of first:later lactation peak milk
40 634 K.V. Nordlund, N.B. Cook / Vet Clin Food Anim 20 (2004) a short period of time. Another approach is found in a scatter plot of individual cow peak milks as shown in Fig. 4, with different symbols for first lactation and mature cows, arranged by current days in milk. This approach provides more recent information, but must still be interpreted with caution. What appears to be a change in performance may simply be a seasonal difference or perhaps a cluster of lower quality cows that calved in a short period of time. Daily milk weights Daily milk weights from each milking of each cow can be captured and summarized in modern milking parlors fitted with milk meters and advanced software. Systems differ in the way that they summarize the information, and there is substantial farm-to-farm variation in application. Early work demonstrated that daily milk weights for the first 5 days of lactation could be used to predict diseases such as metritis [11]. Currently, the information is predominantly used in a short-term manner to screen for cows with health Peak Milk, lbs Days In Milk Jan Dec Nov Oct Sep Aug Jul Jun May Apr Mar Feb Jan Month of Calving Lactation 1 Peak Milk Lactation 2+ Peak Milk Fig. 4. Peak milk values versus current days in milk from a 1400-cow dairy herd with a 26,000 lb rolling herd average milk yield. For the past 12 months, first lactation heifer peaks have declined compared with those of mature cows.
41 K.V. Nordlund, N.B. Cook / Vet Clin Food Anim 20 (2004) problems, so that the individuals failing to reach certain targets may be identified and examined more thoroughly. For example, some dairies use thresholds of 23 kg (50 lbs) for first lactation cows and 32 kg (70 lbs) for mature cows. Such thresholds are farm-specific. A monitor of the overall performance of the transition program can be the weekly or monthly proportion of cows that exceed the established thresholds. Although the potential bias of clusters of low producers and the effects of season remains, the minimal lag time of the monitor is attractive. First test mature equivalent 305-day projected milk DHIA services generate Mature Equivalent 305-Day (ME305) projections based upon the first test day milk production, and continue to refine that projection as the lactation progresses. On monthly testing programs, the first test day averages about 18 days in milk, and ranges from 7 to about 36 days in milk for individual cows. The ME305 projections include factors to account for season, region of the country, age, lactation number, and past production of herdmates, and is further standardized to that of a mature cow milked twice a day [12,13]. Because this index can be compared across all lactations and ages, and is generated at the first test, first test ME305 values provide an earlier monitor of performance than peak milk and are less biased because of age of the fresh cows and season of calving. Tracking the average ME305 of first test cows on a weekly or monthly basis can be an effective monitor of productivity, provided that there are more than approximately 15 first test cows in the interval being summarized. As before, a cluster of extreme high or low producers can bias the results of this monitor over the short term. Milk components at first Dairy Herd Improvement Association test day DHIA testing of individual cows presents the opportunity for first test date determinations of milk fat percentage, protein percentage, and somatic cell count, and can give indications about health management during the dry period and in early lactation. Milk fat percentage High milk fat percentage in individual cows at first test may be an indicator of metabolic problems including fatty liver, ketosis, and displaced abomasums. However, it is also strongly affected by days in milk of the first test day. Because the first test day varies from approximately 7 to 35 days in milk, this test is not sensitive at an individual cow level. However, it can be useful as a herd screening test for groups of first test day cows. For Holstein herds, we calculate the prevalence of cows on test with a fat percentage greater that 5.5% and less than 60 days in milk. A prevalence greater than 10% is suggestive of a herd with ketosis or fatty liver problems.
42 636 K.V. Nordlund, N.B. Cook / Vet Clin Food Anim 20 (2004) Ratios of test-day components Duffield and Bagg [14] report on various tests to identify problem herds with a high prevalence of subclinical ketosis, defined as more than 20% of cows with a serum beta-hydroxybutyrate concentration greater than 1400 lmol/l. One of the herd tests evaluated was the ratio of protein percentage to fat percentage at first DHIA test day. Problem herds were accurately identified if more than 40% of cows at first test had a protein to fat ratio of less than In the absence of a herd screening method for ketosis, this is a useful first line test that may indicate a more intensive monitoring program is required. Others have used the inverse ratio of fat percentage to protein percentage for first test-day data as a monitor for displaced abomasum in individual cows [15]. Using a fat:protein ratio (FPR) of [1.4 on test day data captured at 18 to 23 days in milk, the sensitivity and specificity for predicting a DA was 80% and 69%, respectively. Heuer et al [16] used first test day information from 1335 lactation records of cows in 16 dairy herds in The Netherlands to explore the risk of disease in cows with a FPR [1.5. First milk tests were collected at 18 8 days in milk. Odds ratios for ketosis, cystic ovarian disease, mastitis, and lameness were 3.2, 1.7, 1.7, and 1.5, respectively. In addition, cows identified with ketosis before first test had a 4.4-fold increase in the rate of FPR [1.5 and left displaced abomasum increased the rate by 5.3 times. Care must be taken when using these ratios. In some parts of the world, milk protein is measured on a true protein basis, and in others, crude protein is the measure used. For example, if a FPR cut point of 1.3 is used with crude protein, the cut point should be increased to 1.4 if the test is based upon true protein. Somatic cell count at first test Using a threshold of 200,000/mL as an indicator of infection, SCC at the first DHIA test day can be used to monitor dry period mastitis management. Concern is occasionally expressed about false positives using this threshold in early lactation. However, Barkema et al [17] monitored quarter SCC after calving and showed that in culture-negative quarters, 95% have a SCC less than 250,000/mL by the fourth milking. Because DHIA rules mandate that only SCC data from cows 6 days in milk or more are stored, composite milk from all quarters taken at the first test after calving can be used to assess the infection status of the udder. The assumption that any elevated first-test SCC represents a new infection from the dry period is somewhat oversimplified. Elevated SCC at first test could also represent chronic infections that were brought into the prior dry period and did not cure, and could also represent new infections that occurred after calving and before the first test date. However, experience in a large number of mastitis problem-herd investigations suggests that in most cases, high rates of elevated first test SCC are due to infections acquired during the dry period. As
 627 649 637 a benchmark, we expect that less than 15% of cows in herds with excellent mastitis control will exceed the 200,000/mL SCC threshold at their first test.")
43 K.V. Nordlund, N.B. Cook / Vet Clin Food Anim 20 (2004) a benchmark, we expect that less than 15% of cows in herds with excellent mastitis control will exceed the 200,000/mL SCC threshold at their first test. We have used an extension of the SCC analysis described above to characterize and monitor the prevalence of high SCC cows in a herd over a 6-month period using an Excel spreadsheet (WisGraph, AgSource, Verona, Wisconsin). Three populations of high SCC cows are presented graphically, namely; chronic cows (>200,000 for at least the last two tests), fresh cow new infections (cows and heifers with a first test [200,000) and lactating cow new infections (cows and heifers \200,000 at the previous test, that are [200,000 at the current test). Graphs from two different herds are presented in Figs. 5 and 6 illustrating various herd mastitis problems. Using these data, the relative importance of infections following the dry period may be kept in perspective relative to the new infections occurring after the first test, as well as the prevalence of chronic infections within the herd. Measuring fresh cow health and production using the cow as her own control All of the productivity and health monitors mentioned to this point are single test date snapshots of the cows in early lactation. As such, they all share the liability that what may appear to be a change in a herd performance monitor may simply reflect a cluster of atypical cows (high Fig. 5. Prevalence and new infection rate in a 1200-cow herd with a recent infection prevalence of 32%. New infections in cows beyond the first test day are significant (upper striped area), as is the proportion of the infected cows that are chronic (dark solid area). Control efforts would focus on developing a plan for managing chronic cows and improving hygiene, comfort, and standards of machine milking for the lactating cows.
.")
44 638 K.V. Nordlund, N.B. Cook / Vet Clin Food Anim 20 (2004) Fig. 6. Prevalence and new infection rate in a 250-cow dairy with a 21% prevalence of infected cows. The single most important risk group in the most recent two months is fresh cows and heifers calving infected at first test (lower striped area). Control efforts would focus on dry treatment practices, and dry cow and calving area hygiene. producers, low producers, chronic mastitis cows, and so on) that happen to calve in a short period of time. However, some aspects of DHIA records allow us to compare the performance of each cow in early lactation to her performance in the prior lactation. This allows us to monitor the direct effect of the transition period on a cow, and she becomes, in effect, her own control. Change in somatic cell count between last test of the prior lactation and the first test somatic cell count Using the SCC threshold of 200,000/mL or linear score 4.0 to indicate a mammary infection, the changes in udder health status through the dry period can be monitored. Stewart et al [18] introduced a scatterplot technique to indicate dynamic changes in infection status across the dry period. Plotting linear scores from the last test date in the prior lactation on the X-axis and the first test linear scores on the Y-axis, the scatterplot is divided into quadrants with lines at linear score 4.0. The quadrants divide cows into the following groups; uninfected cows at dry-off that remain uninfected, formerly uninfected cows that developed new infections, infected cows at dry-off that cured the infection, and infected cows that remain chronically infected and failed to cure. The technique is very effective in illustrating the dynamic nature of infection within a herd. However, it does not quantify the number of new infections and cures without manual
45 K.V. Nordlund, N.B. Cook / Vet Clin Food Anim 20 (2004) counting, and it is easily overwhelmed visually with too many data points from a large herd. Cook et al [19] have described and presented benchmarks using this method from 145 Wisconsin dairy herds. The herds had a distribution of herd mean annual weighted SCC typical of the herds in Wisconsin. The benchmarks are presented in Table 2. Note that the heifer first test infection risk is simply a snapshot proportion of infected first lactation cows at their first test. These benchmarks can be used to evaluate the efficacy of nonlactating period udder management programs and identify mastitis risk areas on individual farms as shown in Table 3. It is becoming increasingly important to capture the last test day linear score of the previous lactation, as a failure to identify infected cows that enter the next lactation without a cure represents a breakdown in the udder health control program, and results in an accumulation of chronically infected cows in the herd. Some precautions must be observed in using these benchmarks to make inferences about transition cow udder health management. Similar to the use of the single first test SCC, the Dry Cow New Infection Risk reflects the dry period, as well as the interval between calving and first test. Although the experience of the authors indicates that most new infections are related to the dry cow environment and sometimes dry treatment practices, there are occasions where inadequately maintained fresh cow milking systems and poor milking practices of fresh cows create new infections in the days between calving and the first DHIA test. Conversely, the Dry Cow New Infection Risk may be artificially suppressed by use of the California Mastitis Test and treatment of positive quarters at 2 to 3 days in milk, sometimes called the Fresh Start program (Pfizer Animal Health Program, Pfizer). This program will cure some infected quarters before the first test date, thus invalidating the use of this test as a primary monitor. Data must be interpreted in light of the proportion of cows receiving treatment before first test day. ME305 difference from prior lactation to first test Similar to the use of individual cow SCC before and after the nonlactating period, changes in ME305 (DME) between the last test of the prior lactation and the first test day of the current lactation can tell us Table 2 A summary of dry-period new infection and cure risks for cows in 145 Wisconsin dairy herds Heifer first test infection risk (%) Dry cow newinfection risk (%) Dry cow cure risk (%) Mean (range) 21.3 (0 58.0) 22.4 (0 71.0) 62.9 ( ) 10th percentile cut-point Data from Cook NB, Bennett TB, Emery KM, Nordlund KV. Monitoring nonlactating cow intramammary infection dynamics using DHI somatic cell count data. J Dairy Sci 2002; 85(5):
46 640 K.V. Nordlund, N.B. Cook / Vet Clin Food Anim 20 (2004) Table 3 An example herd report that uses somatic cell count from prior lactation and the first test somatic cell count to identify subgroups at risk Dry cow and heifer summary Uninfected cows at dry off (39) Infected cows at dry off (23) Lactation 1 heifers (27) Target Intervention New Infections at first test 31% 11% \10% >15% Dry cow cures 57% >80% \70% Numbers in parentheses represent the number of cows included in the calculations. In this dairy, 31% of the cows that were uninfected at dry-off became infected by their first test, and only 57% of the infected cows at prior dry-off cleared infections during the dry period. In contrast, the dairy is meeting goals of very few infected heifers at first test. Attention needs to be paid to the dry treatment practices and the environment and housing of mature dry cows. much about results of the transition cow program at the individual cow level. Each cow can serve as her own control. When summarized by week or month, the potential bias of subgroups of superior or inferior cows can potentially be eliminated if the first test-day ME305 of each cow is compared with her own prior lactation performance. Adverse production effects of milk fever, retained placenta, and metritis will be realized by first test day, which will reduce the first test ME305 value. Although other diseases associated with transition cow management are not necessarily diagnosed by the first test day, milk production of cows that develop ketosis, displaced abomasum, and digestive disorders declines by 5 to 7 days before diagnosis and the difference from healthy herd mates is frequently detectable between 5 to 10 days in milk [20]. These reductions will be magnified in the first test day ME305. By itself, a below average first test day ME305 may simply indicate a below average cow. However, a below average first test day ME305 from a cow with a superior record in the prior lactation suggests disease and may reflect problems in the transition cow management program. The DME of the average cow in the AgSource database in 2002 was approximately minus 1800 kg (4000 lbs). The DME is greatly influenced by several factors including prior production level, length of the prior lactation, use of BST in the prior lactation, herd effects, and individual cow factors such as disease. These factors have been used to develop regression equations to generate an expected DME for individual cows, to which the actual DME is compared. If groups of cows have a greater drop in ME305 than expected, the transition cow program can be evaluated as producing poorer results than the average program in the industry. As more herds are monitored using this index, benchmarks will become available to evaluate the efficacy of transition cow programs.
47 K.V. Nordlund, N.B. Cook / Vet Clin Food Anim 20 (2004) Herd health records It seems intuitive that an excellent monitor of the effectiveness of a transition management program would be the health records of the dairy. The NAHMS Dairy 2002 report indicates that 95% of US dairy farms keep some type of individual cow record system including DHIA records [6]. Seventy-four percent of dairies also keep hand written records in ledgers or notebooks and 19% have on-farm computerized record systems. Despite widespread intentions to keep health records, it has been our experience as problem-herd investigators that they are usually kept as a record of reproductive events and pharmaceutical use, rather than as a health record, and as such, are rarely analyzed and summarized by either the herd veterinarian or the herd owner. Perhaps as distressing is the fact that for several common dairy diseases, sound benchmarks for target and intervention incidence rates have not been established for the industry, making it difficult for managers of individual dairies to compare their herd s performance to the industry at large. Common deficits of on-farm health records An obvious function of a herd health record system is to produce periodic reports of incidence rates of disease events to be used to monitor the success of the health care program. These same data can be used to calculate costs related to incidence rates above target levels and to focus the attention of the herd owner on a particular problem area. Computerized systems have made this feasible, but one or more common deficits and limitations preclude this from becoming a reality for many dairies. First, many record systems are used primarily to record reproductive information. The breeding records are usually well maintained because of their obvious utility and the expectation of veterinarians to have these data immediately available. The need for health data is not as immediately obvious as the need for breeding records, and frankly, the veterinary profession has not used the health information to the degree that they have summarized and used fertility data. Second, many health record entries are focused on treatment, rather than diagnosis. This may reflect the orientation of many dairy managers, as it is our observation that the primary health monitor for many managers is the count of cows in the sick pen currently under milk withholding. Although this monitor appears to be of great importance to herd owners, it is almost useless in terms of health status assessment. Similarly, it is common to find that recorded events consist of a treatment or drug administered, but without a diagnosis. This complicates efforts to determine incidence rates of specific disease events, as a single drug may be used to treat multiple conditions. Attempts to monitor incidence rates of diseases with treatmentbased records are doomed to frustration.
48 642 K.V. Nordlund, N.B. Cook / Vet Clin Food Anim 20 (2004) Third, sometimes the same term is used to describe both clinical and nonclinical events. One example may include confusion between clinical cases of Johne s disease and a diagnosis based upon routine serologic testing programs. Another common example involves the situation where a lame cow may be found to have a digital dermatitis lesion and is recorded as such, while some days later a hoof trimmer may note the same lesion in another animal that was not lame, but was selected for routine hoof-trimming. This creates the need to separate trim and lame events, and record them separately if we are to extract a true lameness incidence rate. This problem also exists for treatments of clinical mastitis, while other cows may be treated based upon elevated somatic cell count or California Milk test as in the Fresh Start program. The failure to create well-defined health event codes that distinguish clinical problems from scheduled management practices can seriously undermine the value of health records and create confusion. The veterinarian is in an ideal position to make sure that health event codes are set up correctly. Fourth, variation in case definition, diagnostic capabilities, terminology, and record-keeping discipline varies among people with responsibilities in the sick pens, and can change dramatically on a specific farm as personnel change over time. People with a wide spectrum of training and education, ranging from experienced veterinarians to assistant herdsmen with little or no health related training, make diagnoses on farms. Substantial differences in skills may exist between the day and the night shift on many dairies. An insidious change in case definition can occur over time as a herdsman becomes more focused or aware of a particular problem and begins to search for it. Similarly, general conditions such as diarrhea may be recorded as such for a period of time, but after an etiologic diagnosis is made, there is a tendency for future cases of diarrhea to be recorded as the etiologic cause, such as Salmonella, although the subsequent cases may not have a laboratory diagnosis. Caregivers and farm personnel must be trained to use uniform case definitions and a standardized health recording system, and the system must be monitored, if these problems are to be addressed. We believe that this should be the role of the herd veterinarian. Fifth, the most widely used software programs have limitations when used to monitor disease rates. It is rare for current dairy record systems to calculate true incidence rates of disease. Usually, the capability of the system is limited to the number of events recorded over a certain time period (week, month, year), and they are frequently reported without reference to the population at risk. Although Kelton et al have recommended that disease rates should be presented as lactational incidence rates [21], none of the computerized systems in common use do so at present. Another limitation is that health events may be attached to the lactational record of a cow, so that when the cow is culled or calves and starts a new lactation, historic health data is lost from future analysis. Retrospective analysis of rates of disease is therefore very challenging for periods much above 3 months. Therefore,
49 K.V. Nordlund, N.B. Cook / Vet Clin Food Anim 20 (2004) there is a need for health record software that allows veterinarians to recover historic disease events from prior lactation records or from cows that have been culled from the herd. Justification for higher quality on-farm health records The common problems that characterize many on-farm health records can be rectified, but will usually require the attention of a committed veterinarian over an extended period of time. Reneau and Kinsel summarized many key factors required of high quality health record systems [22]. The effort to develop and maintain these health records can be justified so as to deliver value to the participants of the health care program including the caregiver, the herd owner and the veterinarian. The records system should be set up to: 1. Monitor rates of well-defined disease events (separating clinical from subclinical events and screening results) as a measure of the effectiveness of preventive programs and to aid problem solving. 2. Determine clinical efficacy. For example, this may be achieved by monitoring retreatment rates for a specific disease after a certain interval, defined in Table 4, along with days to clinical cure and days of milk withhold out of the bulk milk tank. 3. Maintain an individual cow history for cow-side use to enhance treatment decisions. For example, knowing that a cow s last recorded somatic cell count was greater than, rather than less 200,000/mL, and that she had previously been treated in the same quarter, may drive the decision for an alternative treatment plan for the current case of clinical mastitis. 4. Measure compliance and consistency of implementation of the health program in place. Health records should make it possible to monitor protocol drift over time. 5. Reconcile pharmaceutical purchases with treatment protocol entries and to meet regulatory requirements on the use of pharmaceuticals in food animals. 6. Determine the costs of certain disease rates over achievable targets. This would help to shape and justify the cost of appropriate interventions. Of these six points, the ability to estimate costs of specific disease problems appears to be the most compelling to many dairy managers. Good record systems can generate an incidence rate of common diseases. Average costs per case have been estimated for several diseases [23,24]. These estimates include the immediate cost of treatment, the cost of the veterinarian s and herdsman s time, and the cost of milk withheld from the market. In addition, an assessment of the effect of the disease condition on subsequent milk production, fertility and risk of culling is usually made. For the
50 Table 4 Case definitions for diseases occurring during the early lactation period, along with targets for acceptable levels of incidence and a confidence of diagnosis grade Disease condition Case definition New case definition Milk Fever Clinical signs consistent with stages 1 (mild excitement, nervousness, weakness, rapid heart rate), stage 2 (sternal recumbancy depression, muscle tremors, rapid heart rate, cold ears, decreased rumen movements, pupils dilated and low rectal temperature (\ 37.8 C) or stage 3 (lateral recumbancy, bloat, rapid heart rate and weak pulse) of the disease, within 72 h of calving Retained Placenta Metritis Fetal membranes visible at the vulva or identified within the vagina or uterus by examination more than 24 h after calving An abnormal uterine, cervical, vaginal, or vulval discharge observed within 21 days of calving Median lactational incidence risk [21] Range in lactational incidence risk [21] Confidence in diagnostic criteria (A E) Limit to 1 per lactation B 5 Limit to 1 per lactation B 5 New case if no signs within last 30 days C 15 Target incidence rate guideline 644 K.V. Nordlund, N.B. Cook / Vet Clin Food Anim 20 (2004)
51 Ketosis Left displaced abomasum Primary ketosis is defined as a reduction in DMI in association with elevated milk, urine or breath ketones in the absence of another concurrent disease An audible high-pitched tympanic resonance (ping) produced by percussion of the left abdominal wall between the 9 th and 12 th ribs in association with reduced DMI Pneumonia Presence of at least 2 out of 3 signs among fever, nasal discharge, cough, and increased respiratory rate Mastitis A cow with one or more quarters with visually abnormal milk (clots, flakes, or watery) with or without other local (heat, swelling, or discoloration) or systemic (fever or signs of toxic shock) signs Lameness An abnormal gait determined by locomotion score attributable to a focus of pain or disease in one or more limbs New case if no signs within last 30 days Usually limit to 1 per lactation New case if no signs within last 30 days New case if no abnormal milk in previously infected quarter for previous 8 days or abnormal milk in new quarter New case if not clinically lame in previous 30 days in affected limb or lame in new limb D B 5 NA NA D C E 30 Abbreviations: A, very good; B, good; C, fair; D, poor; E, very poor. Adapted from Kelton DF, Lissemore KD, Martin RE. Recommendations for recording and calculating the incidence of selected clinical diseases of dairy cattle. J Dairy Sci 1998;81(9): K.V. Nordlund, N.B. Cook / Vet Clin Food Anim 20 (2004)
52 646 K.V. Nordlund, N.B. Cook / Vet Clin Food Anim 20 (2004) majority of fresh cow diseases, cost per disease event is around $320 (US), with a narrow range from $150 to $450 [22,23]. As treatment protocols are so variable between farms, and because these costs lack transparency, it is frequently difficult for herd owners to see where these losses come from. In our experience, a better understanding of the cost of a disease is realized by completing a worksheet with the dairy manager, using their own protocols and either standard or farm-derived assumptions for production and fertility losses. In some situations, estimates of the production impact of disease can also be made using the herd record system to compare the predicted ME305 of a group of lame cows, for example, to that of the normal cows in the herd. These potential benefits of a health record system will not be realized from the record system alone. Each of the items listed above require specialized output reports to become feasible. It is through the development and maintenance of these health care reports, along with continuing training programs and supervision of the caregivers in the sick pen, that veterinarians can increase their value to the health care delivery system of modern dairy farms. Uncertain benchmarks for fresh cow disease rates in the industry With record systems like those described above, dairy managers can detect a change in disease risk in their own herd over time. However, many find it difficult to determine how their herd disease risk compares to other herds in the industry. For example, almost all dairy managers know how their herd SCC compares to industry benchmarks, but most struggle to characterize their herd risk of clinical mastitis compared with the industry at large. Without clearly established benchmarks and targets, many dairy herds sustain elevated disease because the rate is normal for their dairy. NAHMS [6] and Kelton et al [21] have presented average or median disease rates that represent some parts of the industry and a variety of diagnostic methods. The NAHMS data was generated from surveys of individual farms, and the incidence rates that dairy managers report will be subject to the vagaries of on-farm health records that have been discussed. The Kelton data represents median incidence rates of a collection of published reports of dairy cow diseases and are summarized in Table 4. Although these incidence rates may be viewed as benchmarks for comparison, the varied sources of the data mean that case definition and consistency of recording may be a problem. For diseases such as milk fever, retained placenta, and displaced abomasum, case definition is relatively repeatable between farms, as these conditions are reasonably easy to diagnose and have relatively modest variation in terms of severity and type. However, case definition varies substantially with diseases such as ketosis, pneumonia, lameness, and mastitis. Ketosis is commonly diagnosed based
53 K.V. Nordlund, N.B. Cook / Vet Clin Food Anim 20 (2004) upon clinical signs of a cow off-feed and a positive ketone test, but rates go up on farms when fresh cows are screened for urine or milk ketones on a routine basis. Case definition of mastitis is extremely variable between herds, with some treating any quarter with abnormal milk and others recognizing only moderate and severe cases. Consistency of recording of events varies. Displaced abomasa events are usually recorded because they require a surgical repair or the removal of the cow from the herd. However, diseases such as mastitis and lameness are inconsistently recorded. It is our experience that the incidence rate of clinical mastitis goes up when a good record system is instituted. Lame cows are poorly identified by farmers [25,26] and even if found, the lame event may not be recorded if the cow is treated by a hoof trimmer among a large number of routine trims. In Table 4, we have suggested a target incidence rate for a variety of conditions derived from our personal experiences investigating health problems in herds. Alongside this target, we have graded the confidence in the diagnosis of each health event from A to E. Data from peer reviewed surveys of disease incidence [21] and from other sources of disease rate information should be considered in the context of this confidence rating. The rates of disease reported by Kelton et al in Table 4 are close to our suggested achievable target levels for health events with a confidence rating of B. However, it is notable that our targets diverge markedly for health events graded C E, reflecting the variability of herdsmen to recognize the disease condition and the variation in screening methods and case definitions being used in the industry. Clearly, data from a large number of herds practicing a uniform disease monitoring and recording system are lacking and much needed in the industry in North America if we are to improve on the current state of knowledge. Table 5 Select monitors of the transition period with appropriate herd benchmarks Monitor Target Proportion of herd removed within 60 DIM \6% Peak milk ratio 73 78% Proportion of cows less than 60 DIM with a fat% > 5.5 \10% Proportion of cows with first test FPR > 1.4 \40% Proportion of cows and heifers at first test > 200,000/mL \15% Difference between actual vs predicted change in ME305 Not yet available Herd lactation incidence rates for diseases with a high confidence rating Milk fever \5% Retained placenta \5% Left displaced abomasum \5%
54 648 K.V. Nordlund, N.B. Cook / Vet Clin Food Anim 20 (2004) Summary There is no single monitor that can fully characterize the success of a transition cow management program in a herd. Rather we must rely on a group of key monitors. Table 5 outlines the key indices and targets that we use in herd investigations. By using these monitors, effective transition cow programs can be differentiated from problematic ones, and many of the problems can be resolved for the good of the herd owners, dairy laborers, and most of all, the cows. Development of more sophisticated monitors and software with stronger epidemiologic structure will allow for better analysis of programs in the future. Acknowledgments We would like to acknowledge the assistance of David Rhoda, DVM, who provided ideas for the health record section of this chapter and puts into practice many of them, and Tom Bennett, BS, for assistance with WisGraph. Their contributions are greatly appreciated. References [1] US Bureau of Labor Statistics. Job Openings and Labor Turnover Survey. People are Asking page. Available at: Accessed May 25, [2] Nott SB. Dairy animal ratios from Michigan annual financial analyses. Staff paper # January, Dept of Ag Econ, Michigan State University. Available at: Accessed May 25, [3] Smith JW, Ely LO, Chapa AM. Effect of region, herd size, and milk production on reasons cows leave the herd. J Dairy Sci 2000;83(12): [4] Allaire FR. Economic consequences of replacing cows with genetically improved heifers. J Dairy Sci 1981;64(10): [5] DHI-202 herd summary fact sheet: A1, Dairy Records Management Systems. Available at: Accessed April 12, [6] USDA Part III: Reference of dairy cattle health and health management practices in the United States Fort Collins (CO): USDA; APHIS; VS, CEAH, National Animal Health Monitoring System (#N ). [7] Lormore M, Cady R. US dairy replacement strategy: macroeconomics, microeconomics, or biology? In: Proceedings of the 36th Annual Convention of the American Association of Bovine Practitioners, Columbus, OH, Rome (GA): American Association of Bovine Practitioners; p [8] Bascom SS, Young AJ. A summary of the reasons why farmers cull cows. J Dairy Sci 1998; 81(8): [9] AgSource Cooperative Services. Herd summary averages page. Available at: cridata.crinet.com/pmeasure/cow.php. Accessed on: March 26, [10] Galligan DT, Ferguson JD, Chalupa W, Ramberg CF. Quantifying changes in milk production: don t let someone throw you a curve. Compend Contin Educ Pract Vet 1992; 14(4): [11] Deluyker HA, Gay JM, Weaver LD, Azari AS. Change of milk yield with clinical diseases for a high producing dairy herd. J Dairy Sci 1991;74(2):
55 K.V. Nordlund, N.B. Cook / Vet Clin Food Anim 20 (2004) [12] Wiggans GR, Powell RL. Projection factors for milk and fat lactation records. USDA Dairy Herd Improve Lett 1980;56:1. [13] Wiggans GR, Dickinson FN. Standardization of NCDHIP dairy cattle lactation records. National Cooperative Dairy Herd Improvement Program Handbook, Fact Sheet G-2. Columbus (OH): National DHIA; p [14] Duffield T, Bagg R. Herd level indicators for the prediction of high-risk dairy herds for subclinical ketosis. In: 35th annual meeting of the American Association of Bovine Practitioners; Rome, GA; p [15] Geishauser T, Leslie K, Duffield T, Edge V. Fat/protein ratio in first test milk as test for displaced abomasums in dairy cows. J Vet Med A 1997;44: [16] Heuer C, Schukken YH, Dobbelaar P. Postpartum body condition score and results from the first test day milk as predictors of disease, fertility, yield, and culling in commercial dairy herds. J Dairy Sci 1999;82(2): [17] Barkema HW, Deluyker HA, Schukken YH, Lam TJGM. Quarter-milk SCC at calving and at the first six milkings after calving. Prev Vet Med 1999;38:1 9. [18] Stewart S, Fetrow F, Eicker S. Field use of DHIA somatic cell counts with scatter graphs. Compend Contin Educ Pract Vet 1995;17(11): [19] Cook NB, Bennett TB, Emery KM, Nordlund KV. Monitoring nonlactating cow intramammary infection dynamics using DHI somatic cell count data. J Dairy Sci 2002; 85(5): [20] Edwards JL, Tozer PR. Using activity and milk yield as predictors of fresh cow disorders. J Dairy Sci 2004;87(2): [21] Kelton DF, Lissemore KD, Martin RE. Recommendations for recording and calculating the incidence of selected clinical diseases of dairy cattle. J Dairy Sci 1998;81(9): [22] Reneau JK, Kinsel ML. Record systems and herd monitoring in production-oriented health management programs in food-producing animals. In: Radostits OM, editor. Herd health. 3rd edition. Philadelphia: WB Saunders; p [23] Kossaibati MA, Esslemont RJ. Wastage in dairy herds. In: DAISY The dairy information system report no. 4. Reading: University of Reading; p [24] Guard CL. Controlling fresh cow disease costs. In: Hoard s west. Fort Atkinson (WI): W.D. Hoard & Sons Co.; p. W-98. [25] Wells SJ, Trent AM, Marsh WE, Robinson AR. Prevalence and severity of lameness in lactating dairy cows in a sample of Minnesota and Wisconsin herds. J Am Vet Med Assoc 1993;202: [26] Whay HR, Main DCJ, Green LE, Webster AJF. Farmer perception of lameness prevalence. In: Proceedings of the 12th international symposium on lameness in ruminants, Orlando, FL; p
56 INTRODUCTION A FORM TO DEVELOP GOALS FOR DAIRY PRODUCTION MEDICINE PROGRAMS Ken Nordlund, DVM A production medicine program is a continual search to identify the current limitations of herd production and health and to develop solutions to those problems. For the programs to remain viable, the veterinarian must remain focused upon emerging problems and the dairy manager must remain committed to solving those problems. However, maintaining a focus on emerging problems and a commitment to their solution can be an elusive undertaking. A production medicine program may begin on a dairy with the identification of nutrition management as the primary production-limiting problem. The problems are defined and a program is designed to solve them. A year later, the nutrition issues may be resolved and opportunities might well be found in improvements of other aspects of herd management. Yet the nutrition program may have developed its own routine of production monitoring, feedstuff analysis, and ration formulation. Dairymen and veterinarians, like all people, tend to be creatures of habit. The once dynamic process of problem identification and solution has become static. There is no search for the next opportunity. In fact, the program is no longer a production medicine program, but has regressed back to a traditional nutrition program. Monitoring performance of a herd also has its pitfalls. Monitoring herd performance allows veterinarians and herd managers to identify emerging problems early and to measure progress toward goals. Many veterinarians set up a program to monitor herd performance, but fail to clearly establish the goals that are expected for the herd. Monitoring is a pointless exercise if the client is not committed to recognizing and solving problems This paper describes a form that can be used to identify dairy herd problems and establish production goals with the dairy manager. Completion of the form can increase client commitment to problem solving and monitoring of herd performance. THE GOAL FORM In the summer of 1988, I developed a form to help identify production opportunities and set goals. It was designed to: 1. Be completed in a discussion with a client 2. Utilize the clients records and their estimates of costs wherever possible 3. Provide a limited economic assessment of different production problems 4. Provide a format to mutually agree on production goals for the herd 5. Set the stage to develop a plan to accomplish these goals The form has been redesigned or updated many times since the first version in order more clearly define opportunities and remain current with industry data. The form is divided into sections on replacements and culling, udder health, genetics, reproduction, and nutrition. These sections are followed by a sheet to summarize areas for attention, list the goals, and describe a working plan. The form requires the several pieces of information: the number of heifers on the farm that have not calved, the girth and height of recently calved heifers, current milk plant pricing policy, and the DHI herd summary sheet. In addition, records or estimates of heifer deaths, clinical mastitis case
57 rates, and a variety of prices will be needed. It is useful to have a calculator. Personal experience indicates that it takes approximately 2 hours to complete the form and the resulting discussions. Replacement Heifers The replacement section includes a summary of heifer mortality rate, age at first calving, and size. The mortality rate, and age at which they begin milk production are related primarily to efficiency, whereas size at calving directly relates to production. 1. Heifer mortality rate Heifer mortality rates are determined from records or estimated from memory. Dividing the deaths into stillborn, pre-weaning, and after weaning categories is useful diagnostically. Reports from the National Dairy Heifer Evaluation Project suggest that the average stillborn rate is 1.5% and the pre-weaning mortality rate in the Midwest is about 7% (NAHMS, 1994). Our opinion regarding average stillborn rates are higher than this, but we have not collected data to revise this value. Goal rates have been set arbitrarily based upon these data and opinions. The price assigned to lost heifers will vary with the farm and the average age at the time of death and could range from about $150 to a newborn heifer and $1,200 to a pregnant, springing heifer. 2. Calving age of replacements The form next requests average age at first calving. This index is found on most DHI summary sheets. The dairyman is asked to put a price per day to maintain two-year old heifers. If the dairyman is reluctant to estimate a cost, asking what he would charge to board his neighbors pregnant heifers will usually generate a prompt estimate. This is a gross opportunity estimate. No effort is made to estimate the alternative costs of growing the heifers at greater growth rates. A partial budgeting approach to evaluate these alternatives would be appropriate if a new heifer nutrition program becomes part of the action plan. 3. Size of replacements at calving The next section asks for heart girth and height of recently calved heifers. A chart translating inches to estimated weight follows, as well as an estimate of the production impact of additional weight on first lactation yield (Keown, 1986). The economic consequences are calculated relative to a pound standard post-calving heifer and are multiplied by the number of heifers calving per year. Culling The direct cost of culling is estimated by subtracting the average price received for cull cows from the current price for springing heifers. This approach ignores other costs, as well as benefits, that can occur with culling.
58 The annual turnover rate for the dairy is compared to a goal rate of 25% (Rogers, 1988). The difference in excess of 25% is multiplied by the rolling average herd size and then multiplied by the direct transaction cost to estimate the direct cost of culling in excess of goal. Udder Health The udder health section focuses on economic losses to mastitis in three areas: subclinical production losses related to somatic cells, subclinical milk price premium losses, and clinical case losses. 1. Production losses due to subclinical mastitis Production losses due to subclinical mastitis are calculated from herd average somatic cell count (SCC) linear score (Reneau, 1986). For each increased unit of linear score greater than goal, a first lactation cow is assigned a loss of 222 lb. and a mature cow is assigned 444 lb. per lactation. 2. Milk price premiums lost due to high somatic cell counts Opportunities to generate milk price premiums for lower somatic cell counts are calculated based upon current premiums received versus the maximum offered by the dairy plant. There are situations where the maximum premium is associated with an unrealistic herd SCC. In those situations, select an appropriate SCC goal and premium level and calculate accordingly. 3. Losses due to clinical mastitis The clinical mastitis section requires an estimate of the number of clinical cases of mastitis per year. These cases would include the full range of clinical cases ranging from a simple tube treatment in one quarter to a coliform death. It is unusual for clients to record this number, and it seems easier to get them to estimate a typical number of clinical cases per month. An annual estimate is made, and the number is multiplied by $107 per case (Hoblet, 1991). Genetics Many veterinarians dismiss the details of genetics, as long as the sires are in artificial insemination. Yet this is a profound mistake for a production medicine advisor. In 2002, it is not difficult to pick two groups of bulls out of the available AI offerings that differ in Net Merit $ by $400. This means that the daughters of one group of bulls can be expected to produce $400 more net income per lactation than daughters of the other group. The financial impact of semen selection policy can exceed the impact of most of our other health programs and should not be overlooked. The chart in the form shows the average NM$ value of sires of different age groups of females on farms, stratified by different production levels in Wisconsin (WDHIC, 2001). The NM$ values are very dynamic for at least three reasons: 1) Yearly progress of the industry and the changing cow population within herds, 2) adjustments of individual bull data as progeny are added to the database, and 3) yearly adjustments of NM$ due to changes in average annual milk prices.
59 Net Merit $ is an index that combines the commercial value of milk production along with estimated values of reduced SCC and productive life of daughters. Technically, NM$ combines values as follows: milk (5%), fat (21%), protein (36%), Productive life (14%), somatic cell score (- 9%), Size (-4%), Udder (7%), and Feet and Legs (4%). The important point to remember is that the relative NM$ of sires used by the industry is quite dynamic and therefore, each version of the Goal-form will become outdated within a year because of the genetic section. Most DHI centers analyze the genetic data for their processing center several times each year, publish the benchmarks on the WWW, so that you can update your benchmark values. 1. Production losses in cows from lower value AI sires Potential losses of production are calculated relative to the genetic values being achieved by other high production dairy farms (Wisconsin DHIC, 1995). Deficiencies in this area can be addressed with improved sire selection. The availability of computerized sire selection programs such as BullSearch (Bullsearch, 1995), MaxBull (Cassell,1992), and others has made it possible for veterinarians to aid in identifying high performance sires for their clients. 2. Production losses in cows sired by unproven herd bulls The section on genetic losses from unidentified sires assumes that the sire is an unproven herd bull. Cassell estimates that an average daughter of the average AI bull will produce $134 more product per lactation than an average daughter of an unproven bull (Cassell, 1992). This calculation can stimulate interest in replacement synchronization and AI programs. Reproduction Reproduction losses are based upon two aspects of calving interval. If the calving interval is long, that fact will be reflected in an increase in the "average days-in-milk" (ADIM) of the lactating cows, the average length of the dry period, or both. 1. Excess rolling-average-days-in-milk Herd milk production is estimated to be reduced 0.17 lb. per cow per day of the year for each day the herd averages over 150 ADIM (Grusenmeyer, 1983). The goal-form uses 160 rolling ADIM as a goal, because the author is more comfortable with a 12.3 month calving interval than 12.0 months. It may be appropriate to increase the ADIM goal further for herds that use bovine growth hormone. The form demands calculation of an annual average of each month's ADIM. It is important to use the rolling 12-month average because inappropriate conclusions about reproductive performance are likely if only a single month's ADIM is used. Seasonal calving herds produce wide swings in ADIM through the year, and a single month value can easily range from 100 to 275 ADIM.
60 Because the entire herd does not milk for the entire year, the 365 days should be reduced by multiplying by the % days in milk of the herd. If the %Days in milk is not known for a herd, a default value of 85% can be used for most herds. 2. Average days dry If reproductive performance is poor, it is common for cows to have long dry periods. When average dry days exceeds 60, a penalty of $3.00 per day above 60 is assessed for each mature cow who went through the dry period (Grusenmeyer, 1983). Nutrition Average peak milk serves as an indicator of nutrition management. Peak milk is reflective of periparturient health, nutrient adequacy of rations, and feedbunk management. Other indicators such as "income over feed cost" would be useful, but that calculation usually takes considerable time to generate in most situations and it tends to focus the discussion prematurely on input costs and not on overall nutrition management. The traditional thumb-rule is that each additional pound at peak will increase lactation yield by about 220 lb., while this goal form suggests an additional 390 lb. and 280 lb. per lactation for first and second and greater lactations respectively. These larger numbers were generated from regression formulas based upon Wisconsin DHI data. Setting a goal in this category is more difficult than the other categories of the form. It is useful to find the rolling herd average most similar to your client and then compare the herd peak milk averages to those expected at that RHA. If peak milks achieved are similar to those expected, simply set a higher peak milk goal that is consistent with a desired RHA. If the peak milks are lower than those expected at the current RHA, setting a substantial increased peak goal is appropriate and a major effort to improve fresh cow performance and peak milk is justified. If the peak milks are higher than expected from the RHA, it may be appropriate to make no increase, or a very modest increase, in peak milk goals. In that situation, fresh cow nutrition is not the limiting factor of overall herd management as the production that should be realized from the high peaks is being lost in other of herd management. In some herds, peaks of one of the subgroups of 1st lactation cows or older cows will be found to deviate greatly from expected, but the other subgroup does not deviate. In these cases, the relatively "lower" group should be investigated. Low peaks of first lactation cows relative to the older cows may reflect a variety of growing, grouping, or feed delivery problems, whereas low peaks of mature cows may reflect metabolic disease problems, accumulated effects of poor housing and subacute disease, and a variety of feeding management problems. The total economic opportunities should be calculated, but then modified by subtracting the values from other categories that would by themselves increase peak milk. This avoids double counting the opportunities from overlapping categories. The subcategory values generated in undersize at first calving, genetics, and production losses based on linear score should be subtracted from the initial peak milk opportunities, yielding an estimate of gross opportunities from improving peak milk production.
61 Areas for Attention The last page of the goal form begins with space for notes. It is a place to jot down the largest loss items and specific comments relative to herd problems. This listing can be used to guide the goal-setting discussion that should follow. Goals and Plans Space is provided to write a prioritized list of goals and an initial plan. Goals should be selected with care, and a discussion of goal setting and monitors follows this section. The plan to achieve the goals is usually quite apparent, but in some cases, the plan will begin with diagnostic work to further define the problem. In other instances, the plan will simply be the initiation of a scheduled program. When completed, this section serves as a written agreement to implement a production medicine program. DESIRABLE CHARACTERISTICS OF GOALS AND MONITORS Mutuality of goals Effective production medicine programs begin with a mutual commitment to common goals by the dairy manager and the veterinarian. Veterinarians frequently assume that the goals they desire for herd programs are the same goals that their client has for the herd. It is a mistake to make the assumption. When the veterinarian has a goal of a somatic cell count of 100,000 that is not shared by the client and proceeds to comment on a failure to achieve it, the veterinarian risks being viewed as an irritating nag. The goals of both the dairy manager and the clinician must be mutual and understood by each other. Expression of goals in economic terms Veterinarians tend to define production indices in biological terms and speak of somatic cells and days open as if they were as clear a threat as hailstones. Yet our clients may not share our bias and may not fully understand our language. If herd performance indices are converted to their estimated economic consequences, problems can be prioritized in a more logical manner and the resulting goals can become more compelling for our clients. Prioritized and limited number of goals Production medicine is an attempt to coordinate and integrate all of the production and health services to a herd. As professionals, we seek thoroughness. However, thoroughness does not require that all problems are addressed simultaneously. We risk attaining nothing when we seek to solve all problems at once. It is the responsibility of a production medicine clinician to help prioritize problems, set goals that are achievable within the constraints of the operation, and develop programs to realize them. The person who can focus on one or two goals will usually achieve them, while the person with 100 goals frequently achieves none.
62 Monitors that respond promptly to change When a goal is established, a monitor must be designed to track progress toward that goal. Monitors should be defined to respond to changes within a short time frame. The usefulness of monitors can be confounded by two different time-related phenomena: lag and momentum (Stewart, 1994). Momentum occurs when much historical data is included in the calculation of the index. A typical example would be any 12-month rolling herd average where the current month index is calculated by averaging the data from the current month with that from the previous 11 months. Because 11/12 of data is historical, the rolling average will not change much even if the current month performance changes dramatically. In other words, 12-month rolling averages have a momentum that is difficult to change. In general, annual rolling averages should be avoided as monitors of current performance. Lag occurs when there is an extended period of time between an intervention and the measured result. An example of lag in a monitor occurs when a client implements a change in a heifer rearing program in order to reduce the average age at first calving. If heifer nutrition and parasite control programs are implemented now and followed by earlier breeding, it will be a full year before these improvements are reflected in a reduced calving age. Monitors that lag behind real change should be avoided. In this example, alternative monitors with less lag would be "average age at first breeding", "average age at conception", or "projected age at calving" of heifers confirmed pregnant. These monitors would provide positive feedback within a couple months after beginning the program. Task-specific monitors Monitors should be selected to measure the most critical aspect of achieving a goal. For example, a herd with reproductive problems may have a goal of reducing "average days open". However, if ineffective heat detection is the primary problem resulting in long open days, "average days open" should not be used as a monitor. An appropriate monitor will focus on heat detection efficiency. On a regular basis, the veterinarian might produce a list of the cows eligible to be bred in the next 21 days and track the percentage of the list that is actually inseminated in the time period. USE OF THE FORM The intent and limitations of the form need to be clear: the goal form is designed to bring attention to the big opportunities for a dairy and assist in the goal-setting process. The equations in the form produce gross economic estimates of the losses the dairy incurs annually in failing to meet the specified targets. The costs of achieving the goals are not estimated. In this sense, the form is simplistic as an analytical tool. However, attempts to estimate net benefit of achieving a goal usually make the process too unwieldy and extensive to accomplish. A less than precise tool that can be completed in a practical world may be more effective than a precise analysis that is rarely done. The goal form was designed to depend upon data that was readily available on most dairy farms and the process had to take less than three hours to complete. Efforts have been made to avoid "doublebilling" or counting the same problem twice.
63 Because completion of the form takes professional time, veterinary time should not be ignored in pricing this service.. While the approach to fees for a goal setting exercise will be handled differently by each practitioner, the following comment may be helpful. The client benefits from the exercise and for many clients, it will be their first experience in preparing a written goal and plan. The veterinarian also benefits because a common outcome of the discussion is the initiation of new or expanded services. Therefore, part of the time results in "service sales" and clients will object to being charged for listening to a "salesman". Because there are benefits to both parties from the exercise, I found it acceptable to track the time spent in the exercise and bill for half of the professional time. The discussion of goals and plans usually occur simultaneously. There is a tendency for users of the form to rank problems in order of highest dollar amount and create a goal based on the biggest item. This may be correct sometimes, but the area selected for change should be based upon several considerations that are listed in Table 1. Two examples may be useful. There may be large losses in the mastitis section of the goal form for one Table 1. PLAN FOR MANAGEMENT AREA: Should the plan be implemented? Consideration: NO YES Potential return Low High Cost to implement High Low Interval to effect Years Weeks Odds of success Questionable Certain Impact of failure Bankruptcy Minimal client. After some investigation, the problem appears to be due to environmental organisms and the plan would involve increasing the vacuum level to reduce liner slips and the initiation of a predip program. Should the plan be implemented? The potential return is high, the cost to implement the program is minimal, the interval to effect would be weeks or days, the odds of success are good, and the impact of failure would be that things remain as they are now. All considerations say YES, the program should be implemented. The mastitis section may also yield the largest dollar amount on a neighboring farm. After further investigation, however, this second dairy may have a problem defined as a Staph. aureus problem herd with an inadequate milking system. Modernization of the milking system will cost $25,000 and perhaps 25% of the herd should be culled. In reviewing the "considerations" in the chart above, the potential return may be high as in the earlier example. However, the interval to effect may be months and the odds of success uncertain because of inconsistent milking practices, which suggests a "maybe". However, the cost to implement is very high and the added debt might make the farm vulnerable to bankruptcy if they experienced a poor crop year in addition to their current precarious debt situation. These considerations would make this plan less attractive. In this situation, the client should be advised to consider the decision further, perhaps develop partial budgets to study the issue further, and obtain professional financial advice regarding farm debt management. Perhaps the client should find other areas of the goal form that could yield income more quickly and with lower risk to the operation. The exercise can be repeated whenever a new overview is justified. However, I believe that an interval of about a year is appropriate in most programs.
64 SUMMARY Clearly defined goals facilitate the delivery of production medicine programs. Carefully defined monitors that reflect specific tasks and respond in timely fashion can help motivate people to accomplish goals. Time spent with a carefully constructed form to overview major health and production areas serve can as an effective motivator and as a written agreement to address production problems. REFERENCES BullSearch, Holstein Association, 1 Holstein Place, Brattleboro, VT Cassell, B.G., MaxBull, Department of Dairy Science, Virginia Tech, Blacksburg, VA Cassell, B.G., Sell the Bull and Buy Semen. Hoard's Dairyman, January 25, 1991, p.89. Funk, D.A. Impact of Lower Milk Prices on PTA$ Values. Holstein World, Feb Goodger, W.J., Fetrow, J., et. al., A Computer Spreadsheet Program to Estimate the Cost of Raising Dairy Replacements. Preventive Veterinary Medicine, 7 (1989), p Grusenmeyer, D., et. al., Evaluating Dairy Herd Reproductive Status Using DHI Records. Western Regional Ext Pub 0067, Washington State University Coop. Extension Hoblet, Kent. Economics of Clinical Mastitis. Proc Ann. Meeting National Mastitis Council. 1991, p Koewn, J.F., Freshen Heifers at 1,200 lbs. Dairy Herd Mgt, August, 1986, page 18. National Animal Health Monitoring Service, Dairy Heifer Morbidity, Mortality, and Health Management Focusing on Preweaned Heifers South Howes, Suite 200, Fort Collins, CO Reneau, J.K., Dairy Herd Performance Evaluation: Mastitis Monitors. Proceedings of the American Association of Bovine Practitioners, No. 18, p , April Rogers, G.W., Van Arendonk, J.A., and B. T. McDaniel. Influence of Production and Prices on Optimum Culling Rates and Annualized Net Revenue J. Dairy Science 71, No. 12, 1988, p Stewart, S., Eicker, S., and Fetrow, J. Analysis of Current Performance on Commercial Dairies. Compendium 16, No. 8, 1994, p Wisconsin DHIC Profile. Wisconsin DHI Cooperative
65 UW-SVM Dairy Production Medicine GOALFORM Version 21: Ken Nordlund, June 14, 2004 CLIENT: Date: Vet: REPLACEMENT HEIFERS LOSSES DUE TO EXCESS HEIFER MORTALITY Inventory: Number of heifers on farm: No. heifer deaths past year: + + = Stillborn Preweaning Wean-Calve Total # deaths Goal <1.5% <5.5% <2% <9% Population at risk: ( + + ) = Hfrs on farm # dead / yr # sold / yr (Total dead) = = 0. x x = Death Goal Excess Population Avg. value Annual loss Population at risk) rate deaths at risk to excess deaths LOSSES DUE TO OVERAGE HEIFERS ( - 24 months ) x 30 x x = Avg Age 1 st days/mo $/day No. hfrs / yr Annual Loss to Calving, Months Overage calving LOSSES DUE TO UNDERSIZED HOLSTEIN HEIFERS Size of recent 1st lactation cows: Heart Body Wt Differential from Girth, at Calving 1200 lb target wt, inches (lbs) lbs. milk 1st lact. Avg. Heart Girth Avg. Withers Height Keown, DHMgt, Aug >82 > ( x ) x = No. Heifers enter herd/year Lbs milk lost Milk price per lb Annual production loss to undersized heifers CULLING Weighted average cull value: Class No. Value Total Dairy sales $ $ Culls Deads Wtg Average Cull Price = Sum of all animals sold / number sold = Culling Transaction Cost: $ - $ = Replacement heifer Avg Cull Price Avg.Cost per Cull x ( ) x = Rolling # cows Annual turnover Goal turnover Avg. cost Annual cost of in herd rate rate per cull excess culling $ $ $ $
66 UW-SVM Dairy Production Medicine GOALFORM Version 21: Ken Nordlund, June 14, 2004 UDDER HEALTH PRODUCTION LOSSES DUE TO SUBCLINICAL MASTITIS Lactation No. Avg Production Lbs milk lost Group Head LS Goal Loss/Unit LS per Group 1st Lactation: x ( ) x 220 lb = Other Cows: x ( ) x 440 lb = OPPORTUNITY FROM MILK QUALITY PREMIUMS x = Total Lbs Lost Milk price per lb Annual production loss to subclinical mastitis Maximum SCC premium from your milk plant: $ 0. per cwt ( at 150,000 SCC) Average quality premium received last year: $ 0. per cwt (avg SCC past year = ) Potential premium difference: $ 0. per cwt x x / 100 = Rolling Herd Average Milk Rolling #. Cows Pot. Premium. Diff per cwt Annual premium opportunity $ $ LOSSES FROM ACUTE MASTITIS: - x $107 = Estimated # of Target # of cases / yr Annual loss to clinical cases mastitis cases/year (15% of R# cows) The average mastitis flareup will cost $107, as a combination of $12 in medication, $90 in discarded and decreased milk, $2 in veterinary cost, and $3 in labor. (Hoblet, NMC 1991) $ GENETICS LOSSES DUE TO SEMEN SELECTION RELATIVE TO TOP HERDS >30,000 NM$ No. Identified Lactation Group NM$ Your herd Difference. Cows First Lact. Cows ( ) = ( ) x ( ) = 2 nd Lact. Cows ( ) = ( ) x ( ) = Later Lact. Cows ( ) = ( ) x ( ) = Total = LOSSES DUE TO HERD BULLS OR UNIDENTIFIED SIRES Total cows No. No. not Genetic (Cassell,1990) Lactation Group in Group Identified Identified Loss $ Annual NM$ losses First Lact. Cows ( ) - ( ) = ( ) x $134 = 2 nd Lact. Cows ( ) - ( ) = ( ) x $134 = Later Lact. Cows ( ) - ( ) = ( ) x $134 = Total = $ Annual non-ai losses
67 UW-SVM Dairy Production Medicine GOALFORM Version 21: Ken Nordlund, June 14, 2004 REPRODUCTION: Average Days in Milk (Lactating Cows ONLY) 1 Reproduction problems result in 2 cows having extended lactations. 3 The herd average days in milk is 4 very reflective of long term 5 reproductive status of the herd. 6 7 Because average days in milk is highly variable 8 in seasonally calving herds, a Rolling Average 9 Days-In-Milk should be calculated by averaging 10 The herd average days in milk over the previous months. 12 Sum above and divide by 12 = Rolling ADIM MILK SALES LOST DUE TO MILKING LATER AND LOWER IN LACTATION CURVE ( ) x x 0.17 x $ / lb x 365 days x 0.89 = Rolling ADIM days Rolling # Cows lb/day* Milk price %DIM Annual loss to long DIM * Western Regional Ext. Pub PRODUCTION LOSS DUE TO LONG DRY PERIODS ( - 55 ) x x $3.00/day * $ = Avg Days Dry days # 2(+) lact cows Annual loss to long dry days NUTRITION: ECONOMIC IMPACT OF PEAK MILK Calculate a weighted average peak milk of 2 nd and 3+ Cows: No Cows AvgPeak Product 2nd 3+ Total Total Product / Total # cows = Wtg Avg Peak RHA milk Avg Peak, Your Avg Peak, Your Lbs 1 st Lact 1 st Lact Peaks Mature cows 2+ peaks 30, , , , , (Circle 25, (AgSource, regression RHA closest 24, of Dec 2001 data) to your 23, herd avg) 22, , , , , , Goal increase No cows from current peak Milk price/lb 1 st Lact x x 390 lb / lact x = 2(+) Lact x x 280lb / lact x = Preliminary Total = (To avoid double counting factors that increase peak milk, subtract $ amounts from other areas that would increase peak milk. If increased peak goals were stated for only 1 st or older cows, subtract amounts from other categories designated to that parity group only.) (-) (-) (-) = Preliminary peak $ Heifer size Genetic SCC Linear Annual $ from increased peaks Losses losses Score Losses $ $
68 UW-SVM Dairy Production Medicine GOALFORM Version 21: Ken Nordlund, June 14, 2004 Goal Form Summary for Herd: Date: Replacements Item Goal-form categories related to increased milk production Categories related to cost control or price, but not production Excess calf mortality Age at first calving Size at first calving Culling Excess cull rate Mastitis Subclinical mastitis SCC Premiums Excess clinical cases (80%) (20%) Genetics PTA$ relative to top herds PTA$ from unidentified sires Reproduction High rolling days-in-milk Excess days dry (50%) (50%) Nutrition Peak milk opportunities Total Check: / / = Production $ increase Milk price per lb No. of cows Increase per cow per yr
69 UW-SVM Dairy Production Medicine GOALFORM Version 21: Ken Nordlund, June 14, 2004 AREAS FOR ATTENTION MANAGEMENT GOALS PLANS / NEXT STEP

70 Ohio Dairy Vets January 7-8, 2005 Columbus, Ohio A New Look at Ventilating Calf Barns in Winter Introduction Ken Nordlund, DVM School of Veterinary Medicine, University of Wisconsin-Madison Based upon field investigations in the past decade of calf rearing operations, the age old problem of enzootic calf pneumonia persists in modern calf rearing operations. The disease syndrome that used to live in the old pig house that became the calf barn has made the adaptation to thrive in modern, glistening new barns. Experience and research in the past two years has led me to these opinions regarding winter ventilation of calf barns: 1. Calves do not generate enough heat to move air by convection toward an open ridge in a naturally ventilated barn. 2. Mixing and dilution of contaminated air in cold calf housing requires either a) open sidewalls to allow prevailing winds to traverse the space, b) mechanical systems to force a minimal amount of fresh air through the barn, or c) the addition of heat to create thermal buoyancy and mixing. 3. Mechanical ventilation of winter calf barns should be done with positive-pressure distribution ducts, because the required small inlet areas for negative pressure systems cannot be reliably achieved or maintained in most barn situations. 4. Deep, fluffy straw bedding is required during cold weather for either approach that does not use added heat. Background information on air hygiene We are currently working to develop a system to objectively assess air quality in calf barns by determining concentrations of airborne bacteria. Impaction sampling devices, although currently quite expensive at approximately $3,000, have been developed for quality control programs in sterile room manufacturing facilities, surgical suites, etc. A programmed quantity of air is drawn through the sampling device at precise speeds where the mass of the airborne organism impacts a media on a Petri dish, can be grown and counted, allowing the use to estimate the quantity of live organisms per cubic meter of air. Ken Nordlund, DVM, University of Wisconsin- Madison
71 Ohio Dairy Vets, January 7-8, 2005 In the most general terms, outdoor air will contain about 100-1,000 cfu/m 3, although we have collected samples as high as 20,000. In well-ventilated office buildings, the counts will usually range from 1,000-3,000 cfu/m 3. In well-ventilated livestock buildings, we expect to recover from 10,000-30,000 cfu/m 3. Generally, bacterial counts in poorly ventilated calf housing associated with enzootic calf pneumonia exceed 500,000 cfu/m 3. Because the sampling devices being manufactured today are designed for spaces approaching sterile, we cannot make a reliable count about approximately 300,000. Gross observation of plates, however, suggests that many calf barns will have counts that exceed several million live organisms per cubic meter of air. There is a mixed growth of bacteria recovered on the plates, usually dominated by various Staphylococci, Streptococci, Bacillus, and E. coli. We have made limited efforts to count specific respiratory pathogens like Mannheimia, Pasteurella, and Mycoplasma with differential plates, but have been unsuccessful with this technique. Based upon preliminary data, it does not appear that air with extremely high bacterial counts is, by itself, harmful to the health of calves, although some writers have speculated that extended exposure to air with high counts may overwhelm the muco-ciliary escalator clearance mechanisms in the lung. It is our hypothesis that environmental conditions that allow a high density of non-pathogenic bacteria to accumulate in air will also create a high density of pathogens if pathogen-shedding animal is introduced into the space. Factors that determine bacterial counts in air A conceptual formula has been developed to describe bacterial density in air. C = N V R x ( qr + qs + qd + qv) The symbol C is the concentration of bacterial colony forming particles per cubic meter of air, N is the number of animals, V is the volume of building space, R is the release of organisms per animal, and q describes the clearance of bacteria from air by ventilation (v), sedimentation (s), inspiration into respiratory tracts (r), and desiccation and UV light (d). Ken Nordlund, DVM, University of Wisconsin- Madison
72 Ohio Dairy Vets, January 7-8, 2005 Stocking density is the most significant determinant of air bacterial counts. Using mathematical models to calculate airborne bacterial densities, a tenfold increase in ventilation rate (example, from 4x to 40x air changes per hour) is required to compensate for a doubling of stocking density. Airborne bacteria are released primarily from skin and feces, but cattle with respiratory disease can exhale and cough pathogens into the air. Clearance of organisms by inspiration (q r ) into lungs and sedimentation (q s ) to the floor are minor factors. The primary clearance mechanisms are though desiccation (q d ) and ventilation (q v ). Most bacteria die within seconds after becoming airborne because of dehydration. However, as relative humidity increases above approximately 80%, survival time increases into minutes and sometimes hours, resulting in dramatic increases in bacterial density. While the relative humidity of air in a building is determined primarily by the humidity of the ambient outside air, additional water is added from animal respiration as well as water usage within the building. For example, a 175 lb calf can transfer 0.3 lbs of water/hr to the environment and a 1,400 lbs cow may exhale 4.5 gallons of water per day. Floors that allow urine and water to stand will be associated with higher humidity levels. Careless water-use practices from hoses and power washers can increase humidity greatly and increase the bacterial load in air. Ventilation removes organisms directly in the air stream leaving the building, and also reduces relative humidity, which may reduce survival time in air of the bacteria remaining in the building. Warm air can hold more water than cold air, therefore heating air will reduce the relative humidity although the absolute water in the air remains the same. Therefore, heating air will reduce relative humidity, which may reduce bacterial loads because of increased clearance through desiccation. Initial Findings in Naturally Ventilated Calf Barns We collected air hygiene and calf health data in 18 different naturally ventilated calf barns in early We sampled air in the central alleys and deep in the individual calf pens. We also measured indoor and outdoor temperature and relative humidity. Ken Nordlund, DVM, University of Wisconsin- Madison

73 Ohio Dairy Vets, January 7-8, 2005 Figure 1. A typical naturally ventilated calf barn Using the Respiratory Scoring System described by Dr. McGuirk, we found an average prevalence of 27% of calves with respiratory scores of 5 or more, with a range of 0-55%. It was common to recover counts of less than 15,000 in the central alley, but in excess of 300,000 deep in the calf pens. This suggests that there was very little mixing of air in the barns, probably related to the extremely limited heat coming from the calves. One of the strongest clinical impressions emerging from the study was the importance of deep straw bedding. The barns with the healthiest calves tended to keep sidewalls somewhat open even in the coldest weather, but also provided deep straw in pens so that calves could nest. In barns with sawdust, shavings, or other small-particle bedding, operators tended to close the eaves and sidewalls. Some even closed the ridge openings. These barns tended to have extremely high bacterial counts and high rates of respiratory disease. Ken Nordlund, DVM, University of Wisconsin- Madison
Nigel B. Cook MRCVS Clinical Associate Professor in Food Animal Production Medicine University of Wisconsin-Madison School of Veterinary Medicine
 WHERE THE RUBBER MEETS THE ROAD: ADVENTURES AT THE CLAW-FLOOR INTERFACE Nigel B. Cook MRCVS Clinical Associate Professor in Food Animal Production Medicine University of Wisconsin-Madison School of Veterinary
WisGraph 8.0 Interpretive Manual
 WISGRAPH 8. WISGRAPH 8. WisGraph 8. Interpretive Manual Ken Nordlund, DVM, Nigel Cook, MRCVS, and Tom Bennett, BS UW School of Veterinary Medicine Introduction to the Graphs The graphs are generated from
Trigger Factors for Lameness and the Dual Role of Cow Comfort in Herd Lameness Dynamics
 Trigger Factors for Lameness and the Dual Role of Cow Comfort in Herd Lameness Dynamics Nigel B. Cook School of Veterinary Medicine, University of Wisconsin-Madison Introduction Current estimates of lameness
WisGraph 7.0 Interpretive Manual
 WisGraph 7. Interpretive Manual Ken Nordlund, DVM and Tom Bennett UW School of Veterinary Medicine Introduction to the Graphs The graphs are generated from herd DHI data from Wisconsin AgSource and downloaded
What the Research Shows about the Use of Rubber Floors for Cows
 What the Research Shows about the Use of Rubber Floors for Cows February 11, 2008 Brian J. Holmes Professor and Extension Specialist University of Wisconsin Madison 460 Henry Mall Madison WI 53706 608
Evaluate Environment (page 7-8)
") Goal: Identify risk areas that may be contributing to a lameness problem. Data Collection Steps: 1. Hoof Trimming table: identify lesions and assess hoof trimming 2. Milking Parlor exit alley assess footbath
Goal: Identify risk areas that may be contributing to a lameness problem. Data Collection Steps: 1. Hoof Trimming table: identify lesions and assess hoof trimming 2. Milking Parlor exit alley assess footbath
Behavioral Changes Around Calving and their Relationship to Transition Cow Health
 Behavioral Changes Around Calving and their Relationship to Transition Cow Health Marina von Keyserlingk Vita Plus Meeting Green Bay, Wisconsin December 2, 29 To develop practical solutions to improve
Estimating the Cost of Disease in The Vital 90 TM Days
 Estimating the Cost of Disease in The Vital 90 TM Days KDDC Young Dairy Producers Meeting Bowling Green, KY February 21, 2017 Michael Overton, DVM, MPVM Elanco Knowledge Solutions Dairy moverton@elanco.com
Economic Review of Transition Cow Management
 Economic Review of Transition Cow Management John Fetrow VMD, MBA, DSc (hon) Emeritus Professor of Dairy Production Medicine College of Veterinary Medicine University of Minnesota This presentation is
Using DHIA and bacteriology to investigate herd milk quality problems.
 Using DHIA and bacteriology to investigate herd milk quality problems. Nigel B. Cook BVSc MRCVS Clinical Assistant Professor in Food Animal Production Medicine University of Wisconsin-Madison, School of
Premiums, Production and Pails of Discarded Milk How Much Money Does Mastitis Cost You? Pamela Ruegg, DVM, MPVM University of Wisconsin, Madison
 Premiums, Production and Pails of Discarded Milk How Much Money Does Mastitis Cost You? Pamela Ruegg, DVM, MPVM University of Wisconsin, Madison Introduction Profit centered dairy farms strive to maximize
FAIL. Animal Welfare vs Sustainability. 8,776 cows in 67 UK herds. Mean lameness prevalence of 39.1%!!!!!!
 Using First Step to Solve Dairy Herd Lameness Problems Nigel B. Cook MRCVS School of Veterinary Medicine University of Wisconsin-Madison Animal Welfare vs Sustainability FAIL Main et al., 2010 JDS 93:1970-1978
Herd Health Plan. Contact Information. Date Created: Date(s) Reviewed/Updated: Initials: Date: Initials: Date: Farm Manager: Veterinarian of Record:
 Reviewed/Updated: Initials: Date: Initials: Date: Farm Manager: Veterinarian of Record:") Contact Information Farm Name: Veterinarian of Record: Farm Owner: Farm Manager: Date Created: Date(s) Reviewed/Updated: Farm Owner: Date: Initials: Date: Initials: Date: Farm Manager: Date: Initials:
Contact Information Farm Name: Veterinarian of Record: Farm Owner: Farm Manager: Date Created: Date(s) Reviewed/Updated: Farm Owner: Date: Initials: Date: Initials: Date: Farm Manager: Date: Initials:
Strep. ag.-infected Dairy Cows
 1 Mastitis Control Program for Strep. ag.-infected Dairy Cows by John Kirk Veterinary Medicine Extension, School of Veterinary Medicine University of California Davis and Roger Mellenberger Department
NYSCHAP BASELINE SURVEY Cover Page
 Cover Page FEDERAL PREMISES DETAILS INVESTIGATION DETAILS Federal Premises ID Herd ID Reviewed By Business Name Reviewed Date Address Entered By Entered Date City/Town SURVEY TYPE New Herd Plan Annual
, Pamela L. Ruegg
 Premiums, Production and Pails of Discarded Milk How Much Money Does Mastitis Cost You? Pamela Ruegg, DVM, MPVM University of Wisconsin, Madison Introduction Profit centered dairy farms strive to maximize
Lameness Information and Evaluation Factsheet
 Lameness Information and Evaluation Factsheet What is it? Lameness in dairy cattle refers to any painful condition, which causes a cow to change the way she walks in order to the limit the amount of weight
Don t be so lame- Time to Implement Solutions to Sore Feet
 Don t be so lame- Time to Implement Solutions to Sore Feet Nigel B. Cook MRCVS University of Wisconsin-Madison, School of Veterinary Medicine 2015 Linden Drive Madison, WI 53706-1102 608-265-4981 Phone
Mastitis MANAGING SOMATIC CELLS COUNTS IN. Somatic Cell Count Are Affected by. Somatic Cells are NOT Affected by:
 MANAGING SOMATIC CELLS COUNTS IN COWS AND HERDS Pamela L. Ruegg, DVM, MPVM University of Wisconsin, Madison Bacterial infection of the udder 99% occurs when bacterial exposure at teat end exceeds ability
F-MC-2: Dealing with Streptococcus agalactiae Mastitis
 F-MC-2: Dealing with Streptococcus agalactiae Mastitis R. Farnsworth, S. Stewart, and D. Reid College of Veterinary Medicine, University of Minnesota, St. Paul Streptococcus agalactiae was first recognized
BIOSECURITY ON DAIRIES... ARE WE DOING ENOUGH?
 BIOSECURITY ON DAIRIES... ARE WE DOING ENOUGH? Mike Collins, DVM, PhD School of Veterinary Medicine University of Wisconsin BIOSECURITY: EFFORTS TO CONTROL SPREAD OF INFECTIOUS DISEASES There are three
DAIRY HERD HEALTH IN PRACTICE
 Vet Times The website for the veterinary profession https://www.vettimes.co.uk DAIRY HERD HEALTH IN PRACTICE Author : James Breen, Peter Down, Chris Hudson, Jon Huxley, Oli Maxwell, John Remnant Categories
Quality Milk on Pasture Based Dairy Farms. Scott E. Poock, DVM University of Missouri Clinical Assistant Professor DABVP Beef and Dairy Cattle
 Quality Milk on Pasture Based Dairy Farms Scott E. Poock, DVM University of Missouri Clinical Assistant Professor DABVP Beef and Dairy Cattle Overview Present Status of Industry Why Milk Quality is Important
Charmany Dairy Herd Newsletter Oct. 29 th Nov. 4 th Daily Events
 Daily Events Monday: Milking system evaluation; housing assessment; hygiene score - PM2 4 th year students Theriogenology palpation labs - 3 rd year students Mastitis investigation-including assessing
DAIRY HERD INFORMATION FORM
 DAIRY HERD INFORMATION FORM 1 Farm Name Date Owner Name Cell # Address City State Zip E-mail Account # Office # Fax # Home # OTHER DAIRY CONTACTS 1) Manager/Herdsperson Email Cell# Office # 2) Name_ Cell#
What is Dairy Production Medicine?
 VE TE R INAR Y ME DIC INE TE AC HING AND RE S E AR C H CE NTE R S enior R otations in Dairy P roduc tion Medic ine LE AR NING OB J E C T IV E S What is Dairy Production Medicine? Production medicine is
Foot Health - A Foundation of Animal Care. Karl Burgi Dairyland Hoof Care Institute, Inc Baraboo WI
 Foot Health - A Foundation of Animal Care Karl Burgi Dairyland Hoof Care Institute, Inc Baraboo WI Overview Status of the Industry Understanding foot health Early fall lameness A lesion orientated approach
NYS Cattle Health Assurance Program. Expansion Module Background and Best Management Practices
 NYS Cattle Health Assurance Program Expansion Module Background and Best Management Practices Introduction Expanding your dairy business can improve both your profits and your lifestyle. It could also
Milk Quality Management Protocol: Fresh Cows
 Milk Quality Management Protocol: Fresh Cows By David L. Lee, Professor Rutgers Cooperative Extension Fresh Cow Milk Sampling Protocol: 1. Use the PortaSCC milk test or other on-farm mastitis test to check
Mastitis: Background, Management and Control
 New York State Cattle Health Assurance Program Mastitis Module Mastitis: Background, Management and Control Introduction Mastitis remains one of the most costly diseases of dairy cattle in the US despite
Objectives. Lameness in cattle. Herd management of musculoskeletal disorders in. Common musculoskeletal problems. Diseases of the hoof horn
 Objectives Herd management of musculoskeletal disorders in cattle Dr. Simon Kenyon Recognize the common musculoskeletal disorders of cattle Understand the management factors that lead to them Understand
Dairy Cattle Assessment protocol
 Dairy Cattle Assessment protocol Guidance on sampling: Individual measures 1a. Mobility individual scoring 2. Body condition 3. Cleanliness 4. Hair loss, Lesions 5. Swellings Assessed on 20 cows from the
Transition Period 1/25/2016. Energy Demand Measured glucose supply vs. estimated demands 1
 To Ensure a More Successful Lactation, The Vital 90 TM Days Make a Difference Andy Holloway, DVM Dairy Technical Consultant Elanco Animal Health Has been defined as the period of 3 weeks prepartum to 3
29/11/2017. Best Milking Practices. Greg Strait- Fulton County Extension Amber Yutzy- Huntingdon County Extension
 Best Milking Practices Greg Strait- Fulton County Extension Amber Yutzy- Huntingdon County Extension 1 Milking is a complex interaction AND not likely related to ONE factor alone What is Mastitis? Bacterial
proaction in Ontario Created by Drs. Steven Roche & Kelly Barratt
 proaction in Ontario Created by Drs. Steven Roche & Kelly Barratt What is proaction? National Quality and Customer Assurance Program for Canada Led by DFC and supported by provinces by farmers, for farmers
Risk factors for clinical mastitis, ketosis, and pneumonia in dairy cattle on organic and small conventional farms in the United States
 J. Dairy Sci. 96 :1 17 http://dx.doi.org/ 10.3168/jds.2012-5980 American Dairy Science Association, 2013. Risk factors for clinical mastitis, ketosis, and pneumonia in dairy cattle on organic and small
Management factors associated with veterinary usage by organic and conventional dairy farms
 Management factors associated with veterinary usage by organic and conventional dairy farms Roxann M. Richert, DVM, MS; Kellie M. Cicconi, PhD; Mike J. Gamroth, MS; Ynte H. Schukken, DVM, PhD; Katie E.
Effects of Heat Stress on Reproduction in Lactating Dairy Cows
 Effects of Heat Stress on Reproduction in Lactating Dairy Cows Paul M. Fricke, Ph.D. Professor of Dairy Science University of Wisconsin - Madison Maintenance of Body Temperature in Dairy Cattle Homeothermy:
Using SCC to Evaluate Subclinical Mastitis Cows
 Using SCC to Evaluate Subclinical Mastitis Cows By: Michele Jones and Donna M. Amaral-Phillips, Ph.D. Mastitis is the most important and costliest infectious disease on a dairy farm. A National Mastitis
Rearing heifers to calve at 24 months
 Rearing heifers to calve at 24 months Jessica Cooke BSc PhD (nee Brickell) 26 th January 2012 Successful heifer rearing to increase herd profits Rearing heifers represents about 20% of dairy farm expenses
April Boll Iowa State University. Leo L. Timms Iowa State University. Recommended Citation
 AS 652 ASL R2102 2006 Use of the California Mastitis Test and an On-Farm Culture System for Strategic Identification and Treatment of Fresh Cow Subclinical Intramammary Infections and Treatment of Clinical
Northern NY Agricultural Development Program 2016 Project Report
 Northern NY Agricultural Development Program 2016 Project Report Evaluation of Powdered Teat Dip Post Milking Under Cold Weather Conditions in Northern New York Project Leader(s): Kimberley Morrill, PhD,
GENETIC SELECTION FOR MILK QUALITY WHERE ARE WE? David Erf Dairy Technical Services Geneticist Zoetis
 GENETIC SELECTION FOR MILK QUALITY WHERE ARE WE? David Erf Dairy Technical Services Geneticist Zoetis OVERVIEW» The history of genetic evaluations» The importance of direct selection for a trait» Selection
Mastitis Module Risk Assessment Guide by Pathogen. Streptococcus agalactiae
 ! Mastitis Module Risk Assessment Guide by Pathogen Risk Factors Risk Information # Informational Statement! Intervention tactic Risk factors on this farm (level of implementation) Farm Feasibility Y,N
Cattle Foot Care And Lameness control
 Cattle Foot Care And Lameness control Mobility/Locomotion scoring. This is the only way to determine the degree of lameness in a herd. It should be performed as an independent assessment otherwise it is
Profitable Milk System
 INON Profitable Milk System We have developed a range of solutions that can help the dairy farmer maximize the profit potential of his dairy farm. Each of these products is based on more than 40 years
A Few Economic and Management Considerations for Dairy Heifers
 A Few Economic and Management Considerations for Dairy Heifers Michael Overton, DVM, MPVM Three Objectives for Today 1. Share some data around the heifer breeding window How do late-conceiving heifers
May Why is Participation in Johne s Disease Testing Programs so Low, and is it Important to Increase Johne s Surveillance in the Dairy Industry?
 May 2007 Why is Participation in Johne s Disease Testing Programs so Low, and is it Important to Increase Johne s Surveillance in the Dairy Industry? The Utah State Paratuberculosis (Johne s Disease) Control
Lameness in Irish pigs. Laura Boyle Teagasc Moorepark
 Lameness in Irish pigs Laura Boyle Teagasc Moorepark Introduction o 35% culling rate due to lameness and claw lesions o Lame sows < 3 litters; non-lame sows=3.5 litters o Poor longevity, high replacement
The Environment And Mastitis Control. What If the USA Lost the War in Iraq??? Dr. Andy Johnson. Western Canadian Dairy Conference Red Deer, Alberta
 The Environment And Mastitis Control Western Canadian Dairy Conference Red Deer, Alberta What If the USA Lost the War in Iraq??? Dr. Andy Johnson Total Herd Management Services, Inc Clintonville, Wisconsin
Pre-fresh Heifers. A Might not Equal B. Pre-fresh Heifers Common A = B allegories. Udder edema = dietary salt. Transition (pre-fresh) = 21 d
 = 21 d") Pre-fresh Heifers A Might not Equal B Pre-fresh Heifers Common A = B allegories Udder edema = dietary salt Transition (pre-fresh) = 21 d Over-conditioned pre-fresh heifers = excess corn silage Early calving
Pre-fresh Heifers A Might not Equal B Pre-fresh Heifers Common A = B allegories Udder edema = dietary salt Transition (pre-fresh) = 21 d Over-conditioned pre-fresh heifers = excess corn silage Early calving
Ren Tip # 84 11/6/15
 Ren Tip # 84 11/6/15 Biosecurity on Farm (adapted from Penn State University Extension Webinar) When you thin Biosecurity, you think of preventing disease outbreak on your farm and stopping outbreaks if
Mastitis Reminders and Resources LAURA SIEGLE EXTENSION AGENT VIRGINIA COOPERATIVE EXTENSION AMELIA COUNTY
 Mastitis Reminders and Resources LAURA SIEGLE EXTENSION AGENT VIRGINIA COOPERATIVE EXTENSION AMELIA COUNTY 4 year old cow (just freshened) comes in with clinical mastitis symptoms. What do you do next?
The Heifer Facility Puzzle: The New Puzzle Pieces
 The Heifer Facility Puzzle: The New Puzzle Pieces Joe Harner Biological and Agricultural Engineering Kansas State University Manhattan, KS jharner@ksu.edu / 785.532.2900 Dan McFarland Sr Extension Educator
MATERIALS AND METHODS
 Effects of Feeding OmniGen-AF Beginning 6 Days Prior to Dry-Off on Mastitis Prevalence and Somatic Cell Counts in a Herd Experiencing Major Health Issues S. C. Nickerson 1, F. M. Kautz 1, L. O. Ely 1,
Salmonella Dublin: Clinical Challenges and Control
 Salmonella Dublin: Clinical Challenges and Control Simon Peek BVSc, MRCVS PhD, DACVIM, University of Wisconsin-Madison School of Veterinary Medicine Advancing animal and human health with science and compassion
Reference Manual & Workbook JULY 2018
 Reference Manual & Workbook JULY 2018 TABLE OF CONTENTS TABLE OF CONTENTS... 1 INTRODUCTION... 2 REFERENCE MANUAL AND WORKBOOK... 3 INDEX... 3 FARMER SELF-EVALUATION QUESTIONNAIRE... 4 CATTLE HEALTH MANGEMENT...
Suckler cow management. Dai Grove-White.
 Suckler cow management. Dai Grove-White. Where is suckler beef going? Biological efficiency Suckler VS dairy beef Carbon foot-printing & land use Poorer quality land Mass-market or niche market Output
DeLaval Cell Counter ICC User Strategies Guide
 Introduction 1. Bulk Tank Sampling Somatic cell count is one of the key indicators of udder health and has a major impact on milk production and farm costs. The DeLaval ICC mobile device allows for somatic
General Prevention Practices for Beef and dairy Producers
 for Beef and dairy Producers Minimizing or preventing disease entry and spread on farms is the goal of an effective Biological Risk Management plan. To accomplish this, there are several general management
Charmany Dairy Herd Newsletter Oct. 8 th Oct. 14 th
 Daily Events Monday: Palpation Laboratory-3 rd year students Tuesday: Am 4 th year Theriogenology Rotation Herd Check Dr. Momont & 4 th yr. Students Tail bleeding opportunity-need blood for Chuck C. s
Actions and Outcomes of Wisconsin Dairy Farms Completing Milk Quality Teams
 J. Dairy Sci. 88:2672 2680 American Dairy Science Association, 2005. Actions and Outcomes of Wisconsin Dairy Farms Completing Milk Quality Teams A. C. O. Rodrigues and P. L. Ruegg Department of Dairy Science,
Balancing Dairy Business and Animal Welfare. Franklyn Garry
 Balancing Dairy Business and Animal Welfare Franklyn Garry The Dairy Efficiency Story 1955 2005 Cow # s: 21.5 million 9.04 Milk /cow: 5,900 lbs 19,576 Tot Milk/Yr 120.1 billn lbs 176.9 25,000
GENERAL PREVENTION PRACTICES CHECKLIST FOR BEEF AND DAIRY PRODUCERS
 FOR BEEF AND DAIRY PRODUCERS General Precautionary Measure Y N Do you require that all individuals wash hands with soap and warm water before AND after animal contact? Farm Entrance and Perimeter Y N Do
LOCOMOTION SCORING OF DAIRY CATTLE DC - 300
 LOCOMOTION SCORING OF DAIRY CATTLE 2001 DC - 300 LOCOMOTION SCORING CONDITIONS Location: Researchers: Animals: Duration: Commercial Dairy in Michigan D.J. Sprecher, DVM, MS, DACT D.E. Hostetler, DVM, MS
Validation, use and interpretation of health data: an epidemiologist s perspective
 Validation, use and interpretation of health data: an epidemiologist s perspective D.F. Kelton 1 & K. Hand 2 1 Department of Population Medicine, University of Guelph, Guelph, Ontario, Canada, N1G 2W1
Consequences of Recorded and Unrecorded Transition Disease
 Consequences of Recorded and Unrecorded Transition Disease Michael Overton, DVM, MPVM Elanco Knowledge Solutions Dairy moverton@elanco.com Dairy Profitability Simplified: (Milk Price Cost of Production)*Volume
Milk Quality Evaluation Tools for Dairy Farmers
 AS-1131 Mastitis Control Programs Milk Quality Evaluation Tools for Dairy Farmers P J. W. Schroeder, Extension Dairy Specialist roducers have a variety of informational tools available to monitor both
Animal Health and You
 Animal Health and You Jess Spatz Shelgren DVM In Calf Advisor, Intelact Consultant, Mastitis Support Advisor Trust me, I am a Vet and I am here to help you... Making the most of your vet in a low payout
DEVELOPMENT, IMPLEMENTATION AND ASSESSMENT OF PERFORMANCE STANDARDS Agricultural Species
 DEVELOPMENT, IMPLEMENTATION AND ASSESSMENT OF PERFORMANCE STANDARDS Agricultural Species Bart Carter DVM DACLAM University of Texas Southwestern Medical Center About me DVM from University of Missouri
Manual & Workbook MARCH 2018
 Manual & Workbook MARCH 2018 TABLE OF CONTENTS INTRODUCTION... 2 REFERENCE MANUAL... 2 WORKBOOK... 3 INDEX... 3 FARMER SELF-EVALUATION QUESTIONNAIRE... 4 BIOSECURITY... 5 CATTLE ADDITIONS AND MOVEMENT...
Barry County 4-H Senior Dairy Project Record Book Ages 15-19
 Barry County 4-H Senior Dairy Project Record Book Ages 15-19 Members Name: Age Address: Club Name: Leaders Name: 1 March 2009 Please Note: Records must be kept on EACH animal exhibited at the fair. All
DISEASE MONITORING AND EXTENSION SYSTEM FOR THE SOUTH AFRICAN DAIRY INDUSTRY
 DISEASE MONITORING AND EXTENSION SYSTEM FOR THE SOUTH AFRICAN DAIRY INDUSTRY Disease Trend Report: July 2014 IN THIS ISSUE: 1. Preface Importance of disease monitoring. 2. Get the vaccination plan in place
A New Index for Mastitis Resistance
 A New Index for Mastitis Resistance F. Miglior, * A. Koeck, * G. Kistemaker and B.J. Van Doormaal * Centre for Genetic Improvement of Livestock, University of Guelph Canadian Dairy Network Guelph, Ontario,
Mastitis Reports in Dairy Comp 305
 Mastitis Reports in Dairy Comp 305 There are a number of reports and graphs related to Mastitis and Milk Quality in Dairy Comp under the Mast heading. Understanding the Reports This section will discuss
The mastitis situation in Canada where do you stand?
 The mastitis situation in Canada where do you stand? Richard Olde Riekerink and Herman Barkema 1 Québec City December 11, 2007 Mastitis Most expensive disease on a dairy farm discarded milk, treatment,
WHY DO DAIRY COWS HAVE REPRODUCTIVE PROBLEMS? HOW CAN WE SOLVE THOSE REPRODUCTIVE PROBLEMS? Jenks S. Britt, DVM 1. Why Manage Reproduction?
 WHY DO DAIRY COWS HAVE REPRODUCTIVE PROBLEMS? HOW CAN WE SOLVE THOSE REPRODUCTIVE PROBLEMS? Jenks S. Britt, DVM 1 Why Manage Reproduction? The following table gives reproductive information from the DHIA
GENERAL PREVENTION PRACTICES CHECKLIST FOR SHEEP AND GOAT PRODUCERS
 FOR SHEEP AND GOAT PRODUCERS General Precautionary Measure Y N Do you require that all individuals wash hands with soap and warm water before AND after animal contact? Farm Entrance and Perimeter Y N Do
Milk quality & mastitis - troubleshooting, control program
 Milk quality & mastitis - troubleshooting, control program Jim Reynolds, DVM, MPVM University of California, Davis Tulare Veterinary Medicine Teaching and Research Center 18830 Road 112 Tulare, CA 93274
Rumination Monitoring White Paper
 Rumination Monitoring White Paper Introduction to Rumination Monitoring Summary Rumination is a proven direct indicator of cow wellbeing and health. Dairy producers, veterinarians and nutritionists have
Genetic and Genomic Evaluation of Mastitis Resistance in Canada
 Genetic and Genomic Evaluation of Mastitis Resistance in Canada J. Jamrozik 1, A. Koeck 1, F. Miglior 2,3, G.J. Kistemaker 3, F.S. Schenkel 1, D.F. Kelton 4 and B.J. Van Doormaal 3 1 Centre for Genetic
Rural Electric Power Services (REPS) Program
 Program") Rural Electric Power Services (REPS) Program David Hansen, Dept. of Agriculture, Trade and Consumer Protection Rural Electric Power Services Program (REPS) March 3, 2011 MREC Conference Bloomington MN.
Rural Electric Power Services (REPS) Program David Hansen, Dept. of Agriculture, Trade and Consumer Protection Rural Electric Power Services Program (REPS) March 3, 2011 MREC Conference Bloomington MN.
Selective Dry Cow Therapy
 Selective Dry Cow Therapy Aideen Kennedy, Sinead McParland, Jimmy Flynn, Noel Byrne, Fergal Coughlan, John-Paul Murphy, Shane Leane, Niamh Ryan, Teagasc Farm Staff 5- point plan Mastitis Control: Historically
Index for Mastitis Resistance and Use of BHBA for Evaluation of Health Traits in Canadian Holsteins
 Index for Mastitis Resistance and Use of BHBA for Evaluation of Health Traits in Canadian Holsteins Filippo Miglior 1,2, Astrid Koeck 2, Janusz Jamrozik 1, Flavio Schenkel 2, David Kelton 3, Gerrit Kistemaker
Nordic Cattle Genetic Evaluation a tool for practical breeding with red breeds
 Nordic Cattle Genetic Evaluation a tool for practical breeding with red breeds Gert Pedersen Aamand, Nordic Cattle Genetic Evaluation, Udkaersvej 15, DK-8200 Aarhus N, Denmark e-mail: gap@landscentret.dk
Biosecurity for Dairy Farms: Biosecurity for Dairy Farms: Controlling Access
 Biosecurity for Dairy Farms: Controlling Access Barrett D. Slenning College of Vet Med, NCSU barrett_slenning@ncsu.edu Why & Introduction Seven Steps to Biosecurity How Are We Doing? Be Prepared! Biosecurity
Disease. Treatment decisions. Identify sick cows
 w l $3 $7 $12 $15 $21 $25 Visual observation of estrus cost 1 person 3 h per day at $12.5 per hour of labor Julio Giordano, DVM, MS, PhD Dairy Cattle Biology and Management Laboratory Net Value ($/cow/yr)
Mastitis and On-Farm Milk Cultures - A Field Study - Part 1
 Mastitis and On-Farm Milk Cultures - A Field Study - Part 1 This two-part article discusses the results of a research project undertaken by Dr. Tim Olchowy, Senior Lecturer in Livestock Medicine, School
Cows Heifers Youngstock/ calves Stock bulls Store cattle Finished cattle (sheep) Plan completed by Name: Role on farm
 Plan completed by Name: Role on farm") DAIRY HEALTH PLAN Farm Name Veterinary Practice Details Type and number of Livestock covered by the plan Names of persons who administer medicines Cows Heifers Youngstock/ calves Stock bulls Store cattle
DAIRY HEALTH PLAN Farm Name Veterinary Practice Details Type and number of Livestock covered by the plan Names of persons who administer medicines Cows Heifers Youngstock/ calves Stock bulls Store cattle
South West Fertility Field Day. May 2015
 South West Fertility Field Day May 2015 Introduction Introduce yourself How do you think fertility is going? What are you hoping to get out of today? Aims Why should I collect data? How can I use it to
Dairy Herd Reproductive Records
 Dairy Herd Reproductive Records Steve Eicker, Steve Stewart 2, Paul Rapnicki2 39 Powers Road, King Ferry, NY 308 2 University of Minnesota, St Paul, MN 5508 In trodu ction Reproductive herd health programs
NATURAL BVD VACCINATION THE WAY TO GO?
 NATURAL BVD VACCINATION THE WAY TO GO? Using identified BVD PI (persistently infected) animals as vaccinators has been an accepted way of exposing young stock to BVD infection before their first pregnancy.
Trouble-Shooting a Mastitis Problem Herd 1
 CIRCULAR 1164 Trouble-Shooting a Mastitis Problem Herd 1 David R. Bray and Jan K. Shearer 2 Introduction What is a mastitis problem herd? Any herd that continually has a cell count above 400,000cells/ml
Johne s Disease Control
 Johne s Disease Control D. Owen Rae DVM, MPVM College of Veterinary Medicine UF/IFAS Gainesville, FL Introduction Johne s disease is caused by the bacteria Mycobacterium avium paratuberculosis (MAP). The
THE CHARACTERISTICS OF LAMENESS IN DAIRY COWS
 THE CHARACTERISTICS OF LAMENESS IN DAIRY COWS Gîscă Eugen Dan Cabinet Medical Veterinar Individual, Galaţi, Vânători, România, c_mv@windowslive.com Abstract Lameness is considered one of the most important
Outline MILK QUALITY AND MASTITIS TREATMENTS ON ORGANIC 2/6/12
 MILK QUALITY AND MASTITIS TREATMENTS ON ANIC AND SMALL VENTIONAL DAIRY FARMS Roxann M. Richert* 1, Pamela L. Ruegg 1, Mike J. Gamroth 2, Ynte H. Schukken 3, Kellie M. Cicconi 3, Katie E. Stiglbauer 2 1
8. MILK Udder health and milk quality is important to farm productivity and profitability. Every farm stands to gain from less mastitis.
 8. MILK Udder health and milk quality is important to farm productivity and profitability. Every farm stands to gain from less mastitis. 8. MILK Milk composition Average milk composition (2/25 lactation)
Case Study: Dairy farm reaps benefits from milk analysis technology
 Case Study: Dairy farm reaps benefits from milk analysis technology MARCH PETER AND SHELIA COX became the first dairy farmers in the UK to install a new advanced milk analysis tool. Since installing Herd
Prototheca Mastitis in Dairy Cows
 1 Mastitis Control Program for Prototheca Mastitis in Dairy Cows by John Kirk Veterinary Medicine Extension, School of Veterinary Medicine University of California Davis and Roger Mellenberger Department
How to Decrease the Use of Antibiotics in Udder Health Management
 How to Decrease the Use of Antibiotics in Udder Health Management Jean-Philippe Roy Professor, Bovine ambulatory clinic, Faculté de médecine vétérinaire, Université de Montréal.3200 rue Sicotte, C.P. 5000,