Population dynamics and health status of free-roaming dogs in Bhutan. Karma Rinzin. (BVSc & AH., MVS)
|
|
|
- Roxanne Betty Cook
- 6 years ago
- Views:
Transcription
1 Population dynamics and health status of free-roaming dogs in Bhutan Karma Rinzin (BVSc & AH., MVS) A thesis presented in fulfilment of the requirements for the degree of Doctor of Philosophy College of Veterinary Medicine School of Veterinary and Life Sciences Murdoch University Western Australia (July 2015)
2 Dedication I dedicate this Doctoral Thesis to the most precious people in my life: My wife Pema Chokey AND two lovely children Jigme Zilnon Rinzin & Choing Pelmo Rinzin ii
3 Declaration I declare that this thesis is my own account of my research and contains as its main content work which has not previously been submitted for a degree at any tertiary education institution. Karma Rinzin iii
4 Abstract In 2009 a capture-neuter-vaccinate-release (CNVR) programme commenced in Bhutan to control the dog population and to reduce the number of cases of rabies in humans and other animals. Limited understanding of the community s attitudes towards dog population control and the population dynamics of the free-roaming dog population in Bhutan motivated the study reported in this thesis. Household surveys were undertaken in six Dzongkhags to determine the knowledge, attitudes and practices of the community towards dog population control and to describe the demographics and management of owned dogs. Approximately 90% of the Bhutanese community believed that stray dogs were a problem to society and 77% believed they presented a threat to human health. Most participants (84%) were in favour of dog population control with birth control being the preferred method. A need to develop educational programmes on rabies and the dog population specifically targeting farmers and women from rural areas was identified. The total owned dog population was estimated at 71,245 with 24.4% of the households in the urban areas and 40.8% of the households in rural areas owning dogs. Forty percent of dog owners did not confine their dogs. Based on the number of owned dogs and the ratio of owned to stray dogs presented to the CNVR clinic, the stray dog population was estimated at 48,379. The population characteristics of both owned and stray dogs that were presented to CNVR clinics from 01 July 2011 to 30 June 2013 were described. More than half (53.3%) of the dogs presented to the CNVR clinic were free-roaming dogs, with comparable numbers of males and females presented. Although pregnant bitches were iv
5 seen throughout the year, more pregnancies were observed from September to December. Field population survey undertaken in the main towns of six Dzongkhags to estimate the programme s coverage in January and February 2012 showed overall CNVR coverage of 52% ranging from 32% in Bumthang to 72% in Samdrup Jongkhar. Field population survey was undertaken in Thimphu city to estimate the size of the free-roaming dog population and to assess the health status of dogs. The free-roaming dog population in Thimphu Municipal area was highest in June 2011 at 6,033 (95% CI 5,644 6,430), prior to which there had been no CNVR campaign for 15 months. From July 2011 to September 2014 the free-roaming dog population size remained relatively constant (range 5,765 to 5,949 dogs) as CNVR campaigns were regularly carried out. Neutered dogs had a significantly lower prevalence of antibodies to canine distemper virus (44.2%) and canine parvovirus CPV (4.0%) than entire dogs (52.9 & 18.4%, respectively) (P < 0.01); and neutered dogs had significantly higher body condition scores than entire dogs (P < 0.01). The studies presented in this thesis have demonstrated that the success of a CNVR programme will depend on the initial planning of the programme which includes assessing the size of the local dog population and continuous monitoring and evaluation of the programme. To effectively control the dog population in Bhutan and to address problems associated with free-roaming dogs, it is recommended that: regular CNVR programmes are carried out throughout the country; female dogs, especially during the breeding season, are specifically targeted; programmes are monitored regularly; community participation in programmes is encouraged; and legislation on responsible dog ownership is implemented. v
6 Table of contents Dedication... ii Declaration... iii Abstract... iv Table of contents... vi Conference Presentations (Oral)... xii Poster Presentations... xiii List of Tables... xiv List of Figures... xvi Acknowledgements... xviii Acronyms and Abbreviations... xxii CHAPTER ONE... 1 Introduction Introduction Background information on Bhutan Dogs in Bhutanese society Problems associated with free-roaming dogs in Bhutan Dog population control strategies initiated in Bhutan Killing of dogs Translocation of dogs Impounding of dogs Ad hoc sterilization and vaccination campaigns Project on National Dog Population Management and Rabies Control Programme Revision of the Policy Guidelines for the Prevention and Control of Rabies in Bhutan Aims and Objectives of the current study CHAPTER TWO Literature Review Background Origin of the domestic dog Classification of the dog population Rabies and free-roaming dogs vi
7 2.2.1 Aetiology of the disease Distribution and host range Transmission and pathogenesis Clinical presentation Diagnosis Treatment Prevention and control of rabies in dogs Other problems associated with a free-roaming dog population Zoonotic diseases Dog bites Risks to wildlife Welfare of free-roaming dogs Social nuisance and environment contamination Failure of capture and kill method to control a free-roaming dog population Dog Population Management (DPM) Assessing the local dog population Human attitudes and behaviours Access to resources Policies and Legislation One Health concept Control of reproduction Capture-neuter vaccinate-release (CNVR) programmes CNVR programmes in developing countries Monitoring and evaluation of CNVR programmes Monitoring the size of the dog population Indicator Count Monitoring the interventions of owned dogs Monitoring the number of free-roaming dogs during a CNVR programme Other indirect methods to monitor and evaluate a CNVR programme Estimating the free-roaming dog population Population estimation by total or direct counts Population size estimated from mark-resight surveys Population estimate based on the detection probability Population size estimated from photographic recapture (Beck s method) vii
8 2.9.5 Population size estimated from the capture of permanently marked dogs Conclusions CHAPTER THREE A survey to determine the knowledge, attitude and practices (KAP) of the community towards control of the dog population and rabies in Bhutan Introduction Materials and Methods Study population and sampling Sample size Questionnaire design and administration Data management and analysis Results Demographics of the respondents Knowledge of participants about rabies Attitudes and practices towards stray dogs Attitudes and practices towards the population control of stray dogs Attitudes and perception towards the welfare of the stray dogs Factors associated with community knowledge on rabies and dog population control Factors associated with community attitudes towards control of the dog population and rabies Discussion CHAPTER FOUR The demographic characteristics of dogs presented for the capture-neuter-vaccinate-release (CNVR) programme in Bhutan Introduction Materials and Methods National Dog Population Management and Rabies Control Project Capture-neuter-vaccinate-release (CNVR) data Data Analysis Results Sex ratios Age structure Sterilization status Reproductive parameters viii
9 4.3.5 Health status Discussion CHAPTER FIVE Monitoring and evaluation of a Capture-Neuter-Vaccinate-Release (CNVR) Programme to control Rabies and the Dog Population in Bhutan Introduction Materials and methods Capture-neuter-vaccinate-release (CNVR) programme Population surveys Statistical analyses Results Population surveys CNVR Coverage Proportion of lactating females and puppies Body and skin condition of dogs Discussion CHAPTER SIX Size and demography of the domestic dog population in Bhutan Introduction Materials and Methods Brief description of study area Cross-sectional household survey Estimation of the dog population Proportion of owned dogs that were free-roaming Proportion of free-roaming dogs that were owned Statistical Analyses Results Household characteristics Owned dog demographics and management Size of the owned dog population Number of stray dogs Density of owned and stray dogs Number of owned and free-roaming dogs in Gelephu and Phuentsholing estimated using the Lincoln Petersen Index Discussion ix
10 CHAPTER SEVEN Health status of the free-roaming dogs in Thimphu City Area: Benefits of an Animal Birth Control (ABC) Programme Introduction Materials and Methods Study area Sample size Physical examination and sampling Laboratory tests Statistical analyses Results Demographic characteristics of the study population Prevalence of canine distemper Prevalence of canine parvovirus Seroprevalence to Leptospira Body condition score of the sampled dogs Skin condition scores of dogs Factors associated with the health indices Discussion CHAPTER EIGHT Evaluation and monitoring of capture neuter vaccinate release (CNVR) programmes through regular assessment of the dog population size and factors associated with the abundance of freeroaming dogs in Thimphu City, Bhutan Introduction Materials and methods CNVR programme in Thimphu city Population size estimated from capture of permanently marked (ear-notched) dogs (Method 1) Population size estimated using the Chapman estimate (Method 2) Population size estimated from the detection probability and rapid survey (Method 3) Comparison of the different methods Estimating 95% confidence intervals (CI) for the proportion of ear notched dogs, detection probability and the corresponding population estimates Spatial analysis Results x
11 8.3.1 CNVR programme in Thimphu city Population size based on capture of permanently marked dogs Population size based on the Chapman estimate Population size based on the detection probability and the rapid survey Comparison of population size using different methods Factors associated with abundance of free-roaming dogs Discussion CHAPTER NINE General Discussion Community attitudes and behaviours towards dog population control Population demographics Monitoring and evaluation of the CNVR programmes Limitations of this study Key recommendations Further research Conclusions List of Appendices Appendix 1 Survey questionnaire for the General Public to determine knowledge, attitudes and practices of the community towards rabies and dog population control Appendix 2 Daily CNVR activity recording format Appendix 3 Dog counting forms for the free-roaming dog population surveys References xi
12 Conference Presentations (Oral) Rinzin,K., Robertson, I.D. (2015) National Evaluation of Bhutan s Dog Population Management Control Program. Dog and People: Are we making a difference? Workshop, 16 May 2015, University of Melbourne, Faculty of Veterinary and Agriculture Sciences, Melbourne, Victoria, Australia. Rinzin, K., Robertson, I.D. (2015) Bhutan Case Studies A review and analysis of Dog Population Management and Rabies Control Programme in Bhutan Animal Care Expo, 30 March to 02 April 2015, New Orleans, Louisiana, USA. Rinzin, K., Robertson, I.D., Mahat, H., Pandey, R.K. Dukpa, K., Kumar, N., Raghorthe, S,. Patel, K., K. Patel (2014) Health status of the free-roaming dogs in Bhutan: Benefits of an Animal Birth Control (ABC) Programme. 18 th Federation of Asian Veterinary Association Congress, 28 to 30 November 2014, Singapore. Rinzin, K., Robertson, I.D,. Pandey, R.K., Tshering, Y., and Dahal, N. (2012) Evaluation of capture-neuter-vaccinate-release (CNVR) programme to control rabies and dog population in Bhutan. 13 th International Society for Veterinary Epidemiology and Economics Conference, 20 to 24 August 2012, Maastricht, The Netherlands. Rinzin, K., and Robertson, I.D. (2011) Introductory Seminar on Population dynamics and health status of free-roaming dogs in Bhutan. College of Veterinary and Biological Sciences, Murdoch University, Perth, Western Australia. xii
13 Poster Presentations Rinzin, K., Robertson, I.D., Mahat, H., Pandey, R.K. Dukpa, K., Kumar, N., Raghorthe, S,. Patel, K., K. Patel (2014). The demographic characteristics of dogs presented for the capture-neuter-vaccinate-release (CNVR) program in Bhutan. 18 th Federation of Asian Veterinary Association Congress 2014, 28 to 30 November 2014, Singapore. Rinzin, K., and Robertson, I.D. (2014) Health status of the free-roaming dogs in Bhutan: Benefits of an Animal Birth Control (ABC) Programme. Annual Poster Day for year School of Veterinary and Life Sciences, Murdoch University Rinzin, K., and Robertson, I.D. (2013) Demographics of dog population presented for the capture-neuter-vaccinate-release (CNVR) programme in Bhutan. Annual Poster Day for year School of Veterinary and Life Sciences, Murdoch University. Rinzin, K., and Robertson, I.D., Mahat, H., and Dukpa, K. (2013) Evaluation of capture-neuter-vaccinate-release (CNVR) programme to control rabies and dog population in Bhutan. Humane Society United States (HSUS) Animal Care Expo2013, Nashville, USA. Rinzin, K., and Robertson, I.D. (2012) Evaluation of capture-neuter-vaccinate-release (CNVR) programme to control rabies and dog population in Bhutan. Annual Poster Day for year School of Veterinary and Biological Sciences, Murdoch University. xiii
14 List of Tables Table 2.1 Surgical methods available for the control of reproduction in male and female dogs Table 2.2 Current chemical contraception and sterilization products available and undergoing trials Table 2.3 Selected capture neuter vaccinate release (CNVR) programmes in developing countries Table 2.4 Methods to estimate the number of owned dogs Table 2.5 Methods used for estimating the free-roaming dog population Table 3.1 Characteristics of the household respondents interviewed in the urban and rural areas of Bhutan in 2012 (n = 521) Table 3.2 Assessment of the knowledge on rabies and dog population control in Bhutan Table 3.3 Assessment of the public attitudes towards dog population control in Bhutan Table 3.4 Descriptive data and bivariate χ² analysis of responses to questions relating to rabies and its control for the respondents living in rural and urban areas of Bhutan (n = 521) Table 3.5 Descriptive data and bivariate χ² analysis of the response to questions relating to various problems caused by the stray dogs for the respondents living in rural and urban areas of Bhutan (n = 521) Table 3.6 Descriptive data and bivariate χ² analyses of the response to questions relating to the control of stray dog population for the respondents living in rural and urban areas of Bhutan (n = 521) Table 3.7 Descriptive data and bivariable χ² analyses of the response to questions relating to the welfare of stray dogs for the respondents living in rural and urban areas of Bhutan (n = 521) Table 3.8 Association of demographic and socio-demographic variables with categorized knowledge scores of rabies and dog population control in Bhutan Table 3.9 Association of demographic and socio-demographic variables with categorized attitude scores of rabies and dog population control in Bhutan Table 3.10 Final multivariable logistic regression model of factors associated with community knowledge of rabies and dog population control in Bhutan Table 3.11 Final multivariable logistic regression model of factors associated with community attitude of rabies and dog population control in Bhutan Table 4.1 Characteristics of dogs presented at the capture-neuter-vaccinate-release (CNVR) clinic from 01 July 2011 to 30 June Table 4.2 Risk factors associated with occurrence of various diseases in those dogs presented to CNVR Clinics Table 5.1 Percentage and odds ratio of the free-roaming dogs sterilized and vaccinated in the main towns of the selected Dzongkhags Table 5.2 Number and percentage of lactating bitches and puppies counted in the main towns of the six selected Dzongkhags xiv
15 Table 6.1 Vital statistics (with 95% CI) of dog ownership in rural and urban areas Table 6.2 Demographic characteristics of owned dogs obtained from household surveys in urban and rural areas of Bhutan (n = 590, Urban = 237, Rural = 353) Table 6.3 The management practices for dogs adopted by households in urban (n = 175) and rural areas (n = 238) of Bhutan Table 6.4 Estimated number of owned dogs in different Dzongkhags of Bhutan Table 6.5 Estimation of the number of owned in each Dzongkhag (urban and rural) of Bhutan Table 6.6 Estimation of the number of stray dogs in different Dzongkhags in Bhutan (urban and rural) Table 6. 7 Dzongkhag wise density of owned and stray dogs in Bhutan Table 6.8 Estimates of the number of owned and free-roaming dogs in Gelephu and Phuentsholing town using the Lincoln-Petersen index, estimate of roaming owned dog population size and the proportion of owned dogs that are roaming and proportion of roaming dogs that are owned Table 7.1 Descriptive data for demographic characteristics and neuter status of the dogs Table 7.2 Seroprevalence of antibodies to canine distemper virus (CDV) in intact and neutered dogs in Thimphu, Bhutan based on the Immunocomb IgM Antibody Test Table 7.3 Seroprevalence of antibodies to canine parvovirus (CPV) in intact and neutered dogs in Thimphu, Bhutan based on the Immunocomb IgM Antibody Test Table 7.4 Descriptive data and analyses of population characteristics of the dogs associated with body condition score Table 7.5 Descriptive data and analyses of population characteristics of the dogs and their association with the skin condition score Table 7.6 Multivariable logistic regression model of factors associated with the prevalence of the canine distemper virus (CDV) and canine parvovirus (CPV) Table 7.7 Multivariable logistic regression model of factors associated with the body and skin condition scores Table 8.1 Number of dogs sterilized and vaccinated during the CNVR campaigns and the total number of ear notched free-roaming dogs estimated based on the annual survival rates at different time Table 8.2 Free-roaming dog population estimated based on surviving notched dogs and the percentage of notched dogs observed during the survey (June 2009 to September 2014) Table 8.3 Estimate of the population of free-roaming dogs in Thimphu using the modified Lincoln Petersen index (Chapman method) in May Table 8.4 Mark-resight experiment using the Lincoln-Petersen index to estimate the recapture probability (August 2013) Table 8.5 Population estimates based on rapid surveys and detection probability in eight wards (August 2013) xv
16 List of Figures Figure 1.1 Map showing the location of Bhutan in South Asia and Dzongkhag map of Bhutan Figure 1.2 Number of dogs vaccinated against rabies and sterilized in Bhutan from 1998 to 2008 (NCAH, 2009) Figure 1.3 Performance of animal birth control (ABC) programme by the officials of Department of Livestock from 2003 onwards Figure 2.1 Sub-populations of the total dog population and the potential movement of dogs between groups (ICAMC, 2007) Figure 3.1 A Dzongkhag map of Bhutan. The red dots indicate the study areas Figure 4.1 Activities during the capture neuter vaccinate release (CNVR) programme in Bhutan Figure 4.2 Number of animals (dogs and cats) presented to the CNVR Clinic from February 2009 to June Figure 4.3 A Dzongkhag map of Bhutan showing the total number of dogs vaccinated and sterilized (displayed as proportional to size circles) from February 2009 to June 2013 (n = 48,051) Figure 4.4 Comparison of the owned dog population (2012 census) and the number of owned dogs neutered and vaccinated (up to June 2013) in different Dzongkhags in Bhutan Figure 4.5 Monthly pattern of female dogs neutered and proportion of pregnant bitches observed when spayed during the CNVR programme in Bhutan from July 2011 to June Figure 5. 1 Body condition score card of dogs Figure 5. 2 Skin condition score card of dogs Figure 5. 3 Proportion of dogs in the five body condition categories in notched and unnotched dogs (n = 1,835) Figure 5. 4 Proportion of dogs with different skin condition categories in Thimphu (n = 1,835) Figure 6. 1 The density of dogs (per km 2 ) in different Dzongkhags (a) Owned dogs (b) Stray dogs Figure 8.1 Google maps of Thimphu city with the ward boundaries for the mark-resight experiment (blue) and rapid surveys (red) Figure 8.2 Rubbish bins in Thimphu with some dogs exploring for edible materials Figure 8.3 Meat shop in Thimphu demonstrating a high level of sanitation Figure 8.4 The proportion of the ear-notched free-roaming dogs in each of the Tshogdeys as a proportion of the total sighted dogs during the field survey (June 2009 to September 2014) Figure 8.5 Estimated number of surviving ear-notched dogs, the total free-roaming dog population and the percentage of ear-notched dogs out of all total sighted dogs (June 2009 September 2014) Figure 8.6 Map of Thimphu Municipal area (a) Image plot showing the free-roaming dog population density (number of dogs per km 2 ) with the road networks superimposed xvi
17 on this plot (b) Image plot showing the intensity of buildings expressed as number of buildings per km Figure 8.7 Image plot showing the free-roaming dog population density (number of dogs per km 2 ) in Thimphu Municipal area. Superimposed on this plot are (a) point locations of rubbish bins (yellow) and Temples (White) and (b) Meat shops (Red) and Military camps (Blue) Figure 8.8 Rhohat plot showing the density of dog sight points as a function of Euclidean distance from (a) meat shops, (b) rubbish bins, (c) military camps, (d) temples (e) buildings and (f) road networks xvii
18 Acknowledgements This thesis would not have been completed without the support of many people and institutions. First and foremost, I would like to extend my deepest gratitude to my Supervisor Professor Ian Robertson for his constant guidance, encouragement, timely feedback and understanding over these past four years. Without his assistance and dedicated involvement in every step throughout the process, this thesis would have never been accomplished. I would like to thank Dr. Lex Hiby for sharing some of his reports relating to population estimation of free-roaming dogs in the developing countries as well as for customizing the permanent mark survival programme to estimate the annual survival rate of earnotched free-roaming dogs (Chapter 8). I owe my gratitude to Dr. John Boone for his insights into the detection probability that can be also used for estimating the freeroaming dogs. My thanks go to Professor Mark Stevenson for helping me with the r codes for rhohat analysis which was useful to determine the association between the free-roaming dog density and the spatial risk factors. My sincere appreciation goes to the staff of National Dog Population Management and Rabies Control Project, particularly Drs. Hiruka Mahat, Rajesh Kumar Pandey, Satish Raghorthe, Keyur Patel, Shrikant Verma, Sonam Pelden, Nima, Niraj Kumar, Yaswant Sawant and others for maintaining the excellent CNVR record, as well as for providing me with information as and when I required it. They also extended their support during my field work to carry out the dog population survey as well as during the sample collection from both neutered and sexually entire dogs. xviii
19 I am highly grateful to those staff from the six Dzongkhags who helped me to carry out the KAP survey (Chapter 3) and dog population survey (Chapter 5) viz. Bumthang (Tshering Penjore, Dr. Jambay Dorji, Kezang Lhaden, D.B. Gurung, Phurba Namgay, Phurpa Thinley, Pema Wangchuk, Kezang Jaytsho, Pema Chophel, Chhophel Dawa and Tawa Gyeltshen); Samtse (Thonkey Dukpa, Dr. Karma Wangmo, Thinley Dorji, Dadiram Sharma, Baiman Rai, Lachi, Sanyasi, Khemnath, Sonam Dorji, Lhawang Dhendup, M.K. Subba, Kinley Sithub, Dawa Tshering and Lungten Dorji), Samdrupjongkhar (Kinga Dechen, Tenzin Penjore, Tshering Choden, Chado, Dr. Lungten, Karma Wangchuk, K.P. Sharma, Phuntsho Dema, Yeshi Wangpo, Singye Norbu and Wangchen); Trashigang (Dorji Dukpa, Dorji Wangchuk, Rinzin Dorji, Tandin Wangchuk, Amber Gurung, P.P. Gajmer,Pema Khandu, Dhendup and Aitaram Uraon); Trashigang (Norbu, Phurba Tshering, C.B Monger, Leki Dorji, Pema Gyeltshen, Nima Tshering, Sheda Wangchuk, Gyembo Tsheten, ThrinangWangdi, Namgay Dorji); and Thimphu (Sherab Dema, Chimi Wangmo, Chador Wangmo, Sangay Wangmo, Dawa Gyeltshen, Chencho). I am also grateful to those staff from NCAH (Tshering Dema Tamang, Sonam Wangmo, Pasang Biddha, Purna Rai, Purnamata, Tshewang Dema, Kezang Lhamo, Migmar, Dawa Tshering, Yeshi Tshering), who were involved in recording the point locations of dogs using GPS devices, as well as for scoring the body and skin conditions of the free-roaming dogs in Thimphu and assisting with the KAP and population surveys in Thimphu Municipal area. My gratitude goes to those colleagues who helped me with the sample collection (Kesang Lhamo, Tenzinla, Sangay Lhamo, Pema Tshomo, Migmar, Pema Wangdi and Tashi Galey) and for carrying out the laboratory tests of the sera samples (Mr. Sangay Tenzin, Kesang Lhamo and Tshewang Dema). I would also like to thank Dr. Tenzin for coordinating and leading the household survey xix
20 carried out in Gelephu and Phuentshoing in 2012 (Chapter 6). My special thanks goes to Mr. Yeshey Tshering for his valuable assistance throughout my field work, as well as for accompanying me to several Dzongkhags during my field work. I am very grateful to Endeavour Awards Programme for funding my studies at Murdoch University. Thanks to my Case Managers from Scope Global (Ben Mattson, Vanessa Wright and Ammelline Balang) for rendering required support and facilitating my scholarship for the last four years. Thanks also goes to Murdoch University and Humane Society International for funding my attendance at numerous international conferences and workshops which gave me an opportunity to interact with many experts working in my area of research as well as for getting the critical feedback from the international participants. I would also like to thank the Secretary of Ministry of Agriculture and Forests, Dasho Tenzin Dhendup, the then Director General of Department of Livestock, for allowing and supporting me to undertake this studies. Thanks also goes to the present Director General of Department of Livestock, Dr. Tashi Samdrup, for his support for my PhD programme. My sincere appreciation goes to Programme Director of National Centre for Animal Health (Dr Narapati Dahal - April 2011 to March 2013 and Dr. Kinzang Dukpa April 2013 to current date) for facilitating my field and laboratory works in Bhutan. My four years of stay in Perth would not have been smooth without the support of my Bhutanese and Australian friends. Thanks to Tsheten Dorji, Hotem Dukpa, Dr. Karma Nidup, Tshering Lham, Sonam Tashi, Nuri, Dr. Ian Percy, Jo, Simon Teoh, Sangay Tenzin, Choni, Major Chimi Dorji, Aum Kinley Yangzom, Ugyen penjore (Bap), Lop Kinley Tshering, Dr. Jamba Gyeltshen, Am Kunzang Choden, Kadola, Rinzin, Tshering xx
21 Tashi, Kiba, Rinzin Wangchuk, Dema, Major Ngawang Dorji, Aum Tashi Lhamo, Sangay Dorji, Thsering Wangmo, Tashi Delek, Major Karma Rinzin, Pema Choejey, Dasho Pasang Thinley, Pasang Rigsel, Dorji Dema, Tashi Phuntsho, Karma Wangmo and many others for the wonderful company. Thanks to the trailer trash colleagues: Ernest Mochankana (Botswana), Abdirahman Salah (Somaliland), Zen Jiangyong (China), Chih-Hsien Lin (Taiwan), Petrus Malu Bulu (Indonesia), Chang Cai (China), Sivapiragasam Thaya (Malaysia), Elvina Lee (Singapore), Sharie Aviso (Philippines) and Harish Tiwari (India) for their camaraderie. I am thankful to my mother (Pema Chokey), father (Sonam) and mother in-law (Jampel Zangmo) and other relatives and friends for their encouragement and for bearing with our absence this long. My deep gratitude to my two brothers Nima, Dawa and Tshering Wangchuk for taking care of old parents during my absence. Also thanks to my sister in-law (Dorji Dema) for coming all the way from Bhutan to help my wife to look after my children while I was away for my field work in Bhutan. Finally, I would like to thank my dear wife Pema Chokey, my son Jigme Zilnon Rinzin and my daughter Choing Pelmo Rinzin for accompanying me to Australia and for their patience, encouragement, support and love during this time. I acknowledge the selfless effort made by Pema in taking excellent care of my children while I was engrossed with my research work. xxi
22 Acronyms and Abbreviations ABC ACC&D AVMA BCC BCS CDV CPV CI CNVR DOL DPM Dzongkhag FAO FAT Free-roaming dogs Animal Birth Control Alliance for the Contraception of Dogs and Cats American Veterinary and Medical Association Behaviour change communication Body condition score Canine distemper virus Canine parvovirus Confidence interval Capture neuter vaccinate release Department of Livestock Dog Population Management Local name for district in Bhutan Food and Agriculture Organizations Florescence Antibody Technique Those dogs found in public places. This term is used interchangeably with free-ranging, stray or street dogs. GNH GNHC Geog HIS HSI ICAMC KAP MAPT Gross National Happiness Gross National Happiness Commission Local name for sub-district in Bhutan Help in Suffering Humane Society International International Companion Animal Management Coalition Knowledge attitude and practices Marwar Animal Protection Trust xxii
23 M & E NAH NCAH NDPM & RCP Monitoring and Evaluation National Animal Hospital National Centre for Animal Health National Dog Population Management and Rabies Control Programme NSB OIE National Statistical Bureau World Organization for Animal Health (Office International des Epizooties) OR PET PEP RGOB RICT RSPCA SARAH SCS SD TCB TVT UNDP USA VBB WHO WSPA Odds Ratio Post exposure treatment Post exposure prophylaxis Royal Government of Bhutan Rapid Immunochromatographic Test Royal Society for Protection and Care of Animals Sikkim Anti-Rabies and Health Programme Skin condition score Standard deviation Tourism Council of Bhutan Transmissible-venereal-tumour United Nation Development Programme United States of America Vets Beyond Border World Health Organization World Society for Protection of Animals xxiii
24 CHAPTER ONE Introduction 1.1 Introduction Dogs were the first species to be domesticated approximately 14,000 to 15,000 years ago from wolves (Clutton-Brock, 1995; Morey, 2006; Savolainen, 2007) or perhaps 100,000 years based on recent genetic fossils and DNA evidence (Savolainen et al., 2002; Savolainen, 2006; Galibert et al., 2011) Since then people have been intimately involved with domesticated dogs through their use as pets and companions, for hunting, guard dogs, draught animals, or for commercial purposes (Coppinger & Schneider, 1995; Stafford, 2006). Dogs now also undertake a wide range of specialized work including the detection of illegal goods, tracking criminals, search and rescue work and in sporting activities (Murray & Penridge, 1992; Stafford, 2006). Dogs play an important role in society, enhancing the psychological and physiological well-being of many people (Blackshaw 1996; DiSalvo et al. 2005). Some studies have also suggested that keeping pets can be associated with a higher level of self esteem in children (Paul & Serpell 1996). Although domesticated dogs offer significant advantages to the general community, unwanted, wild or free-roaming dogs can be a problem to the general public. For the purpose of this thesis free-roaming dogs are defined as those dogs found in public places, irrespective of the level of care and supervision imposed upon them. This term encompasses both owned and unowned dogs that are not currently under direct control or are not restricted by physical barriers. Therefore owned dogs are categorized into owned supervised or owned confined and owned non-supervised or non-confined which is clearly illustrated in Section (Figure 2.1). Those dogs that do not have an owner are termed as stray dogs. All the stray 1
25 dogs fall under the free-roaming category while only those dogs thought to be owned but found roaming in public places are considered as free-roaming dogs. A free-roaming dog population can rapidly increase in size due to a high reproductive potential resulting in a hazard to animals, humans and the environment. A diverse range of zoonotic infections, including parasitic, bacterial, viral, protozoal and fungal diseases, can be transmitted from dogs to humans (Robertson & Thompson, 2002; Schlundt et al., 2004). The majority of cases of rabies in humans are acquired from free-roaming dogs (Childs et al., 1998; Matter et al., 2000; Hemachudha, 2005; Zinsstag et al., 2011), resulting in more than 59,000 deaths per year, with the highest risk of rabies in the poorest region of the world (Hampson et al., 2015). Dog bites in humans are a serious public health problem and have been well documented worldwide (Bernardo et al., 2002; Feldman et al., 2004; Gilchrist et al., 2008; Brooks et al., 2010; Cornelissen & Hopster, 2010; Hossain et al., 2013). The impact of free-roaming dogs on the spread of rabies and infectious diseases to wildlife is also of significant concern (Butler et al., 2003; Manor & Saltz, 2003; Cleaveland et al., 2007). Bhutan has a large population of free-roaming dogs which has been a concern for the general public, including tourists. Rabies is still endemic in the southern part of Bhutan and free-roaming dogs have been implicated as the main source of rabies in the country (Tenzin. et al., 2010; Tenzin et al., 2011a; Tenzin et al., 2011c). As a result the Government of Bhutan assigned a high priority for the control of rabies and the dog population in Bhutan. Since October 2009 the Bhutanese Department of Livestock and the Humane Society International (HSI) have worked together on a long term National Dog Population 2
26 Management and Rabies Control Project, centred around a capture-neuter-vaccinate-release (CNVR) program. Several initiatives to control the dog population have been made by international organisations such as the World Organisation for Animal Health (OIE), Food and Agriculture Organisation (FAO) and the World Health Organisation (WHO); animal welfare organizations including the World Animal Protection, the World Society for Protection of Animals (WSPA), HSI and Vets Beyond Borders (VBB); and national authorities (WHO, 2004; WHO et al., 2004; ICAMC, 2007; OIE, 2010; FAO, 2014). The guidelines developed by these organizations have mainly focused on: habitat control (food, shelter, water and human attitudes and behaviour); legislative measures (responsible dog ownership); reproduction control (animal birth control); and involvement of multiple stakeholders. The guidelines also recommend that before embarking on any dog population management program, it is important to fully understand and objectively measure the dynamics of the dog population. Regular monitoring and evaluation of a CNVR programme is necessary to measure the impact on the control of rabies and the dog population. This approach ensures that the final management programme will be tailored to the characteristics of the local dog population, rather than using a single blanket intervention for all dogs or in all situations. 1.2 Background information on Bhutan The Kingdom of Bhutan is a landlocked nation in the eastern Himalayas, bordering China to the north and India to the south (Figure 1.1). With a total area of 38,394 km 2 and an aerial distance of 350 km from east to west and 150 km from north to south, Bhutan lies between 88 o 45 and 92 o longitude East and 26 o 42 and 28 o 15 latitude North (NSB, 3
27 2011). Bhutan is predominantly a mountainous country with diverse topography with altitudes ranging from 100 metres above sea level in the south to 7,500 metres above sea level in the north. There is free cross-border movement of people and animals with the neighbouring states of India in the south, while permanently snow capped mountains act as natural barriers to animal and human movement in the north. The population of approximately 700,000 people, living in close harmony with nature, have evolved a unique identity derived mainly from a rich religious and cultural heritage (Wangchhuk, 2010). The population is largely rural with approximately 70% of people living in villages and being mainly dependent on agriculture for their livelihood. The country is divided into 20 administrative units called Dzongkhags (districts) which are further subdivided into 205 Geogs (sub-districts) (NSB, 2011). Each Geog is comprised of several villages. Vajrayana Buddhism is the dominant faith in Bhutan and has shaped the nation s history and plays a vital part in the lives of its people (Wangchhuk, 2010). 4
28 Figure 1.1 Map showing the location of Bhutan in South Asia and Dzongkhag map of Bhutan. In the last few decades Bhutan has experienced unprecedented historical and political changes. Bhutan became a democratic country in 2008 through the personal initiative of the king after 100 years of monarchy (Wangchhuk, 2010). Over the years Bhutan has cultivated a unique approach to development with its national policy anchored on the principle of Gross National Happiness (GNH) which was promulgated as the country s philosophy of economic and social development (GNHC, 1999,2013). Bhutan believes that the holistic development of the individual and society can be achieved only through a sustainable 5
29 balance between the economic, social, emotional, spiritual and cultural needs of the people. The Government of Bhutan implemented these policies through strict adherence to the four pillars of GNH: equitable and sustainable socio-economic development; preservation and promotion of its culture; conservation of the environment; and promotion of good governance. Guided by this policy the country has developed rapidly over a short period of time with achievements coming with minimal impact on its culture and environment. 1.3 Dogs in Bhutanese society According to data provided by the Department of Livestock the total dog population in Bhutan is approximately 50,000, of which 32,000 are owned (DOL, 2006; DOL/HSI, 2009). This number is likely to be an underestimate of the total population of dogs, as the free-roaming population in the Thimphu city area alone was been estimated at 5,500 in 2009 (Rinzin, 2009). Dogs are culturally and socially accepted by the Bhutanese community. Although most Bhutanese don t own specific dogs, they do feed them and consider them a friendly presence. This may be associated with the Buddhist belief that people can be reborn as animals, and feeding animals (in this case dogs) can earn good karma (Rinpoche 1993; Anonymous, 2012a; Knierim, 2012). It is also believed that in the usual cycle of rebirths, a dog is closest to attaining human status, and normally a dog s next life would be a human life (Choden, 2006). It is because of this reason a large number of free-roaming dogs are seen in Bhutan. Although Kinzang s Choden book Dawa: The Story of a Stray Dog in Bhutan is a fictional novel, it epitomizes the Bhutanese societal value and importance of dogs to the culture. The author made several local references with real places and beliefs in the book which provides a good understanding about the socio-cultural aspects of Bhutan which helps make Dawa a realistic character. 6
30 In rural places in Bhutan owned dogs are used for guarding crops from wild animals and herding the livestock, while in urban areas dogs are mainly kept as pets and for guarding premises. Recently more people are keeping dogs as pets in the urban areas, as is evident from the registration records maintained at the National Animal Hospital (NAH), Chubachu, Thimphu and other Animal Health Facilities. The NAH, Chubachu registered 4,257 dogs from 2007 to 2011 in the Thimphu Municipal area (NAH, 2012). Of the total owned dogs 1,526 (36%) were foreign breeds (24 different breeds) with Alsatian being the most common of these in Thimphu. The local breeds registered in the Thimphu Municipal area were Lhasa Apso (729), Jobchi (Tibetan Mastiff) (617), Damtsi (414) and other local breeds (971). The free-roaming dogs are mainly seen in the urban areas. Although most of these dogs are not owned, many of them have a household from where they get their food, however very few people actually adopt stray dogs from the streets as pets. 1.4 Problems associated with free-roaming dogs in Bhutan In Bhutan rabies is endemic in the southern Dzongkhags that border India. Domestic dogs are the main reservoir of rabies and are responsible for spill-over infection to other domestic species, especially cattle (Rinzin et al., 2006; Tenzin et al., 2010; Tenzin et al., 2011a; Tenzin et al., 2011c). From 1996 to 2009 a total of 814 cases of rabies were reported in domestic livestock species, of which cattle and dogs accounted for 55 and 39% of the cases, respectively (Tenzin et al., 2011c). Sporadic human deaths have also been reported from the rabies endemic areas. From 2006 to 2011 a total of 18 human deaths from rabies (3 in 2006, 2 in 2007, 3 in 2008, 4 in 2009, 1 in 2010 and 5 in 2011) was reported. An excess of dogs also has implications on the occurrence of other zoonotic infections due to contamination of the environment with faeces. Eggs of Echinococcus and Toxocara spp. 7
31 have been found in dogs during routine faecal microscopy in laboratories in Bhutan (Rinzin, 2006). As in other countries, dog bites are common in Bhutan due to the presence of a large number of roaming dogs. A dog bite survey conducted in three hospital catchment areas reported an annual dog bite incidence of 869.8, and per 100,000 population in Gelephu, Phuentsholing and Thimphu, respectively (Tenzin et al., 2011b). Recently there has been considerable media coverage on the stray dog population, the risk of dog bites and the public nuisance associated with free-roaming dogs. The Kuensel article Dog bite numbers go through the roof on 19 th August 2011 reported that Damphu hospital in Tsirang Dzongkhag recorded 216 dog bite cases from January to July 2011 compared with only 30 in 2009 and 62 in 2010 (Gyelmo, 2011). The reporting of dog bite cases in Tsirang was as a result of increased awareness following an outbreak of rabies and associated loss of human life in the neighbouring Dzongkhag of Sarpang. This may indicate that many cases of dog bites went unreported (not presented to the hospitals) prior to the awareness campaign. Although no cases of fatal dog attacks in humans have been documented, deaths due to rabies following dog bites have been reported. Both dog bites and outbreaks of rabies cause considerable loss to the Government. Rabies can also cause substantial losses to farmers due to the death of farm animals as a result of spill-over infection from dogs. The direct outbreak cost during the rabies outbreak in Chukha Dzongkhag in 2008 was estimated to be Nu millions (US$ 59,923) (Tenzin. et al., 2010). This included losses from cattle deaths (Nu. 42,000; 15%), and costs for post exposure prophylaxis of humans (1,156,500; 55%) and implementation of the rabies control programme (Nu. 820,000; 30%). There is 8
32 continuous fear of these free-roaming dogs from children, and weak or old people. This arises from the reported instances of dog attacks on people during their morning or evening walks in Thimphu city. Despite Bhutan being one of the most sought after tourist destinations, the presence of too many free-roaming dogs and incessant barking of the dogs during night time can have an adverse effect on tourism (TCB, 2010,2011). Although local residents of Thimphu are used to the nightly canine howling, it is the unfortunate expatriate community and tourists, who are not used to this noise, that suffer. The presence of a large number of dogs also causes welfare problems to the dog themselves. The Kuensel issue on the 11 th September 2011 reported the treatment at the National Animal Hospital, Chubachu, Thimphu of 64 dogs that were injured as a result of motor vehicle accidents between January and August 2011 (Pelden, 2011). This is likely to be an underestimate of the real number as many dog injuries are likely to go unreported. 1.5 Dog population control strategies initiated in Bhutan Considering the previous mentioned problems, several control measures have been attempted since the 1980s to control rabies and to restrict the dog population in Bhutan. The free-roaming dog issue has been discussed in various forums starting from the highest decision making body, the National Assembly of Bhutan (NCAH, 2006; UNDP, 2008; Wangmo, 2010). The issue has also been discussed in the United Nations Development programme (UNDP) coordinated e-forum Solution Exchange (UNDP, 2008). The issue Grappling with Stray Dog Problem in Bhutan - Advice; Experiences was put forward by the GNH Commission to the e-forum and many members contributed on this pertinent 9
33 issue. The Royal Government of Bhutan (RGOB) has initiated five major approaches towards the control of rabies and the dog population in Bhutan Killing of dogs The frequent outbreaks of rabies in the 1980 s in many parts of the country prompted the RGOB and the WHO to initiate rabies control programmes that involved mass killing of stray dogs (NCAH, 2006; UNDP, 2008). The WHO supplied dart guns, syringes and drugs to cull free-roaming dogs. This equipment was distributed to all Dzongkhags and several livestock staff were trained in using the equipment in each Dzongkhag. Some trained dog shooters were also employed to shoot dogs in the urban areas. Dogs were shot by these shooters in public places as part of rabies control programme; however it was considered inhumane and was strongly opposed by the general population. The hearing of gun fire and the sight of dead dogs was reported to have caused psychological trauma to young children (Wangmo, 2010). Dogs were also poisoned using strychnine as part of the rabies and dog population control programme (NCAH, 2006). The strychnine tablets were placed in raw meat and fed to the dogs. During the implementation of this programme people were recommended to restrain owned dogs to their homes and release them only once the dog control team had left the area (NCAH, 2006; Wangmo, 2010). From 1990 until recently, mass culling of freeroaming dogs was undertaken only in the rabies outbreak area as and when rabies outbreaks were reported (NCAH, 2006; Rinzin et al., 2006; Tenzin et al., 2010; Tenzin et al., 2011a; Tenzin et al., 2011c). In-contact free-roaming dogs were culled in areas with outbreaks of rabies as the vaccination coverage had been low and the immune status of the dogs was not known. Moreover, those free-roaming dogs that were vaccinated could not be identified as 10
34 permanent identification marks were not applied to them. The mass culling of free-roaming dogs during the rabies outbreak in June 1999 in Paro town, despite religious pressure, managed to control rabies without the spread of the disease to other places (UNDP, 2008; Tenzin et al., 2011c). Similarly, the outbreak reported from the southern border region of the country was controlled by the immediate culling of in-contact free-roaming dogs in the area. The major rabies outbreak that occurred in Chukha Dzongkhag in the south-western part of Bhutan between January to July 2008 was also controlled by culling of in-contact free-roaming dogs in the outbreak areas (Tenzin et al., 2010). The outbreak continued for almost seven months in three sub-dzongkhags in the Chukha Dzongkhag, as there was a delay in culling of in-contact free-roaming dogs as killing is prohibited in two auspicious Bhutanese months i.e. the first and fourth Bhutanese months. From this experience the importance of culling in-contact, free-roaming dogs in a rabies outbreak area where the vaccination and immune status of the dogs was not known, was recognised. However, with the subsequent adoption of ear notching of vaccinated and neutered free-roaming dogs, the likely immune status of dogs is now easier to assess. Furthermore it is acknowledged that elimination of vaccinated dogs will result in encroachment of un-vaccinated dogs from adjacent places. To avoid creation of a vulnerable population to rabies, the elimination of ear notched dogs at the time of rabies outbreak is now being stopped and instead administering booster vaccinations at the time of a rabies outbreak is encouraged Translocation of dogs Although translocation of dogs has not been a recommended strategy to control the dog population in Bhutan, it was implemented in some Dzongkhags (NCAH, 2006; UNDP, 2008). Dogs were caught from public places, loaded into trucks and transported to another 11
35 Dzongkhag. The vehicles belonging to the armed forces were often blamed by the public for carrying the dogs as these vehicles are not inspected at the strategic police check points (Dorji, 2008). One of the characters in Dawa: The Story of a Stray Dog in Bhutan, the grisly old dog in Mongar, tells Dawa I am one of the dogs who were deported from Bumthang. One fine day we were just going about as usual, minding our own business, when we were rounded up and loaded on a truck before we could say haw haw in surprise or protest. We were dumped here (Choden, 2006). This again highlights the factual nature of characters in this book. There was a report of dogs being dropped at Sengor in Mongar Dzongkhag by the Bumthang Dzongkhag Authority (Tshering, 2007). These dogs subsequently attacked and killed some sheep in Sengor which lead to a dispute between the Bumthang and Mongar Dzongkhag authorities. The dispute was later settled and the Bumthang Dzongkhag Authority was required to pay compensation to the farmers in Sengor for the sheep that were killed Impounding of dogs The increasing stray dog population issue was discussed in length during the 87 th session of the National Assembly in June 2007 and it was resolved to build dog pounds in all 20 Dzongkhags to render the towns free of stray dogs by December 2007 (UNDP, 2008). This decision was made as 2008 was the year for the coronation of the fifth king and celebration of the centenary of the Monarchy reign in Bhutan. Separate dog pounds were built in all Dzongkhags and impounding of dogs in most of the Dzongkhags was initiated. The impounded dogs were fed and looked after by paid caretakers. This initiative invited extensive media coverage and criticism from both national and international animal welfare 12
36 organisations (Jangsa, 2008; Choki, 2009; Pelden, 2011). It was realized that impounding dogs was not the best solution to control the dog population as it was not affordable and could result in serious welfare issues for the dogs. This approach was discontinued in February 2009 as it was not sustainable. During the major rabies epidemic in eastern Bhutan in 2005 and 2006, 900 in-contact freeroaming dogs were caught and impounded in 12 temporary shelters constructed in three Dzongkhags in an attempt to prevent the spread of rabies due to the movement of freeroaming dogs (Tenzin et al., 2011a). The impounding of the in-contact free-roaming dogs was adopted in this outbreak in response to religious aversion to the mass culling of dogs by the community in eastern Bhutan. However, some in-contact free-roaming dogs escaped from the pounds which lead to the spread of rabies to other places. As such the rabies outbreak, which was first reported in May 2005 in Toedtsho Geog under Tashi Yangtse Dzongkhag, started spreading to many places including two adjacent Dzongkhags (Mongar and Trashigang), with a peak number of cases in January and February There are a few local non-government animal welfare organizations that run treatment shelters in Thimphu and Tashigang Dzongkhag. The Royal Society for the Protection and Care of Animals (RSPCA), Thimphu runs an Animal Welfare Treatment Centre in Serbithang, Thimphu (RSPCA, 1999). The initial plan of this centre was to rescue the weak and sick dogs from the street for care and treatment in the centre and subsequently release them back to their place of origin once they were healthy. However, most of the dogs brought for treatment remained in the centre as they were continuously fed and cared for. The RGOB also officially approved the Bhutan Karuna House Program in June 2008 and granted one acre of land for building facilities to keep and care stray dogs in Tashigang 13
37 Dzongkhag (Karuna, 2008). After three years, Karuna House had provided refuge for approximately 50 stray dogs in a hygienic and safe environment. The construction of four fully equipped kennels was completed in 2011 and increased the capacity to house up to 300 stray dogs. When hundreds of dogs were pounded in Memelakha dog pound in Thimphu in 2008, there was criticism by animal welfare organizations and the local community as the pound was overcrowded and did not segregate dogs into different categories such as puppies, lactating bitches, sick, weak and old dogs (Jangsa, 2008). This prompted the Brigitte Bardot Foundation to provide funds to the Jangsa Animal Saving Trust (JAST) for the immediate construction of a rescue shelter and the purchase of a vehicle to transport the dogs recovered, particularly the old, disabled and injured animals, and to undertake a food drive in the neighbourhood (restaurants, schools, local donors). The JAST constructed a treatment shelter adjacent to the RSPCA shelter on land provided by the Government. The shelter is still used for the treatment and care of sick and weak dogs which are subsequently released back to the street once they are healthy Ad hoc sterilization and vaccination campaigns Campaigns have been organized by the Department of Livestock in various Dzongkhags to sterilize and vaccinate both owned and stray dogs. To increase the effectiveness of such campaigns cash incentives have been given to people who catch and bring in dogs (NCAH, 2003,2006). The public prefers this method since it does not incur the destruction of dogs. However the coverage and frequency of the campaigns have varied between Dzongkhags due to a range of constraints. The number of dogs sterilized and vaccinated from 1998 to 2008 is displayed in Figure 1.2. The overall proportion of dogs sterilized and vaccinated 14
38 during this period was low, with the exception of Many dogs were sterilized and vaccinated in Tashigang, which had the highest number of rabies outbreaks of the three affected Dzongkhags in eastern Bhutan (Tenzin et al., 2011a). However the general public was concerned about this programme, in particular the poor aseptic conditions of the surgeries. Most surgeries were conducted on the ground and in the open with poor asepsis. The protocol was improved from 2003 when surgeries were performed on a portable surgical table in a screened enclosure under the cover of an umbrella using sterilized surgical instruments (Figure 1.3). Following these improvements, the cooperation received from the general public during the campaigns was significantly improved. Figure 1.2 Number of dogs vaccinated against rabies and sterilized in Bhutan from 1998 to 2008 (NCAH, 2009) Various techniques were used to identify dogs that had been neutered and vaccinated (NCAH, 2003,2006). The advantage of having an identification mark was to avoid wasting time and resources in catching neutered dogs during the follow-up sterilization campaigns. 15
39 In Mongar and Tongsa Dzongkhag, tail docking was initially done to identify the sterilized and vaccinated dogs (UNDP, 2008). This was opposed by the public and animal welfare groups and was subsequently discontinued. In Thimphu an ear tattoo was used as a permanent mark to identify the neutered and vaccinated dogs (NCAH, 2006). However the tattoo was not visible from a distance and required a dog to be caught to determine its neutering and vaccination status, defeating the purpose of using identification marks. From 2004 to 2008 synthetic collars were used as identification marks (NCAH, 2003,2006); however this method was only useful during short campaigns and was not reliable in the long term as some collars fell off. The synthetic collars were also not suitable for younger growing dogs which could choke as their body size increased. After trialling different methods of identification, ear notching, which was used by both Vets Beyond Borders (VBB) as well as HSI, was found to be the best method of identifying neutered and vaccinated dogs. The advantage of ear notches are: they are visible from a distance, permanent, quick, can be done when the dogs are under anaesthesia and are approved by the animal welfare organisations. 16
 programme by the officials of Department of Livestock from 2003 onwards The sterilization campaign, which was first initiated by the Department of")
40 Figure 1.3 Performance of animal birth control (ABC) programme by the officials of Department of Livestock from 2003 onwards The sterilization campaign, which was first initiated by the Department of Livestock in the 1980s, was not successful in reducing the dog population to a manageable level due to a poor coverage (NCAH, 2006). Due to limited funds and the poor support received from the general public and key stakeholders, the overall annual sterilization and vaccination coverage was estimated to be only between 10 and 20%. This low coverage was not sufficient to effectively control rabies or to have an impact on the free-roaming dog population Project on National Dog Population Management and Rabies Control Programme The sterilization and vaccination campaigns carried out by the Department of Livestock in the past were not sufficient to control rabies or reduce the dog population to a manageable level. The WHO Expert Committee on Rabies in 2004 recommended that at least 70% 17
41 annual vaccination coverage was required to break the rabies cycle and also 70% of animals should be sterilised to maintain a stable dog population (WHO, 2004). The Department of Livestock, RGOB and the HSI, USA initiated a pilot project from February to June 2009 to carry out a CNVR programme in Thimphu (DOL/HSI, 2009). During the pilot project the key stakeholders and decision makers, including the Prime Minister and Council of Ministers, were invited to the CNVR clinic to observe the high quality of the CNVR programme undertaken by the trained project team (Veterinarians and Paravets). During the pilot project a total of 2,846 dogs were sterilized and vaccinated. After the successful pilot project in Thimphu, and with the support of the Government s Cabinet, the RGOB and HSI embarked on a long term project titled the National Dog Population Management and Rabies Control Programme in Bhutan (NDPM & RCP). The project was officially launched on the 28 th September 2009 in Bumthang to coincide with World Rabies Day. Through this project a CNVR programme was carried out where dogs were captured, neutered, vaccinated and released back at their place of origin. As of 30 th June 2013, a total of 48,051 dogs had been sterilized and vaccinated in all 20 Dzongkhags of Bhutan. Of these dogs 22,443 (46.7%) and 25,608 (53.3%) dogs were owned and freeroaming dogs, respectively (Chapter 4) Revision of the Policy Guidelines for the Prevention and Control of Rabies in Bhutan In 2003 the policy guidelines on the prevention and control of rabies in Bhutan were revisited and major changes were made. These changes focussed on improving the coordination mechanisms during the implementation of the rabies prevention and control activities (NCAH, 2003). The revised guidelines contained extensive information on the 18
42 institutional arrangement, prevention strategies, contingency plan to manage outbreaks and other support plans. In 2007, the WHO provided financial support to implement the Rabies Prevention and Control Project in Bhutan (NCAH, 2007). The project activities were planned based on the revised policy guidelines outlined previously. Through this project an international consultant was employed to draft regulations on rabies and dog population management. The regulations included sections on responsible dog ownership, habitat control and animal birth control and vaccination of the un-owned free-roaming dog population. The other important activity conducted through this project was three weeks training of Bhutanese veterinarians on animal birth control by staff from Vets Beyond Borders (an Australian based NGO) at Paro Veterinary Hospital in April Since the first World Rabies Day was held in September 2007, Bhutan has joined other international communities to observe this day. The major activities undertaken during World Rabies Day are public awareness campaigns on rabies and dog population control and include walkathons, presentations through mass media, distribution of educational material, debates among school children and mass free vaccination of dogs against rabies in Thimphu and areas where the disease is endemic. 1.6 Aims and Objectives of the current study Free-roaming dogs have been an issue in Bhutan at least since the 1980s, resulting in the RGOB implementing five main strategies to address this problem. The first four strategies only provided temporary relief to the ever increasing dog population and associate rabies problem. These strategies could not be continued due to the following reasons. 19
43 Firstly, there was no evidence that removal of dogs alone had a significant impact on the population density of dogs or the spread of rabies (OIE, 2010). It is likely that replacement through breeding was greater than the highest recorded removal rate (15% of the dog population). The culling of dogs was also not acceptable by the local community and should only be pursued for the targeted and humane removal of unvaccinated, ownerless free-roaming dogs during an outbreak of rabies. Secondly, the translocation of dogs in the past has resulted in more harm than benefit. Besides the direct harm arising from attacks on other livestock and wildlife, translocation of dogs exacerbated the spread of rabies in eastern Bhutan. Thirdly, the impounding of dogs in Bhutan has attracted media attention and criticism from animal welfare groups and communities. The impounding of dogs was not helpful in reducing the dog population; instead it contributed to the spread of rabies in eastern Bhutan. Furthermore it was costly and resulted in serious welfare issues for the impounded animals. Fourthly, the ad hoc vaccination and sterilization coverage in the past was not sufficient to control rabies or restrict the dog population. The low coverage was mainly due to poor coordination, lack of support from the key stakeholders, poor responsible dog ownership, a lack of legislation, religious beliefs and limited funds to carry out the campaigns. As recommended by international organizations (OIE, FAO, WHO), animal welfare organizations (WSPA, HSI) and other authorities, mass animal birth control (ABC) through the CNVR programme to cover more than 70% of the total dog population, is being pursued as the main strategy to control the dog population and the number of cases of 20
44 rabies in Bhutan. In order to maximise the benefits of the CNVR programme, the study reported in this thesis was undertaken with the following objectives: To assess the knowledge, attitudes and practices of the community on the management and control of the dog population. To describe the population demographics of the stray and owned dog population. To monitor and evaluate the CNVR programme to control the dog population and rabies. To quantify the population of owned and stray dogs in the country. To assess the benefits of the ABC programme on the health of dogs. To compare and evaluate different methods to estimate the free-roaming dog population in the field and identify factors associated with the abundance of freeroaming dogs. To evaluate and monitor the CNVR programme through regular assessment of the free-roaming dog population in Thimphu. To provide a set of recommendations for the effective control of rabies and the dog population in Bhutan based on the findings of this study. A series of studies were undertaken to address the gaps in knowledge on the ecology and population dynamics of free-roaming dogs in Bhutan. To better understand the perceptions and behaviours of the public and stakeholders on dog population control, a knowledgeattitude-practices (KAP) survey was undertaken in six Dzongkhags (Chapter 3). The population characteristics of both owned and stray dogs that were presented to CNVR clinics are described in Chapter 4. The results of a field population survey to monitor and 21
45 evaluate the CNVR programme to control the dog population and rabies are presented in Chapter 5. In Chapter 6 the demography of the owned dog population and the population size of owned and stray dogs in the country are described. A study to assess the benefits of the ABC programme on the health of dogs is then presented in Chapter 7. In Chapter 8 different methods are compared to estimate the size of the free-roaming dog population in Thimphu. In that chapter the CNVR programme over a seven year period is also evaluated through regular assessment of the size of the free-roaming dog population. Finally in Chapter 9 the results of the complete study are discussed and a set of recommendations to further strengthen the rabies and dog population control programme in Bhutan and other similar countries are made. 22
46 CHAPTER TWO Literature Review 2.1 Background Origin of the domestic dog Genetic studies of mitochondrial DNA (mtdna) have demonstrated that dogs have mtdna sequences which are closer to those of wolves than to other canids (Savolainen, 2006,2007), indicating that the domestic dog, Canis lupus familiaris, is a subspecies of the wolf (Leonard et al., 2006; Savolainen, 2007). A phylogenetic analysis of samples from dogs sourced from throughout the world demonstrated that dogs from the East Asia region had the largest genetic variation, supporting the belief that the domestic dog had a single origin from East Asian wolves (Leonard et al., 2006; Savolainen, 2006). As outlined in Chapter 1 the dog plays a major role in the community offering many advantages to their human masters Classification of the dog population Although the majority of dogs have an owner, sometimes this owner is not clearly identifiable. In developed countries, such as Australia, the United Kingdom and the United States of America (USA), dogs are neatly categorized as either pets (owned), strays or feral, depending on their ownership status. However, this classification is not appropriate for dogs from urban areas in many developing countries. Dog ownership in these countries can range from loose ownership in the form of irregular feeding of a dog that roams freely in the street, to a dog kept as part of a commercial breeding facility, to a well-cared for legally 23
47 registered and confined pet. The WHO and WSPA classify dogs based on the level of dependence on human care (food, shelter and human companionship) and also on the level of supervision and restriction imposed on the dog by humans (WHO & WSPA, 1990). These categories are - Restricted (supervised) dogs which are fully dependent and fully restricted by humans; - Family dogs which are fully dependent upon humans but which are semi-restricted; - Neighbourhood dogs which are semi-dependent upon humans and semi-restricted; - Feral dogs which are independent of humans and are unrestricted. From a population management perspective, the International Companion Animal Management Coalition (ICAM) characterises dogs first in terms of their behaviour or location (i.e. whether they are confined or roaming) and then by their ownership status (ICAMC, 2007) (Figure 2.1). Dogs may move between the sub-populations as indicated by the arrows in the figure. 24
48 Figure 2.1 Sub-populations of the total dog population and the potential movement of dogs between groups (ICAMC, 2007). 2.2 Rabies and free-roaming dogs Rabies is the most lethal of the canine transmitted diseases. Canine rabies is the biggest source of both human and livestock infection in the developing countries of Asia, Latin America and Africa (WHO, 2001; Shwiff et al., 2013). According to the WHO, reliable data on rabies are scarce in many areas of the globe, making it difficult to assess its full impact on human and animal health. Human mortality from endemic canine rabies has been estimated to be 59,000 deaths per year (95% CI: 25, ,000), with over 3.7 million (95% CIs: 1.6 to 10.4 million) disability-adjusted life years (DALY) and an economic 25
49 losses of 8.6 billion USD (95% CI: billion) annually (Hampson et al., 2015). The majority (84%) of these deaths occur in remote rural communities where measures to prevent dog-to-human or dog-to-livestock transmission is rarely implemented (Taylor, 2013). About 10 million people were provided with post-exposure treatments in 2010 after being exposed to rabies suspect animals (WHO, 2004,2013). Therefore, rabies represents a major economic burden for both developed and developing countries due to costs associated with human post exposure treatment, diagnosis, disease surveillance, immunization of domestic and wildlife and trade restrictions. However, the most serious losses are through the loss of human lives and the psychological burden of rabies Aetiology of the disease The rabies virus is classified as a Rhabdovirus belonging to the family Rhabdoviridae and genus Lyssa. It is a bullet shaped, enveloped, single-stranded RNA virus, kb in size and has a broad host range (Zee & MacLachlan, 2004). The rabies virus is comparatively fragile and cannot survive long in the environment being rapidly inactivated in sunlight (Zee & MacLachlan, 2004). The virus may persist in infected brain tissue for up to 10 days at room temperature and for several weeks at 4 0 C, but is relatively susceptible to disinfection by any fat soluble solvents such as liquid soap, ether, chloroform and acetone (Zee & MacLachlan, 2004) Distribution and host range The rabies virus infects a wide range of hosts, including racoons, skunks, foxes, coyotes, bats, domesticated dogs and cats, cattle and humans (Blancou, 1988; Smith & Baer, 1998). While infection can occur in any warm-blooded animal, some, such as foxes, coyotes, jackals and wolves, are highly susceptible, while others, such as opossums and birds, are 26
50 much less susceptible. Rabies is maintained in two epidemiological cycles, the urban and sylvatic cycles (Krauss, 2003). In the urban rabies cycle, dogs are the main reservoir host. This cycle is predominant in much of Africa, Asia, and central and south America where the proportions of unvaccinated and semi-owned or stray dogs is high (Blancou, 1988). The disease has been virtually eliminated in North America and Europe; although sporadic cases occur in dogs infected by wild animals. The sylvatic (wild) cycle is the predominant cycle in Europe and North America (Smith & Baer, 1998). Reservoir hosts important in various world regions include: insectivorous bats, skunks, racoons, and foxes in the USA; foxes in continental Europe, Canada and the former Soviet Union; dogs in Africa, Asia, and central and south America; jackals in parts of Asia and the Middle East; vampire bats in South America; wolves in Asia and Eastern Europe; mongooses in the Caribbean and parts of Asia; meerkats in Southern Africa; and racoon dogs in Russia and adjacent countries (Blancou, 1988; Smith & Baer, 1998; Krauss, 2003) Transmission and pathogenesis The excretion of rabies virus and the amount excreted are the two most important factors for transmission. Rabies virus can be excreted in the saliva of infected animals for many days after the onset of clinical signs. Exposure to the infected saliva from rabid animals by a direct bite is the most common route of infection. Rabies virus does not penetrate through normal skin but licking, scratching or contact with freshly abraded skin or mucous membranes, such as the conjunctiva, nasal mucosa, vulva and anus, may allow transmission of infection. Although the transmission through ingestion of tissues and fluids or milk is rare, it cannot be ruled out (Krauss, 2003). 27
51 Following exposure, the rabies virus persists in the local muscle tissues for hours or days, and viral replication takes place in striated muscle cells near the inoculation site. There is no evidence that a viraemia is necessary for the dissemination of rabies to the central nervous system (CNS); rather the virus is taken up at the motor and sensory nerve endings and then ascends within the axons of nerve cells to the ventral horn cells of spinal cord at a rate of 12 to 24 mm per day (Charlton, 1988; Zee & MacLachlan, 2004). The virus then moves from the CNS via anterograde axoplasmic flow within peripheral nerves, leading to infection of some of the adjacent non-nervous tissues, such as the salivary glands. The virus is widely disseminated throughout the body via the peripheral nerves at the onset of clinical signs. The first clinical sign is usually neuropathic pain at the wound site. This is caused by virus replication in the dorsal root ganglia resulting in ganglionitis (Zee & MacLachlan, 2004). Neuronal dysfunction, rather than neuronal death, is responsible for the clinical features and fatal outcome in rabies (Jackson, 2003). Peripheral nerve dysfunction is responsible for the weakness observed in the paralytic form of rabies. In furious rabies, electrophysiological studies indicate anterior horn cell dysfunction, even in the absence of clinical weakness (Charlton, 1988). Without intensive care, death occurs within a few days (1-5 days) of the development of neurological signs due to respiratory failure (WHO, 2004). Lymphocytic polioencephalomyelitis with perivascular cuffing is the main histological lesion in the brains of animals with rabies, although the severity of these changes is highly variable. The presence of acidophilic intracytoplasmic inclusion bodies (negri bodies) in the infected neurons of the hippocampus or cerebellum is characteristic of the disease (Zee & MacLachlan, 2004). 28
52 2.2.4 Clinical presentation The clinical presentations of rabies in different animals have been described in numerous manuscripts (Kaplan, 1977; Warrel, 1977; Kaplan et al., 1986; WHO, 1987). The incubation period varies from 2 weeks to 6 years (average 2-3 months) depending on the site and severity of the bite, the species of animal involved, the age of the animal bitten, the strain and amount of virus inoculated and the post-exposure treatment. All clinical signs have a neural involvement; this includes paraesthesia and pain at the wound site. Later fever, headache, malaise, and abnormal behaviours, such as anxiety, confusion, agitation and hypersensitivity to light and sound, are noted. Physical changes are also referable to nervous involvement and include difficulty in swallowing, hypersalivation, priapism, muscle spasms and ultimately paralysis. Death may occur rapidly within a week of the onset of clinical signs and is usually due to respiratory failure (Kaplan et al., 1986) Diagnosis In many parts of the world, rabies in humans and animals is still diagnosed based on the presenting clinical signs/symptoms. However, a thorough history (animal bite or contact with a rabid animal) is needed and an early tentative diagnosis is possible if the history includes an animal bite, contact with diseased or dead animals, contact with wild animals or a visit to countries with urban rabies or to caves in Central and South America. Since the clinical diagnosis of encephalitis is challenging, all suspected cases should be confirmed by laboratory tests. Laboratory confirmation of rabies generally involves the detection of viral antigen and isolation of virus in cell culture or in laboratory animals (WHO, 1992,2004,2013). The detection of viral antigen is the most common and widely used method to confirm rabies 29
53 which employs a rapid, sensitive, specific direct fluorescent antibody technique (FAT) (WHO, 2004). The FAT has the advantage over other tests in that it can be performed when the patient is still alive by using corneal impression smears, scrapings from the lingual mucosa, bulbar tissue of the hair follicles or frozen sections of the skin. However, the effectiveness of the test depends on the competency of the technician, the quality of the reagents and the availability of the equipment. The Rapid Immunochromatographic Test (RICT) which is simple, user friendly and robust, can be used anywhere in the world with no requirement of special reagents or equipment. This test is now being developed and used in many rabies endemic countries (Nishizono et al., 2008; Ahmed et al., 2012). Various methods available for the diagnosis of rabies are described in OIE Manuals and in reports prepared by the WHO (WHO, 1992,2004; OIE, 2011; WHO, 2013) Treatment For humans bitten by a dog, local treatment of the wound is extremely important as proper treatment of the wound alone can prevent many cases of rabies by eliminating or inactivating the inoculated virus (WHO, 1992,2004). The wound should be washed immediately under a strong jet of water and cleaned with soap and water, followed by antiseptics. Infiltration of the wound with antirabies serum is a very effective means of preventing infection (WHO, 2004). Following wound treatment, post exposure treatment (PET) should immediately commence for all individuals bitten by/exposed to animals suspected to have rabies using the standard regimen recommended by WHO (WHO, 2004,2013). Pre-exposure prophylaxis is recommended for high risk groups, such as veterinarians, para-veterinarians, technicians and other workers, who are increased risk of exposure to rabies infection in endemic countries (WHO, 2013). 30
54 There is no effective treatment for a suspected rabid animal. Those animals which attack or bite humans should be treated as being rabid until they are proven otherwise. Owned dogs should be confined and monitored for 10 days, while stray or wild animals should be destroyed and tested for the presence of virus (WHO, 1992,2004) Prevention and control of rabies in dogs The most rational approach to preventing human rabies is to control and eradicate the infection in domestic animals, especially dogs. Whether enzootic or epizootic, urban rabies can be controlled and even eradicated in a reasonable period of time, provided a comprehensive control programme is implemented (Larghi et al., 1988). Canine rabies has been eliminated from North America, Western Europe, Japan and many areas in South America (WHO, 2004). However, canine rabies is still widespread and more than 99% of all human cases are acquired from rabid dogs (WHO, 1992,2004). Approximately half of the global human population lives in canine rabies endemic areas and is considered at risk of contracting rabies (WHO, 1996). The procedure used for the control and eradication of urban rabies is aimed at rapidly reducing the population of susceptible animals by immunization of domestic dogs and cats and by reducing the population through sterilization and elimination of street dogs. Vaccination programmes should take into account the local ecology of the dog population, including the degree of ownership (WHO, 2013). This knowledge is essential to ensure that the method of vaccination delivery maximizes access to dogs and in order to provide culturally appropriate educational material. According to the WHO (WHO, 1987,1992,2004,2013) canine rabies control programmes should incorporate three basic elements (epidemiological surveillance, mass vaccination 31
55 and dog population control), with priorities varying according to the prevailing social, cultural and economic factors present in the country. Epidemiological surveillance: Surveillance of rabies is the basis of any programme to control rabies. Epidemiological data should be collected, evaluated, processed and mapped. This information is also required for planning, organizing and implementing control programmes (WHO, 2004,2013). Mass vaccination: Mass vaccination campaigns have been central to controlling rabies (Kayali et al., 2003). Annual vaccination coverage of 70% has been sufficient to control canine rabies in several instances, but the exact level of coverage required is likely to vary according to demographic, behavioural and spatial characteristics of the dog population (WHO, 2004). Effective animal vaccines that provide a considerable duration of immunity, have been developed and mass parenteral vaccination campaigns remain the mainstay of canine rabies control. The studies coordinated by the WHO on dog population have revealed that in many communities in Africa, Latin America and Asia, a substantial proportion of the population (60 to 75%) is accessible for parenteral immunization (Acha & Szyfres, 2003a; Kayali et al., 2003). However, the large number of ownerless and street dogs in many Asian countries makes parenteral immunization programmes challenging (WHO, 1996). Consequently the use of oral rabies vaccines in dogs has been adopted in some countries to increase vaccination coverage (WHO, 1998b,1998a). However, the disadvantages of the use of oral vaccines such as safety for non-target species and the high cost of bait vaccines should be considered in future use. To achieve control and eventual elimination of rabies, 32
56 programmes must ensure recurrent annual vaccination campaigns and achieve a vaccination coverage of at least 70% (WHO, 2004). This coverage should be sufficient to maintain the required level of herd immunity in the vaccinated population in spite of population turnover (births, deaths, emigration and immigration) in the period between campaigns (WHO, 2013). Registration and permanent identification of vaccinated dogs to evaluate the vaccination coverage rate and to identify unvaccinated dogs for supplementary follow-up measures should be pursued. The temporary identification of dogs using collars was tried in the Philippines and Bhutan, but was found to only provide short term benefits to avoid double catching of dogs during individual vaccination campaigns. Recently ear notching of free-roaming dogs that are caught for neutering and vaccination is being used in India and Bhutan. This method offers the advantage of permanency, is easy to perform during anaesthesia and has low cost (Reece & Chawla, 2006; Anonymous, 2009; Totton et al., 2010a) Dog population management From the studies carried out in Latin America, Asia and Africa, there is no evidence that removal of dogs alone has made a significant impact on the density of the dog populations or on the spread of rabies (Kaplan et al., 1986; WHO, 1996,2004). Control of the dog population through animal birth control, along with vaccination of dogs, has been recommended for reducing the incidence of rabies in humans and other animals (WHO, 1987,1992,2004,2013). Therefore factors associated with a free-roaming dog population and strategies that are adopted to reduce this population are reviewed and discussed in further detail in the following sections of this chapter. 33
57 2.3 Other problems associated with a free-roaming dog population Zoonotic diseases Besides rabies, dogs are implicated in the transmission of a variety of bacterial, viral and parasitic infections that pose a risk to humans and other animals (Acha & Szyfres, 2003b,2003a,2003c). Echinococcosis is a zoonotic infection caused by the larval (metacestode) stages of cestodes belonging to the genus Echinococcus (Acha & Szyfres, 2003c). The parasites are perpetuated in a life cycle with carnivores as the definitive hosts which harbour the adult, egg producing stage in the intestine, and a herbivore or omnivore as intermediate hosts in which the infective metacestode develops. Humans become infected through the accidental ingestion of Echinococcus eggs from dog faeces (Eckert et al., 2000). In humans cysts develop in the liver (70%), lungs (20%) or elsewhere in the body (10%) (Togerson & Budke, 2003). Alveolar echinococcosis (AE), due to the metacestode stage of E. multilocularis, is often fatal if untreated (Eckert et al., 2000). Toxocariasis is a zoonotic infection caused by roundworm larvae commonly found in the intestine of dogs (Toxocara canis) or cats (T. cati) (Overgaauw, 1997). Humans accidentally ingest the eggs of Toxocara which hatch in the intestine. The larvae penetrate the intestinal wall and are carried by the blood circulation to a wide variety of body tissues (lung, liver, brain, heart, muscles) resulting in severe local reactions (Overgaauw, 1997; Robertson & Thompson, 2002). Many other diseases can also be transmitted from dogs to humans. Salmonella, Campylobacter, Cryptosporidium, Yersinia or Giardia spp. can be acquired from dogs through faecal oral transmission resulting in gastroenteritis and other clinical signs (Schlundt et al., 2004; Hunter & Thompson, 2005). Humans also acquire skin infections 34
58 due to mites and fungi through direct or indirect contact with infected animals (Acha & Szyfres, 2003c,2003b). Studies undertaken in Brazil have also shown that stray dogs can contribute to the spread and maintenance of the etiologic agents for brucellosis, leptospirosis and toxoplasmosis (de Paula Drerr et al., 2013) Dog bites Although domestication of dogs was initiated over 14,000 years ago, they retain some of their wild instincts, including behaviours that can result in attacks on humans. Dog bites of humans can be a serious public health problem and have been well documented worldwide (Weiss et al., 1998; Overall & Love, 2001; Marsh et al., 2004; Keuster et al., 2005; Tenzin et al., 2011b). The annual incidence risk of dog-bite related injuries presented to hospital emergency departments throughout the USA was estimated to be 129 per 100,000 persons in 1998 (Weiss et al., 1998). In California from 1991 to 1998, the overall mean annual incidence risk of hospitalisation resulting from dog bites was 2.6 per 100,000 head of population (Feldman et al., 2004). Several studies indicate that approximately 60 to 75% of people bitten are less than 20 years of age, and most are children between the ages of five and nine years (Overall & Love, 2001). A field survey of dog bite injuries in Uganda estimated an annual incidence risk of 39.6 bites per 100,000 people (Fevre et al., 2005). Most of the studies that have described the incidence of dog bite injuries potentially underestimate the actual incidence because they only take into account those cases reported or presented to hospitals or clinic facilities. It is likely that injuries arising from dog bites are of greater importance in developing countries than is officially recognised or reported since the level of under-reporting is likely to be much higher than that in developed countries (WHO, 1996,2001,2004). 35
59 2.3.3 Risks to wildlife Free-roaming dogs may predate upon and pose a disease risk to wildlife (Manor & Saltz, 2003; Cleaveland et al., 2007). In contrast one study conducted on free ranging domestic dogs in Zimbabwe showed that dogs were unsuccessful predators of wildlife and that larger carnivores (leopards, lions and spotted hyenas) actually preyed upon the dogs (Butler et al., 2003). This predation of free-roaming dogs by larger carnivores provides an ideal situation for the transmission of diseases such as rabies, distemper or parvovirus which can then pose a threat to wildlife conservation (Cleaveland et al., 2000). A study undertaken to assess the disease prevalence in free-ranging domestic dogs and the possible spill-over risk for wildlife in the vicinity of the Great Indian Bustard Sanctuary in Nannaj, Maharashtra, India reported a very high seroprevalence of canine parvovirus (93.3%) and canine distemper (90.7%), which could pose a significant threat to the local wild carnivores (Vanak et al., 2007) Welfare of free-roaming dogs Stray dogs in developing countries suffer from poor welfare conditions through harm by humans, diseases, malnutrition and high mortality (Jackman & Rowan, 2007). Freeroaming dogs are sometimes poisoned and harassed, as well as being involved in road accidents (HSI, 2001). They are prone to a number of diseases including rabies, canine distemper (CDV), canine parvovirus (CPV), toxocariasis and venereal tumours (HSI, 2001; Kahn & Line, 2010). Free-roaming dogs may have skin diseases, including sarcoptic mange, which predispose them to secondary bacterial infections (Rodriquez-Vivas et al., 2003). They receive very little veterinary care leading to the spread of diseases within and between populations potentially resulting in high morbidity and mortality. They also 36
60 constantly face starvation and dehydration (HSI, 2001; ICAMC, 2007). Overpopulation leads to competition for food and fighting during the mating season. Females also face additional welfare problems when they undergo repeated pregnancies and are feeding puppies (Jackman & Rowan, 2007). The peak whelping season in the cold temperate countries of the northern hemisphere occurs during the onset of winter when the survival rate of puppies can be very low (personal observation) Social nuisance and environment contamination Free-roaming dogs also cause many other problems by fouling public places with excreta, noise pollution and putting pressure on road users which leads to road accidents and injury to the dogs themselves (Robinson, 1974). Increasing number of free-roaming dogs and incessant barking of the dogs during the night has been reported to create a negative impression to tourists visiting Bhutan (TCB, 2010,2011). 2.4 Failure of capture and kill method to control a free-roaming dog population Due to problems associated with increasing free-roaming dog populations, various strategies have been initiated in different countries to control this population. The capture and destruction of stray dogs had been the dominant strategy to reduce the dog population and to control dog transmitted zoonoses (WSPA, 1990; Krishna, 2010). In the 1970s and 1980s, culling of dogs was undertaken in many developing countries to control the population and to reduce the number of deaths in humans and other animals from rabies (Reece, 2005; Jackman & Rowan, 2007). In contrast, rather than reducing the rabies risk, the culling of dogs increases the population turnover and the movement of dogs, facilitating disease transmission through migration and leading to compensatory breeding (Bogel & Meslin, 1990). According to Cleaveland et al. (2006) capture and destruction programmes 37
61 may be counterproductive as the vaccinated dogs from the population are removed, reducing the proportion of immunized individuals in a population who are then replaced by unvaccinated susceptible dogs. Recognizing the disadvantages of the capture and destruction method, this strategy has been criticized and discouraged as a method to control the dog population and dog transmitted zoonoses (WHO, 2001; Hemachudha, 2005). 2.5 Dog Population Management (DPM) Due to the number of problems associated with free-roaming dogs there has been a need to manage this population efficiently and effectively, without compromising animal welfare. In recognition of this the WHO and WSPA collaborated in 1990 to develop comprehensive guidelines for the management of the dog population (WSPA, 1990). These guidelines were the only recommendations available to guide countries and organizations interested in implementing a dog population control programme until the International Companion Animal Management Coalition (ICAMC) developed revised guidelines on Humane Dog Population Management Guidance in 2007 (ICAMC, 2007). In the same year the OIE incorporated guidelines for the management of dog populations into Chapter 7 of the Terrestrial Animal Health Code (OIE, 2010). The FAO in collaboration with the WSPA and the Istituto Zooprofilattico Sperimentale dell Abruzzo e del Molise G. Caporale (IZSAM), organized an expert meeting to discuss dog population management at Banna, Italy from 14 to 19 March 2011 (FAO, 2014). Outcomes from that meeting included updated knowledge and recommendations which could be used by a wide range of stakeholders on options for management of the dog population and a series of international standards and best practices were developed. These guidelines/recommendations are summarized in the following sections of this chapter. 38
62 2.5.1 Assessing the local dog population The guidelines stressed the importance of understanding the dynamics of the dog population before embarking on a DPM programme. This approach ensures that the final management programme adopted will be tailored to the characteristics of the local dog population, rather than using a single blanket intervention for all situations. The source of unwanted dogs and the social problems that led them to become stray or abandoned also needs to be understood. Dog ecology and sociology studies are required to quantify the current dog population, to determine the source of the free-roaming dogs, to appreciate the main welfare issues affecting these animals and to understand the knowledge, attitudes and practices of people towards dogs and dog ownership (WSPA, 1990; ICAMC, 2007; FAO, 2014). It is also important to assess what has been done in the past or is currently being done to control the population so that lessons can be learnt about previous control efforts, but also what resources are available for future interventions and the sustainability of any programme (FAO, 2014). Davlin and VonVille (2012) undertook a systemic review of the dog vaccination coverage achieved following mass vaccination and investigated dog ecology/management factors relevant to the control of rabies in developing nations. The percentage of dog-owninghouseholds ranged from 12.3 to 98% in urban settings and 17.2 to 89% in rural settings. The mean number of dogs per dog-owning-household ranged from 1.2 to 3.2 in urban and 0.8 to 2.6 dogs in rural areas. The age of the dogs was highly skewed towards adult age groups in those studies that described the age structure of dogs (Brooks, 1990; De Balogh et al., 1993; Kitala et al., 2001; Flores-Ibarra & Estrella-Valenzuella, 2004). The percentage of owned dogs that were completely restricted differed significantly between countries and 39
63 between urban and rural settings. In Zambia 19% of the owned dogs were completely restricted in urban areas, whereas no dogs were fully restricted in rural areas (De Balogh et al., 1993). In Mexico 93 and 23% of the dogs were fully restricted in the urban and rural areas, respectively (Ortega-Pacheco et al., 2007). Such a high variation in the percentage of dogs being restricted justifies a need for different approaches to control the dog population in different countries and in different settings. Population estimates are necessary to develop realistic plans for dog population management, control of zoonoses and monitoring the success of any intervention (WHO & WSPA, 1990; ICAMC, 2007; OIE, 2010; Downes et al., 2013). The various methods used for estimating the population size of owned, as well as free-roaming dogs, are presented in the latter part of this chapter Human attitudes and behaviours Human behaviour is likely to be the most powerful force behind the dynamics of the dog population and problems associated with this population. The owned dog population may be a significant source of roaming dogs and may suffer from many preventable welfare problems (ICAMC, 2007; FAO, 2014). Encouraging responsible dog-ownership and positive human-animal interactions will lead to both an improvement in animal welfare and a reduction in many of the sources of roaming dogs. Several issues, such as local beliefs and attitudes, religion and culture, and age and educational background of the community need to be considered when exploring human attitudes and behaviours (ICAMC, 2007; Matibag et al., 2007; Slater et al., 2008a; Herbert et al., 2012; Hergert & Nel, 2013). 40
64 Participatory appraisals and knowledge, attitudes and practices (KAP) surveys have been recommended to study the human beliefs, attitudes and behaviours towards dogs, as well as for planning and monitoring the progress in dog care and population management (FAO, 2014). Participatory appraisals attempt to maximize the engagement of local people using flexible and visual tools that allows them to guide the direction of appraisal themselves in order to identify their own priorities for a future programme. Participatory appraisals also help to raise awareness within the community about its responsibilities regarding abandoned dogs and their involvement in possible solutions. These methods have been successfully used in two villages in Bali, Indonesia for studying ownership status of freeroaming dogs and to obtain consensus on food sources for the free-roaming dogs (Morters et al., 2014). Similarly, KAP studies have been conducted in other countries to understand the knowledge, attitudes and practices of the communities on rabies and dog population management (Matibag et al., 2007; Farnworth et al., 2012; Herbert et al., 2012; Lunney et al., 2012; Ameh et al., 2014; Davlin et al., 2014) Access to resources Street dogs are not capable of maintaining their population density unless food, water and shelter are available (FAO, 2014). Dogs generally have access to these resources which may be provided directly by an owner within the confines of a household or provided on public property if the animals are roaming. Some owned dogs are encouraged to roam by the opportunity to access resources on public property but do not rely on these for survival, while other dogs have no owner or are offered no care by their owner and are entirely reliant for their survival on resources accessed when roaming. A failure to provide restrictive fencing or to tie-up dogs during oestrus further encourages the roaming of dogs. 41
65 Urbanization and the increase of edible wastes in developing nations has contributed to an increase in the size of the dog population (WSPA, 1990; FAO, 2014). Higher dog densities were found in Kathmandu, Nepal compared with the Okayama Prefecture in Japan. This difference was associated with the availability of food, including garbage, on the streets and the tendency of people to feed the dogs in Nepal (Kato et al., 2003). Altering access to resources on public property will have an impact on the roaming dog population by discouraging opportunistic roaming. In the Wellington region of New Zealand the density of free-roaming dogs and cats was negatively associated with the socioeconomic status of the human community (Rinzin, 2007; Rinzin et al., 2008). A study undertaken in the University of Sao Paulo campus in Brazil showed a higher density of stray dogs around the university restaurants, where left-over food was deliberately offered to the dogs by restaurant users (Dias et al., 2013) Policies and Legislation Policies and legislation can provide a framework for how DPM should be performed and who is responsible for its implementation (WSPA, 1990; ICAMC, 2007; FAO, 2014). Polices and legislation on DPM include the registration and identification of owned dogs, registration of breeding facilities and pet shops, prevention of abandonment and unsupervised roaming of dogs, and measures to prevent animal cruelty. However the implementation of legislation varies greatly from country to country. Free-roaming dogs are found less frequently in those countries where legislation is strictly enforced. Intergovernmental organizations have also developed broad policies and guidelines for DPM, including the WHO and WSPA s Guidelines for Dog Population Management (WHO & WSPA, 1990), Chapter 7 of the OIE s Terrestrial Animal Health Code on Stray 42
66 Control (OIE, 2010), the WHO Technical Report Series 931 Expert Consultation on Rabies (WHO, 2004) and the FAO Report of Dog Population Management (FAO, 2014). Nongovernment organizations also have developed guidelines that can help DPM such as the ICAM Coalition s Humane Dog Population Management Guidance (ICAMC, 2007) and the Blue Print for Rabies Control and Prevention by the Partners for Rabies Prevention (Anonymous, 2012b; Lembo, 2012). Although many developing countries have these policies and have legislation to regulate DPM, they are often not adequately enforced (FAO, 2014). This lack of enforcement can be due to poor awareness of the legislation by the community and/or limited technical and financial support by the Government to implement the regulations. Therefore it is important to involve the relevant stakeholders from the initial preparation of the legislation so that it can be implemented smoothly without any hindrance (ICAMC, 2007; WHO, 2013) One Health concept The convergence of people, animals and the environment has created a new dynamic in which the health of each group is inextricably interconnected (FAO, 2014). Of the 1,461 diseases now recognized in humans approximately 60% are due to multi-host pathogens characterized by their movement across species lines (Kahn, 2006). Over the last three decades, approximately 75% of newly recognized human infectious diseases have originated from animals (WHO et al., 2004; Kahn, 2006). One strategy to better understand and address the contemporary health issues created by the convergence of human, animal and environmental domains is the concept of One Health. The One Health Initiative Task Force, formed by the American Veterinary Medical Association (AVMA), defined One Health as "the collaborative effort of multiple disciplines - working locally, nationally and 43
67 globally - to attain optimal health for people, animals and the environment" (AVMA, 2008). The FAO, OIE and WHO recognize that addressing health risks at the human-animalecosystem interfaces requires strong partnerships among players who may have different perspectives on some issues and different levels of resources (FAO/WHO/ OIE, 2010). Accordingly, a tripartite concept note was signed between the Director Generals of the three international organisations agreeing to share responsibilities and to coordinate global activities to address health risks for animals, humans and the ecosystem. As outlined previously the size of the free-roaming dog population is affected by the attitudes and behaviours of the community, the availability of resources (food sources) and the enforcement of legislation to control the population. This complex nature of DPM fits into the domain of the one health concept that requires an integrated approach incorporating animal, human and environmental components. All relevant stakeholders should be involved in the development of comprehensive and sustainable DPM strategies that take into account country specifics and include continuous monitoring and evaluation of outcomes. For example, the intersectoral Bohol Rabies Prevention and Elimination Project (BRPEP) launched in 2007 in the Philippines integrated the expertise and resources from the sectors of agriculture, public health, education, environment, legal affairs and local government, and managed to reduce both the number of human and animal cases of rabies to zero in 2009 (Lapiz et al., 2012) Control of reproduction In order to reduce the size of an unwanted roaming dog population in a humane way it is often necessary to reduce the surplus population which is usually achieved by controlling 44
68 or preventing reproduction in dogs. The surplus may either come from owned, un-owned or deliberately bred dogs and all three categories must be taken into account when implementing a dog population control programme. A range of methods can be used to control reproduction including surgical sterilization, chemical or immunological sterilization, contraception or confinement during oestrus (WHO & WSPA, 1990; Rinzin et al., 2008; OIE, 2010; FAO, 2014). Surgical methods Surgical methods are the most popular and common method of reproduction control in dogs (Jackman & Rowan, 2007). Surgery has the primary advantage of being permanent. Castration of male dogs is generally preferred over vasectomies as with the latter method sex-specific behaviours, such as roaming, territory marking and fighting, remain. Females may be surgically sterilized by ovariohysterectomy, ovariectomy, hysterectomy or tubal ligation. Ovariohysterectomy is widely used in CNVR programmes which target the freeroaming dog population in developing countries (Reece & Chawla, 2006; Jackman & Rowan, 2007; Totton et al., 2011). Tubal ligation and hysterectomy are not recommended as the female will be under ovarian hormonal influences and will continue to show sexual behaviours and be at a greater risk of developing pyometra. The advantages and disadvantages of the different surgical methods are summarised in Table
69 Table 2.1 Surgical methods available for the control of reproduction in male and female dogs Method Advantages Disadvantages Males Castration Medium cost; 100% effective Increased risk of cruciate ruptures Vasectomy Sclerosis of epididymis No modification of undesirable Medium cost; male behaviours; androgendependent diseases not prevented 100% effective Low cost; 90% effective Temporary post-operative pain Females Ovariectomy Medium cost; 90% effective Increased risk of pyometra Midline ovariohysterectomy 100% effective Major surgery; high cost Lateral flank ovariohysterectomy Laparoscopic ovariohysterectomy Post operative care reduced 100% effective; minimally invasive surgery, less post operative pain Limited exposure of contralateral side; difficulty in identifying previous ovariohysterectomy incision scar High cost; surgical times and complications rates higher compared with other methods Tubal ligation Medium cost; 100% effective No behaviour modifications; Increased risk of pyometra Adapted from (WHO & WSPA, 1990) and (FAO, 2014) Non-surgical methods Reproduction control utilizing chemical or immunological methods offers a humane and less expensive alternative to surgical sterilization (FAO, 2014). Many of the contraceptives currently available for companion and zoo animals are either too expensive to be used on a large scale, or require a primer dose followed by one or more boosters at specific intervals, which makes them unsuitable for large scale DPM programmes (ACC&D, 2013). A nonsurgical reproduction control approach suitable for large-scale DPM should cause 46
70 permanent loss of fertility and sexual behaviour after administration of a single dose. The treatment should also have no or minimal side effects and be effective in both males and females (ACC&D, 2013; Tasker, 2014). The Companion Animal Unit of WSPA reported an overview of the non-surgical methods for controlling the reproduction of dogs and cats (Tasker, 2014). The Alliance for the Contraception of Dogs and Cats (ACC&D) website also summarises new developments in non-surgical methods of contraception in dogs and cats ( They also published an e-book titled Contraception and Fertility Control of Dogs and Cats which is the reference guide to the growing and dynamic field of non-surgical methods and research to manage reproduction in cat and dogs (ACC&D, 2013). The main chemical contraception and sterilization products currently available and undergoing trials are presented in Table
71 Table 2.2 Current chemical contraception and sterilization products available and undergoing trials Type & product Action/ Indications Treatment Advantages Disadvantages GnRH Agonist Suprelorin Intervet, France Implants inserted subcutaneously under the skin between the shoulder blades Reversible in males once the implant is removed. GnRH Agonist Gonazon Intervet, France GnRH Vaccine GonaCon National Wildlife Resaerch Centre, USDA GnRH Vaccine Canine Gonadotrophin Releasing Factor Immuno-therapeutic Pfizer Animal Health Used for owned male dogs. Halts production and release of luteinizing hormone and follicle stimulating hormones. Reduced testosterone production and circulating levels in the blood Halts sperm production Long term blockage of gonadotrophin synthesis in bitches. Prevents ovulation Eliminates oestrus and oestrus behaviour Induces the body to make antibodies against its own GnRH Stops production of sex hormones (oestrogen and testosterone) in both male and female dogs Induces the body to make antibodies against its own GnRH Stops production of testosterone in male dogs Promotes infertility in males Implants inserted subcutaneously in the region of umbilicus Lasts 1-2 years Reversible on the removal of the implant Single intramuscular injection Suppression of reproduction for 2 to 3 years via a single injection. Effective for both male and female dogs Primary vaccination requires 2 doses given 4 6 weeks apart Vaccine booster is required at 6 monthly intervals No systemic or adverse reactions reported within 14 days of administration during clinical trials. Requires repeat doses High cost per treatment Expensive to produce Local reaction at the injection site even up to 18 to 20 months post dose. Needs several injections. Only effective for six months. Only suitable for owned male dogs. 48
72 Type & product Action/ Indications Treatment Advantages Disadvantages ChemSpay SenesTech Megestrol acetate, Progestogen Ovaban Schering-Plough Progestagen Delvosteron Intervet Zona pellucida vaccine SpayVac Wildlife Inc. Zinc Gluconate (+ Arginine) Neutersol Abbott Laboratories Has potential for female dogs Chemical selectivity depletes primordial and primary follicles in the ovary Postponement of oestrus Treatment for false pregnancy Control of oestrus in female dogs Permanent or temporary postponement of oestrus can be achieved Blocks fertilization. Stimulates female dogs to produce antibodies that adhere to the surface of her eggs. Prevents sperm from binding and blocks fertilization. Cytotoxic Causes atrophy of the testis and prostrate gland Halts sperm production Reduces testosterone production and circulating levels in the blood Currently involves a series of injections. Aims to develop a single injection and oral dose for use in bait. Oral Tablet to be given daily for prescribed time Subcutaneous injection Need to repeat after 3 and 7 months. Injection Single dose has been found to prevent reproduction for up to 3 years in female deer. Intratesticular injection Precise injection into the testis required behind the epididymis Total irreversible ovarian failure Permanent sterilization Eliminates oestrus behaviour Suitable for owned female dogs Suitable for owned female dogs Long term but not permanent. Permanent if used in young male dogs Impact on adult dogs not confirmed. Adapted from WSPA (Tasker, 2014) and Alliance for the Contraception of Dogs and Cats (ACC&D, 2013) Not suitable for owned female dogs if the owner wants to breed their dogs. Side effects if prolonged treatment. Need repeated treatments. Side effects associated with long term use. Need repeated treatment. Lack of impact on reproductive behaviour makes it unsuitable for stray dogs. Not suitable for use in cryptorchid dogs, or dogs with pre-existing scrotal irritation or other problems in the testis. 49
73 2.6 Capture-neuter vaccinate-release (CNVR) programmes Capture-neuter-vaccinate-release (CNVR) programmes, which are also called captureneuter-return (CNR) or animal birth control (ABC) programmes, are widely adopted methods for the management of the dog population in developing countries to address the over population of dogs, as well as to control rabies and other problems associated with a large dog population (Jackman & Rowan, 2007). Under this programme, the street dogs and dogs that are owned are collected/captured, surgically neutered, vaccinated against rabies and then returned back to the location from where they were collected. This approach was adapted from the trap, neuter and return (TNR) programmes for feral cats in the USA (Levy et al., 2003). The TNR model in the USA was successful in controlling the feral cat population and has been formally endorsed by the AVMA and other animal welfare organizations (Hughes et al., 2002; Anonymous, 2015a). The goal of a CNVR programme is to stabilise the street dog population and to control the transmission of rabies. Similar to rabies vaccination programmes, 70% of the population needs to be sterilized to stabilize the population (WHO, 2004). By controlling the population growth and by reducing the mortality rate, CNVR programmes discourage the migration and compensatory breeding of dogs to fill ecological niches left vacant by dog losses (Jackman & Rowan, 2007). Return of sterilized dogs to their home territories prevents a vacuum effect of attracting new dogs to unoccupied territories and also reduces the stress and vulnerability of the returned dogs after surgery. This programme also reduces the number of puppies who have a higher risk of acquiring rabies and other infections (Reece & Chawla, 2006; Totton et al., 2011). Therefore releasing dogs in the streets after 50
74 being sterilized and monitored throughout the years is the best way to prevent population renewal and the spread of diseases including rabies. 2.7 CNVR programmes in developing countries Capture neuter vaccinate release programmes have been implemented in several developing countries including India, Sri Lanka, Thailand, Nepal, Philippines and Bhutan (Jackman & Rowan, 2007). Some CNVR programmes are operated from fixed clinics, while others depend on mobile clinics. Help in Suffering (HIS) and Marwar Animal Protection Trust (MAPT) have fixed clinics with shelter facilities where the dogs are kept for post-operative care (Reece & Chawla, 2006; Totton et al., 2010a). Most CNVR programmes involve surgery on both sexes (Anonymous, 2009; Krishna, 2010; Totton et al., 2011), although the CNVR programme implemented by HIS in Jaipur and Blue Paw Trust in Sri Lanka only covered females and young males (Reece & Chawla, 2006; Blue Paw Trust, 2014). Comparison of selected CNVR programmes is presented Table 2.3. Ear notching was used in all of the CNVR programmes summarized in Table 2.3 to identify free-roaming dogs that had been neutered. Dogs were also treated with anthelmintics and for any presenting health problems. Injectable anaesthetic agents were used in all the programmes as these were cheaper, readily available and easier to use than gaseous anaesthesia. Euthanasia of terminally sick dogs was conducted in most of the programmes. 51
75 Table 2.3 Selected capture neuter vaccinate release (CNVR) programmes in developing countries Organization/ Place/ Start year Help in Suffering (HIS) Jaipur, Rajasthan, India February 1997 Blue Cross of India Chennai, India September 1996 Marwar Animal Protection Trust (MAPT) Jodhpur, India April 2004 Type of clinic Key modalities Monitoring and evaluation Reference/source Fixed clinic with shelter facilities Fixed clinic Fixed clinic with shelter facilities Females and young males covered. Dogs kept overnight in the shelter before and after the surgery. Dogs were caught with hands or with sacks and hoops. Ovariohysterectomy of bitches performed through a right flank incision. Ear notching used to identify the sterilized dogs. Both male and female dogs sterilized. Dogs released on the same day as the surgery. Ear notching used to identify the sterilized dogs. Both male and female dogs sterilized. Dogs kept overnight in the shelter before and after the surgery. Dogs were captured using bag-and-drawstring method. 52 Indicator count at six monthly intervals proportion of sterilized females increased from 0 to 67% in Follow-up mark resight survey indicated that more than 70% of dogs had been sterilized. No rabies outbreaks were reported in humans in Jaipur since Monitoring the trend of rabies in humans from human health records before and after the CNVR programme. Monitoring rabies trends in dogs from animal health records before and after the CNVR programme. Annual mark resight survey - found that 60 to 93% of the dogs had been ear notched. Comparative health studies conducted between neutered and entire dogs with neutered dogs being in better health Reece and Chawla (2006) Krishna (2010) dia/news/the-marwaranimal-protection-trustcanine-population-controland-human-educ Totton et al. (2010a) Totton et al. (2011)
76 Organization/ Place/ Start year Sikkim Anti-rabies and Health Programme (SARAH) joint programme between Vets Beyond Border (VBB) and Sikkim Government Sikkim, India January 2005 Blue Paw Trust Colombo, Sri Lanka June 2007 Type of clinic Key modalities Monitoring and evaluation Reference/source Mobile clinic with temporary shelter Mobile clinic Ovariohysterectomy of bitches performed through a mid-ventral abdominal incision. Ear notching used to identify the sterilized dogs. Both male and female dogs sterilized. Ovariohysterectomy of bitches performed through a right flank incision. Ear notching used to identify the sterilized dogs. Only female dogs covered. Dogs released on the same day as the surgery. condition. N/A Survey conducted in 2007 to serve as a baseline for the future evaluation of the programme. Free-roaming dog population stabilized and gradually decreased. Drastic reduction in the number of human and animal rabies cases. Improvement of the health of dogs through evaluation of the body and skin condition. ders.org/programprojects/sikkim-antirabies-and-animal-healthprogramme-sarah/ (VBB, 2014) min/user_upload/animalwe lfare/case%20study_colo mbo.pdf (Blue Paw Trust, 2014) 53
77 2.8 Monitoring and evaluation of CNVR programmes Monitoring and evaluation of a CNVR programme is necessary to improve the programme s performance, to highlight both problems and successful elements of the intervention and to demonstrate to donors, supporters and people at the receiving end of the intervention that the programme is achieving its aims (ICAMC, 2007). Nevertheless most CNVR programmes undertaken in developing countries do not have proper monitoring and evaluation components, except for programmes conducted in Jaipur and Jodhpur city (Reece & Chawla, 2006; Reece et al., 2008; Totton et al., 2010a; Totton et al., 2011). It is important to select the right list of indicators to reflect the changes that need to be measured in a programme. These indicators need to be accurate measures of the programmes effect and it is essential to have a clear plan of what the programme is setting out to achieve and why, and how the intervention will accomplish this (ICAMC, 2007; FAO, 2014). Monitoring and evaluation of CNVR programmes can be achieved through field population and household surveys, as well as through examination of health records (Matter et al., 2000; Reece & Chawla, 2006; Blue Paw Trust, 2014) Monitoring the size of the dog population Estimating the number of owned and un-owned dogs prior to the implementation of a CNVR programme is crucial for planning, as well as for monitoring the success of the programme. An initial estimate of the population serves as the base line for future comparisons as the programme progresses. In many situations it will also be meaningful to quantify the population density of dogs in terms of area and human population (WHO & WSPA, 1990; Downes et al., 2013). 54
78 Estimating the owned dog population Downes et al. (2013) conducted a systemic review of the different methods used to estimate the size of the owned dog population (Table 2.4). This population can be estimated by multiplying the mean number of dogs per household (obtained from conducting surveys) by the total number of households (obtained from national statistics) (AVMA., 1997; Kitala et al., 2001; AVMA, 2007; Ortega-Pacheco et al., 2007). A less commonly used method involves multiplying the average number of dogs per capita from a survey by the total number of people from the national human statistics (Butler & Bingham, 2000). Anvik et al. (1974) used the Lincoln Petersen index to estimate the owned dog population in Saskatoon, USA based on dog registration records, the number of dogs caught by the city dog catcher and the proportion of registered dogs of all dogs caught by the dog catchers. 55
79 Table 2.4 Methods to estimate the number of owned dogs Study and country Anvik et al. (1974) USA Matter et al. (2000) Sri Lanka Statistical method used to determine the dog population Mark resight method using Lincoln Petersen index Mark resight method using Petersen-Bailey formula Data collection method Advantages Disadvantages marked = registration record of year 1972; recapture sample = number of dogs picked up by the municipal dog catchers based on the registration records; number of marked animals in recapture sample = number of recaptured dogs which were licensed. Marked = dogs brought for vaccination were fixed with collars; recapture sample = dogs enlisted during the household visits; number of marked animals in recapture sample = number of dogs that were found with collars during the household visit. Quick and cost effective since information was taken directly from the official records. This also gives opportunity to estimate the number of unregistered dogs. Simple method that do not require complex statistics. Marking done simultaneously along with vaccination saving time and cost. Several assumptions: dogs were assumed to be picked for violation of leash laws with no bias as to size, age sex or degree of friendliness and licensed dogs were assumed to be mixed in the entire population and that they were no more likely to be caught than un-licensed dogs. Assumption: Dogs that were fixed with collars were not lost during the visit of the survey team. In case of lost there will be an underestimate of the recaptured dogs leading to an overestimation of the dog population size. 56
80 Study and country Caminiti et al. (2014) Italy Lengerich et al. (1992) - USA AVMA. (1997) AVMA (2007) - USA Slater et al. (2008b) - Italy Statistical method used to determine the dog population Mark resight method using Lincoln-Petersen formula with Chapman correction Total number of dogs from the survey multiplied by the inverse of the sampling fraction from the human census Mean number of dogs per dog owning household multiplied by the proportion of dog owning households (from national statistics) Data collection method Advantages Disadvantages Marked = list of dogs in the dog registry; recapture sample = dogs that were enlisted during the face to face interview; number of marked sample in recaptured sample = number of recaptured dogs which were registered in dog registry. Random digit dial telephone survey Mail out survey using commercial list of contacts Randomised telephone survey using a list of numbers Simple method that do not require complex statistics. Less bias since participants for the face to face interview were selected randomly. Simple method that does not require complex statistics Simple method that does not require complex statistics. Over estimation of number of recaptured dogs is possible as the respondents are more likely to answer that dogs were registered than not. This will lead to overestimation of the dog population size. Potential selection and measurement bias Selection bias as households that are not on the commercial list are excluded from the study. Measurement bias as the participants will be aware of what the study is. Butler and Bingham (2000) - Zimbabwe Kitala et al. (2001) Kenya Average number of dogs per capita from the survey multiplied by the number of people from human statistics Mean number of dogs per household multiplied by the Door to door survey Door to door survey Simple method that does not require complex statistics Simple method that does not Costly and time consuming Costly and time consuming 57
81 Study and country Ortega-Pacheco et al. (2007) Mexico Murray et al. (2010) UK Statistical method used to determine the dog population number of households in the area Mean number of dogs per household multiplied by the number of households in the area Logistic regression of the data from the survey to predict dog numbers for each category of household size multiplied by the number of households within each category from national statistics Data collection method Advantages Disadvantages Random digit dial telephone survey in urban area and door to door survey in the rural areas. Randomised telephone survey using a list of numbers. require complex statistics Simple method that does not require complex statistics. Cost effective and improves precision of the population estimates. Selection and measurement bias in the urban areas and costly and time consuming in the rural areas. Selection and measurement bias. 58
82 Estimating the free-roaming dog population The methods used in wildlife have the potential to also be used for estimating the population size of free-roaming dogs. The methods used are described in detail in numerous publications and handbooks (Caughley, 1977; Bookhout, 1994; Sutherland, 2006). The methods that can be specifically applied for dogs are described in the WHO and WSPA Guidelines for Dog Population Management (1990), the WSPA Guidelines for Surveying Roaming Dog Populations (2009), the OIE Terrestrial Animal Health Code (2010) and the FAO Report on Dog Population Management (2014). Different methods used for estimating free-roaming dog population are summarized in Table 2.5. Although estimation of the free-roaming population is one of the most important components of a DPM, surprisingly there are few refereed publications in this area. Both published and unpublished works on this topic are summarized in the next section. 59
83 Table 2.5 Methods used for estimating the free-roaming dog population Author and year Method used in the field Statistical method Advantages Disadvantages Childs et al. (1998) Philippines Kayali et al. (2003) Chad Hiby (2005) Egypt Totton et al. (2010a) India Distance sampling. Measurement of distance of dogs or groups of dogs from the transect line. Mark-resight method. Combination of household surveys and transect walks Population estimates from direct counts. The dogs were counted in the selected blocks. Mark resight method. Dogs marked with vegetable paints from a distance using Aspee Eden 5-1 spray canister. Markrecapture study ran for 5 days. Estimates were done using the program DISTANCE. Various functions modelling the probability of detection were fitted to a truncated distribution of distances of dogs from transect lines. Capture mark recapture approach for population estimates, with a Bayesian, Markov chain, Monte Carlo method to estimate the total number of owned dogs, and the ratio of non-owned to owned dogs to calculate vaccination coverage. Horvitz-Thompson (HT) estimator i.e. combining the number of dogs sighted in the selected blocks and selection probability of the blocks. This estimate was then corrected for the proportion of dogs missed on the counts, estimated from a mark-recapture survey. Schumacher method with 95% confidence limits estimated using the equation of Caughley. 60 Not prone to meeting the model assumptions inherent to mark-recapture estimators. Able to estimate the population size of both owned and nonowned dogs as well as vaccination coverage. Able to estimate the population over a large area. Less bias since the estimates is based on repaeated counts. Costly and time consuming. Requires complex statistics. Requires complex statistics. Requires a good map of the study area to divide it into suitable blocks. Need to do separate mark-resight surveys to confirm the proportion of dogs during the counts. Requires complex statistics
84 Author and year Method used in the field Statistical method Advantages Disadvantages Hiby et al. (2011) Mark resight method No complex statistics India Punjabi et al. (2012) India Dias et al. (2013) - Brazil Amaral et al. (2014) Timor Leste Mark-resight-method Uses natural marks on dogs (as marked) along with count of non-marked individuals in mark-resight framework. Photographic recapture (Becks method) Mark resight method. The counting was done by students who were familiar in their own local area. Records were made of the unique natural marks of dogs which were then used as identifying marks in subsequent surveys. Hiby (2014) - India Counting of dogs along the streets and highways in the wards where the roaming dogs were seen. Express ways were avoided since they did not have street Dividing the size of the marked population by the fraction of the number of dogs that were ear notched. Logit nomal mixed effect estimator. This model incorporates the effects individual resighting heterogeneity. Chapman estimates Chapman estimates in selected aldeias (villages) and then the counts were adjusted using the aldeias sampling fraction within the subdzongkhags that were surveyed. Extrapolating the observed dogs per km by total street length. This estimate was also corrected for the proportion of dogs missed during the street counts as described above. 61 No need to mark the dogs and dogs are observed without disturbing them in their natural habitats which gives a more reliable population estimate. Simple method that does not require complex statistics Simple method that does not require complex statistics. Able to estimate the population in a large geographical area. Simple method that does not require complex statistics. Able to estimate population over a large area. Need to estimate the annual survival rates of the ear notched dogs. Time consuming and involves complex statistics. Costly and time consuming. Not suitable for a large population Chance of misclassification during the second survey as the resight probability was estimated based on the recollection memory of the survey team. Requires GPS equipment and/or GPS enabled phones.
85 Author and year Method used in the field Statistical method Advantages Disadvantages dogs. Tenzin et al. (2015) Bhutan Mark resight method Dogs marked with vegetable colour paints. Lincoln Petersen index Chapman estimates Logit-normal mixed effects model Lincoln and Chapman methods are simple. Logit-mixed effects involves complex statistics. Costly and time consuming to mark dogs. Complex statistics 62
86 2.8.2 Indicator Count An indicator count is a simple count that, under certain assumptions, is expected to increase or decrease as the number of roaming dogs in the area increases or decreases, respectively (Sutherland, 2006; WSPA, 2009). This doesn t give the actual number of roaming dogs in an area but a subsequent repeat count can be compared to the original count to indicate if the number of roaming dogs has changed. The advantage of an indicator count is that it requires fewer resources to complete than a population estimate. Selecting one or more routes across a city or municipality and counting dogs along those routes can provide an indicator count. During an indicator count the number of male and female dogs with and without ear notches, the number of lactating bitches and the number of puppies should be recorded and compared over time. This method was used by the HIS in Jaipur, India over a 9 year period (Reece & Chawla, 2006). In that study counting was done by the same staff between and to minimize counting variables. During the eight year study a decline in the roaming dog population of 28% was reported (annual decline of 3.5%) and the proportion of surveyed females that had been sterilized and vaccinated increased from 0 to 65.7% (Reece & Chawla, 2006). As reproduction in dogs is often seasonal (WSPA, 2009), the number of roaming dogs is likely to change throughout the year. Consequently it is necessary to compare indicator counts taken at the same time of the year. A count approximately six weeks after the peak whelping time will be the most valuable count as this is when the number of pups visible outside the den will be high (WSPA, 2009). 63
87 2.8.3 Monitoring the interventions of owned dogs Studies in Chad (Kayali et al., 2003) and Sri Lanka (Matter et al., 2000) have described a method for estimating the number of non-owned, owned confined and owned unconfined dogs by using collars to temporarily mark owned dogs brought to a temporary clinic for vaccination against rabies. Shortly following the intervention a number of surveys were conducted to count marked and unmarked dogs on the street and a household survey was conducted to determine the fraction of owned dogs that were marked and to obtain information on the confinement of marked and unmarked owned dogs. The same method can be applied to estimate the proportion of owned dogs that are neutered and vaccinated by conducting cross-sectional household surveys. The coverage can be physically verified by examining the animals, as well as from the vaccination cards issued to the owner Monitoring the number of free-roaming dogs during a CNVR programme The counting of free-roaming dogs in the streets at the beginning, middle and at the end of a CNVR campaign is recommended to plan and monitor the programme (WSPA, 2009). The process involves counting male and female dogs with and without ear notches, lactating females and puppies. Before starting the CNVR programme in an area, a team should spend some days performing the survey to identify those areas with higher proportions of un-notched dogs (particularly entire females) so that the catching strategy can be effectively planned, resulting in a better outcome for the programme (by targeting the areas with more entire dogs). The survey in the middle of the campaign can help the team to further identify priority areas for intervention, as well as to refine the CNVR plan while the survey at the end of the campaign will help the team to make an informed decision on the next course of action (WSPA, 2009). 64
88 2.8.5 Other indirect methods to monitor and evaluate a CNVR programme In addition to the field surveys described in the previous section, the success of a CNVR programme can also be indirectly assessed by studying trends in the number of dog bites and outbreaks of rabies in the CNVR areas (Reece & Chawla, 2006; ICAMC, 2007). Information on the number of human cases of dog bites and rabies can be acquired from the human health authorities, while information on rabies outbreaks in animals can be acquired from the relevant animal health authorities. The records of human cases of rabies in the main government hospital of Jaipur city between January 1992 to December 2002 showed that the number of cases of rabies in humans had declined to zero in the ABC programme area but had increased in other areas (Reece & Chawla, 2006). Similarly the number of human deaths due to rabies had reduced to zero in 2008 from 120 deaths in 1996 when the ABC programme in Chennai was commenced (Krishna, 2010). A large reduction in the number of dog bites was also reported in those wards where the ABC programme had been implemented (Krishna, 2010). 2.9 Estimating the free-roaming dog population Most of the methods available for estimating the number of free-roaming carnivores are based on two assumptions (WHO & WSPA, 1990; Sutherland, 2006; WSPA, 2009): (i) mortality, emigration and recruitment into the population is minimal during the period of census or that corrective factors are incorporated into the resultant estimates; and (ii) all individuals within the population have an equal chance of being counted Population estimation by total or direct counts This technique involves the direct visual counting of dogs in a defined geographical area within a limited period of time. The advantage of this method is that data on age 65
89 and sex composition can often be collected at the same time as the population data are collected. This method is described in detail in the WSPA Guidelines for Surveying Roaming Dog Populations (WSPA, 2009). The population estimate using counts may be for an entire city or only for part of a city, such as a specific municipality (WHO & WSPA, 1990; Sutherland, 2006; WSPA, 2009). Counts made in selected regions are combined to estimate the total number of dogs roaming on public property at any one point in time. This number allows statistics, such as the density of roaming dogs per unit of area, to be calculated. Ideally the population estimates need to be made or compared at the same time of the year allowing the significance of any differences to be calculated (WSPA, 2009; Hiby et al., 2011). Although it is impractical to count all the dogs in a large city, it is possible to make an estimate of the total number of dogs roaming within a city s limits. The estimate is obtained by counting all the dogs in a random sample of sub-regions or blocks and extrapolating this count to the whole city, either by dividing the total count by the sampling fraction or relating the sample counts to other variables. By repeating such a survey some time later it may also be possible to detect any change in the number of roaming dogs, even if there has been significant urban development during the intervening period. The specific details on the division of blocks and random selection of blocks, counting techniques and estimation of significance are provided in the WSPA guidelines (WSPA, 2009). In any survey of an animal population, a proportion of animals will be missed. The Capture-Recapture or Mark-Resight/Recapture (MR) method can be used to estimate this missing proportion. This involves calculating the detection probability of the target species in its particular habitat, which can then be used to correct the population 66
90 estimate using other methods of counting, such as line transects or block counts (Hiby, 2005,2014). Individual identification of the target animal(s) is an important requisite for MR studies. In a street dog survey in Cairo, Hiby (2005) estimated that approximately one third of the dogs were missed during the single survey of sampled blocks. Therefore, the single survey count had to be corrected by a factor of 0.33 to approach the true population statistic. Kakati (2010) also conducted a MR study in a randomly selected sub-sample of surveyed blocks in Kathmandu in order to derive a correction factor for their survey. The capture or detection probability of street dogs from the mark-resight study was 0.55 of the dogs in a block during their one-time block count. This indicated that 45% of the dogs were missed during the counts and this value was used to correct the final population estimate Population size estimated from mark-resight surveys The capture- recapture method has a long history of use in ecology and there is now a large body of literature on the statistics of capture-mark-recapture sampling models (Table 2.5) (Caughley, 1977; Bookhout, 1994; Sutherland, 2006). The method commonly used for estimating the free-roaming dog population is the Lincoln-Petersen model (WHO & WSPA, 1990; WSPA, 2009; OIE, 2010). A sample of individuals is captured, marked, and released back into the population. A second sample of individuals is then captured and examined for marks. The idea is that the proportion of all individuals in the second sample with marks should be the same as the proportion of all individuals in the population with marks. If is the total population size and individuals are recaptured or re-sighted then: 67
91 A simple estimator derived from the above equation is: A modified version with less bias is (Chapman estimates): [ ( )( ) ] ( ) The variance of N is (Sutherland, 2006): ( )( )( )( ) ( ) [ ] ( ) ( ) An approximate 95% CI for N is: ( ) The capture-mark-recapture technique was used in the Sorsogon Province of the Philippines to estimate the size of the free-roaming dog population and to assess the effectiveness of different marking methods (Childs et al., 1998). In that study dogs were identified with custom made plastic collars or were marked with water resistant paint at the time dogs were vaccinated against rabies. When the study sites were revisited 1 to 11 days later the proportion of dogs marked with paint was substantially less than those with collars. These authors concluded that collars were the preferred method for marking dogs in that area, and they estimated that the density of dogs in the study area was 450 per km 2. In a study carried out by Matter et al. (2000) in the Mirigama area of Sri Lanka, all the dogs brought to a mobile clinic for vaccination against rabies were identified (marked) 68
92 by applying a synthetic collar. Shortly following the intervention a number of surveys were conducted to count dogs with and those without collars on the streets. A household survey was also conducted to determine the fraction of owned dogs that were marked and information obtained on the confinement of marked and unmarked owned dogs. The estimated density of dogs in the area was 87 dogs per km 2 for owned dogs and 108 dogs per km 2 for both owned and non-owned dogs. Similar methods have been used in N Djamena, Chad where a survey team was sent to register the marked and unmarked dogs in the owned dog population at the household level (Kayali et al., 2003). The number of dogs per km 2 was 1,952 in zone I, 617 in zone II, and 460 in zone III. Amaral et al. (2014) estimated the dog population in the district capital of 13 districts in Timor Leste using mark-resight methodology where the number and specific identifying physical markings and characteristics of the dogs were recorded on the first day by the enumerators who were familiar with the villages. On the second day free-roaming dogs in the same area were counted by the same counter at the same time of the day using the same method. Specific physical markings and characteristics of dogs were used to identify dogs seen on both days. Using this mark resight data the number of freeroaming dogs in selected villages was estimated using the Chapman estimator. To estimate the total number of dogs within each district, counts were adjusted using the village sampling fraction and the proportion of villages within the subdistrict that were actually surveyed Population estimate based on the detection probability If the goal of sampling is to estimate the number, N, of individuals present in an area during the sample count,, of that area, the expected value of C is given by the following formula (McCallum, 2005). 69
93 ( ), where the = population size and = detection probability. Estimator: The use of to estimate the change of over time requires the assumption that a trend in does not exist. Thus a rigorous estimation of p is key to a good estimation of N. Although different methods have been described to estimate p for wildlife, the most common and reliable method for the free-roaming dog population is capture-markrecapture method as described in the previous section (Hiby, 2005; Kakati, 2010). A simple estimator (N) derived from the Lincoln-Petersen index as described in the previous section is: This equation can be rearranged to: If is the count statistic,, and the estimate is, then: Hiby (2014) directly counted dogs in Vadodara in Gujarat, India. In that study 17.5% of the total length of streets and highways in each ward was traversed and the number of dogs observed recorded. The total dog population was then estimated by extrapolating the observed dogs per km for the total street/highway lengths. This estimate was corrected for the detection probability of This value was taken from a study in 70
94 Mumbai where the likelihood that a dog would roam at any time of the day, would be on the streets and would be seen at the time of the survey was provided (Hiby, 2014). There is scope to use this method in small towns by undertaking a rapid survey of street dog counts/ sightings. The total dog population in a town can then be estimated by dividing the number of dogs sighted during the rapid survey by the detection probability estimated from the mark-resight survey in the same area or from that done elsewhere Population size estimated from photographic recapture (Beck s method) It is not necessary to capture and mark animals if they are individually distinguishable (WHO & WSPA, 1990). Photographing individual animals on two or more occasions during surveys can be used to generate data to estimate the recapture proportion. Photographic identification has many advantages over capturing since animals do not become trap prone or trap shy (Beck, 1975; WHO & WSPA, 1990). A sample of individuals is observed and individually photographed and identified by several features and is the total number observed a second time. If is the total population size and individuals are re-observed again (i.e. recognized with identifying marks) then: It is generally better to take multiple observations/reobservations as the ratios are averaged to avoid sampling error (Beck, 1975). Each day, the study area can be surveyed on foot or by vehicle and every dog within a given distance can be photographed and identified. If is the product of each days and ; ( ) is the summation of until that point of time; is the summation of m to that point of time and the estimate of the total dog population is then: 71
95 ( ) Kato et al. (2003) used this method to estimate the size of the stray dog population in Kathmandu, Nepal and in Shimotsui, Japan. In Kathmandu the stray dog density was estimated at 2,930 dogs/ km 2 and the ratio of human to stray dogs was 1 : 4.7. In Shimotsui, the density was 225 stray dogs/ km 2 and the human to stray dog ratio 1 : 5.2. Dias et al. (2013) used a combination of photographic recapture and the Chapman calculation method to estimate the free-roaming dog population in the University of Sao Paulo campus, Brazil. The estimated size of the stray dog population on the campus varied from 32 (95% CI 23 56) to 56 (95% CI 45 77). Punjabi et al. (2012) used the natural marks on dogs along with counts of unmarked individuals in a mark-resight framework to estimate the abundance of free-roaming dogs in a suburban area of Mumbai, India. Using the logit normal mixed effects estimator to incorporate the effects of individual heterogeneity, the population size of free-roaming dogs was estimated to be 681 (95% CI ) Population size estimated from the capture of permanently marked dogs A reliable population estimate can be achieved with limited resources by taking advantage of the large number of marked individuals resulting from a CNVR programme (WSPA, 2009; Hiby et al., 2011). A study in N Djamena in Chad, using household and street surveys to record the percentage of dogs with collars that had been applied during a mass vaccination campaign, was able to estimate the dog population (Kayali et al., 2003). The same principle can be applied to dogs that are ear notched during a CNVR programme over much longer periods by allowing for an estimated rate of mortality in these dogs. During the survey all the dogs with and without marks should be counted and recorded. The fraction of dogs seen on the street that are marked 72
96 can then be used to estimate the total number of dogs roaming at any one time (Hiby et al., 2011). The complication here is that as dogs are marked over a period of time, some will have died, hence the number of marked dogs remaining at the end of the period is unknown. One option is to use an independent estimate of survival (from published literature) of marked dogs to calculate the number still alive from records of when and where each marked dog was released. In this case, the estimate of the total number of adult roaming dogs is the number of marked dogs calculated to have survived to the end of the period divided by the fraction of marked dogs seen on the streets (WSPA, 2009; Hiby et al., 2011). If the total number of roaming dogs is denoted by R and the number of surviving ear-notched dogs by r, then the expected percentage, p, of ear-notched dogs in a random sample of dogs observed during the survey equals 100r R, Hence at any given time, the total roaming dog population, R, will be 100r p. Hiby et al. (2011) successfully used this method to estimate the dog population in three cities in Rajasthan, India which had CNVR programmes for varying lengths of time. The method to estimate the annual survival of the permanently marked free-roaming dogs has been described in several manuscripts (WSPA, 2009; Hiby et al., 2011) Conclusions In this chapter the major problems arising from free-roaming dogs and factors that affect the size of this population were reviewed and discussed. This chapter also reviewed various CNVR programmes implemented in different countries, including the monitoring and evaluation of such programmes. Recognizing the importance of estimating the size of the free-roaming dog population, various methods used for estimating this population were reviewed and discussed. In the following chapters, the results of a series of cross-sectional household and field population surveys are 73
97 provided in order to monitor and evaluate the current CNVR programme in Bhutan and to understand the attitudes of the community towards dogs. 74
98 CHAPTER THREE A survey to determine the knowledge, attitude and practices (KAP) of the community towards control of the dog population and rabies in Bhutan 3.1 Introduction In many developing countries, including Bhutan, there are large numbers of freeroaming dogs (Childs et al., 1998; Kitala et al., 2001; Kato et al., 2003; Jackman & Rowan, 2007). Although these can be well tolerated by the community, there are welfare and public health issues arising from this population as outlined in Chapter 2. Rabies was prevalent in most parts of Bhutan until the early 1990s, but has been controlled by the restrictive elimination of dogs and ad hoc sterilization and vaccination campaigns (NCAH, 2006) and currently disease is endemic only in the southern border Dzongkhags (Rinzin et al., 2006; Tenzin. et al., 2010). From 1996 to 2009, a total of 814 cases of rabies were reported in domestic animal species, of which cattle and dogs accounted for 55 and 39% of the cases, respectively (Tenzin et al., 2011c). From 2006 to 2011, 18 human deaths due to rabies (3 in 2006, 0 in 2007, 2 in 2008, 2 in 2009, 3 in 2010, 5 in 2011, 0 in 2012, 1 in 2013 and 0 in 2014) were reported in Bhutan (BHMIS, 2012). Dog bites in humans are a serious public health problem and have been well documented worldwide (Bernardo et al., 2002; Feldman et al., 2004; Gilchrist et al., 2008; Brooks et al., 2010; Cornelissen & Hopster, 2010; Hossain et al., 2013). A survey of dog bites conducted in three hospital catchment areas in Bhutan reported an annual dog bite incidence of 869.8, and per 100,000 human population in Gelephu, Phuentsholing and Thimphu, respectively (Tenzin et al., 2011b). The key strategies to 75
99 control the population of free-roaming dogs include reproductive control, habitat control and legislative measures. The latter measures encourage responsible dog ownership through the registration of dogs, restriction on the number of dogs that can be owned, providing food and shelter to the dogs and requirements to confine owned dogs (WHO & WSPA, 1990; ICAMC, 2007; OIE, 2010; FAO, 2014). Human attitudes and behaviour is likely to be the most powerful force behind dog population dynamics (ICAMC, 2007; FAO, 2014). Moreover, successful dog population control is only achievable through the active involvement and participation of the community. Therefore understanding the knowledge, attitudes and practices (KAP) of the community towards the control of rabies and the dog population is essential to successfully implementing a dog population control programme. Studies have been undertaken in Cambodia (Lunney et al., 2012), India (Herbert et al., 2012; Prakash et al., 2013), Philippines (Davlin et al., 2014), Sri Lanka (Matibag et al., 2007; Matibag et al., 2009) and Nigeria (Ameh et al., 2014) to understand the community knowledge, attitudes and practices on rabies and its prevention. Most of these studies demonstrated a high level of awareness on rabies by the surveyed participants. In contrast, their awareness on the prevention of rabies was low. Some studies specifically tried to assess the KAP of the community to dog bites and the treatments sought following a dog bite (Agarwal & Reddajah, 2004; Lunney et al., 2011; Farnworth et al., 2012; Hergert & Nel, 2013) and other studies have assessed the KAP of specific groups, such as physicians (Koruk et al., 2011; Nayak et al., 2013), tourists (Altmann et al., 2009; Piyaphanee et al., 2010) and children (Dixon et al., 2012), to rabies and dog bites. However only a few studies have been published to determine the KAP of the community to the management and control of a dog population (Slater et al., 2008a; Fielding et al., 2012; Hergert & Nel, 2013). 76
100 Only one study has previously been undertaken in Bhutan (in a small sub-dzongkhag located in South-Central Bhutan) to investigate the KAP of the community to rabies and dog bites (Tenzin et al., 2012). That particular study was conducted in an area where rabies was endemic and the findings may not necessarily be applicable to other areas of Bhutan where rabies is less frequently reported. Although outbreaks of rabies have been reported in animals throughout the country, the disease is now only prevalent in the southern border Dzongkhags because of the rabies control programme implemented by the Bhutanese Government. However, there are still a large number of free-roaming (FR) dogs in Bhutan, which result in the problems listed previously. In view of this, a nationwide dog population management and rabies control programme was implemented in Bhutan to reduce the size of the FR dog population to a manageable level, as well as to minimise and hopefully eliminate rabies originating from dogs from the country. Understanding the KAP of the people towards dog population control is important so that community participation can be encouraged through education. The objectives of the study reported in this chapter were to determine the KAP of the community regarding the dog population and rabies control in Bhutan and to examine factors associated with the KAP scores. 3.2 Materials and Methods Study population and sampling A cross sectional household survey was undertaken in six Dzongkhags (Bumthang, Samtse, Samdrupjongkhar, Trashigang, Thimphu and Tsirang Figure 3.1). These Dzongkhags were located in different agro-ecological zones representing the different regions of Bhutan. Rabies is prevalent in Samtse, Samdrupjongkhar and Trashigang but 77
101 absent from the other three Dzongkhags. Households from both rural and urban settlements were selected in proportion to the population size in the relevant area/region. In the rural areas a two stage cluster sampling method was used where two villages were randomly selected from each sub-dzongkhag of the six Dzongkhags. From each selected village a member from five households were then interviewed. In towns the households were chosen using a rolling sample method in which the first selected household provided information about the next available household in the area or within the building until the required number of household respondents had been interviewed in the respective study areas. However, it was ensured that a representative sample was selected from all geographical locations in the towns Sample size Assuming that 65% of the respondents from urban areas and 50% of the respondents from rural areas have knowledge on rabies and the control of the dog population, it was estimated a sample size of 200 and 301 participants from urban and rural areas, respectively, were required to detect a statistically significant difference between urban and rural respondents with a 95% confidence level and a 90% power. Sample size was calculated using epir package in R (R Development Core Team, 2010). Thirty-eight school teachers were also included in this survey of which 33 worked in the rural areas (Table 3.1). These teachers were the focal person for health in their schools and attended the training programme on zoonoses (with an emphasis on rabies) in Gelephu in January
 and items relating to")
102 Figure 3.1 A Dzongkhag map of Bhutan. The red dots indicate the study areas Questionnaire design and administration The questionnaires included both closed and open questions. Questions covered topics relating to the respondents and their socio-demographic information (age, gender, occupation, place of living, dog ownership status and dwelling type) and items relating to rabies and dog population control (rabies and its prevention, various problems caused by free-roaming dogs including dog bites, stray dog population control and welfare of stray dogs) (Appendix 1). The questionnaires were pre-tested on seven individuals who were representative of the communities before the actual survey was conducted for question validity. The questionnaires were modified slightly and then administered to the target audience. The interviewers were given one day of training and were continuously monitored during the household survey to avoid interviewer bias. Face-toface interviews of one member, who was at least 18 years of age, from the selected households were performed. Prior to the interview a verbal explanation of the project was given and the verbal consent of the participants obtained. The questionnaire survey was conducted in the local language (Dzongkha). This study had been approved by the Human Research Ethics Committee of Murdoch University (approval number 2011/160). 79
103 Table 3.1 Characteristics of the household respondents interviewed in the urban and rural areas of Bhutan in 2012 (n = 521) Variable Total Urban Rural n (%) n (%) n (%) χ² df p-value Gender Male 342 (65.6) 126 (63.0) 216 (67.3) Female 179 (34.4) 74 (37.0) 105 (32.7) Age (12.3) 40 (20.7) 23 (7.2) < (28.1) 83 (43.0) 61 (19.1) (25.4) 44 (22.8) 86 (27.0) (20.5) 19 (9.8) 86 (27.0) Above (13.7) 7 (3.6) 63 (19.7) Dzongkhag Bumthang 60 (11.5) 20 (10.0) 40 (12.5) <0.001 Samdrupjongkhar 71(13.6) 21 (10.5) 50 (15.6) Samtse 75 (14.4) 24 (12.0) 51 (15.6) Thimphu 106 (20.3) 69 (34.5) 37 (11.5) Trashigang 91 (17.5) 31 (15.5) 60 (18.7) Tsirang 81 (15.5) 30 (15.0) 51 (15.9) *Others 37 (7.1) 5 (2.5) 32 (10.0) Presence or absence of rabies in the Dzongkhag Present 251 (48.2) 78 (39.0) 173 (53.9) <0.001 Absent 270 (51.8) 122 (61.0) 148 (46.1) Profession Business 37 (7.1) 28 (14.2) 9 (2.8) <0.001 Domestic 24 (4.6) 18 (9.1) 6 (1.9) Farmer 286 (55.2) 21 (10.7) 265 (82.5) Office 117 (22.6) 112 (56.9) 5 (1.6) Teacher 38 (7.4) 5 (2.5) 33 (10.3) Other 16 (3.1) 13 (6.6) 3 (0.9) House Type Modern Bungalow 69 (13.3) 37 (18.6) 32 (10.0) <0.001 Flat 110 (21.2) 96 (48.2) 14 (4.4) Traditional house 304 (58.5) 55 (27.6) 249 (77.6) Hut 38 (7.1) 12 (5.5) 26 (8.1) Missing data 1 Dog ownership No 280 (53.9) 131 (65.5) 149 (46.7) <0.001 Yes 239 (46.1) 69 (34.5) 170 (53.3) *Others Dagana, Sarpang, Zhemgang and Trashi Yangste, A total of 38 teachers from these Dzongkhags who attended the zoonoses workshop in Gelephu in January 2012 were included in the study. 80
104 3.2.4 Data management and analysis Data were manually entered into a database developed in MS Access. Data management and analyses were carried out in MS Excel and Statistical software R (R Development Core Team, 2013). Descriptive statistics were generated for each variable of interest. Bivariate analyses were performed using χ² tests of independence to compare response to questions relating to the knowledge, attitudes and practices towards rabies and dog population control between respondents from rural and urban areas. A p value of < 0.05 was considered statistically significant. Knowledge scores were computed based on seven questions relating to knowledge on rabies and dog population control (Table 3.2). The number of questions for which each respondent gave a positive response (yes) was totalled and this score was then categorised based on the median scores. Respondents with a knowledge score greater than the median score were considered to have good knowledge (score index >4 coded as 1) while those respondents with a knowledge score equal to or lower than the median score were categorized as having poor knowledge (score index 4 were coded as 0). Similarly, attitude scores were calculated based on seven items relating to attitudes towards dog population control (Table 3.3). Those respondents with an attitude score greater than the median score (>5) were categorized as positive and those with a score less than or equal to the median score ( 5) were categorised as having negative attitudes towards dog population control. Bivariate analyses were performed to evaluate the association between the demographic and socio-demographic variables (explanatory variables) with categorized knowledge as well as attitude scores (outcome variable). Binary logistic regression models were developed to evaluate the association of the relevant outcome variable with the 81
105 explanatory variables. All variables with bivariate p-values < 0.25 were included in the initial logistic regression model. Stepwise backwards selection including all possible variables were performed using likelihood ratio tests and Akaike Information Criterion (AIC) to determine the final predictive models. Variables were retained in the final model if the likelihood ratio test was significant (p 0.05) or if the β-coefficient of any of the other covariates changed by 10% upon removal of the covariate. Odds ratios and their 95% confidence intervals were calculated for the final models. Goodness of fit was also examined for each final model using the Hosmer and Lemeshow goodness-offit test (Hosmer & Lemeshow, 2000). Table 3.2 Assessment of the knowledge on rabies and dog population control in Bhutan Knowledge item Frequency % Heard about rabies Yes No Aware that stray dogs are the main source of rabies Yes No Knows the signs of rabies in dogs Yes No Aware that rabies in dogs can be prevented by vaccination Yes No Aware of the rabies and dog population control programme Yes No Heard of animal welfare groups in Bhutan Yes No Aware of the regulations on dog population control and animal welfare Yes No
106 3.3 Results Demographics of the respondents A total of 521 households (respondents) were interviewed in this survey comprising 200 (38.4%) urban households and 321 (61.6%) rural households (Table 3.1). Approximately one third of the respondents (n = 179; 34.4%) were females and 65.6% (n = 342) were males. The majority of the respondents in the urban areas were in the age group years (43%), whereas most of the respondents in the rural areas were in the age groups years (27%) and years (27%). With exception of gender, there were significant differences between the characteristics of the respondents (demographic and socio-demographic variables) for the two locations (urban and rural) (Table 3.1). More respondents from the urban areas worked as a Government or a Corporate Employee (59.4%) compared with only 11.8% in rural areas. In contrast, and not surprisingly, more respondents from the rural areas were farmers (82.6%) compared with only 10.7% in urban areas. A higher proportion of respondents in the rural areas owned dogs (53.3%) compared with respondents from the urban areas (34.5%). Most of the respondents in the rural areas lived in traditional houses (77.6%), whereas the majority of urban respondents lived in flats (48.2%) Knowledge of participants about rabies The results of the bivariate analyses to questions relating to rabies prevention in the urban and rural areas are presented in Table 3.4. The majority of the respondents (94.6%) had previously heard about rabies, although only 60.7% reported that they knew the clinical signs of the disease. Most (94.3%) respondents considered that stray dogs were the main source of rabies; however only 53.2% knew that rabies in dogs could be prevented by vaccination. In contrast, most (83%) respondents were aware of the sterilization and vaccination campaigns for dogs undertaken by the Government. 83
107 There were significant differences between the response of participants from rural and urban areas with respect to their awareness of rabies (p = 0.004) and the measures undertaken to control rabies (p < 0.001) (Table 3.4). Table 3.3 Assessment of the public attitudes towards dog population control in Bhutan Attitudes item Frequency % Believe that stray dogs are a problem to the society Yes No Believes that the stray dogs are a threat to human health Yes No Would wash a dog bite wound and go to hospital Yes No Believe that the dog population should be controlled Yes No Believe that the terminally sick dogs should be euthanized Yes No Would assist the dog population control programme Yes No Believe that there should be an animal welfare law Yes No
108 3.3.3 Attitudes and practices towards stray dogs The descriptive data and results of the bivariate analyses for responses to questions relating to various problems due to stray dogs are summarised in Table 3.5. Overall 20.4% of respondents considered dogs were annoying and 70.0% considered them a problem to the society. Only 7.8% of the respondents reported stray dogs to be either lovable (3.6%) or useful (4.2%). Over 81% of respondents reported problems arising from stray dogs during the three months prior to the survey of which noise (43.8%) was the most common problem reported followed by fear of rabies (16.7%), pollution to the environment (8.6%) and aggressiveness (6.2%). Most respondents (77.4%) reported that stray dogs posed a threat to human health. Approximately 10% of the respondents reported that they or a family member had been bitten by a dog in the past one year with unowned neighbourhood dogs being responsible for 36.6% of these bites followed by dogs belonging to neighbours (31.7%), unidentified strange dogs (22.0%) or by their own dogs (9.8%). Most of the dog bite victims (84.3%) visited the hospital after washing the wound and 12.7% of the victims reported washing of the dog bite wound with soap and water. A significantly higher proportion of participants from the urban areas (13.1%) reported having been bitten by a dog compared with participants from rural areas (7.5%) (χ² = 4.348, df = 1, p = 0.037). However, there were no differences between the response of participants from rural and urban areas with respect to actions taken by the victims following a dog bite (p > 0.05). 85
109 Table 3.4 Descriptive data and bivariate χ² analysis of responses to questions relating to rabies and its control for the respondents living in rural and urban areas of Bhutan (n = 521) Variable Total Urban Rural n (%) n (%) n (%) χ² p-value Have you heard about rabies? No 28 (5.4) 2 (1.0) 26 (8.1) <0.001 Yes 492 (94.6) 197 (99.0) 295 (91.9) Missing data 1 What do you think is the main source of rabies? Cats 4 (0.6) 2 (1.0) 1 (0.3) Street Dogs 465 (94.3) 186(94.4) 279 (94.3) Wild animals 4 (0.8) 1 (0.5) 3 (1.0) Others 14 (2.8) 7 (3.6) 7 (2.4) Not known 7 (1.4) 1 (0.5) 6 (2.0) Missing data 28 Do you know the signs of rabies? No 203 (39.3) 68 (34.5) 135 (42.2) Yes 314 (60.7) 129 (65.5) 185 (57.8) Missing data 4 Do you know if rabies in dogs can be prevented by vaccination? No 242 (46.8) 88 (44.4) 154 (48.3) Yes 275 (53.2) 110 (55.6) 165 (51.7) Missing data 4 Are you aware of any actions taken by the Government to control rabies? No 68 (13.1) 30 (15.0) 38 (11.8) <0.001 Sterilization and vaccination 432 (82.9) 153 (76.5) 279 (86.9) Others 21 (4.0) 17 (8.5) 4 (1.2) Missing data 4 86
110 Table 3.5 Descriptive data and bivariate χ² analysis of the response to questions relating to various problems caused by the stray dogs for the respondents living in rural and urban areas of Bhutan (n = 521) Variable Total Urban Rural n (%) n (%) n (%) χ² p-value What do you think of stray dogs? Annoying 103 (20.4) 49 (24.9) 54 (17.5) Lovable 18 (3.6) 8 (4.1) 10 (3.2) Problems for the society 354 (70.0) 129 (65.5) 225 (72.8) Useful 21 (4.2) 8 (4.1) 13 (4.2) Others 10 (2.0) 3 (1.5) 7 (2.3) Missing data 15 In the last three months, have you had any problems because of stray dogs? Aggressiveness 30 (6.2) 7 (3.6) 23 (7.5) <0.001 Fear of rabies 83 (16.7) 37 (19.2) 46 (15.1) Noise 218 (43.8) 101 (52.3) 117 (38.4) Pollution of environment 43 (8.6) 15 (7.8) 28 (9.2) More than one problem 19 (3.8) 13 (6.7) 6 (2.0) Others 10 (2.0) 6 (3.1) 4 (1.3) No problem 95 (19.1) 14 (7.3) 81 (26.6) Missing data 23 Do you think stray dogs are a threat to human health? No 41 (7.9) 10 (5.1) 31 (9.7) Not sure 76 (14.7) 23 (11.7) 53 (16.5) Yes 401 (77.4) 164 (83.2) 237 (73.8) Missing data 3 Have any members of your family been bitten by any dog in the last 12 months? No 466 (90.3) 172 (86.9) 294 (92.5) Yes 50 (9.7) 26 (13.1) 24 (7.5) Missing data 5 If bitten, whose dog was it? By your own dog 4 (9.8) 4 (17.4) 0 (0.0) Neighbour s dogs 13 (31.7) 5 (21.7) 8 (44.4) Unowned neighbourhood dogs 15 (36.6) 10 (43.5) 5 (27.8) Unidentified strange dogs 9 (22.0) 4 (17.4) 5 (27.8) No information 9 What actions would you take if you were bitten by a dog? Wash wound with soap & 59 (12.7) 23 (12.2) 36 (12.9) water Wash wound and go to hospital 393 (84.3) 161 (85.6) 232 (83.5) Consult local healers 10 (2.1) 1 (0.5) 9 (3.2) Do nothing 4 (0.9) 3 (1.6) 1 (0.4) Missing data 55 87
111 3.3.4 Attitudes and practices towards the population control of stray dogs The descriptive data and bivariate analyses of the responses to questions relating to the control of the stray dog population by participants is summarised in Table 3.6. Approximately half of the respondents (51.4%) believed that the source of the stray dogs was from within the community, whilst only 12.6% considered that stray dogs originated from other places, with 36% uncertain of their origin. About half of the respondents (48.1%) believed that the population of stray dogs was increasing, compared to 29.7% who considered the population was decreasing and only 19.4% who considered the population was static. Approximately two-thirds of the participants (59.7%) considered there were too many stray dogs in their area. Most participants (84.1%) were in favour of controlling the population of stray dogs. Of the control methods, 84.1% of the interviewees favoured birth control with only 1.8% favouring the destruction of stray dogs. Twenty-six percent of the respondents reported that they would agree to the euthanasia of terminally sick dogs, whereas 31.2% would not agree to this and 42.8% participants were unsure if terminally ill dogs should be euthanized or not. Approximately half (51.8%) of the respondents or one of their family members reported having assisted the dog population control programme initiated by the Government. There were significant differences between the response of participants from urban and rural areas with respect to perceptions on the trend in the stray dog population and population control methods, perceptions of euthanasia of terminally sick dogs and on the provision of assistance during the execution of the dog population control programme by the Government officials in their locality (Table 3.6). 88
112 Table 3.6 Descriptive data and bivariate χ² analyses of the response to questions relating to the control of stray dog population for the respondents living in rural and urban areas of Bhutan (n = 521) Variable Overall Urban Rural n (%) n (%) n (%) χ² p-value What do you think is the source of stray dogs? Within the community 264 (51.4) 109 (56.2) 155 (48.4) Other places 65 (12.6) 17 (8.8) 48 (15.0) Not sure 185 (36.0) 68 (35.1) 117 (36.6) Missing 7 What do you think is happening to the size of the stray dog population? Decreasing 153 (29.7) 35 (17.8) 118 (37.0) <0.001 Increasing 248 (48.1) 124 (62.9) 124 (38.9) Remaining static 100 (19.4) 32 (16.2) 68 (21.3) Not sure 15 (2.9) 6 (3.0) 9 (2.8) Missing data 5 Do you think there are too many stray dogs in your area? No 210 (40.3) 55 (27.5) 155 (48.3) <0.001 Yes 311 (59.7) 145 (72.5) 166 (51.7) Do you think the stray dog population should be controlled? No 9 (1.7) 1 (0.5) 8 (2.5) Not sure 73 (14.2) 21 (10.7) 52 (16.3) Yes 433 (84.1) 174 (88.8) 259 (81.2) Missing data 6 What would be the best method to control the stray dog population? Birth Control 376 (84.1) 154 (86.5) 222 (82.5) Impounding 38 (8.5) 12 (6.7) 26 (9.7) Killing 8 (1.8) 3 (1.7) 5 (1.9) Combination of measures 25 (5.6) 9 (5.1) 16 (5.9) Missing data 74 Should we euthanase terminally sick dogs? No 156 (31.2) 43 (22.9) 113 (36.2) <0.001 Not Sure 214 (42.8) 81 (43.1) 133 (42.6) Yes 130 (26.0) 64 (34.0) 66 (21.2) Missing data 21 Have you or any member in your household assisted the dog population control programme initiated by the Government in your locality? No 246 (48.2) 116 (59.5) 130 (41.3) <0.001 Yes 264 (51.8) 79 (40.5) 185 (58.7) Missing data 11 89
113 3.3.5 Attitudes and perception towards the welfare of the stray dogs The descriptive data and bivariate analyses of the responses to questions relating to the welfare of stray dogs are presented in Table 3.7. Approximately half of the respondents considered the general health conditions of the local dogs were reasonable (53.5%), with approximately one third considering their condition to be poor (31.3%) and the remaining 15.2% classified dogs as of good health. The common health problems identified by participants in the stray dogs were skin diseases (54.6% of participants), malnutrition (10.2%), parasitic infections (2.8%), reproductive health problems (2.2%) and injury (1.8%). Over half of the participants (57.9%) reported having fed stray dogs either daily or occasionally. Only 22.2% of the respondents were aware of the presence of animal welfare groups in the country and only 18% reported that they were aware of the animal welfare law/regulations of Bhutan. The majority of respondents (66.9%) believed that Bhutan should have an animal welfare law. 90
114 Table 3.7 Descriptive data and bivariable χ² analyses of the response to questions relating to the welfare of stray dogs for the respondents living in rural and urban areas of Bhutan (n = 521) Variable Total Urban Rural n (%) n (%) n (%) χ² p-value In your opinion what is the health condition of stray dogs in your neighbourhood? Bad 158 (31.3) 56 (28.6) 102 (33.0) Reasonable 270 (53.5) 115 (58.7) 155 (50.2) Good 77 (15.2) 25 (12.8) 52 (16.8) Missing data 16 What do you think are the main health problems of stray dogs? Skin Disease 278 (54.6) 111 (56.9) 167 (53.2) Reproductive health problems 11 (2.2) 7 (3.6) 4 (1.3) Malnutrition 52 (10.2) 20 (10.3) 32 (10.2) Parasite infection 14 (2.8) 2 (1.0) 12 (3.8) Injury 9 (1.8) 1 (0.5) 8 (2.5) More than one health problem 100 (19.6) 46 (23.6) 54 (17.2) No problems 45 (8.8) 8 (4.1) 37 (11.8) Missing data 12 How often would members of your household feed a stray dog? Daily 55 (10.7) 26 (13.2) 29 (9.2) <0.001 Occasionally 242 (47.2) 130 (66.0) 112 (35.4) Never 216 (42.1) 41 (20.8) 175 (55.4) Missing 8 Are you aware of any animal welfare groups in the country? No 399 (77.8) 127 (65.5) 272 (85.3) <0.001 Yes 114 (22.2) 67 (34.5) 47 (14.7) Missing data 8 Are you aware of any animal welfare law in the country? No 196 (38.0) 54 (27.6) 142 (44.4) <0.001 Not Sure 225 (43.6) 99 (50.5) 126 (39.4) Yes 95 (18.4) 43 (21.9) 52 (16.2) Missing data 5 Do you think Bhutan should have an animal welfare law? No 19 (3.7) 5 (2.6) 14 (4.4) <0.001 Not Sure 151 (29.4) 39 (19.9) 112 (35.2) Yes 344 (66.9) 152 (77.6) 192 (60.4) Missing data 7 91
115 3.3.6 Factors associated with community knowledge on rabies and dog population control. Various demographic and socio-demographic characteristics were found to be associated with the participant s knowledge score (Table 3.8). When adjusted for other variables in the final model, respondents who were: an employee of the Government or a Corporate Organisation (OR = 2.45, 95% CI ) and other professions (OR = 9.26, 95% CI ); between the age of 26 and 35 years (OR = 2.26; 95% CI ); or male (1.56; 95% CI ) were more likely to have a good knowledge on rabies and dog population control (Table 3.10). In contrast respondents from Samdrupjongkhar (OR = 0.30, 95% CI ) were less likely to have a sound knowledge on rabies and dog population control compared with respondents from other Dzongkhags. The final model generated was a good fit of the data with p = based on the Hosmer-Lemeshow goodness-of-fit test Factors associated with community attitudes towards control of the dog population and rabies Various demographic and socio-demographic characteristics associated with the attitude scores are presented in Table 3.9. The final model predicted that respondents from the rural areas (OR = 0.54, 95% CI ) had negative attitudes towards stray dog population control (Table 3.11). Male respondents (OR = 1.80, 95% CI ) were more likely to have positive attitudes towards dog population control. The model represented a good fit of the data (Hosmer-Lemeshow goodness-of-fit test, p = 0.733). 92
116 Table 3.8 Association of demographic and socio-demographic variables with categorized knowledge scores of rabies and dog population control in Bhutan Variable Categorised knowledge scores Good Poor Odds Ratio (95% CI) P-Value Gender Female 69 (39.7) 105 (60.3) Male 155 (47.1) 174 (52.9) 1.35 ( ) Age (years) (43.5) 35 (56.5) (55.0) 63 (45.0) 1.57 ( ) (43.0) 73 (57.0) 0.97 ( ) (33.7) 69 (66.3) 0.66 ( ) Above (43.5) 39 (56.5) 0.99 ( ) Profession Business 13 (36.1) 23 (63.9) Domestic 10 (41.7) 14 (58.3) 1.26 ( ) Farmer 104 (37.3) 175 (32.7) 1.04 ( ) Office* 66 (58.9) 46 (41.1) 2.51 ( ) Teachers 20 (55.6) 16 (44.4) 2.18 ( ) Others 11 (68.8) 5 (31.2) 3.74 ( ) Dzongkhag Bumthang 25 (43.9) 32 (56.1) Samdrupjongkhar 16 (23.5) 52 (76.5) 0.40 ( ) Samtse 32 (43.8) 41 (56.2) 1.00 ( ) Thimphu 54 (53.5) 47 (46.5) 1.47 ( ) Trashigang 45 (51.1) 43 (48.9) 1.34 ( ) Tsirang 32 (39.5) 49 (60.5) 0.84 ( ) Others 20 (57.1) 15 (42.9) 1.69 ( ) Presence or absence of rabies in the Dzongkhag Absent 121 (46.5) 139 (53.5) Present 103 (42.4) 140 (57.6) 0.84 ( ) House Type Flat 32 (47.8) 35 (52.2) Hut 52 (48.6) 55 (51.4) 0.58 ( ) Modern bungalow 128 (43.4) 167 (56.6) 0.96 ( ) Traditional house 12 (35.3) 22 (64.7) 0.81 ( ) Location Urban 99 (52.1) 91 (47.9) Rural 125 (39.9) 188 (60.1) 0.61 ( ) Dog ownership No 92 (39.8) 139 (60.2) Yes 132 (48.5) 140 (51.5) 0.70 ( ) *Employee of the Government or a Corporate Organization 93
117 Table 3.9 Association of demographic and socio-demographic variables with categorized attitude scores of rabies and dog population control in Bhutan Variable Categorized attitude scores Positive Negative Odds Ratio (95% CI) P-Value Gender Female 43 (24.7) 131 (75.3) Male 115 (34.8) 215 (65.2) 1.62 ( ) Age (years) (35.5) 40 (64.5) (35.5) 91 (64.5) 0.97 ( ) (31.2) 88 (68.8) 0.80 ( ) (19.0) 85 (81.0) 0.42 ( ) Above (37.7) 43 (62.3) 1.07 ( ) Profession Farmer 72 (25.5) 210 (74.5) Business 8 (22.2) 28 (77.8) 0.84 ( ) Domestic 8 (34.8) 15 (65.2) 1.57 ( ) Office* 49 (44.1) 62 (55.9) 2.30 ( ) <0.001 Teachers 15 (41.7) 21 (58.3) 2.08 ( ) Others 6 (37.5) 10 (62.5) 1.76 ( ) Dzongkhag Bumthang 16 (28.1) 41 (71.9) Samdrupjongkhar 14 (20.3) 55 (79.7) 0.65 ( ) Samtse 22 (30.1) 51 (69.9) 1.10 ( ) Thimphu 36 (35.3) 66 (64.7) 1.39 ( ) Trashigang 24 (27.3) 64 (72.7) 0.96 ( ) Tsirang 32 (40.0) 48 (60.0) 1.69 ( ) Others 14 (40.0) 21 (60.0) 1.70 ( ) Presence or absence of rabies in the Dzongkhag Absent 92 (35.4) 168 (64.6) Present 66 (27.0) 178 (73.0) 0.68 ( ) House Type Flat 38 (36.2) 67 (63.8) Hut 11 (33.3) 22 (66.7) 0.89 ( ) Modern bungalow 29 (43.3) 38 (56.7) 1.34 ( ) Traditional house 80 (26.8) 219 (73.3) 0.64 ( ) Location Urban 75 (39.9) 113 (60.1) Rural 83 (26.3) 233 (73.7) 0.54 ( ) Dog ownership No 82 (30.2) 189 (69.8) Yes 76 (32.6) 157 (67.4) 1.11 ( ) *Employee of the Government or Corporate Organizations 94
118 Table 3.10 Final multivariable logistic regression model of factors associated with community knowledge of rabies and dog population control in Bhutan Variable Coefficient SE p-value Odds Ratio (95% CI) Constant Dzongkhag Bumthang Samdrupjongkhar ( ) Samtse ( ) Thimphu ( ) Trashigang ) 1.29 ( ) Tsirang ( ) Others ( ) Profession Farmer Business ( ) Domestic ( ) Office ( ) Teachers ( ) Others ( ) Age (years) ( ) ( ) ( ) Above ( ) Gender Female Male ( ) Likelihood ratio χ² = 51.43, p <0.001 ; AIC = ; Hosmer-Lemeshow goodness-of-fit test, p =
119 Table 3.11 Final multivariable logistic regression model of factors associated with community attitude of rabies and dog population control in Bhutan Variable Coefficient SE p-value Odds Ratio (95% CI) Constant Gender Female Male ( ) Location Urban Rural ( ) Age (years) ( ) ( ) ( ) Above ( ) Likelihood ratio χ² = 26.40, p <0.001 ; AIC = ; Hosmer-Lemeshow goodness-of-fit test, p = Discussion This study highlighted the knowledge, attitudes and behaviours of the community towards rabies and dog population control. About 95% of the respondents had heard about rabies and 94.3% of the participants reported that stray dogs were the source of rabies. These findings are consistent with studies undertaken in other developing countries (Matibag et al., 2007; Herbert et al., 2012; Lunney et al., 2012; Hergert & Nel, 2013; Davlin et al., 2014). The high level of awareness on rabies and its source may be due to frequent rabies outbreaks in some places and the wide media coverage associated with such outbreaks, as well as the awareness programme administered by the Government. However, the respondent s knowledge on the signs of rabies (61%) and the method of prevention of rabies by vaccination (53%) warrants further attention. The knowledge on methods to prevent rabies was better than that in south western Nigeria (33%) and urban slums in India (42.7%), however it was lower than in Sri Lanka (88%) 96
120 and the Philippines (85%) (Matibag et al., 2007; Herbert et al., 2012; Ameh et al., 2014; Davlin et al., 2014). More focussed Information, Education and Communication (IEC) material and awareness programmes on rabies and its prevention may be required to improve this level of knowledge. In general, the participants had negative attitudes towards stray dogs in Bhutan. For example, 70% of the respondents reported that stray dogs were a problem for the society and 20.4% reported that stray dogs were annoying. Similarly about 90% of the respondents in a study in Italy reported that free-roaming dogs and cats were a problem (Slater et al., 2008a; Fielding et al., 2012; Hergert & Nel, 2013). Although in the current study most respondents indicated that stray dogs were a problem, a large proportion reported that they had fed free-roaming dogs, indicating a high tolerance by the community towards stray dogs. Feeding of stray dogs is common in Bhutan which may be due to the predominant Buddhist faith where wasting or throwing away of food is considered a sin (Personal Observation). Approximately 10% of the respondents reported that a dog had bitten a member of their family in the year preceding the study. The proportion of respondents reported having been bitten was lower than that reported in other studies in Guatemala (16.5%), Philippines (21%), Samoa (27%) and Nigeria (57%) (Lunney et al., 2011; Farnworth et al., 2012; Ameh et al., 2014; Davlin et al., 2014). The lower proportion of respondents reported to being bitten by dogs in Bhutan was most likely due to less opportunity to have contact with dogs. The high proportion of dog bites by neighbours and neighbourhood dogs raises a serious question on responsible dog ownership as owned dogs are often not confined adequately and frequently are more aggressive than stray dogs (Wright, 1989). It is also possible that the victims were more aggressive towards 97
121 local dogs in an attempt to minimise their impact which could have, in turn, provoked the dog to attack them. Therefore, an educational programme on avoiding dog bites/attacks may be useful to reduce the incidence of dog bites in humans. Understanding the attitudes and perceptions of the community in seeking treatment after a dog bite is important for rabies prevention, as well as for other complications arising from dog bites. The current study demonstrated good treatment seeking behaviours of participants following a dog bite, which included thorough washing of the wound with soap and water. This highlights that the existing health education on the management of dog bites has been effective. However further studies are required to confirm these findings. Similarly a high proportion of respondents in Sri Lanka also reported adoption of appropriate treatments following a dog bite (Matibag et al., 2007). In contrast, only 51% of respondents in Samoa visited a hospital after a dog bite (Farnworth et al., 2012), although in Samoa rabies is exotic. More participants in urban than rural areas considered that the stray dog population was increasing and that there were too many stray dogs in their locality (Table 3.6). This may be because of the ready availability of food in urban areas from commercial and residential areas and the large number of households feeding these dogs. According to the respondents, the main source of stray dogs was from within the community, which may again be due to a lack of responsible dog ownership. Most owned dogs are fed with leftover food but are not confined and are allowed to breed indiscriminately, often resulting in puppies being abandoned in public places (personal observation). The majority of the participants believed that the dog population should be controlled (Table 3.6). The most preferred method (84.1%) of controlling this population was through animal birth control with only 1.8% endorsing killing. More than half of the 98
122 respondents reported having themselves or a family member assist the dog population control programme initiated by the Government. More respondents (34%) from urban than rural (21%) areas supported the euthanasia of terminally sick dogs. This difference may be associated with the older age of respondents from the rural areas who were less supportive of euthanasia, irrespective of the animal s situation (Table 3.1). Increased awareness of the welfare issues, particularly with terminally sick dogs, may result in an greater acceptance of euthanasia in certain circumstances. Only one-third (31.3%) of the respondents reported that the health of stray dogs was poor. Similar to other studies, skin disease and malnutrition were the most common health problems reported in stray dogs, even though a high proportion of the respondents reported feeding stray dogs in their locality (Totton et al., 2011; Yoak et al., 2014). The concept of animal welfare groups is new in Bhutan and only about one quarter of the respondents were aware of the existence of animal welfare organizations in the country (Table 3.7). Legislative measures form an integral part of a dog population control programme (WHO & WSPA, 1990; WHO, 2004; FAO, 2014). Although there is a section on dog population management in the Livestock Rules and Regulations 2008 under the Livestock Act of the Kingdom of Bhutan 2001, only 18.4% of the participants were aware of the existence of any laws or regulations on the management of the dog population. The majority of respondents believed that Bhutan should have an animal welfare law. This indicates that the existing regulations on dog population management need to be advertised more widely to the community and implemented by the relevant Government authorities to address the stray dog problem in the country. A separate law on animal welfare with comprehensive sections on dog population management and responsible dog ownership should be prepared by the 99
123 Department of Livestock in collaboration with animal welfare organizations and other relevant stakeholders. A high proportion of the respondents had positive attitudes towards the control of rabies and the dog population (Tables 3.6 and 3.7). Several factors appeared to be associated with the knowledge (Table 3.8) and attitudes (Table 3.9) of the participants towards rabies and dog population control. The participants from Samdrupjongkhar were more likely to have poor knowledge on rabies. This may be due to poor access to the educational materials and awareness programme owing to the remoteness of this Dzongkhag. Respondents who were employees of the Government or Corporate Organizations, males or were between the age of 26 to 35 years were more likely to have good knowledge on rabies and dog population control than others. These findings concur with those of similar studies undertaken in Gelephu, South Central Bhutan, where a knowledge of rabies was reported in males and employees of the Government or Corporate Organizations (Tenzin et al., 2012). Female (women) respondents in the rural areas are more likely to have negative attitudes towards the dog population control programme which may be due to poor participation in the awareness programme by this group compared with men. Studies undertaken in Nigeria and the Philippines also reported a better knowledge of rabies and dog population control by the males of the community (Ameh et al., 2014; Davlin et al., 2014). In contrast, poor awareness of rabies and the dog population control programme was reported in males from urban slums of India (Herbert et al., 2012). This study highlights the need for a good educational programme on rabies and dog population control in Samdrupjongkhar. This educational programme should specifically target females, farmers and older age groups. Any awareness programme 100
124 should also target females in rural areas to encourage their active involvement and participation in rabies and dog population control programmes. A dog population control programme should be accompanied by better understanding of the population dynamics of the free-roaming dog population, and this forms the basis for the research reported in the subsequent chapters of this thesis. 101
125 CHAPTER FOUR The demographic characteristics of dogs presented for the captureneuter-vaccinate-release (CNVR) programme in Bhutan 4.1 Introduction Several strategies have been implemented in the past to control the population of freeroaming dogs and their associated problems (WHO, 1987; WHO & WSPA, 1990; ICAMC, 2007; OIE, 2010). These have included population control through culling of unwanted dogs and reproductive control, habitat control and legislative measures including encouraging responsible dog ownership (registration of dogs, restriction on the number of dogs that can be owned, providing food and shelter to the dogs and confining of dogs). However population control through culling as outlined previously has been opposed by members of the public and has not been effective as described in Chapter 1 (Jackman & Rowan, 2007; OIE, 2010). In India it has been shown that a combination of ABC and vaccination programmes can reduce the size of a dog population and the incidence of rabies and concurrently improve the welfare of stray dogs (Reece & Chawla, 2006; Reece et al., 2008; Totton et al., 2010a; Totton et al., 2011). As summarised in Chapters 1 and 2, since the 1970s Bhutan has attempted several measures to control the free-roaming dog population (NCAH, 2006; UNDP, 2008; Wangmo, 2010), however these were not successful in controlling rabies or reducing the dog population. The results of the KAP survey outlined in the previous chapter indicated that the majority of the surveyed Bhutanese were in favour of controlling the dog population, of which ABC was the preferred method to control the population. 102
126 To address the chronic overpopulation of free-roaming dogs and the associated problem of rabies in Bhutan, the HSI and the RGOB jointly started the National Dog Population Management and Rabies Control Project in Through this project free-roaming dogs were caught, neutered, vaccinated and released back to their place of origin (Figure 4.1). As of 30 June 2013, a total of 48,051 dogs had been sterilized and vaccinated. A clearer understanding of the dynamics of the owned and un-owned dog population that were processed at the CNVR clinics would enable better planning and targeting of resources to maximise the benefits of the ongoing CNVR programme in Bhutan. The objectives of the study reported in this chapter were to describe the population demographics and health status of the dogs presented at the CNVR clinics in Bhutan from July 2011 to June Materials and Methods National Dog Population Management and Rabies Control Project The Department of Livestock (DOL) of the RGOB and the HSI, USA initiated a pilot spay/neuter/vaccination programme or CNVR programme between February and June 2009 in Thimphu, the capital city of Bhutan. During the pilot CNVR programme 2,846 dogs were sterilized and vaccinated in the city. After the success of this pilot programme, the two entities signed a memorandum of understanding in September 2009 and formed a partnership to implement a long term project titled the National Dog Population Management and Rabies Control Project in Bhutan (NDPM & RCP) to undertake a three to five year CNVR programme. The CNVR programme focused on sterilization and vaccination of both stray and owned dogs. Some cats were also sterilized and vaccinated, as and when they were brought to the clinic by their owners. For the purpose of this study stray dogs are 103
127 defined as those dogs that were collected from the streets by the CNVR staff, whereas owned dogs were those that were brought to the CNVR clinic for sterilization and/or vaccination by their owners or representatives. All procedures performed on the dogs were approved by the Murdoch University Animal Ethics Committee (R2430/11). Animal handling and surgical procedures were done by veterinarians and paraveterinarians trained on the standard HSI protocol for the CNVR programme (Figure 4.1). Sexually intact dogs older than 4 months of age were humanely captured by trained dog catchers using nets. The age of the dogs was categorized as juvenile (< one year of age) or adult (greater than approximately one year of age). Juvenile dogs were identified by the presence of small teats in females and immature dogs with small testicles for males, and adults were sexually mature dogs with developed teats in females and fully descended and large testicles for males. In addition, for owned dogs the age of the dogs, if known, was obtained from the owners. The dogs brought to the CNVR clinics were administered xylazine hydrochloride (1 mg/kg) and atropine sulphate (0.05 to 1mg/kg) as pre-anaesthetic medications and anaesthetised using intramuscular injection of ketamine at 15mg/kg body weight. All the dogs were vaccinated against rabies with a 1 ml dose of inactivated, adjuvanted, cell culture rabies vaccine (RABISIN, Merial, SAS, France). Benzathine penicillin (11,000 to 22,000 IU/kg) and meloxicam (0.2 mg/kg) were administered to minimize the likelihood of secondary bacterial infection and to relieve pain, respectively. Ivermectin (1% w/v) was injected to prevent and treat parasite-related conditions in dogs. Male dogs were castrated through a single prescrotal incision. Bitches were sterilized by complete ovariohysterectomy through a mid-ventral abdominal incision (Figure 4.1). To identify the sterilized dogs, they were ear notched while under anaesthesia using a cautery device. After surgery the dogs were observed until they were fully recovered from their 104
128 anaesthesia and were then either returned to their owners or to the place where they had been captured. Those dogs that were already sterilized were vaccinated against rabies and injected with ivermectin. The sterilization status of unmarked, un-owned females was assessed by searching for abdominal incision scars and, in a few rare cases, confirmed during surgery. A physical examination of the dogs was done to assess their health condition, as well as to check for the presence of skin and other general health problems by the veterinarians who were trained on the HSI approved protocol. Body condition score was classified into three categories as poor (ribs, spine and pelvic bones easily visible and an obvious loss of muscle mass), okay (ribs, spine and pelvic bones visible with the presence of an obvious waist) and good (ribs, spine and pelvic bones not visible and no obvious waist). Health problems recorded in this study were mange, transmissible-venereal-tumour (TVT) and pyometra, as these diseases were common, had pathognomonic clinical signs and were macroscopically visible. Dogs were considered positive for mange if they displayed characteristic clinical signs such as alopecia, reddened skin, body sores or scabs (Kahn & Line, 2010). Pyometra in bitches was diagnosed based on the presence of gross pathology of the uterus during the ovariohysterectomy as evidenced by the presence of inflammation, enlargement of the uterus or presence of purulent material. Dogs were considered to have TVT if they had cauliflower-like, pedunculated, nodular, papillary, or multilobulated lesions on their genital organs or on their nasal, oral or conjunctival mucosa. During the sterilization of 7,929 entire female dogs, the uteri of dogs were assessed for visible evidence of pregnancy. To estimate foetal counts, the uterine horns were opened longitudinally along their entire length and the number of foetuses counted. 105

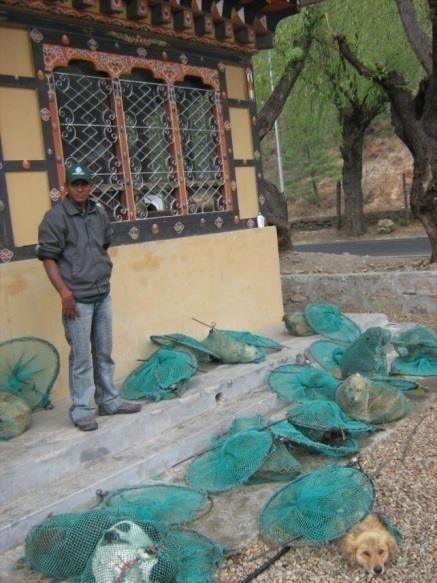
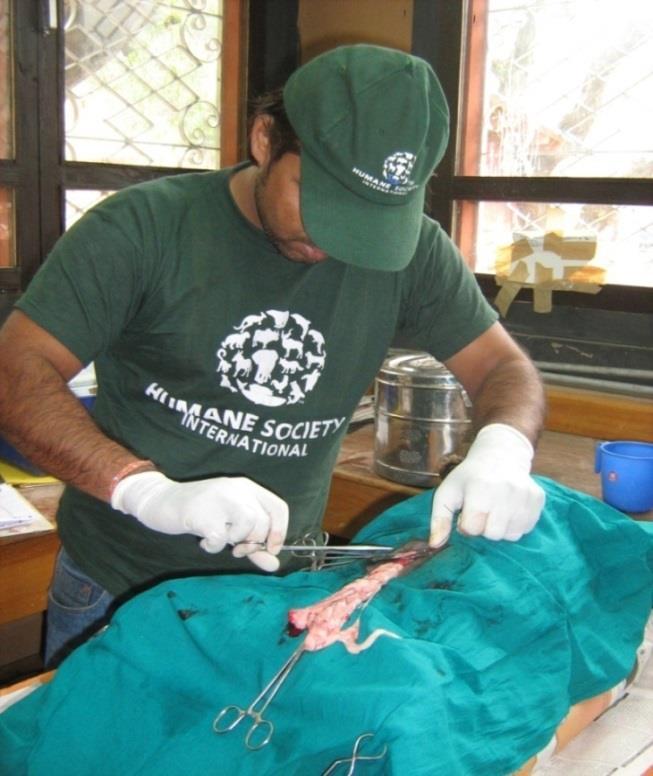
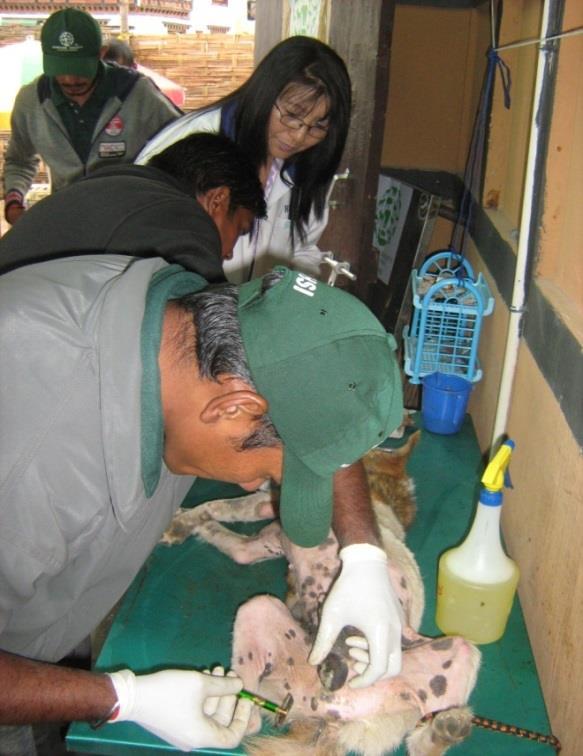
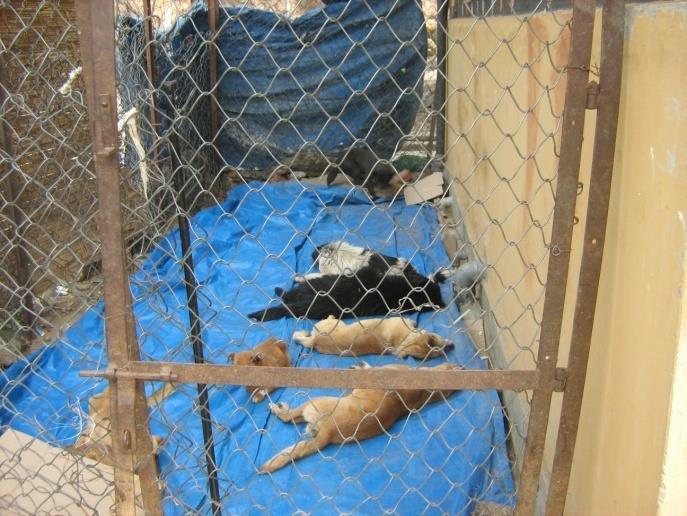
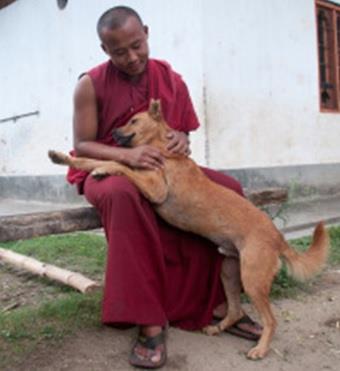
129 Figure 4.1 Activities during the capture neuter vaccinate release (CNVR) programme in Bhutan 106
130 4.2.2 Capture-neuter-vaccinate-release (CNVR) data Data were compiled separately for two different periods: from Feb 2009 to June 2011 (first phase); and July 2011 to June 2013 (second phase) as shown in Figure 4.2. There were no electronic records of individual animals processed at the CNVR clinic during the first phase. The data were compiled and aggregated by Dzongkhag on a monthly basis. During the first phase period 25,594 dogs were neutered and vaccinated, of which 54.2% were strays. From July 2011 onwards the CNVR team recorded all cases in a database. The field data were entered in an excel spreadsheet which were later uploaded to the main database maintained at the project s headquarters. Separate records for dogs and cats, as well as records of animals that were only vaccinated or those that were vaccinated and sterilized were kept. During this period a total of 22,399 dogs and 2,578 cats were either neutered and vaccinated or vaccinated only. In this study only dogs are considered Data Analysis Analyses were performed on data of 22,399 dogs processed at the CNVR clinic from 01 July 2011 to 30 June 2013, which had individual records of their owner, sex, age, sterilization and pregnancy status, and presence or absence of the diseases (TVT, pyometra and mange). Analyses were done using Microsoft Excel (Microsoft Excel 2010, Redmond, USA) and Statistical software R (R Development Core Team, 2013). Descriptive analyses were performed and 95% CI for proportions were calculated using the exact binomial method (Ross, 2003). Pearson s chi-square tests for independence were used to compare the proportions of dogs presented between groups categorised by gender, age, neuter status, owner status, pregnancy status and presence or absence of the disease conditions. Reproductive parameters, including the proportion of pregnant 107
131 females, foetal counts and monthly pattern of pregnancy, were evaluated and compared by age class and owner status. An independent two sample student s t-test was used to compare the mean foetal counts of the pregnant bitches between owned and stray dogs as well as between adult and juvenile bitches. The χ² Goodness-of-Fit test was used to investigate the influence of season on the monthly pattern of pregnancies. Risk factors associated with the occurrence of mange, TVT and pyometra were assessed in different groups by calculating odds ratios and their 95% confidence intervals. Figure 4.2 Number of animals (dogs and cats) presented to the CNVR Clinic from February 2009 to June Results The CNVR programme was undertaken in all 20 Dzongkhags of Bhutan with the highest number of dogs sterilized and vaccinated in Thimphu followed by Samtse, Sarpang, Paro, Chukha and Samdrupjongkhar (Figure 4.3). The lowest number of dogs (less than 1,000 dogs) were vaccinated and sterilized in Gasa, Lhuentse, Trongsa and 108
132 Haa. Comparison of the owned dog population data (based on the 2012 census) and the number of dogs presented to the CNVR until June 2013 in different Dzongkhags indicated that the number of owned dogs presented to the clinic was much higher than the official population figures for some Dzongkhags (Figure 4.4). Based on the 2012 census data, 92.3% (22,443 of 24,320) of the owned dog population were neutered and vaccinated. Figure 4.3 A Dzongkhag map of Bhutan showing the total number of dogs vaccinated and sterilized (displayed as proportional to size circles) from February 2009 to June 2013 (n = 48,051) The demographic characteristics of the dogs presented at the CNVR clinic during the two year period July 2011 to June 2013 are summarised in Table 4.1. Of the 22,399 dogs presented to the CNVR clinic for sterilization and vaccination, 52.4% (95% CI ) were caught by the CNVR team and were categorized as stray dogs. More than three quarters (76.2%, 17,063 of 22,399) of the dogs were sterilized and vaccinated with 23.8% already having been sterilized and consequently were only vaccinated at the CNVR clinic. 109
133 Figure 4.4 Comparison of the owned dog population (2012 census) and the number of owned dogs neutered and vaccinated (up to June 2013) in different Dzongkhags in Bhutan. The line graph shows the percentage of dogs neutered and vaccinated in each Dzongkhag (right y axis) Sex ratios Overall there were slightly more male (54.6%; 95% CI ) than female dogs (45.4%; 95% CI ) presented to the CNVR clinic (sex ratio of male: female of 1.2:1 - Table 4.1). For stray dogs there was a similar distribution of males (51.4%; 95% CI ) and females (48.6%; 95% CI ) with a sex ratio of 1.06:1. In contrast for owned dogs more males (58.1%; 95% CI 57.1 to 59.0) were presented than females (41.9%; 95% CI ) (sex ratio of 1.4:1). The sex ratio of the stray dogs was significantly different to that of the owned dogs (χ² = , df = 1, p <0.001). 110
134 Table 4.1 Characteristics of dogs presented at the capture-neuter-vaccinate-release (CNVR) clinic from 01 July 2011 to 30 June 2013 Total Stray Owned Characteristics n (%) n (%) n (%) χ² p-value Sex^ Male (54.6) 6033 (51.4) 6188 (58.1) <0.001 Female (45.4) 5709 (48.6) 4466 (41.9) Unknown^ 3 (0.01) 3 (0.03) 0 (0) Age Adult (73.4) 8627 (73.5) 7824 (73.4) Juvenile 5948 (26.6) 1397 (26.5) 1607 (26.6) Sterilization status^ Males Sterilized 3090 (25.3) 1014 (16.8) 2076 (35.5) <0.001 Intact 9122 (74.7) 5014 (83.2) 4108 (66.4) Females Sterilized 2246 (22.1) 836 (14.6) 1410 (31.5) <0.001 Intact 7938 (77.9) 4878 (85.4) 3060 (68.5) Health condition Poor 381 (1.7) 230 (2.0) 150 (1.4) <0.001 Okay 3003 (13.4) 1285 (10.9) 1718 (16.1) Good (84.9) (87.1) 8786 (82.5) Presence of health problems* Yes 1085 (4.8) 807 (6.9) 278 (2.6) <0.001 No (95.2) (93.1) (97.4) Pregnancy status Yes 518 (6.5) 304 (6.2) 214 (7.0) No 7411 (93.5) 4569 (93.8) 2842 (93.0) ^ Three dogs with unknown gender in the stray category * Presence of health problems indicates whether the dogs were diagnosed with mange, transmissible-venereal-tumour (TVT) or pyometra. 111
135 4.3.2 Age structure The age distribution was highly skewed towards adults (73.4%; 95% CI ). There was no significant difference in the age distribution of owned and stray dogs (χ² = 0.00, df = 1, p = 0.98) Sterilization status Approximately one quarter (23.8%; 95% CI ) of the dogs brought to the clinic had already been sterilized (Table 4.1). The proportion of males (25.3%; 95% CI ) that were already sterilized was significantly higher than that of females (22.1%; 95% CI ) (χ² = 32.29, df = 1, p <0.001). A significantly higher proportion of owned dogs (males 33.6%; 95% CI and females 31.5%; 95% CI ) had previously been sterilized than stray dogs (males 16.8%; 95% CI ; females 14.6%; 95% CI ) (males χ² = , df = 1, p <0.001; females χ² = , df = 1, p <0.001) Reproductive parameters Of the 7,929 females that were spayed at the clinic, 6.5% (95% CI ) were pregnant (Table 4.1). The pregnancy levels of owned (7.0%, 95% CI ) and stray dogs (6.2%, 95% CI ) were similar (χ² = 1.80, df = 1, p =0.18). The foetal count in pregnant bitches ranged from 1 to 11 with a mean foetal count of 4.9 (SD = 1.6, n = 518). The mean foetal count was significantly lower in juvenile (M = 4.1, SD = 1.3, n = 90) than in adult females (M = 5.1, SD = 1.6, n = 428) (t = 5.115, df = 516, p <0.001). The mean foetal count in stray dogs (M = 5.2, SD =1.6, n = 304) was significantly higher than that in owned dogs (M = 4.4, SD = 1.5, n = 214) (t = , df = 516, p <0.001). The monthly distribution of pregnant bitches observed at the CNVR clinics during the two year period is presented in Figure 4.5. Both owned and stray dogs were 112
. Figure 4.")
136 found to be pregnant throughout the year, although more pregnancies were found in the period from September to December (Figure 4.5). The pregnancy rates differed significantly between months (χ² = , df = 11, p <0.001). Figure 4.5 Monthly pattern of female dogs neutered and proportion of pregnant bitches observed when spayed during the CNVR programme in Bhutan from July 2011 to June Health status Most dogs presented to the CNVR clinics were categorised as being in good health condition (84.9%; 95% CI ). Of the dogs presented to the CNVR clinics, 4.8% (95% CI ) had one or more health problems (mange, TVT or pyometra). Significantly more stray dogs (6.9%; 95% CI ) had a health problem than owned dogs (2.6%; 95% CI ). The odds of a stray dog having a health problem was 2.75 times greater than that of owned dogs (95% CI ; χ² = , df = 1, p <0.001). The various risk factors associated with occurrence of different health 113
137 problems are presented in Table 4.2. There was no difference in the risk of mange in male and female dogs (OR = 1.02; 95% CI ), while male dogs were less likely to have TVT (OR = 0.65; 95% CI ). Entire dogs were at increased risk of mange (OR = 4.02; 95% CI ) and TVT (OR = 4.19; 95% CI ) than sterilized dogs. Adult dogs were at increased risk of having pyometra (OR = 2.47; 95% CI ) or TVT (OR = 2.61; 95% CI ), and less likely to have mange (OR = 0.70; 95% CI ) than juvenile dogs. 4.4 Discussion This study describes the characteristics of the owned and stray dog population based on a dataset from the CNVR programme undertaken in Bhutan. A total of 22,399 dogs were neutered and vaccinated at CNVR clinics in Bhutan during the study period, of which 52.4% were strays. Even though the main focus of the HSI/RGOB CNVR programme was towards stray dogs, 47.6% of the dogs presented were owned dogs. This high percentage is likely to be due to the effective dissemination of information about the programme and the involvement and support provided by animal health officials in the Dzongkhags and sub-dzongkhags to the project team. However, there was variation in CNVR coverage between the Dzongkhags depending on the number of working days spent and the number of CNVR campaigns conducted in the respective Dzongkhags (Figure 4.3). Although similar CNVR programmes have been undertaken in other countries (Reece & Chawla, 2006; Kakati, 2010; Hiby et al., 2011; Totton et al., 2011), this is the only programme covering a whole country with all 20 Dzongkhags in Bhutan being included. This is a major achievement given the widespread CNVR coverage and the logistical challenges in implementing such a programme in scattered settlements across a rugged geographical terrain. 114
138 Table 4.2 Risk factors associated with occurrence of various diseases in those dogs presented to CNVR Clinics Risk Factor Disease (%) No Disease (%) Odds Ratio (95% CI) P-Value (a) Mange Owner status Stray 528 (4.5) (95.5) 2.84 ( ) <0.001 Owned 174 (1.6) (98.4) Gender Male 387 (3.2) (96.8) 1.02 ( ) 0.76 Female 315 (3.1) 9859 (96.9) Neuter status Entire 650 (3.8) (96.2) 4.02 ( ) <0.001 Neutered 52 (1.0) 5284 (99.0) Age Adult 468 (2.8) (97.2) 0.71 ( ) <0.001 Young 234 (3.9) 5713 (96.1) (b) Transmissible-venereal-tumour (TVT) Owner status Stray 139 (1.2) (98.8) 4.0 ( ) <0.001 Owned 32 (0.3) (99.7) Gender Male 75 (0.6) (99.4) 0.65 ( ) <0.001 Female 96 (1.0) 9995 (99.0) Neuter status Entire 159 (0.9) (99.1) 4.19 ( ) <0.001 Neutered 12 (0.2) 5297 (99.8) Age Adult 150 (0.9) (99.1) 2.61 ( ) <0.001 Young 21 (0.4) 5898 (99.6) (c) Pyometra Owner status Stray 155 (3.2) 4718 (96.8) 1.49 ( ) 0.01 Owner 66 (2.2) 2990 (97.8) Age Adult 180 (3.5) 4935 (96.5) 2.47 ( ) <0.001 Juvenile 41 (1.5) 2773 (98.5) 115
139 It has long been recognized that understanding the population dynamics of owned and stray dog populations is required for successful rabies and dog population control (WHO & WSPA, 1990; WSPA, 2009; OIE, 2010). The availability of electronic records of individual dogs during the two year period enabled analysis of the population characteristics of both owned and stray dogs. The stray dogs were captured by trained dog catchers and processed at the CNVR clinic while owned dogs were presented on a voluntary basis by their owners. This could lead to sampling bias for both dog populations as the rate of capture of the stray dogs may vary between dog catchers and be influenced by community support; while submission of owned dogs may differ between owners and also be influenced by the dissemination of information by the local animal health officials. Although dogs that were collected from the streets by the CNVR staff were defined as stray dogs, some of them may have been owned but not confined by their owner during the visit of the CNVR team and consequently were misclassified. As such the demographic characteristics of owned and stray dogs reported in this study may not represent the true status of the dog population in Bhutan. Based on the owned dog population (from the 2012 census) and the cumulative number of owned dogs neutered and vaccinated from February 2009 to June 2013, 92.3% of the owned dog population had been neutered and vaccinated. This apparent high proportion of dogs neutered and vaccinated during the period is likely to be due to an underestimation of the actual owned dog population from the census which focused on livestock and rural communities, rather than pet animals and urban locations. Consequently there is a need to conduct cross-sectional household and field population surveys to understand the size and population demographics of both owned and stray dogs, respectively. Some studies in other developing countries have reported the demographic characteristics of the 116
140 owned dog population (Brooks, 1990; De Balogh et al., 1993; Butler & Bingham, 2000; Matter et al., 2000; Kitala et al., 2001; Kongkaew et al., 2004; Knobel et al., 2008; Suzuki et al., 2008; Acosta-Jamett et al., 2010). However, there are few studies that have examined the demographical characteristics of stray or un-owned dogs (Matter et al., 2000; Kato et al., 2003; Reece & Chawla, 2006; Reece et al., 2008; Totton et al., 2010a). In order to come up with a reliable estimate of the owned dog population, the extrapolation of the mean number of dogs owned by each household (from a properly designed cross-sectional household survey in both rural and urban areas) to the total number of households in the country or area should be undertaken (Butler & Bingham, 2000; Downes et al., 2013). Simultaneously, the population of free-roaming dogs can be estimated by using capture-mark-recapture techniques designed for estimating wildlife populations (Caughley, 1977; Bookhout, 1994; Sutherland, 2006). The WHO and WSPA has developed specific guidelines to estimate the size of the free-roaming dog population and these have been successfully used in the developing countries of Bangladesh, Bhutan, Egypt, India, Mauritius, Nepal and Sri Lanka (WHO & WSPA, 1990; WSPA, 2009; Hiby et al., 2011). In this study a similar distribution of males and females (sex ratio of 1.05:1) was found for stray dogs, although more males were owned than females (sex ratio of 1.39:1). The preference for owning male dogs is consistent with the findings of other studies and is likely associated with avoiding the issues of oestrus in female dogs and unwanted puppies (De Balogh et al., 1993; Suzuki et al., 2008; Ratsitorahina et al., 2009). The age distribution was more skewed towards the adult age group for both owned and stray dogs. The lower number of juvenile dogs detected may be due to a high mortality in puppies, as reported in studies undertaken in other developing countries (Brooks, 1990; De Balogh et al., 1993; Butler & Bingham, 2000; Kitala et al., 2001). It is also likely 117
141 that owners deliberately avoid presenting young dogs for vaccination and sterilization, as well as dog catchers leaving younger dogs during the catching round, although young dogs older than four months are eligible for sterilization and vaccination. Correct records of the number of puppies born and those that survived in both owned and stray dogs would be a useful adjunct to better understand the dynamics of the dog population. In this study 15.8 and 32.7% of the stray and owned dogs, respectively presented to the clinics were already sterilized. This demonstrates that some of the dogs which had been sterilized prior to the initiation of the ongoing CNVR campaigns were still surviving. Ad hoc sterilization and vaccination campaigns have been conducted in Bhutan since the early 1990s by the DOL as part of an anti-rabies campaign for both owned and stray dogs (NCAH, 2006,2007). As a result of these campaigns, in combination with the removal of in-contact animals during rabies outbreaks, outbreaks of rabies in animals are now reported only from the southern border Dzongkhags of the country (Tenzin et al., 2010; Tenzin et al., 2011a; Tenzin et al., 2011c; Tenzin et al., 2011d). Recent outbreaks in the interior of the country were associated with the movement of domestic animals from the southern region of the country (Tenzin et al., 2010; Tenzin et al., 2011a; Tenzin et al., 2011c). However the coverage of previous CNVR campaigns have been below the WHO/WSPA recommendation of 70%. The previous coverage level would not be sufficient to significantly reduce the dog population or to prevent an outbreak of rabies. Most of the dogs presented to the CNVR campaigns only ever receive one vaccination against rabies during their lifetime. It is strongly recommended that annual booster vaccinations are administered to all dogs to maintain effective immunity in rabies endemic areas. Most of the dogs observed at the CNVR clinics were found to be in good health (84.9%), with very few owned (1.4%) or stray (2.0%) dogs being in poor condition. 118
142 This highlights that the stray dogs have access to a reliable food source, most likely from the community. Approximately 5% of the dogs presented to the clinic had a recognisable health problem. Not surprisingly a higher proportion of stray dogs (6.9%) had health problems (mange, pyometra or TVT) than owned dogs (2.6%) and a CNVR programme has the benefit of not only reducing the size of the stray dog population but also improving the health and welfare of these dogs. Stray dogs were more likely to have TVT and pyometra than owned dogs and this may be due to differences in behavioural, hormonal and immunological factors between the two populations (Reece & Chawla, 2006; Totton et al., 2011; Yoak et al., 2014). Stray dogs are likely to acquire pyometra and TVT through mating with infected dogs, while they acquire skin infections through the frequent direct contact with other dogs with mange. In contrast most owned dogs are likely to be confined to avoid mating/pregnancy or to prevent contact with stray dogs. It is also likely that owned dogs were more likely to have been treated with general anthelmintics, such as ivermectin, which would reduce the prevalence of mange, as well as internal parasites. Approximately 6.5% of the female dogs that were neutered at the clinic were found to be pregnant. The pregnancy rates in the owned and stray dogs were not significantly different. This may indicate that owned dogs are not continuously confined or that freeroaming male dogs can gain access to owned female dogs during oestrus. As expected, lower foetal counts were observed in younger dogs than in adult females and similar findings have been reported by others (Brooks, 1990; Butler & Bingham, 2000; Kitala et al., 2001). Stray dogs had a higher mean foetal count than owned dogs. This is likely associated with the general larger body size of stray dogs than owned dogs, with a preference by many owners for smaller breeds (Personal observation). A retrospective study undertaken in Norway to estimate the mean litter size in a large population of 119
143 purebred dogs reported an increase in the mean litter size with breed size, from 3.5 puppies in miniature breeds to 7.1 puppies in giant breeds (Borgea et al., 2011). Pregnancies in both owned and stray dogs were observed throughout the year, although more pregnancies were reported in the months of September to December (Figure 4.5). Higher numbers of pregnancies were also observed in these months in comparable studies conducted in Jodhpur and Jaipur in India (Reece & Chawla, 2006; Reece et al., 2008; Totton et al., 2010b). To maximize the impact of the programme, future CNVR programmes should target females (both owned and stray) with reinforcement of the programme at the time of the peak mating season (August to October). In conclusion, this study provided insight on the population demographics of the owned and stray dog population presented to CNVR clinics in Bhutan. The results of this study will allow better planning and targeting of resources to maximise the benefits of the ongoing CNVR programme in Bhutan. As expected, stray dogs are more prone to acquiring health problems and this highlights the need for a programme improving the health of these dogs and this in turn also increases the welfare of these dogs. In order to effectively reduce the size of the dog population and the incidence of rabies, the CNVR programme should focus on both owned and stray dogs by working closely with the communities and the relevant stakeholders through a one health approach. In order to achieve 70% sterilization and vaccination coverage required to reduce the size of the dog population to a manageable level and to eliminate rabies from dogs, the CNVR programme should be continued along with the implementation of legislative measures to ensure responsible dog ownership, better dog habitat control through proper solid waste management in the urban areas, as well as aggressive awareness campaigns on the benefits of the programme. Annual booster vaccinations against rabies should be targeted in the rabies endemic areas. Cross-sectional household and field population 120
144 surveys should be conducted to understand the size and population demographics of both owned and stray dogs, as well as to monitor and evaluate the ongoing CNVR programme in Bhutan, and such surveys are described in the subsequent chapters of this thesis. 121
145 CHAPTER FIVE Monitoring and evaluation of a Capture-Neuter-Vaccinate-Release (CNVR) Programme to control Rabies and the Dog Population in Bhutan 5.1 Introduction Although many dogs are confined and have owners within communities, there are others that roam freely. A free-roaming dog population can rapidly increase in size due to a high reproductive potential resulting in a hazard to animals, humans and the environment as described previously in Chapters 2 and 3. Animal birth control (ABC), along with vaccination of free-roaming dogs, have been carried out in some developing countries that have been confronted with issues associated with an increasing dog population and rabies outbreaks (Matter et al., 2000; Reece & Chawla, 2006; Totton et al., 2010a). Animal birth control has also been the preferred method to control the freeroaming dog population by the Bhutanese community (Chapter 3). Accordingly, a CNVR program was implemented in Bhutan to sustainably manage and vaccinate the free-roaming dog population (Chapter 4). The World Health Organization (WHO) Expert Committee on Rabies in 2004 recommended that at least 70% vaccination coverage is required to break the rabies cycle and at least 70% of the dogs should be sterilized to maintain a stable dog population (WHO, 2004). To date in Bhutan no detailed evaluation has been done to assess the impact of CNVR on the size and age structure of the free-roaming dog population, nor on the proportion of the free-roaming dog population that had been vaccinated and sterilized. Field population surveys have been conducted following CNVR programmes in several developing nations to assess their impact (Childs et al., 1998; Matter et al., 2000; Kitala 122
146 et al., 2001; Kayali et al., 2003; Hiby, 2005; Reece & Chawla, 2006; Totton et al., 2010a; Hiby et al., 2011; Hiby, 2014). The aim of the current study was to monitor and evaluate the effectiveness and progress of the ongoing RGOB-HSI project on dog population management and rabies control in Bhutan. A field population survey was done to: (1) estimate the proportion of free-roaming dogs that were vaccinated and neutered through the CNVR programme in the main towns/cities of the selected Dzongkhags; (2) estimate the proportion of adult females that were lactating and the proportion of free-roaming dogs that were puppies; and (3) assess the health conditions of the sterilized and sexually intact free-roaming dogs. 5.2 Materials and methods Capture-neuter-vaccinate-release (CNVR) programme The CNVR programme focused on sterilization and vaccination of captured stray and owned dogs. Sexually intact dogs older than 4 months of age were humanely captured by trained dog catchers using nets. The owned dogs were either brought to the clinics by their owners or collected from a designated place. The dogs brought to the CNVR clinics were sterilized and vaccinated as per the procedures described in Chapter 4. This study was undertaken in the main towns of six Dzongkhags (Bumthang, Samtse, Samdrupjongkhar, Tashigang, Thimphu and Tsirang Figure 3.1). Prior to this study, two rounds of the CNVR programme had been undertaken in Samdrupjongkhar and Thimphu Dzongkhags and one in each of the other four Dzongkhags Population surveys A survey to monitor and evaluate the CNVR programme was undertaken in January and February 2012 in the Dzongkhags. The survey team, comprising of staff from DOL from the respective Dzongkhags, were trained on the survey methods. Three senior staff 123
147 were involved in training and leading the field population surveys in all of the Dzongkhags. The area in the main towns of each Dzongkhag were demarcated based on the road networks and settlements and allocated to each of the teams. A team contained two persons, one local staff member who was familiar with the area and another staff member who was not familiar with the location. All the teams started counting dogs at the same time of the day (6.00 A.M) and counted for no longer than three hours to avoid double counting and to minimize the confounding effect of the time of the day on the sighting of dogs in the Dzongkhags. The process included counting and recording the number of male and female dogs with and without ear notches, lactating females and puppies observed. A similar count was undertaken in the border Indian towns (Mela Bazaar) within a 3 km radius of Samdrupjongkhar town, as a CNVR programme had also been performed in these places. The body condition of both sterilized and entire dogs were scored in Thimphu through visual assessment on a scale of 1 to 5 based on illustrations available in Figure 5.1 and at (1 = very thin, 2 = thin, 3 = ideal, 4 = overweight and 5 = markedly obese). The skin condition (mange score) was assessed for each dog using a four point scale (0 = normal, 1 = mild, 2 = moderate, 3 = severe) as illustrated in Figure 5.2. Dogs were visually assessed in the street without any physical contact to maximize the examiner s safety and to minimize the stress to the dogs. Body and skin condition of the dogs were assessed only in Thimphu as it is timeconsuming and must be performed by suitably trained personnel. 124

; Dzongkhags; males and females; and the number of CNVR campaigns conducted in each Dzongkhag.")
148 1 = Very Thin 2 = Thin 3 = Ideal weight 4 = Overweight 5 = Markedly obese Figure 5. 1 Body condition score card of dogs 0 = Normal 1 = Mild 2 = Moderate 3 = Severe Figure 5. 2 Skin condition score card of dogs Statistical analyses Descriptive analyses of the proportion of sterilized and vaccinated dogs, lactating female among adult female dogs and puppies were undertaken and expressed as percentages. Odds ratios and their 95% confidence intervals were calculated to determine the association between: ear notched animals (dogs sterilized and vaccinated) and unmarked dogs (assumed entire and non-vaccinated dogs); Dzongkhags; males and females; and the number of CNVR campaigns conducted in each Dzongkhag. The Chisquare test of independence was used to compare the difference in the proportion of neutered dogs (notched dogs) between genders, Dzongkhags and the number of CNVR campaigns performed prior to the survey. The proportion of puppies (of all dogs) sighted and lactating females of adult females were also compared using chi-square tests. To determine if there was an association between the CNVR programme and various health indices, the proportion of dogs in the different assessment groups were also compared using chi-square tests. A Pearson s product-moment correlation 125
149 coefficient was computed to assess the relationship between the proportion of dogs covered under the CNVR and the proportion of lactating bitches and puppies as well as the number of months elapsed after the latest CNVR campaign. Correlation tests were also carried out to assess the association between the number of months elapsed after the latest CNVR campaigns and the proportion of puppies and lactating females sighted during the survey. The data from Tsirang town was not included to assess the relationship between the time elapsed and the proportion of puppies and lactating females as the CNVR programme was being implemented during the survey and many lactating bitches and puppies were observed which could have biased the analysis. Statistical significance was assessed at the 5% level. All analyses were carried out using the statistical software R (R Development Core Team, 2013). 5.3 Results Population surveys A total of 2,815 dogs (2,510 adults and 305 puppies) were sighted during the survey period in the main towns of the six Dzongkhags included in this study. All dogs found in public places were classified as free-roaming dogs. Of the 2,510 adult dogs sighted, the neuter status of 70 dogs was not known and consequently the final analyses were performed on 2,440 adult dogs CNVR Coverage Just over half (52%; 95% CI %) of the adult dogs sighted had been processed through the CNVR program. Of these 56.1% were males and 43.9% females. There were no significant differences in the sterilization and vaccination coverage between male (53%) and female dogs (52%) (χ² = 0.256, df = 1; p = 0.613). 126
150 The proportion of dogs processed in previous CNVR programmes in different Dzongkhags, genders and number of CNVR campaigns are presented in Table 5.1. The overall coverage was lowest in Bumthang (44/137, 32%) and highest in Samdrupjongkhar (182/252, 72%) and was significantly different between the six Dzongkhags (χ² = 70.45, df = 5; p <0.001). Free-roaming dogs were more likely to have been sterilized and vaccinated in Samtse, Samdrupjongkhar, Tashigang and Thimphu than in Bumthang (Table 5.1). Those Dzongkhags that had the CNVR campaigns for the second time were 1.37 times (95% CI ) more likely to contain neutered dogs than Dzongkhags where only one round of CNVR campaign had been held. There was a negative correlation between the proportion of dogs covered under a CNVR programme and the number of months elapsed after the CNVR campaign, although this was not statistically significant (r = , n = 6; p = 0.217). There was no significant difference in the coverage in Samdrupjongkhar town (107/139, 77%) compared with the adjacent border town in India (Mela Bazaar) (49/65, 75%) (χ² = 0.06, df = 1; p = 0.803) Proportion of lactating females and puppies The number and proportion of lactating females and puppies sighted in the main towns of six Dzongkhags is presented in Table A total of 91 (8.3%) lactating females and 305 (11.1%) puppies were counted in the visited areas. The proportion of lactating females of all adult female dogs was significantly different between Dzongkhags (χ² = 11.95, df = 5; p = 0.035) with the highest percentage in Bumthang (9/54, 16.7%) followed by Samtse (12/91, 13.2%) and Tsirang (10/108, 9.3%). Similarly the proportion of puppies was significantly different between Dzongkhags (χ² = 38.73, df = 5; p < 0.001) with the highest proportion in Tsirang (38/187, 20.3%) followed by Samtse (43/234, 18.4%) and Bumthang (23/160, 14.4%). There was a negative, but not significant, correlation between the proportion of dogs covered under CNVR and the 127
151 proportion of lactating bitches (r = , n = 6, p = 0.093) and puppies (r = , n = 6; p = 0.202). There was a positive correlation between the number of months elapsed after the last CNVR campaign and the proportion of puppies (r = 0.680, n = 5; p = 0.207) sighted and the proportion of lactating females (r = 0.876, n = 5; p = 0.051). Table 5.1 Percentage and odds ratio of the free-roaming dogs sterilized and vaccinated in the main towns of the selected Dzongkhags Notched dogs Un-notched dogs Odds Ratio Variable n (%) n (%) (95% CI) p-value Dzongkhag Bumthang 44 (32.1) 93 (67.8) 1.00 Samtse 100 (52.4) 91 (47.6) 2.31 ( ) <0.001 Samdrupjongkhar 182 (72.2) 70 (27.8) 5.46 ( ) <0.001 Tashigang 55 (59.1) 38 (40.9) 3.04 ( ) <0.001 Thimphu 825 (51.0) 793 (49.0) 2.19 ( ) <0.001 Tsirang 64 (43.0) 85 (57.0) 1.59 ( ) Gender Male 726 (53.0) 644 (47.0) 1.00 Female 556 (51.9) 514 (48.1) 0.96 ( ) Number of CNVR campaigns conducted One round 263 (46.1) 307 (53.9) 1.00 Two rounds 1007 (53.9) 863 (46.1) 1.36 ( ) Total 1270 (52.0) 1170 (48.0) CNVR programme in Samdrupjongkhar town and adjoining Indian border towns within 3 km of the international border Bhutan side 107 (77.0) 32 (23.0) 1.00 India side 49 (75.4) 16 (24.6) 0.91 ( )
152 5.3.4 Body and skin condition of dogs In total 1,835 adult dogs (857 notched and 978 un-notched) from Thimphu were assessed for their body and skin condition. Approximately two-thirds (61%; 95% CI ) had a body condition score of 3 which is considered an ideal body condition, 32% (95% CI 29.6 to 39.9) were thin to very thin (scores 2 and 1) and only 7% (95% CI 5.8 to 8.1) were categorized as stout to overweight (scores 4 and 5) (Figure 5.3). Only 21% (95% CI 19.3 to 23.0) of the sighted dogs had skin problems (skin condition scores 1 to 3). Figure 5. 3 Proportion of dogs in the five body condition categories in notched and un-notched dogs (n = 1,835). 129
153 Table 5.2 Number and percentage of lactating bitches and puppies counted in the main towns of the six selected Dzongkhags Dzongkhag Total dogs Mature female Puppies (%) Lactating (%)* Remarks Bumthang (14.4) 9 (20.0) Samtse (18.4) 12 (15.2) Samdrupjongkhar (8.0) 7 (6.9) Tashigang (7.0) 2 (4.7) Thimphu (9.6) 51 (7.2) Tsirang (20.3) 10 (10.2) First round in Sep 2009 to Jan 2010 First round in Feb to May 2011 Second round completed in January 2012 First round in May to August 2011 Second round completed in November 2011 First round ongoing Total (11.1) 91 (8.5) CNVR programme in Samdrupjongkhar town and adjoining Indian border towns within 3 km of the international border Bhutan side (7.3) 4 (3.0) Second round completed Indian side (8.3) 1 (1.5) in January 2012 * Percentage of mature females lactating 130
154 Neutered dogs had a significantly better body condition (higher body score) than entire dogs (χ² = 27.39, df = 4, p < 0.001) with 36% of un-notched dogs being categorised as thin to very thin compared with 26% of notched dogs (Figure 5.3). The proportion of dogs in the four skin condition categories for notched and un-notched dogs is presented in Figure 5.4. There was no significant difference in the proportion of dogs with skin problems in the notched (19%) and un-notched dogs (23%) (χ² = 6.63, df = 3, p = 0.085). Figure 5. 4 Proportion of dogs with different skin condition categories in Thimphu (n = 1,835) 131
155 5.4 Discussion The counting of dogs with and without ear notches, lactating bitches and puppies in the selected towns of six Dzongkhags provided quantitative evidence of the progress of the CNVR programme in Bhutan. The CNVR coverage varied from 32% in Bumthang to 73% in Samdrupjongkhar (Table 5.1). This finding is consistent with studies conducted in other countries where the coverage has differed widely between locations (Matter et al., 2000; Kitala et al., 2001; Kayali et al., 2003; Hiby et al., 2011). The coverage in the Dzongkhags in the current study was highly dependent on when the CNVR was carried out and the number of CNVR programmes conducted in that particular area. Bumthang Dzongkhag had the lowest coverage as the first round of CNVR was completed in January 2010 and there had been no subsequent follow-up campaigns. In contrast, Samdrupjongkhar had the highest coverage as the second round of CNVR program had already been completed. Similarly the CNVR coverage in Mela Bazaar, an adjoining Indian town was high. Because of this high coverage in Samdrupjongkhar and the adjoining Indian town, no rabies outbreaks have been reported in Samdrupjongkhar since The coverage in five of the six Dzongkhags surveyed were lower than the WHO/WSPA recommended minimum vaccination and sterilization coverage of 70% to eliminate rabies in dogs and to stabilize the dog population, respectively (WHO, 1987; WHO & WSPA, 1990; Coleman & Dye, 1996; Cleaveland et al., 2003; WHO, 2004). A large reduction in the street dog population was reported in two Indian cities following the implementation of an ABC Programme. Reece and Chawla (2006) reported a 28% reduction in the population of street dogs in Jaipur following the ABC Programme implemented between 1994 and 2002, as well as a reduction in the number of human rabies cases to zero in the campaign area when compared with an area where a campaign had not been conducted. Similarly a reduction in the street dog population in 132
156 three of the five areas surveyed was reported in Jodhpur following the implementation of an ABC program between 2005 and 2007 (Totton et al., 2010a). In Bhutan the reduction in the population of street dogs following the implementation of a CNVR programme may not be as fast as that observed in Jaipur and Jodhpur in India as CNVR campaigns in Bhutan are not concentrated in a particular towns or Dzongkhag. The CNVR team moved from Dzongkhag to Dzongkhag throughout the country unlike the programme in Jaipur and Jodhpur where it was concentrated in individual cities over a long period of time.. Therefore it is important that the CNVR programme is continued in all Dzongkhags of Bhutan until the population has stabilized. With the existing composition of the CNVR team only three Dzongkhags can be covered simultaneously at a given time. In order to have sustainable control of the dog population in Bhutan it is recommended to build a technical and staffing capacity in every Dzongkhag to carry out ABC programmes regularly, in addition to the existing CNVR team. Since rabies is endemic only in a few Dzongkhags, it is proposed that annual vaccination of dogs against rabies should be targeted in those Dzongkhags where the disease is endemic, in addition to the ongoing CNVR programme. In the current survey a higher number of male than female free-roaming dogs was found in all study areas. Similarly higher proportions of males have been observed in studies conducted in other developing countries (Brooks, 1990; Butler & Bingham, 2000; Kitala et al., 2001; Acosta-Jamett et al., 2010). This may be due to better survival rates of males compared with female dogs. The CNVR coverage in male dogs was slightly higher than female dogs, although ideally a higher proportion of females should be sterilized to have a greater impact on the dog population. The ABC programme for the street dog population in Jaipur covered only female dogs to maximize the impact of that programme (Reece & Chawla, 2006; Reece et al., 2008). In the current study it was 133
157 assumed that there was an equal probability of detecting a notched and un-notched dog during the field survey. However dogs not caught by the CNVR team are likely to be more cunning and therefore well hidden and it is likely that these dogs were also missed by the enumerators during the field surveys, potentially leading to overestimation of the number of dogs neutered in the CNVR programme. Approximately 75% of dogs observed on the Indian side had been neutered and vaccinated (Table 5.1). The programme had been successful due to the active involvement of members of the Bhutan Indian Friendship Association (BIFA) and local leaders on both sides of the border (Dechen, K Personal Communication). It is recommended that the CNVR program be extended to other border towns of India, in consultation with the local Indian authorities. This effort will create a buffer zone and significantly contribute towards the control of rabies in humans and other animals in both India and Bhutan. The number of lactating females and puppies seen following the CNVR programme is a good indicator of the success of the programme. Similarly it is anticipated that a successful campaign will result in a change in the age structure of the population with a greater proportion of adult dogs in areas where a CNVR programme had been conducted compared to areas where a programme had not been implemented. The proportion of lactating females and puppies seen during the current survey depended on the number of months elapsed after the last campaign and whether the team had visited the area a second time (Table 5.2). Bumthang had the highest proportion of lactating bitches as the last CNVR programme had been carried out from October 2009 to January The proportion of puppies was highest in Tsirang due to the fact that the first round of the CNVR was ongoing during the survey period and when the CNVR 134
158 team reached the Dzongkhag in December 2011, many female dogs had already whelped. A similar study conducted by Totton et al. (2010a) in the Indian city of Jodhpur reported a higher proportion of adults in the population (80 to 96%) when compared with juveniles (0-18%) and puppies (0-4%). Although there was a negative correlation between the proportion of dogs covered under CNVR and the proportion of lactating females and puppies, the correlation was not significant. This indicates that the current CNVR coverage is not sufficient to stabilize the free-roaming dog population and more dogs, especially females, should be neutered and vaccinated. Most of the free-roaming dogs in Thimphu were found to be in good health, most likely because they are fed by members of the local Buddhist communities. The health condition of the neutered dogs was generally better than that of entire dogs (Figure 5.3). A similar finding was reported in a study conducted in Rajasthan in India (Totton et al., 2011; Yoak et al., 2014). This is due to a number of behavioral and health benefits arising from the neutering of dogs (Reichler, 2009). The repeated pregnancies in female dogs can physically stress the animals and the energy required to produce and raise a litter results in loss of body condition and an increased potential for infection (Jackman & Rowan, 2007). There is a reduced risk of acquiring cancer or other diseases of the reproductive organs, including TVT and pyometra, after sterilization (Michell, 1998; Jackman & Rowan, 2007). Neutering has been identified as an important risk factor for obesity in dogs due to increased food consumption, decreased metabolic rate and reduced physical activity (Robertson, 2003; German, 2005). However in this study few obese dogs (1%) were sighted. This could be due to the type of diet that free-roaming dogs can access and the physical activity involved in searching for food when compared to owned and confined dogs or dogs from other nations. 135
159 Approximately 20% of the dogs had skin problems with 17% having mild, 2% moderate and 1% severe problems (Figure 5.4). There was no significant difference in the skin condition scores between neutered and entire dogs. Although neutered dogs would be expected to have fewer skin problems as they were treated with ivermectin in this study, the time of examination after the single treatment was more than 3 months when the antiparasitic effect of ivermectin would have gone or been significantly reduced (Campbell & Benz, 1984; Scheidt et al., 1984). In contrast others have found a higher prevalence of skin problems in sterilized dogs. This was believed to be due to infections acquired during the CNVR programmes and the transfer of ticks, mites and fleas to dogs awaiting surgery when dogs comes in close contact with each other (Totton et al., 2011; Yoak et al., 2014). These contrasting findings may also be due to the influence of external factors such as climate, breed, and type of food available. It is likely that in the current study the prevalence of skin problems was underestimated as it is difficult to assess animals from a distance, in contrast to caught or anesthetized dogs. Through the ongoing CNVR programme 32,276 dogs were neutered and vaccinated, representing 65% of the 2005 dog population (DOL, 2006). In contrast, the CNVR coverage in the current study is estimated at 52%. The calculation of coverage (neutered and vaccinated) based on the earlier record may be an overestimate due to under estimation of the actual dog population in Bhutan in It is important to estimate the population of both owned and un-owned dogs using suitable scientific methods. Crosssectional household surveys have been performed to estimate the owned dog population (Downes et al., 2013). Free-roaming dog populations have been estimated by markresight surveys (Childs et al., 1998; Hiby et al., 2011; Dias et al., 2013; Amaral et al., 2014) and by counting all the dogs in a random sample of city sub-regions or blocks and extrapolating the count to the whole city after correcting for the missing proportion of 136
160 the dogs during the counting (Hiby, 2005; WSPA, 2009; Kakati, 2010; Hiby, 2014). In order to plan long term dog population control it is important to confirm the proportion of owned dogs that are free-roaming. Enumeration of dogs should be undertaken before the start of any CNVR programme, and during and after its implementation to allow effective planning of the programme and monitoring of its success, respectively. In order to continuously monitor and evaluate the success of the CNVR programme, indicator counts should be undertaken by selecting one or two transect routes across the cities. Repeated indicator counts should be conducted along the fixed transect routes at least twice a year, approximately six weeks after the peak whelping season i.e. July and January in Bhutan. This study highlighted the status of the CNVR programme in Bhutan, as well as various benefits to the health and welfare of the dogs. Dogs that were neutered and vaccinated were found to be in better body condition compared with entire and un-vaccinated dogs. The overall CNVR coverage of 52% is much lower than the WHO Expert Committee recommended 70% vaccination and sterilization coverage to break the rabies cycle and to maintain a stable dog population. This indicates that there should be continuous follow-up CNVR programmes in all Dzongkhags by specifically targeting females. The CNVR programme should be continued and combined with education on responsible dog ownership and habitat control (food, water and shelter) through a one health approach. Free-roaming dogs may potentially arise from owned dogs so therefore there is a need to understand the owned dog population as well. Control of a population and rabies requires reproductive control and vaccination of both owned and free-roaming dogs, and in the following chapter information on the size and demography of the owned dog population in Bhutan is provided. 137
161 CHAPTER SIX Size and demography of the domestic dog population in Bhutan 6.1 Introduction As outlined in the previous chapters the nationwide CNVR programme was initiated in Bhutan in The importance of knowing the size and demography of owned dogs is necessary to monitor and evaluate the success of a CNVR programme (Downes et al., 2013; FAO, 2014). The reported size of the owned dog population based on the annual livestock census is very low and is not a reliable indicator to estimate the CNVR coverage (Chapter 4). Conducting cross-sectional household surveys has been recommended to study the population demography of owned dogs (Downes et al., 2013). Numerous studies have been undertaken in an effort to understand the demographics of dogs and how to address the problems associated with owned and stray dogs (Butler & Bingham, 2000; Matter et al., 2000; Kongkaew et al., 2004; Acosta-Jamett et al., 2010). Through such surveys the proportion of households that own dogs and the mean number of dogs owned by these dog owning households can be determined so that the size of the owned dog population in a city or country can be estimated. It is important to enumerate the baseline (initial) dog population when interpreting the prevalence of disease, to plan disease control programmes and to develop focussed strategies for providing veterinary care (Butler & Bingham, 2000; Matter et al., 2000). The proportion of households that own dogs has been investigated in numerous countries, including Sri Lanka (rural 57.0%) (Matter et al., 2000), Thailand (73.7%) (Kongkaew et al., 2004), Chile (rural 53.1%, urban 89.0%) (Acosta-Jamett et al., 2010), Zimbabwe (rural 62.0%) (Butler & Bingham, 2000) and Mexico (urban 54.0%) (Flores-Ibarra & Estrella- 138
162 Valenzuella, 2004). The mean number of dogs per dog owning household has been reported to range from 1.2 to 3.2 (Matter et al., 2000; Flores-Ibarra & Estrella- Valenzuella, 2004; Kongkaew et al., 2004; Ortega-Pacheco et al., 2007; Acosta-Jamett et al., 2010). The population of owned dogs has then been estimated by multiplying the mean number of dogs owned per dog owning household by the proportion of dog owning households in the survey by the number of households present in a country from national statistical sources in the USA (AVMA, 2002), Zimbabwe (Butler & Bingham, 2000), Mexico (Ortega-Pacheco et al., 2007) and Italy (Slater et al., 2008b). No studies have been undertaken in Bhutan which have looked at the demographics of owned dogs, even though understanding the size and demography of this population would allow better planning and implementation of effective population control and improve the health and welfare of all dogs in the country. Therefore the objectives of this study were to: (1) describe the pattern of dog ownership in Bhutanese households; (2) describe the demographics of the owned dog population; (3) estimate the size of the owned dog population in Bhutan; (4) estimate the proportion of owned dogs that were free-roaming and conversely the proportion of free-roaming dogs that were owned in Gelephu and Phuentsholing town; and (5) estimate the size of the stray dog population in Bhutan from the estimated population of owned dogs. 6.2 Materials and Methods Brief description of study area In 2011 Bhutan contained 127,942 households of which 84,427 were rural and 43,515 urban (NSB, 2012). Bhutan has a total human population of 720,680 with approximately 65% living in rural areas (rural population 466,017 and urban population 254,663) (NSB, 2012). According to national statistics the total number of owned dogs 139
163 in the nation was 24,104 (DOL, 2011). However there are also a large number of stray dogs in Bhutan which are well tolerated by the Bhutanese community. For the purpose of this study, dogs that were fed, cared-for and claimed by a household as being owned were considered to be owned dogs Cross-sectional household survey In January and February 2012 a household survey was conducted in six Dzongkhags (Bumthang, Samtse, Samdrupjongkhar, Trashigang, Thimphu and Tsirang Figure 3.1) which cover both rural and urban areas. Household surveys were also conducted in two southern border sub-dzongkhags of Gelephu (Sarpang Dzongkhag) and Phuentsholing (Chhukha Dzongkhag) following the mass rabies vaccination campaign carried out on World Rabies Day (28 th September 2012). In total 1,301 households from both rural (585) and urban (716) settlements were selected for inclusion in the study. The selection of the households for the survey was as described in Chapter 3. One adult member of each selected household was interviewed using a face to face method to understand the number of dogs owned by that particular household and their demographics. The questionnaires consisted of two parts: a household survey; and an individual dog survey. The household survey was designed to collect information about the respondents and the dog owning status of that household. For the dog survey, data were collected on the demographic characteristics of the owned dogs including their age, sex, and neuter and vaccination status. The dog owners were also asked to report on the source and purpose of keeping a dog and how they managed (looked after) their dogs. All selected households (1,301) were interviewed in the household survey, while only 413 households (175 urban and 238 rural) that owned dogs were included in the dog survey. 140
164 6.2.3 Estimation of the dog population From the household surveys the proportion of dog owning households, the mean number of dogs owned per dog owning household, the mean number of dogs for all households and the mean number of dogs per person were calculated. The size of the owned dog population was estimated by several methods which had been used in other countries (Butler & Bingham, 2000; AVMA, 2002; Slater et al., 2008b; Downes et al., 2013). These involved: (a) multiplying the mean number of owned dogs per household (Table 6.1) by the number of households in the urban and rural areas, as per the national statistics (NSB, 2012); and (b) multiplying the mean number of dogs per person (Table 6.1) by the number of people in the area as per the national statistics (NSB, 2006). Using these two methods the size of the owned dog population were compared and biases for the two different methods considered. The ratio of stray to owned dogs presented to the CNVR clinic from July 2011 to June 2013 was estimated (Table 6.1). The total number of owned dogs was then multiplied by this ratio to give an estimate of the total stray dog population. CNVR data from Thimphu Dzongkhag was not included in the estimation of the ratio of stray and owned dogs as sterilization and vaccination of the owned dogs in Thimphu city was performed by the National Animal Hospital on a weekly basis and consequently very few owned dogs were brought to the CNVR clinic (Pema Tshewang Personnel communication). Including the Thimphu data would have resulted in an over-estimation of the mean number of stray dogs. The density of dogs in each Dzongkhag was calculated by dividing the estimated dog population (both owned and stray) by the size of the Dzongkhag (km 2 ). 141
165 6.2.4 Proportion of owned dogs that were free-roaming A one day free rabies vaccination campaign was organized on the 28 th September 2012 coinciding with World Rabies Day in Gelephu and Phuentsholing. This involved setting up temporary vaccination posts (VP) at strategic locations. Each vaccinated dog was identified by placing a coloured synthetic collar around its neck. On the following day, the households in the vicinity of the VP were visited by the interview team. Households closer to the VP were initially visited and then the interview teams radiated outwards until the required number of households to be interviewed was achieved. Dog owners were asked if their dog(s) had been taken to a VP on World Rabies Day and the dogs were also checked for the presence of the identifying collars. This provided an opportunity to estimate the size of the owned dog population and their recapture probability in the area by using Lincoln Petersen s formula (Caughley, 1977). According to this formula the total population (N) can be estimated as Where attached), was the number of individuals that were captured and marked (collars was the number of individuals that were captured in the second capture session and was the number of individuals in that were recaptured (dogs with collars). The variance and 95% CI of the population estimate was done using the formula described in Chapter 2 (Section 2.9.2). The recapture probability or the detectability rate ( ) was estimated by dividing the dogs that were captured in the second session ( ) by the estimated population ( ). 142
166 The population size of owned dogs that were found roaming was estimated by dividing the number of dogs with collars that were found (seen) roaming during the transect walk ( ) by the detectability rate ( ). Thus the proportion of owned dogs that were found roaming ( ) was calculated by dividing the estimated roaming owned dog population ( ) by the total estimated owned dog population ( ) Proportion of free-roaming dogs that were owned The mark-resight method was also undertaken in Gelephu and Phuentsholing to estimate the size of the free-roaming dog population ( ). A two person marking team walked through the demarcated areas following roads and settlements and sprayed vegetable coloured paints on all dogs seen without actually catching them. The marking team also recorded the location of where the dog was sighted, as well as details on the dog s sex, age and presence or absence of an ear notch (neuter status) in the marked dogs. The transect walk was performed on the day following that when the dogs were marked. Details on all the sighted dogs, such as presence or absence of colour (paint) marks, neuter status (presence or absence of ear notch), sex, and age, were recorded during the transect walk. The Lincoln Petersen s formula (Section 6.2.4) was used to estimate the free-roaming dog population in the two towns ( ). The proportion of freeroaming dogs that were owned was calculated by dividing the estimated number of roaming owned dogs ( ) by the estimated number of total roaming dogs ( ). 143
167 6.2.6 Statistical Analyses The questionnaire data were entered into a Microsoft Access database and descriptive analyses were carried out using Microsoft Excel (Microsoft Excel 2010, Redmond, USA) and Statistical software R (R Development Core Team, 2013). ArcGIS was used for area measurements and for the mapping of the densities of the dogs. Descriptive analyses were performed to understand the household and demographic characteristics of the owned dogs, as well as the management practices followed by the owners. The Chi-square test of independence was used to compare the demographic characteristics of the owned dogs between urban and rural areas. Bootstrap and Monte Carlo analyses were performed in Excel using the add-in Pop-tools version ( (Hood, 2010) to estimate 95% confidence intervals (95% CI) for the proportion of dog owning households, number of dogs owned per household, number of dogs per person or dog : human ratio and the ratio of stray to owned dogs presented to CNVR clinic. The means and 95% CI were used to estimate the dog population in the rural and urban areas with corresponding 95%CI as described previously. The beta distribution was used to estimate the proportion of owned dogs that were free-roaming and the proportion of free-roaming dogs that were owned. 6.3 Results Household characteristics The vital statistics relating to dog ownership in rural and urban areas are presented in Table 6.1. In 1,301 enrolled households, a total of 590 dogs were owned by 31.6% (95% CI ) of the households. This corresponded overall to dogs owned per household (95% CI ). More than half (55%) of the enrolled households were located in urban areas (n = 716) with a total of 3,265 inhabitants with an average household size of 4.56 (95% CI ). The 585 households enrolled in the rural 144
168 areas contained 3,006 inhabitants with an average household size of 5.14 people (95% CI ). Approximately one quarter (24.4%; 95% CI ) of the participating households in the urban areas owned dogs (n = 237) with an average of (95% CI: ) dogs owned for all households and (95% CI ) dogs for the dog owning urban household. Approximately 40% of the households in rural areas (40.8%; 95% CI ) owned dogs (n = 353) with a mean of (95% CI ) dogs for all rural households and (95% CI ) dogs per dog owning rural household. The dog : human ratio in the urban area was 1:16.30 (95% CI 1 : ) which was equivalent to (95% CI ) dogs per person. In contrast in rural areas, the dog : human ratio was 1:8.43 (95% CI ), equivalent to (95% CI ) dogs per person. 145
169 Table 6.1 Vital statistics (with 95% CI) of dog ownership in rural and urban areas Urban Rural Overall Variables Mean (95% CI) Mean (95% CI) Mean (95% CI) Average number of people per household a 4.56 ( ) 5.14 ( ) 4.83 ( ) Percentage of households owning dogs ( ) ( ) ( ) Average number of dogs owned per household b 0.33 ( ) 0.60 ( ) 0.45 ( ) Average number of dogs owned per 1.37 ( ) 1.48 ( ) 1.44 ( ) dog owning household c Human : dog ratio d ( ) 8.43 ( ) ( ) Dogs per person 0.06 ( ) 0.12 ( ) 0.09 ( ) Stray dogs per owned dogs e 1.58 ( ) ( ) ( ) * The estimates of the above parameters ( a, b, c, d ) were obtained from the cross-sectional household surveys of 1,301 respondents (716 urban and 585 rural). The estimate of stray dogs per owned dogs e was acquired from the CNVR records of dogs (stray and owned) presented to CNVR clinic from 01 July 2011 to 30 June % CI were estimated by using bootstrap and Monte Carlo analysis with 10,000 iterations. 146
170 6.3.2 Owned dog demographics and management The demographics of the owned dogs are summarised in Table 6.2. The sex ratio (male: female) for the owned dogs was 1.31: 1 and 2.05:1 in the urban and rural areas, respectively. The age of the dogs was highly skewed towards the adult age groups in both urban (79.8%) and rural (86.3%) areas. Local breeds dominated in both urban (60.8%) and rural (78.0%) areas, although there was a higher proportion of purebred dogs in the urban areas than in rural areas. There were significant differences in the sex, breed and age of dogs between rural and urban areas (all p values < 0.05). A higher proportion of dogs from rural areas were neutered (71.2%) than from urban areas (45.4%) (p < 0.001). There was no significant difference in the proportion of dogs vaccinated against rabies in the urban (77.6%) and rural (78.0%) areas (p = 0.562). The results of questions relating to the management of the owned dogs is summarised in Table 6.3. The main sources of dogs were as gifts from friends or family members (44.7%), adoption from the street (27%) or from the progeny of other owned dogs (15.1%). The source of dogs was significantly different between the rural and urban areas (χ² = , df = 4, p = 0.009). The purpose of keeping a dog also differed significantly between households in urban and rural areas (χ² = , df = 2, p < 0.001). In urban areas most dogs (62.4%) were kept as pets, whilst in rural areas they were mainly kept to guard crops, livestock and premises (73.0%). Dogs were mainly fed by household members in both rural and urban areas. More than 50% of the respondents indicated that their dog(s) lived either inside their house or premises, while 39% of owners reported that their dogs were free roaming. Only approximately 10% of the households provided kennels for their dogs. A significantly higher proportion of dogs from rural areas were free-ranging (49.3%) than from urban areas (24.3%) (χ² = , df = 3, p < 0.001). 147
171 Table 6.2 Demographic characteristics of owned dogs obtained from household surveys in urban and rural areas of Bhutan (n = 590, Urban = 237, Rural = 353) Variables Overall Urban Rural n (%) n (%) n (%) χ² Df p-value Sex Female 216 (37.0) 102 (43.2) 114 (32.8) Male 368 (63.0) 134 (56.8) 234 (67.2) Missing data 6 Age Puppy (<6months) 46 (7.9) 26 (11.2) 20 (5.7) Juvenile (6 to 12 months) 49 (8.4) 21 (9.0) 28 (8.0) Adult >12 months 487 (83.7) 186 (79.8) 301 (86.3) Missing data 8 Breed Local (non descript) 374 (71.1) 129 (60.8) 245 (78.0) <0.001 Purebred* 152 (28.9) 83 (39.2) 69 (22.0) Missing data 64 Neuter status Entire 205 (39.0) 113 (54.5) 92 (28.8) <0.001 Neutered 321 (61.0) 94 (45.4) 227 (71.2) Missing data 64 Rabies vaccination Yes 453 (77.8) 184 (77.6) 269 (78.0) No 70 (12.0) 31 (13.1) 39 (11.3) Not sure 59 (10.2) 22 (9.3) 37 (10.7) Missing data 8 *Including Lhasa Apso, Tibetan Mastiff, Alsatian, Pomeranian, Dalmatian Size of the owned dog population The number of owned dogs for all of Bhutan (65,312) was estimated through extrapolation of the mean number of dogs owned in the surveyed households. More dogs were estimated to be present in rural areas (50,909; 95% CI 44,409 57,579) than urban areas (14,403; 95% CI 12,228 16,753). The estimated number of owned dogs in different Dzongkhags is summarised in Table 6.4. Using the mean number of dogs owned per person, the population of owned dogs was estimated to be 71,245 with 148
172 55,456 (95% CI 48,000 63,844) in rural areas and 15,789 (95% CI 13,242 18,336) in urban areas. The number of dogs estimated from the number of dogs owned per person in the different Dzongkhags is outlined in Table 6.5. More dogs were found in Thimphu, Samtse, Chhukha and Tashigang than Gasa and Haa. The ratio of owned dogs to humans in the country was estimated to be 1 : Number of stray dogs The number of stray dogs present in Bhutan was estimated at 48,379 (Table 6.6). Of these it was estimated that 22,772 (95% CI 18,667 27,583) were located in urban areas and 25,607 (95% CI 21,433 30,432) in rural areas. In Bhutan it was estimated that there were stray dogs per km 2. The ratio of stray dogs to humans was estimated to be 1 : The overall ratio of dogs (including owned and stray) to humans was estimated to be 1 : Density of owned and stray dogs The density of the owned and stray dogs in different Dzongkhags is presented in Table 6.7. The overall dog density in the country varied from 0.20 to dogs per km 2, with a country wide estimate of 2.96 dogs per km 2. The density of owned and stray dogs in Bhutan is 1.70 and 1.26 dogs per km 2 respectively (Table 6.7). The highest owned dog density was found in Samtse followed by Thimphu and Tsirang (Table 6.7 and Figure 6.1 (a). The highest stray dog density was estimated in Thimphu followed by Samtse and Chukha (Figure 6.1 (b) and Table 6.7). Gasa had the lowest density of both owned and stray dogs (Figure 6a, Figure 6b and Table 6.7). 149
173 Table 6.3 The management practices for dogs adopted by households in urban (n = 175) and rural areas (n = 238) of Bhutan Variables Overall Urban Rural n (%) n (%) n (%) χ² df p-value Source Offspring from owned bitch 61 (15.1) 19 (11.1) 42 (18.2) Gift from friend/ family 180 (44.7) 83 (48.2) 97 (42.0) Adopted from street* 109 (27.0) 44 (25.6) 65 (28.1) Purchased 35 (8.7) 22 (12.8) 13 (5.6) Other source 18 (4.5) 4 (2.3) 14 (6.1) Missing data 10 Purpose Pet 154 (38.0) 106 (62.4) 48 (20.4) <0.001 Guard 235 (58.0) 62 (36.5) 173 (73.6) Other purpose 16 (4.0) 2 (1.2) 14 (6.0) Missing data 8 Who feeds the dog? Household members 394 (96.1) 165 (95.4) 229 (96.6) Other person 16 (3.9) 8 (4.6) 8 (3.4) Missing data 3 What shelter do you provide for your dog? Keep in dog house 40 (9.9) 17 (9.8) 23 (10.0) <0.001 Live inside house with family 133 (32.9) 66 (38.2) 67 (29.0) Live within home premise 75 (18.6) 48 (27.7) 27 (11.7) Free ranging 156 (38.6) 42 (24.3) 114 (49.3) Missing data 9 How often would members of your household feed a stray dog? Daily 68 (17.2) 26 (15.2) 42 (18.6) Occasionally 141 (35.6) 76 (44.4) 65 (29.0) Never 187 (47.2) 69 (40.4) 118 (52.4) Missing data 17 *Picked up the stray dogs from the street and they looked after it. 150
174 Table 6.4 Estimated number of owned dogs in different Dzongkhags of Bhutan Number of Households Estimated owned dog population (95% CI) Dzongkhag Urban Rural Total Urban * Rural Total Bumthang ( ) 1284 ( ) 1515 Chhukha ( ) 3516 ( ) 5820 Dagana ( ) 2320 ( ) 2528 Gasa (28-38) 356 ( ) 388 Haa ( ) 762 ( ) 929 Lhuentse (77-106) 1667 ( ) 1758 Monggar ( ) 3677 ( ) 4167 Paro ( ) 3796 ( ) 4059 Pemagatshel ( ) 2474 (2158 (2798) 2665 Punakha ( ) 2152 ( ) 2466 Samdrupjongkhar ( ) 3134 ( ) 3796 Samtse ( ) 5622 ( ) 6408 Sarpang ( ) 3022 ( ) 3920 Thimphu ( ) 1623 ( ) 7534 Trashigang ( ) 5387 ( ) 5798 Trashiyangtse ( ) 1926 ( ) 2111 Trongsa ( ) 1348 ( ) 1538 Tsirang ( ) 2260 ( ) 2383 Wangdue ( ) 2882 ( ) 3606 Zhemgang ( ) 1702 ( ) 1921 Total ( ) ( ) * Estimated owned dog population for the urban areas calculated by multiplying the mean number of dogs per household (0.331) from the survey (Table 6.1) by the number of households in the urban area from national statistics. For example, Bumthang urban owned dog population estimate = x 697 = 231 (lower 95% CI = x 697 = 196 & upper 95% CI = x 697 = 268). 151
175 Table 6.5 Estimation of the number of owned in each Dzongkhag (urban and rural) of Bhutan Human Population (2012) Estimated owned dog population (95% CI) Dzongkhag Urban Rural Total Urban Rural * Total Bumthang ( ) 1509 ( ) 1847 Chhukha ( ) 5254 ( ) 7737 Dagana ( ) 2488 ( ) 2808 Gasa (33-46) 344 ( ) 383 Haa ( ) 1234 ( ) 1395 Lhuentse ( ) 1764 ( ) 1897 Monggar ( ) 3790 ( ) 4427 Paro ( ) 4068 ( ) 4501 Pemagatshel ( ) 2405 ( ) 2662 Punakha ( ) 2682 ( ) 2930 Samdrupjongkhar ( ) 3034 ( ) 3853 Samtse ( ) 6191 ( ) 7152 Sarpang ( ) 3215 ( ) 4208 Thimphu ( ) 1864 ( ) 7647 Trashigang ( ) 5317 ( ) 5897 Trashiyangtse ( ) 1865 ( ) 2130 Trongsa ( ) 1349 ( ) 1591 Tsirang ( ) 2154 ( ) 2327 Wangdue ( ) 2996 ( ) 3644 Zhemgang ( ) 1932 ( ) 2207 Total ( ) ( ) * Estimated owned dog population for the rural areas calculated by multiplying the mean number of dogs per person (0.119) from the survey (Table 6.1) by the human population in the urban area from national statistics. 152

 Owned dogs")
176 (a) (b) Figure 6. 1 The density of dogs (per km 2 ) in different Dzongkhags (a) Owned dogs (b) Stray dogs. 153
177 Table 6.6 Estimation of the number of stray dogs in different Dzongkhags in Bhutan (urban and rural) Owned dog population Estimated stray dog population* (95% CI) Dzongkhag Urban Rural Total Urban Rural Total Bumthang ( ) 646 ( ) 1011 Chhukha ( ) 1769 ( ) 5411 Dagana ( ) 1167 ( ) 1495 Gasa (42-62) 179 ( ) 230 Haa ( ) 383 ( ) 648 Lhuentse ( ) 839 ( ) 983 Monggar ( ) 1850 ( ) 2624 Paro ( ) 1909 ( ) 2325 Pemagatshel ( ) 1244 ( ) 1547 Punakha ( ) 1082 ( ) 1580 Samdrupjongkhar ( ) 1576 ( ) 2623 Samtse ( ) 2828 ( ) 4071 Sarpang ( ) 1520 ( ) 2940 Thimphu ( ) 817 ( ) Trashigang ( ) 2709 ( ) 3359 Trashiyangtse ( ) 969 ( ) 1262 Trongsa ( ) 678 ( ) 979 Tsirang ( ) 1137 ( ) 1331 Wangdue ( ) 1450 ( ) 2594 Zhemgang ( ) 856 ( ) 1203 Total ( ) ( ) * Estimated stray dog population: This is calculated by multiplying the estimated owned dog population (Table 6.5) by the ratio of stray to owned dogs presented to the CNVR clinic from July 2011 to June 2013 (Table 6.1). 154
178 Table 6. 7 Dzongkhag wise density of owned and stray dogs in Bhutan Total area Dog population Density of dogs per sq. km. District (Sq. km) Owned Stray Total Owned Stray Total Bumthang Chhukha Dagana Gasa Haa Lhuentse Monggar Paro Pemagatshel Punakha Samdrupjongkhar Samtse Sarpang Thimphu Trashigang Trashiyangtse Trongsa Tsirang Wangdue Zhemgang Total Number of owned and free-roaming dogs in Gelephu and Phuentsholing estimated using the Lincoln Petersen Index The number of owned and free-roaming dogs in Gelephu and Phuentsholing estimated by using the Lincoln-Petersen index is summarised in Table 6.7. Using the recapture probability, the number of owned dogs that were roaming was also estimated. Based on the population estimate of free-roaming and owned dogs and the number of owned dogs that were roaming in the two towns, the proportion of owned dogs that were found roaming was estimated to be 22.6% (95% CI ) in Phuentsholing and 39.3% (95% CI ) in Gelephu. Of the total estimated free-roaming dog population, 15.6% (95% CI ) and 16.7% (95% CI ) were estimated to be owned dogs in Phuentsholing and Gelephu, respectively. 155
179 Table 6.8 Estimates of the number of owned and free-roaming dogs in Gelephu and Phuentsholing town using the Lincoln-Petersen index, estimate of roaming owned dog population size and the proportion of owned dogs that are roaming and proportion of roaming dogs that are owned Area No. marked dogs (n 1 ) Total dogs counted (n 2 ) Resight marked dogs (m) Population estimate N (95% CI) Recapture rate (r) Marked owned dog roaming (m 1 ) Estimated owned dog roaming (n) Proportion owned dog roaming (p) - (95% CI) Owned dogs Phuentsholing ( ) ( ) ( )* Gelephu ( ) ( ) ( )* Stray dogs Phuentsholing ( ) ( ) ( )^ Gelephu ( ) ( ) ( )^ n 1 = number of marked dogs (collar for the owned and colour paints for the free-roaming dogs) n 2 = total number of dogs counted during the household visits for the owned dogs and transect walk for the free-roaming dogs. m = Number of marked dogs resighted during the household visits and during the transect walk for owned and free-roaming dogs. N = Total population size estimated using Lincoln-Petersen index (n 1 n 2 /m) r = recapture probability n 2 /N. m 1 = Number of owned dogs with the mark (collar) that were found roaming during the transect walk. n = Estimated owned dog population that were found roaming (m 1 /r). p = Proportion of owned dogs that were found roaming* and proportion of roaming dogs that are owned^. 156
180 6.4 Discussion Understanding the population size and demography of the domestic dog population is useful when planning disease control programmes, as well as when monitoring and evaluating CNVR programmes. This study provided insights into the size and demography of the owned dog population in Bhutan. The proportion of households owning dogs in urban areas of Bhutan (24.4%) was much lower than that reported in other studies in Chile (53.1%), Mexico (54.0%) and Kenya (53%) (Kitala et al., 2001; Flores-Ibarra & Estrella-Valenzuella, 2004; Ortega-Pacheco et al., 2007; Acosta-Jamett et al., 2010). The proportion of households owning dogs in rural area (40.8%) was also lower than that reported in Chile (89.0%), Kenya (53 81%), Sri Lanka (57.0%) and Zimbabwe (62.0%) (Butler & Bingham, 2000; Kitala et al., 2001; Acosta-Jamett et al., 2010). The mean number of dogs kept in dog owning households located in urban areas (1.37) was slightly lower than for households in rural areas (1.48). Higher numbers of dogs in households located in rural areas have been reported in other developing countries such as Chile, Kenya, Mexico and Sri Lanka where dogs are predominantly used for protection/guarding livestock, people or both (Matter et al., 2000; Kitala et al., 2001; Ortega-Pacheco et al., 2007; Acosta-Jamett et al., 2010). The demographic structure of the owned dogs in the current study was consistent with that of the demographics of owned dogs presented to the CNVR clinic (Chapter 4) which is dominated by male, adult and local breed dogs. A significantly higher proportion of dogs in rural areas were neutered than in urban areas. This could be due to an effective awareness programme by livestock extension agents based in the rural areas. Although in Chapter 3 a poor awareness about the prevention of rabies in dogs by vaccination was found, a high proportion of dogs from both urban (77.6%) and rural 157
181 (78.0%) areas had been reported to be vaccinated against rabies. This would indicate that dog owners get their dogs vaccinated during the frequent vaccination campaigns conducted by the Department of Livestock. In this study new dogs were most frequently obtained as gifts, which is similar to that found in other countries (Kitala et al., 2001; Flores-Ibarra & Estrella-Valenzuella, 2004; Kongkaew et al., 2004; Ortega-Pacheco et al., 2007; Suzuki et al., 2008; Acosta-Jamett et al., 2010). It is encouraging to note that a high proportion of dogs were adopted from the street in both rural (28.1%) and urban (25.6%) areas. A planned adoption programme for street dogs may further increase these rates of adoption, as well as help to reduce the size of the stray dog population (ICAMC, 2007; OIE, 2010). Animal welfare organizations, in collaboration with the Department of Livestock, should initiate an adoption program for street dogs which should include the neutering, health check, treating for parasites and grooming of the stray dogs to encourage the adoption of these dogs by the general community. In rural areas this study demonstrated that the main reason for keeping a dog or dogs was for guarding crops, premises or livestock, compared with keeping a dog as a pet or companion in urban areas. Similar studies have reported comparable findings in other countries (Butler & Bingham, 2000; Kitala et al., 2001; Flores-Ibarra & Estrella-Valenzuella, 2004; Kongkaew et al., 2004; Suzuki et al., 2008; Acosta-Jamett et al., 2010). The number of owned dogs based on extrapolation from the mean number of dogs per household and the mean number of dogs per person was 65,513 and 71,245, respectively. In this study the higher estimate of owned dogs from the total human population may have been biased by including temporary residents or residents from neighbouring India in the human population count. These residents would have been 158
182 attracted to the urban areas for employment prospects. This may result in overestimation of the dog population using this method and estimating the population through the household statistics may be more reliable. The official record of the owned dog population in Bhutan in 2011 was 24,104 (DOL, 2012) which is much lower than that estimated in the current study. The number of owned dogs that were presented to the CNVR clinic (Chapter 4) is also much higher than the official recorded dog population, which also indicates that the official figure is an underestimate and the current figure may be more realistic. The ratio of dogs to humans based on the official figure is 1:29.90 which is much higher than the estimate of 1:10.12 from the current study. The number of stray dogs in Bhutan, based on extrapolation of the ratio of stray to owned dogs, in this study was 48,389. The ratio of stray to owned dogs was estimated from the CNVR data recorded from June 2011 to July 2013 (Chapter 4). Although this estimate may be biased, as only those owned dogs that were voluntarily brought to the CNVR clinic were counted, this bias may be reduced as CNVR teams were not able to capture all stray dogs from the streets. Therefore the reliability of the stray dog population estimate using this method is highly dependent on the number of owned dogs estimated in this study (Table 6.4). The stray dog population estimated by this method should be further validated by comparing with other population estimates using different techniques in selected Dzongkhags. The overall dog density in Bhutan was estimated to be 3.47 dogs per km 2, with a range from 0.20 in Gasa and 9.85 dogs in Thimphu. Estimating this population density incorporated all areas of the country, including the forests, snow capped mountain areas and water bodies. These latter areas would expect to be sparsely populated with dogs. In contrast the density in the inhabited areas of Bhutan would be expected to be higher. 159
183 The populations of owned and stray dogs were estimated by using the Lincoln-Petersen index in the main towns of Gelephu and Phuentsholing. Based on the recapture probability of the collared dogs and sightings of the owned collared dogs during the transect walks, the number of owned dogs that were found roaming was estimated. Higher proportions of owned dogs were found roaming in Gelephu (39.3%) than in Phuentsholing (22.6%). This is likely because Gelephu is widespread with more single storeyed buildings, as opposed to Phuentsholing where most respondents live in rented apartments in multi-storeyed buildings and hence their dogs are more likely to be confined most of the time. This finding is also consistent with the household survey where 38.6% (urban 24.3%, rural 49.3%) of the respondents reported their dogs were not confined at all (Table 6.1). In the current study it was also found that 15.6 and 16.7% of the total free-roaming dogs in Phuentsholing and Gelephu, respectively were owned. The high proportion of owned dogs that were roaming highlights the need for good legislation on responsible dog ownership, as well as strict implementation of the law to avoid the roaming of owned dogs (WHO & WSPA, 1990; ICAMC, 2007; OIE, 2010). Estimating the population of owned and stray dogs by extrapolating the mean number of dogs per household or the mean number of dogs per person do not require complex statistical computations. However selection bias can be introduced in door to door surveys as logistical problems makes it difficult to access some households in rural areas and some participants in the urban areas have to be interviewed in their workplace as many houses are not occupied during working hours. This study generated baseline data on the population of owned and stray dogs in Bhutan which will be useful for monitoring and evaluating the CNVR programme. This is the 160
184 first study that has estimated the stray dog population in Bhutan by extrapolation of the ratio of stray to owned dogs presented to the CNVR clinic. In Chapter 8 the stray dog population estimated in this chapter will be compared with estimates calculated by using other methodologies. As well as controlling the population size, CNVR programmes are also designed to improve the health and welfare of dogs in a community. In the following chapter the health of free-roaming dogs in Bhutan is evaluated. 161
185 CHAPTER SEVEN Health status of the free-roaming dogs in Thimphu City Area: Benefits of an Animal Birth Control (ABC) Programme 7.1 Introduction There are a large number of free-roaming dogs in Bhutan, primarily because the dogs have sufficient food through access to edible wastes or through feed provided by the community (Chapter 1 and 3). It has been demonstrated that the combination of ABC and vaccination can be successful in reducing the size of a dog population, the incidence of rabies and improving the health and welfare conditions of free-roaming dogs (Reece & Chawla, 2006; Totton et al., 2010a). Although most of the free-roaming dogs in Bhutan have been shown to be in good health, some dogs are not (Chapters 4 and 5). Canine distemper (CD) and canine parvovirus (CP) are two of the most important contagious viral diseases of dogs and other carnivores, and are often acompanied by high mortality (Kahn, C.M. & Line, S., 2014; Kahn, C.M. & Line, S., 2014). Canine leptospirosis, caused by pathogenic spirochaetes of Leptospira interrogans (Adin & Cowgill, 2000), is an important infectious bacterial zoonosis of dogs. Yoak et al. (2014) reported improved health and a lower prevalence of CD, CP and leptospirosis in freeroaming dogs in Indian cities that had extended ABC programmes (Jaipur - 17 years and Jodhpur - 7 years), compared with a city (Madhopur) without an ABC programme. In the current thesis the skin and body condition of dogs presented to CNVR clinics in Bhutan (Chapter 4) and those observed in field population surveys (Chapter 5) has been reported. Comparison of the body and skin condition and the prevalence of common diseases between sterilized and sexually intact dogs is useful for evaluating the benefit 162
186 of an ABC programme on the health of dogs (Totton et al., 2011; Yoak et al., 2014). Therefore the objective of the study reported in this chapter were to: (1) estimate the prevalence of various health indices (seroprevalence of CDV, CPV and leptospirosis, skin condition scores and body condition scores) in the dog population in Thimphu Municipal area and; (2) test the association of an ABC programme with several health indices in this population. 7.2 Materials and Methods Study area This study was undertaken in Thimphu which is the capital and largest city in Bhutan with an estimated human population of 93,270 (NSB, 2012) representing more than 40% of the entire urban population in Bhutan. The city of Thimphu covers an area of 26 km 2 stretching along the bank of the Wangchu River which was divided into seven blocks called Tshodey. The city is located at N, E at an altitude of 2,300 metres above sea level. Temperatures range from a winter low of -2.6ºC at night to 12.3ºC during the day, to a summer high of 32ºC in the day and 21.6ºC at night (Anonymous, 2014b). There are large numbers of free-roaming dogs in the city of Thimphu that live closely with the human residents. Animal birth control in Thimphu has focussed on sterilization and vaccination of freeroaming dogs to reduce the size of the population of dogs as previously described in Chapter 4. To assess the health condition of the neutered and entire dogs, crosssectional surveys were conducted in the city from April to May Sample size The epir package in R (R Development Core Team, 2013) was used to estimate the required sample size when using stratified random sampling. Assuming a population of 163
187 8,000 dogs (5,000 intact and 3,000 sterilized) in Thimphu, a target sample size of 373 intact and 224 sterilized dogs was estimated to have 80% power to detect associations between the effects of the ABC programme on the health status of the dogs (BCS, SCS, and seroprevalence of CDV, CPV and leptospirosis) with 95% confidence. The a priori expected prevalence of the health indices in intact and sterilized dogs were estimated at 15 and10%, respectively Physical examination and sampling The physical condition of sexually intact free-roaming dogs was assessed at the CNVR clinic when the animals were under general anaesthesia for sterilisation. At the same time a blood sample was collected. In contrast the assessment of health and the collection of blood in neutered free-roaming dogs and owned (both sterilized and entire) dogs was performed after sedation with xylazine hydrochloride (1mg/kg body weight) at the temporary vaccination posts set up at various locations in Thimphu. Dogs caught from the street by the CNVR staff were categorized as unowned, whereas those dogs brought by the owner for vaccination against rabies were categorized as owned dogs, as per the previous studies. Detailed physical examination of each dog was conducted to assess the animal s body and skin condition by four veterinarians (three who worked full time with the CNVR programme and the thesis author). Mutual agreement on the different categories of body and skin conditions was arrived after jointly assessing 20 dogs (10 from a CNVR clinic and 10 from a vaccination post). Body condition score (BCS) was assessed using a five category scale based on illustrations available at and Figure 5.1. The skin condition score (SCS) was assessed using a four point scale as illustrated in Figure
188 Blood samples were collected from the femoral or saphenous vein of each dog. The blood samples were transferred to sterile screw capped glass tubes and allowed to clot at the ambient temperature and then the sera separated by centrifugation. Sera were then stored at C until tested. Sampling had been approved by the Murdoch University Animal Ethics Committee (R2430/11) Laboratory tests Using the ImmunoComb Parvo and Distemper Test Kit from BioGal, Israel, sera samples were tested for the presence of immunoglobulin (IgM antibodies) for CDV (sensitivity 93.1, specificity 95.5%) and CPV (sensitivity 91.4, specificity 90.8%) (Anonymous, 2007a). ImmunoComb Canine Leptospira test kits were used for testing for IgG antibodies to Leptospira interrogans serovars (sensitivity 80%, specificity 60% - (Anonymous, 2007b)). These are semi-quantitative tests based on solid phase dot - ELISA technology which indicate a high, medium or low response to antibodies present in the samples. IgM antibodies are short-lived (Anonymous, 2008b) and as such high IgM titres are indicative of recent exposure (or vaccination) to CDV and/or CPV. The Leptospira interrogans test indicates the presence of serovars canicola, icterohaemorrhagiae copenhageni, icterohaemorrhagiae RGA, pomona and grippotyphosa but does not differentiate between them. Of the 600 dogs sampled, serum sample of one dog was only sufficient to test for CDV/ CPV and therefore only 599 sera samples were used for testing Leptospira. Test procedures and interpretation of the results followed the manufacturer s recommendations (Anonymous, 2008b,2008a). For CDV and CPV, IgM values of S3 or greater were classified as high positives, S2 as medium positives and S1 as low positive reactions. For Leptospira IgG, values of S5 or greater were considered high positive, S3 S4 as medium positive and S1 S2 as low positive reactions. 165
189 7.2.5 Statistical analyses Data were managed and analysed in Microsoft Excel and in statistical software R (R Development Core Team, 2013) as described in the previous chapters. Bivariable analyses were performed using χ² tests to compare the prevalence of health indices between different genders, ages, breeds, owners, neuter status and blocks. The true seroprevalence of CDV, CPV and Leptospira were calculated using epir package implemented in R based on methods described by Rogan and Gladen (1978). Generalized linear models (GLM) were used to determine the effects of the ABC programme, as well as other factors, on the prevalence of the health indices. Binary logistic regression models were constructed for the binary outcome (presence or absence of CPV or CDV). Ordinal logistic regression was used for outcomes with ordinal data categories (BCS and SCS). In the analysis body condition scores 1 and 2 were combined, as well as scores 4 and 5, as there were few very thin or markedly obese dogs, respectively. All the variables with a p-value 0.25 were included in the initial logistic regression model. Stepwise backwards selection of variables was performed using likelihood ratio tests and the Akaike Information Criterion (AIC) to determine the final predictive models. Variables were retained in the final model if the likelihood ratio test was significant (p 0.05) or if the β-coefficient of any of the other covariates changed by 10% upon removal of the covariate. Odds ratios and their 95% confidence intervals were calculated for the final models. Interactions were examined for statistical significance. Goodness of fit for the binary logistic regression model was examined by using the Hosmer and Lemeshow goodness-of-fit test (Hosmer & Lemeshow, 2000). The appropriateness of the ordinal logistic regression model was examined by assessing whether proportional odds assumption was reasonable for the models (Anonymous, 2014a). 166
190 7.3 Results Demographic characteristics of the study population Six hundred dogs were sampled, of which 37.3% (95% CI ) were neutered, 18.5% (95% CI ) were classified as owned, 49.8% (95% CI ) were males, 73.2% (95% CI ) were adults and 92.3% (95% CI ) were local breeds. The descriptive data and bivariate analysis of the demographic characteristics and sterilisation status of the dogs included in the study are presented in Table 7.1. There were significant differences in the proportion of dogs sterilized amongst male and female dogs, young and adult dogs, and in dogs with different body condition scores. Proportions of sterilized dogs differed significantly amongst the Tshogdeys (Blocks) (p < 0.001) with Changzamtog having the highest proportion of neutered dogs (58.8%) and Norzin the lowest proportion (20.0%) Prevalence of canine distemper The overall seroprevalence of CDV was 49.7% (95% CI ). Of the 298 positive dogs, 161 (54.0%) were low positives (S1), 90 (30.2%) were medium positives (S2) and 47 (15.8%) were high positives ( S3). The seroprevalence in entire dogs (52.9%, 95% CI ) was significantly higher (χ² = 4.279, df = 1, p = 0.039) than that of sterilized dogs (44.2%, 95% CI ). There was no significant difference in the prevalence of CDV amongst owned and stray dogs, male and female dogs, adult and young dogs or local and improved breed dogs (Table 7.2). Using a test sensitivity of 93.1% and a specificity of 95.5%, the overall true prevalence was 50.9% (95% CI ). 167
191 Table 7.1 Descriptive data for demographic characteristics and neuter status of the dogs Neuter status, n (%) Variables Neutered Entire χ² df p-value Ownership Owned 33 (29.7) 78 (70.3) Stray 191 (39.1) 298 (60.9) Sex Male 124 (41.5) 175 (58.5) Female 100 (33.2) 201 (66.8) Age Young 9 (5.6) 152 (94.4) <0.001 Adult 215 (49.0) 224 (51.0) Breed Local 205 (37.0) 349 (63.0) Improved 19 (41.3) 27 (58.7) Body condition score Thin 36 (21.7) 130 (78.3) <0.001 Ideal 153 (40.1) 229 (59.9) Overweight 35 (67.3) 17 (32.7) Skin Condition Score Normal 174 (35.6) 315 (64.4) Moderate 35 (41.7) 49 (58.3) Severe 15 (55.6) 12 (44.4) Tshogdey (Block) Babesa 12 (34.3) 23 (65.7) <0.001 Changbangdu 68 (34.7) 128 (65.3) Changzamtog 40 (58.8) 28 (41.2) Dechencholing 32 (37.6) 53 (62.4) Jungshina-Kawang 38 (55.9) 30 (44.1) Motithang 11 (33.3) 22 (66.7) Norzin 23 (20.0) 92 (80.0) Prevalence of canine parvovirus The seroprevalence of CPV in sampled dogs from Thimphu was 13.0% (95% CI ). Of the positive results 42.3% (33/78) were low positive (S1), 23.1% (18/78) were medium positives (S2) and 34.6% (27/78) were high positives ( S3). There was a significantly lower prevalence of CDV in sterilized dogs (4.0%, 95% CI ) than in sexually intact dogs (18.4%, 95% CI ) (χ² = , df = 1, p < 0.01). A 168
192 significantly higher seroprevalence to CPV was detected in free-roaming (χ² = , df = 1, p < 0.001) and younger (χ² = , df = 1, p < 0.001) dogs compared with owned or adult dogs, respectively (Table 7.3). The true prevalence of CPV, using a reported sensitivity of 91.4% and specificity of 90.8% for the tests in dogs (Anonymous, 2007a), was 4.6% (95% CI ) Seroprevalence to Leptospira Of the 599 samples tested for Leptospira only three samples showed low positive reactions to Leptospira (S1 S2) (test seroprevalence 0.5%; 95% CI: ). Based on a sensitivity of 80% and a specificity of 60% for the Immunocomb IgG Antibody Test (BioGal, Israel) the true or real prevalence was calculated as 0% i.e. the three test positive results were all false positives. 169
193 Table 7.2 Seroprevalence of antibodies to canine distemper virus (CDV) in intact and neutered dogs in Thimphu, Bhutan based on the Immunocomb IgM Antibody Test No. of dogs Seroprevalence Variables (positive/ tested) (95%CI) χ² Df p-value Neutered status Entire 199/ ( ) Sterilized 99/ ( ) Ownership Owned 54/ ( ) Stray 244/ ( ) Sex Male 151/ ( ) Female 147/ ( ) Age Adult 223/ ( ) Young 77/ ( ) Breed Local 276/ ( ) Improved 22/ ( ) Body condition score Thin 76/ ( ) Ideal 195/ ( ) Overweight 27/ ( ) Skin Condition Score Normal 248/ ( ) Moderate 37/ ( ) Severe 13/ ( ) Tshogdey (Block) Babesa 17/ ( ) Changbangdu 108/ ( ) Changzamtog 32/ ( ) Dechencholing 39/ ( ) Jungshina- Kawang 29/ ( ) Motithang 19/ ( ) Norzin 54/ ( ) Total 298/ ( ) 170
194 Table 7.3 Seroprevalence of antibodies to canine parvovirus (CPV) in intact and neutered dogs in Thimphu, Bhutan based on the Immunocomb IgM Antibody Test No. of dogs Seroprevalence Variables (positive/ tested) (95%CI) χ² Df p-value Neutered status Entire 69/ ( ) <0.001 Neutered 9/ ( ) Ownership Owned 6/ ( ) Stray 72/ ( ) Sex Male 32/ ( ) Female 46/ ( ) Age Adult 37/ ( ) <0.001 Young 41/ ( ) Breed Local 76/ ( ) Improved 2/ ( ) Body condition score Thin 29/ ( ) Ideal/Healthy 47/ ( ) Overweight 2/ ( ) Skin Condition Score Normal 63/ ( ) Moderate 12/ ( ) Severe 3/ ( ) Tshogdey (Block) Babesa 9/ ( ) Changbangdu 25/ ( ) Changzamtog 7/ ( ) Dechencholing 7/ ( ) Jungshina- Kawang 5/ ( ) Motithang 4/ ( ) Norzin 21/ ( ) Overall 78/ ( ) Body condition score of the sampled dogs Of the 600 dogs examined, 27.7, 63.6 and 8.7% had a thin, ideal or overweight body condition, respectively. The comparison of the body conditions with sterilization and ownership status, gender, age, breed and locations are presented in Table 7.4. Sterilized 171
195 dogs (thin = 16.1, ideal = 68.3 and overweight = 15.6%) had significantly higher body condition scores compared with entire dogs (thin = 34.6, ideal = 60.9 and overweight = 4.5%) (p < 0.001). Significantly higher body conditions were observed in owned, male and improved breed dogs (Table 7.4) Skin condition scores of dogs Of all dogs examined 81.5% were considered to have normal skin, 14% had a moderate skin condition and 4.5% had severe skin problems (Table 7.5). Slightly more sterilized dogs had skin problems (22.3%) than entire dogs (16.2%) although this difference was not significant (P = 0.076). No significant differences were observed in the skin condition scores between different breeds, genders, locations and owner status (Table 7.5) Factors associated with the health indices Various factors were significantly associated (p 0.25) with the measured health indices (CPV, CDV, BCS, SCS). The final multivariable logistic regression models of factors associated with seropositivity to CDV and CPV are presented in Table 7.6. Sterilized dogs were less likely to have CDV (OR = 0.61, 95% CI: ) or CPV (OR = 0.24, 95% CI: ) than entire dogs. Age category was a confounder of the relationship between the sterilization status and seropositivity to CDV and CPV (change in OR for CDV was 15.0% and for CPV was 44.6%). Younger dogs were 2.12 times (95% CI: ) more likely to have CPV antibodies, whilst stray dogs were 2.92 times (95% CI: ) more likely to have seropositivity to CPV. The Hosmer and Lemeshow goodness-of-fit test showed there was good fit of the data for the binary logistic regression models (p-value for CDV = 0.89; and CPV = 0.54). 172
196 Table 7.4 Descriptive data and analyses of population characteristics of the dogs associated with body condition score Body Condition Score, n (%) Variables Thin Ideal Overweight χ² Df p-value Neutered status Entire 130 (34.6) 229 (60.9) 17 (4.5) <0.001 Neutered 36 (16.1) 153 (68.3) 35 (15.6) Ownership Owned 21 (18.9) 75 (67.6) 15 (13.5) Stray 145 (29.6) 307 (62.8) 37 (7.6) Sex Male 69 (23.1) 195 (65.2) 35 (11.7) Female 97 (32.2) 187 (62.1) 17 (5.6) Age Adult 77 (17.5) 310 (70.6) 52 (11.8) <0.001 Young 89 (55.3) 72 (44.7) 0 (0.0) Breed Local 160 (28.9) 346 (62.5) 48 (8.7) Improved 6 (13.0) 36 (78.3) 4 (8.7) Canine distemper virus Positive 76 (25.5) 195 (65.4) 27 (9.1) Negative 90 (29.8) 187 (61.9) 25 (8.3) Canine parvovirus Positive 29 (37.2) 47 (60.2) 2 (2.6) Negative 137 (26.2) 335 (64.2) 50 (9.6) Tshogdey (Block) Babesa 7 (20.0) 24 (68.6) 4 (11.4) Changbangdu 59 (30.1) 118 (60.2) 19 (9.7) Changzamtog 21 (30.9) 44 (64.7) 3 (4.4) Dechencholing 14 (16.5) 63 (74.1) 8 (9.4) Jungshina- Kawang 20 (29.4) 43 (63.2) 5 (7.4) Motithang 14 (42.4) 17 (51.5) 2 (6.1) Norzin 31 (27.0) 73 (63.5) 11 (9.6) Overall 166 (27.7) 382 (63.6) 52 (8.7) 173
197 Table 7.5 Descriptive data and analyses of population characteristics of the dogs and their association with the skin condition score. Skin Condition Score, n (%) Variables Normal Moderate Severe χ² Df p-value Neutered status Entire 315 (83.8) 49 (13.0) 12 (3.2) Neutered 174 (77.7) 35 (15.6) 15 (6.7) Ownership Owned 91 (82.0) 12 (10.8) 8 (7.2) Stray 398 (81.4) 72 (14.7) 19 (3.9) Sex Male 243 (81.3) 43 (14.4) 13 (4.3) Female 246 (81.7) 41 (13.6) 14 (4.7) Age Adult 358 (81.5) 56 (12.8) 25 (5.7) Young 131 (81.4) 28 (17.4) 2 (1.2) Breed Local 447 (80.7) 82 (14.8) 25 (4.5) Improved 42 (91.3) 2 (4.4) 2 (4.3) Canine distemper virus Positive 248 (83.2) 37 (12.4) 13 (4.4) Negative 241 (79.8) 47 (15.6) 14 (4.6) Canine parvovirus Positive 63 (80.8) 12 (15.4) 3 (3.8) Negative 426 (81.6) 72 (13.8) 24 (4.6) Tshogdey (Block) Babesa 30 (85.7) 3 (8.6) 2 (5.7) Changbangdu 163 (83.2) 27 (13.8) 6 (3.0) Changzamtog 56 (82.4) 9 (13.2) 3 (4.4) Dechencholing 66 (77.7) 16 (18.8) 3 (3.5) Jungshina- Kawang 49 (72.1) 15 (22.0) 4 (5.9) Motithang 28 (84.8) 3 (9.1) 2 (6.1) Norzin 97 (84.3) 11 (9.6) 7 (6.1) Total 489 (81.5) 84 (14.0) 27 (4.5) The final multivariable logistic regression models associated with body and skin condition scores are presented in Table 7.7. Sterilised dogs were 1.72 times (95% CI: ) more likely to have an ideal or overweight BCS compared with a thin BCS. Younger dogs were less likely (OR = 0.20, 95% CI: ) to have an ideal or 174
198 overweight BCS than adult dogs. Similarly female dogs were also less likely to have an ideal or overweight BCS than male dogs (OR = 0.63, 95% CI = ). Sterilised dogs were 1.54 times (95% CI: ) more likely to have a moderate or severe SCS compared with neutered dogs. Local breeds were also more likely (OR = 2.53, 95% CI: ) to have a moderate or severe SCS than cross-bred dogs. Visual examination of the models shows reasonable proportional odds assumptions indicating that the models for ordinal outcome (BCS and SCS) were appropriate. Table 7.6 Multivariable logistic regression model of factors associated with the prevalence of the canine distemper virus (CDV) and canine parvovirus (CPV) Variable/ Category Coefficient SE p-value OR (95% CI) Canine Distemper a Constant Neutered status Entire Neutered ( ) Age Adult Young ( ) Canine Parvovirus b Constant < Neutered status Entire Neutered < ( ) Age Adult Young ( ) Ownership Owned dog Stray dog ( ) a Canine Distemper Virus: Likelihood ratio χ² = 7.89, p = ; AIC = ; Hosmer- Lemeshow goodness-of-fit test, p = 0.89 b Canine Parvovirus: Likelihood ratio χ² = 48.23, p <0.001 ; AIC = ; Hosmer- Lemeshow goodness-of-fit test, p =
199 Table 7.7 Multivariable logistic regression model of factors associated with the body and skin condition scores Variable/ Category Coefficient SE p-value OR (95% CI) Body Condition Scores Constant Thin Ideal <0.001 Ideal Overweight <0.001 Neutered status Entire Neutered < ( ) Age Adult Young < ( ) Gender Male Female < ( ) Skin Condition Scores Constant Normal Moderate <0.001 Moderate Severe <0.001 Neutered status Entire Neutered ( ) Breed Improved Local ( ) 7.4 Discussion This study highlighted the benefit of the ABC programme on the health of free-roaming dogs in Bhutan. A lower seroprevalence to CDV and CPV (Tables 7.2, 7.3 and 7.6) and higher body condition scores (Tables 7.4 and 7.7) were observed in sterilized dogs compared with sexually intact dogs. This lower seroprevalence to CDV and CPV in sterilized dogs may be because of an improvement in the health condition of these dogs following the programme. Similar studies undertaken in Jodhpur, India also reported higher body condition scores in sterilized dogs (Totton et al., 2011). This higher BCS in sterilized dogs could be due to loss of sex hormones leading to decreased metabolic rates and less activity resulting in the expenditure of less energy contributing to weight 176
200 gain (O'Farrel & Peachey, 1990; Zoran, 2010). Interestingly a lower prevalence of CDV and a higher BCS have also been reported in entire dogs in cities with an ABC programme (Yoak et al., 2014). It is believed that entire dogs are less likely to get infection in the ABC areas because neighbouring sterilized dogs were healthier, more capable of resisting infection, and less likely to transmit disease (Totton et al., 2011; Yoak et al., 2014). There was a higher prevalence of CPV in younger and free-roaming dogs than in adults or owned dogs. It is likely that younger dogs are more susceptible to many diseases as their immune system has not developed fully (Felsburg, 2002). It is not surprising to see a higher prevalence of CPV in free-roaming dogs which are frequently exposed to infections through direct contact with other infected dogs or a contaminated environment (Jackman & Rowan, 2007). High IgM titres are indicative of recent exposure to CDV or CPV, however negative or low IgM titres do not necessarily mean that the dogs were not exposed to infection as dogs that survive the acute phase of infection will have either no or low levels of IgM in contrast to high IgG titres (Anonymous, 2007a). In the current study it would have been better to have used joint IgM and IgG tests; however this was not possible due to funding limitations. A combination of IgM and IgG antibody tests has been used to study the spill-over risk of CDV and CPV to wild carnivores from the free-roaming dog population surrounding the Great Indian Bustard Sanctuary in Maharastra, India (Vanak et al., 2007). Based on the IgM and IgG test results in their study, dogs were categorized as susceptible (IgM-, IgG-), infected (IgM+, IgG-), or recovered/immune (IgM-, IgG+). 177
201 In this study younger or female dogs had lower body condition scores than adult or male dogs, respectively. This is expected as younger dogs are growing and consequently have a higher metabolic rate (Harper, 1998). In contrast female dogs roam more frequently and wider in search of food and also expend more energy raising their pups (Jackman & Rowan, 2007; Zoran, 2010). Sterilized dogs had lower (poorer) skin condition scores than sexually intact dogs in this study (Tables 7.5 and 7.7). The study in Jodhpur also reported poorer skin scores in sterilized dogs and these findings may have arisen from infections acquired during the CNVR programmes and through the transfer of ticks to dogs awaiting surgery (Totton et al., 2011). The other possible reason of more skin problems in sterilized dogs may be due to less movement of the sterilized dogs leading to a greater likelihood of acquiring infection from other local dogs. More skin problems in sexually intact dogs has also been reported in cities which have had a longer duration of adopting an ABC programme (Yoak et al., 2014). The seroprevalence of Leptospira was negligible in the current study. Owing to the low specificity of the tests used, the few positive cases (3 out of 599 tested) are potentially false positive reactions (Anonymous, 2008a). There is limited information about leptospirosis in dogs and other domestic animals in Bhutan. The occurrence of leptospirosis is heavily influenced by rainfall, environmental conditions and the availability of the definitive or principal maintenance hosts (Dhliwayo et al., 2012). The current studies were conducted during the dry period in Bhutan prior to the peak monsoon period and no rodents were observed in the area during the study. Thimphu has temperate climatic conditions with an annual average rainfall between 50 to 100 cms., the bulk of which is received during the wet monsoon season (July to September). Similar serological surveys should be carried out in other parts of the country with a 178
202 greater focus on regions in the lower foothill and in the rice growing places which have sub-tropical climatic conditions where leptospirosis is more likely to be endemic. Sampling bias existed in the current study. Both sexually intact and sterilized stray dogs were not representative of the entire free-roaming dog population as the dog catchers deliberately did not catch puppies, lactating bitches or those bitches that appeared to be in advanced stages of pregnancy. Puppies accounted for approximately 9% of the total dogs sighted during the field population surveys to estimate the free-roaming dog population in Thimphu in May 2013 (results presented in Chapter 8). Similarly the owned dogs that were sampled were also not a true representative sample of the owned dog population as only dogs that were voluntarily brought to the clinics for vaccination by their owners were included in this study. Seropositivity against CDV and CPV in owned dogs may not necessarily be due to past exposure, rather it could also have been due to vaccination since some owned dogs in Thimphu are vaccinated against CDV and CPV. Skin problems in the owned dogs may be overestimated as owners are more likely to bring sick animals to the clinic for treatment. Higher BCS and lower seroprevalence of CDV and CPV were observed in the sterilized dogs. This highlights the benefits of an ABC programme on the health of free-roaming dogs in Bhutan. Besides assessment of the health of the sterilized and sexually intact dogs, the success of ABC and CNVR programmes can be monitored and evaluated by continuous monitoring the size of the free-roaming dog population in the locality and this forms the basis of the data analysed and presented in the following chapter. 179
203 CHAPTER EIGHT Evaluation and monitoring of capture neuter vaccinate release (CNVR) programmes through regular assessment of the dog population size and factors associated with the abundance of freeroaming dogs in Thimphu City, Bhutan. 8.1 Introduction As a result of human population growth, urbanisation and poor waste management, the number of free-roaming dogs is expected to increase in the developing world (Jackman & Rowan, 2007). Knowledge on the size of this population is a necessary first step towards managing their presence, with a long term aim to make the coexistence between humans and dogs more harmonious (Beck, 1975). As defined in earlier chapters, freeroaming dogs can include both owned and unowned dogs that are found in public places. In Bhutan, prior to the study reported in this thesis, there was no reliable estimate of the size of the free-roaming dog population. In Chapter 6, the number of owned dogs was estimated in the country through extrapolation of the mean number of dogs owned per household to the national household statistics. By using the ratio of stray (un-owned) to owned dogs presented to the CNVR clinic, the stray dog population was also estimated. While the estimate for the owned dog population may be reasonable, the size of the stray dog population needs further validation. Some techniques used to enumerate wildlife, and which could be used to estimate the size of the free-roaming dog population, were reviewed in Chapter 2. In other studies the freeroaming dog population has been estimated using questionnaire surveys (Kitala et al., 2001), mark-resight methods using paint (Totton et al., 2010a), distance methods (Childs et al., 1998) and exhaustive counts of randomly selected city blocks (WSPA, 180
204 2009). Although each of these methods can be used to estimate the size of the freeroaming dog population, as required in the initial stages of planning an intervention, these methods require significant time and resources to monitor the impact of a CNVR programme over a large area. Field population surveys and regular monitoring of the number of free-roaming dogs provide an opportunity to assess and evaluate the impact of a CNVR programme. Therefore the objectives of the study reported in this chapter were to: - Estimate the size of the free-roaming dog population using a range of methods. - Monitor the size of the free-roaming dog population over a five and half year period. - Identify factors that were associated with the abundance of free-roaming dogs. 8.2 Materials and methods CNVR programme in Thimphu city From February 2009 to September 2014, seven rounds of CNVR campaigns were carried out in Thimphu (Table 8.1). During this period 8,119 free-roaming dogs were captured, sterilized and released within the Thimphu city municipal area using the methods described in Chapter 4. All dogs processed (sterilized) at the CNVR clinic were permanently marked by ear-notch. Only dogs that were caught from the Thimphu Municipal areas by the CNVR staff between February 2009 and September 2014 were included in this study Population size estimated from capture of permanently marked (earnotched) dogs (Method 1) A simple mark-resight survey methodology has been described to monitor the number of roaming dogs in areas that are currently subject to ABC provided the numbers, dates 181
205 and locations of marked (ear-notched) roaming dogs released following the interventions are reliably recorded (Hiby et al., 2011). Reliable population monitoring can be achieved by taking advantage of the large number of ear-notched dogs accumulating as a result of the ABC programme in an area. In the current study the Lincoln Petersen formula was utilized where the total roaming dog population was estimated by dividing the total number of dogs that were marked by the fraction of resighted marked dogs observed on the subsequent survey (Chapter 6). This idea was extended to dogs ear-notched during the CNVR programme over longer periods by allowing for an estimated rate of mortality in these dogs as described by Hiby et al. (2011). As outlined in Chapter 2 the total number of roaming dogs ( ) equals, where r is the number of surviving ear-notched dogs and p is the expected percentage of ear-notched dogs in a random sample of roaming dogs. Using this calculation, the population size of free-roaming dogs in Thimphu was estimated at different time points. Methods to estimate and are described in the following sections. Percentage of ear-notched dogs Six rounds of street surveys (June 2009, June 2011, January 2012, May 2013, August 2013 and September 2014) were conducted to record the proportion of free-roaming dogs that were ear-notched. About 15 to 20 people from the Department of Livestock and CNVR programme were involved in the surveys which were conducted in the morning (6 AM to 9 AM). At least half a day training on the field survey procedures were provided to the team members prior to the commencement of each survey. In order to avoid over or underestimating the percentage of ear-notched dogs, the team covered as much ground as possible and as evenly as possible in all of the surveys. Direct observation without handling the dogs was sufficient to confirm their neuter status 182
206 (presence of ear-notch), sex, age and lactation status (for adult females). The χ² test for independence was used to compare the proportion of ear notched dogs at different time points. Annual survival of ear-notched dogs Free-roaming dogs that were processed at the CNVR clinic were permanently marked through ear-notching to identify them as having been through the intervention process and hence were not caught in subsequent rounds. If ear-notched dogs are released at a constant rate then their abundance will increase until that rate equals the rate of loss via natural mortality (Reece et al., 2008). Their abundance will then remain constant and provides no information on their survival. Based on this assumption the annual survival rate (S) of the marked dogs was estimated from the counts of marked dogs during the first three surveys (June 2009, June 2011 and January 2012) using the permanent mark survival programme developed by Conservation Research Ltd (Cambridge, UK). The probability of counting a marked dog (p) on a survey count was determined during the field surveys. The estimated annual survival rate (S) of the marked dogs was 0.77 (95% CI ). Population size of the surviving ear-notched dogs The size of the surviving marked free-roaming dog population in the area was estimated by using the annual survival rates of the permanently marked dog population following the method described by Hiby et al. (2011). If n i ear notched dogs are released in the i th year after the start of the intervention, then the number surviving at the y th year is ( ) where S is the annual survival of ear notched dogs. If release numbers are available for individual months then more accurate calculation of the number surviving at m months after the start of the intervention is ( ). 183
207 Table 8.1 Number of dogs sterilized and vaccinated during the CNVR campaigns and the total number of ear notched free-roaming dogs estimated based on the annual survival rates at different time Estimated number of surviving ear notched dogs CNVR Dogs Mayprogramme neutered Jun-09 Jun-11 Jan Aug-13 Sep-14 Feb to June Oct 2009 to Mar Aug to Dec July to Oct Mar to May July September Total dogs neutered Size of surviving notched dog population Population size estimated using the Chapman estimate (Method 2) A mark-resight study was carried out in the study area in May 2013 to estimate the freeroaming dog population in the whole city. About 30 people from the Department of Livestock and CNVR programme were involved in this survey after receiving half a day training on the survey procedures. The marking of the dogs on day 1 and counting of the dogs on day 2 (6 AM to 9 AM) was carried out using the methods described in Chapter 6 for estimating the free-roaming dog population in Gelephu and Phuentsholing (Section 6.2.5). Chapman proposed the modified version of the Lincoln-Petersen model with less bias when the number of recaptures was small (Chapman, 1951). This formula is: [ ( )( ) ] ( ) Where, similar to the Lincoln-Petersen index, N is the total population size, number of dogs that were marked with vegetable colour paint on day 1 and is the is the 184
208 number of dogs sighted on day 2 and is the number of dogs from day 1 that are resighted on day 2 (dogs with coloured marks). The variance and 95% CI of the population estimate were calculated using the formulas described in Chapter 2 (Section 2.9.2) Population size estimated from the detection probability and rapid survey (Method 3) A combination of rapid survey counts and mark-resight was done in August 2013 to estimate the free-roaming dog population in the study area. With the help of Google maps ( Thimphu City was divided into 15 different wards (seven were marked with a blue boundary and eight with a red boundary) (Figure 8.1). All seven wards with blue boundaries were chosen for the mark-resight study and a rapid survey was conducted on the remaining eight wards with red boundaries. The field survey was carried out by 12 staff from the CNVR programme and Department of Livestock who received one day training on the survey procedures. Mark-resight study was done on day one and two in the seven wards with blue boundaries while the rapid survey in the remaining eight wards with red boundaries was carried out on day three. The resight surveys on day two and the rapid surveys on day three were carried out in the morning from 6 AM to 9 AM. The size of the free-roaming dog population can be estimated from the rapid survey counts if the detection probability is known as outlined in Chapter 2. Although different methods have been described to estimate the detection probability for wild animals and birds (McCallum, 2005), the most common and reliable method for the free-roaming 185
 and rapid surveys (red). 8.2.")

209 dog population is capture-mark-recapture survey in the selected wards following the method described in Chapter 6 using the Lincoln Petersen index. Figure 8.1 Google maps of Thimphu city with the ward boundaries for the markresight experiment (blue) and rapid surveys (red) Comparison of the different methods The population size estimated using the capture of permanently marked dogs were compared with the Chapman estimate and the population size estimated from the detection probability of the dogs in May 2013 and August 2013, respectively. The population estimates by different methods are considered to be significantly different when the mean of one group isn t contained within the lower and upper 95% CI of the other. 186
210 8.2.6 Estimating 95% confidence intervals (CI) for the proportion of ear notched dogs, detection probability and the corresponding population estimates The beta distribution was used to calculate the 95% CI of the proportion of dogs that were ear-notched during the survey, as well as for the detection probability of the freeroaming dogs in Excel using the add-in Pop-tools (Hood, 2010). Beta distributions were used for estimating the 95% CI of the proportion of ear-notched dogs sighted during the field survey and the detection probability of the number of free-roaming dogs during the mark resight survey for Methods 1 and 3, respectively. The Poisson distribution was used for estimating the 95% CI of the number of surviving ear-notched dogs and the number of dogs sighted during the rapid survey for these two methods. These estimates were then used for estimating the 95% CI of the population estimates for these methods Spatial analysis From December 2011 to January 2012, the geo-coordinates of the point location of the free-roaming dogs sighted in Thimphu was recorded using a Garmin etrex 20 Handheld GPS device. Variables thought to influence the spatial distribution of free-roaming dogs, such as point locations of rubbish bins, meat shops, temples and military camps, were captured by the GPS device. Physical landscape variables, such as buildings, road networks and city boundaries, were obtained as vector maps from the National Land Commission of Bhutan. Kernel smoothing techniques were applied to describe the spatial distribution of dog sights expressed as the number of dogs per km 2. These analyses were carried out using a regular grid of 200 x 200 cells calculated using the spatstat package (Baddeley & Turner, 2005) implemented within R (R Development Core Team, 2013). The bandwidth parameter for the kernel function (controlling the degree of smoothing of the estimated intensity surface) was fixed at 1.0 km and was calculated using the normal 187
, military camps and temples and road networks were superimposed on the raster surface of the number of dogs per km 2.")
211 optimal method (Bowman & Azzalini, 1997). To visualize the relationship between the variables and the dog sightings the point locations of the rubbish bins (Figure 8.2), meat shops (Figure 8.3), military camps and temples and road networks were superimposed on the raster surface of the number of dogs per km 2. Kernel smoothed estimates of the intensity of buildings (houses) was developed (grid size 200 x 200 and bandwidth of 1.0 km) similar to the approach used for dog density and the two plots were compared for any association. The rhohat procedure (Baddeley et al., 2012) implemented in spatstat was used to plot the density of dog sights per km 2 as a function of Euclidean distance from rubbish bins, meat shops, military camps, temples, buildings and road networks. The resulting functions were compared to determine the factors associated with sighting of free-roaming dogs. Figure 8.2 Rubbish bins in Thimphu with some dogs exploring for edible materials. 188
. Of these dogs 2,561 were sterilized and vaccinated against rabies during the pilot CNVR programme from February to June 2009.")
212 Figure 8.3 Meat shop in Thimphu demonstrating a high level of sanitation. 8.3 Results CNVR programme in Thimphu city As of 31 st August 2014 a total of seven CNVR campaigns had been undertaken in Thimphu City area involving 8,119 free-roaming dogs (Table 8.1). Of these dogs 2,561 were sterilized and vaccinated against rabies during the pilot CNVR programme from February to June After the successful pilot project the second round of the CNVR campaign was undertaken from October 2009 to March 2010 when 874 dogs were processed. The third round was implemented after a break of 17 months from August to December Following that two further campaigns were conducted at six monthly intervals. The major campaign, in collaboration with the Thimphu Municipal Corporation, was undertaken in July 2013 when 1,516 dogs were sterilised and 189
213 vaccinated. Another joint campaign with the Thimphu Municipal Corporation was carried out in August 2014 and covered 544 dogs Population size based on capture of permanently marked dogs Proportion of permanently marked dogs The proportion of ear notched dogs during the six street surveys is presented in Table 8.2. The proportion of ear notched dogs was lowest in June 2011 (36.3%, 95% CI ) and highest in August 2013 (76.3%, 95% CI ). There was a significant difference in the proportion of ear-notched dogs sighted during differently time points (χ² = 930.9, df = 5, p < 0.001). A similar pattern of the proportion of the ear notched dogs in various Tshogdeys at each time point was observed (Figure 8.4). Number of surviving ear-notched dogs The annual survival rate of the permanently marked dogs was 77% (95% CI 72 84). The number of surviving ear-notched dogs estimated, based on this annual survival rate and the number of ear-notched dogs released during each CNVR campaign, is presented in Table 8.2 and Figure 8.5. There was an increasing number of surviving ear-notched dogs at each time point with the exception of June 2011 when the number of surviving ear-notched dogs was lower than the preceding survey period (Figure 8.5). Population size The population estimate for each time point using this method is displayed in Table 8.2 and Figure 8.5. The population estimate was lowest in June 2009 at 5,167 (95% CI 4,836 5,502) and highest in June 2011 at 6,033 (95% CI 5,644 6,430). The estimate in June 2009 was significantly lower than the other estimates (no overlap of the 95% CI). 190
214 Table 8.2 Free-roaming dog population estimated based on surviving notched dogs and the percentage of notched dogs observed during the survey (June 2009 to September 2014) Survey (Month & Year) Surviving notched dogs Notched dogs sighted Total dogs sighted Estimated Population (95% CI) Percent notched (95% CI) June ( ) 5167 ( ) June ( ) 6033 ( ) January ( ) 5765 ( ) May ( ) 5949 ( ) August ( ) 5861 ( ) Sept ( ) 5856 ( ) Figure 8.4 The proportion of the ear-notched free-roaming dogs in each of the Tshogdeys as a proportion of the total sighted dogs during the field survey (June 2009 to September 2014). 191
215 Figure 8.5 Estimated number of surviving ear-notched dogs, the total free-roaming dog population and the percentage of ear-notched dogs out of all total sighted dogs (June 2009 September 2014) Population size based on the Chapman estimate The population size of the free-roaming dogs estimated using the Chapman method in each Tshogdey is presented in Table 8.3. The total population estimate for Thimphu city was 3,817 (95% CI 3,743 3,891). Changbangdu had the highest number of dogs (1,078, 95% CI 1,037 1,119) and Motithang the lowest (219, 95% CI ). Table 8.3 Estimate of the population of free-roaming dogs in Thimphu using the modified Lincoln Petersen index (Chapman method) in May 2013 Tshogdey Marked (n1) Count (n2) Recaptured (m) Population estimate (95% CI) Bapisa ( ) Changbangdu ( ) Norzin ( ) Changangkha ( ) Motithang ( ) Kawang Jungshina ( ) Taba-Dechenchoeling ( ) Total ( ) 192
216 8.3.4 Population size based on the detection probability and the rapid survey The population size of free-roaming dogs in seven wards using the Lincoln Petersen index and their detection probability in August 2013 is summarised in Table 8.4. The total estimated population based on the Lincoln-Petersen index was 1,137 (95% CI 1,097 1,194). The overall detection probability of the free-roaming dogs based on this estimated population and the number of sighted dogs during the count was (95% ). The population estimates based on rapid surveys and detection probability in the remaining eight wards are shown in Table 8.5. Using the overall detection probability of and 1,635 dogs counted during the rapid survey it was estimated that 3,332 (95% CI 3,090 3,604) dogs were present in the eight wards. This resulted in an estimated total dog population of 4,469 (95% 4,187 4,798) in the 15 wards of Thimphu city (Lincoln-Petersen method 1,137 and Rapid survey 3,332). Table 8.4 Mark-resight experiment using the Lincoln-Petersen index to estimate the recapture probability (August 2013) Ward name Marked (n1) Count (n2) Recaptured (m) Population (N) Detection probability (95% CI) Taba area (99-124) ( ) Pamtsho- Jungshina ( ) ( ) Chubachu ( ) ( ) Core Town ( ) ( ) Olakha ( ) ( ) Simtokha- RIM/ ILCS ( ) ( ) Serbithang (69-94) ( ) Total ( ) ( ) 193
217 Table 8.5 Population estimates based on rapid surveys and detection probability in eight wards (August 2013) Ward Name Notched Unnotched Puppies Total Estimated Population (95% CI) Main town area ( ) YHSS Area ( ) Lungthephu Area ( ) Motithang Area ( ) Chamzomtok Area ( ) Simtokha Dzong/ town ( ) Dechencholing/RBG ( ) Dzong/Zilukha Area ( ) Total ( ) Comparison of population size using different methods The number of free-roaming dogs based on the number of surviving ear-notched dogs and the proportion of marked dogs sighted in May and August 2013 was estimated at 5,949 (95% CI 5,669 6,273) and 5,861 (95% CI 5,637 6,034), respectively. Both of these estimates are much higher than the estimates from using the Chapman method (3,817; 95% CI 3,743 3,891) in May 2013 and the rapid survey and detection probability (4,469; 95% 4,187 4,798) in August The population estimates by these three methods were significantly different from each other as the 95% CI did not overlap. The estimate calculated through the recapture of permanently marked dogs was much higher than the upper 95% CI of the Chapman method and the population estimate using detection probability during the respective survey time points Factors associated with abundance of free-roaming dogs In Figure 8.6 the image plots of dog density per km 2 superimposed with road network (a) and intensity of buildings per km 2 (b) are displayed. The dog density was found to be higher in those places with more roads and a higher intensity of buildings. Superimposed on the dog density plots are the point locations of rubbish bins, temples, 194
218 meat shops and military camps (Figure 8.7). A higher dog density was observed in those places with more meat shops, which were concentrated in the core town area (Figure 8.7b). (a) (b) Figure 8.6 Map of Thimphu Municipal area (a) Image plot showing the freeroaming dog population density (number of dogs per km 2 ) with the road networks superimposed on this plot (b) Image plot showing the intensity of buildings expressed as number of buildings per km 2. Darker colours indicate higher intensity of dogs and buildings 195
219 (a) (b) Figure 8.7 Image plot showing the free-roaming dog population density (number of dogs per km 2 ) in Thimphu Municipal area. Superimposed on this plot are (a) point locations of rubbish bins (yellow) and Temples (White) and (b) Meat shops (Red) and Military camps (Blue) The rhohat plot showing the density of dog sight points as a function of Euclidean distance from meat shops, military camps, rubbish bins, temples, buildings and road network is presented in Figure 8.8. It is evident that dog density increases with increasing distance from meat shops, military camps and temples which indicates poor association. A very strong association was observed between the buildings and road networks as a higher density of dogs were seen adjacent to the buildings and roads. 196

 meat")
 temples (e) buildings and")
220 (a) (b) (c) (d) (e) (f) Figure 8.8 Rhohat plot showing the density of dog sight points as a function of Euclidean distance from (a) meat shops, (b) rubbish bins, (c) military camps, (d) temples (e) buildings and (f) road networks 197
Bhutan's Experience In Implementing OIE Animal Welfare Standards. Dr. Kinlay Dorji National AW Focal Point
 Bhutan's Experience In Implementing OIE Animal Welfare Standards Dr. Kinlay Dorji National AW Focal Point Seminar for OIE National Focal Point for Animal Welfare Animal Welfare Legislation Bhutan does
STRAY DOG POPULATION CONTROL TERRESTRIAL ANIMAL HEALTH CODE CHAPTER 7.7.
 STRAY DOG POPULATION CONTROL TERRESTRIAL ANIMAL HEALTH CODE CHAPTER 7.7. 5 8 August 2014, Tokyo/Yokohama-Japan Tikiri Wijayathilaka, OIE RRAP, Tokyo, Japan 1 Presentation outline o History of the chapter
Dog Population Management Veterinary Oversight. Presented by Emily Mudoga & Nick D'Souza
 Dog Population Management Veterinary Oversight Presented by Emily Mudoga & Nick D'Souza DOGS IN COMMUNITIES In communities dogs provide benefits:- Companionship, Security; Herding; Specialized aid e.g.
OIE stray dog control standards and perspective. Dr. Stanislav Ralchev
 OIE stray dog control standards and perspective Dr. Stanislav Ralchev Background In May 2006, the OIE recognised the importance of providing guidance to members on humane methods of stray dog population
Stray Dog Population Control
 Stray Dog Population Control Terrestrial Animal Health Code Chapter 7.7. Tikiri Wijayathilaka, Regional Project Coordinator OIE RRAP, Tokyo, Japan AWFP Training, August 27, 2013, Seoul, RO Korea Presentation
Abundance and distribution of Clouded Leopard in Royal Manas National Park A detail Project Report
 Abundance and distribution of Clouded Leopard in Royal Manas National Park A detail Project Report Tshewang Jaimo Royal Manas National Park Gelephu April 25, 2016 Background of the study The Royal Manas
Stray Dog Population Control Terrestrial Animal Health Code Chapter 7.7 Dr Tomasz Grudnik OIE International Trade Department
 Stray Dog Population Control Terrestrial Animal Health Code Chapter 7.7 Dr Tomasz Grudnik OIE International Trade Department First OIE regional workshop on (national strategy) stray dog population management
Surveys of the Street and Private Dog Population: Kalhaar Bungalows, Gujarat India
 The Humane Society Institute for Science and Policy Animal Studies Repository 11-2017 Surveys of the Street and Private Dog Population: Kalhaar Bungalows, Gujarat India Tamara Kartal Humane Society International
Stray dog: means any dog not under direct control by a person or not prevented from roaming.
 Definitions of stray dogs Stray dog: means any dog not under direct control by a person or not prevented from roaming. Types of stray dog in Bulgaria: 1. feral dog: domestic dog that has reverted to the
of Conferences of OIE Regional Commissions organised since 1 June 2013 endorsed by the Assembly of the OIE on 29 May 2014
 of Conferences of OIE Regional Commissions organised since 1 June 2013 endorsed by the Assembly of the OIE on 29 May 2014 2 12 th Conference of the OIE Regional Commission for the Middle East Amman (Jordan),
OIE global strategy for rabies control, including regional vaccine banks
 Inception meeting of the OIE/JTF Project for Controlling Zoonoses in Asia under the One Health Concept OIE global strategy for rabies control, including regional vaccine banks Tokyo, Japan 19-20 December
Companion Animal Welfare Around the World: Key issues and topics
 Companion Animal Welfare Around the World: Key issues and topics Kate Nattrass Atema Director, Community Animals Program, IFAW Chairperson, International Companion Animal Management Coalition (ICAM) Trends
Canine rabies programs and the management of dog populations
 Striving to free people and animals from rabies Canine rabies programs and the management of dog populations Betsy Miranda Global Alliance for Rabies Control The Global Alliance for Rabies Control Striving
The Benefits of Dog Population Management (DPM) in Animal Welfare
 in Animal Welfare") The Benefits of Dog Population Management (DPM) in Animal Welfare Tennyson Williams Africa Director 2 nd International Meeting of the Pan-African Rabies Control Network Birchwood Hotel, Johannesburg, South
The Benefits of Dog Population Management (DPM) in Animal Welfare Tennyson Williams Africa Director 2 nd International Meeting of the Pan-African Rabies Control Network Birchwood Hotel, Johannesburg, South
OIE international standards on Rabies:
 Regional cooperation towards eradicating the oldest known zoonotic disease in Europe Antalya, Turkey 4-5 December 2008 OIE international standards on Rabies: Dr. Lea Knopf Scientific and Technical Department
First OIE regional workshop on dog population management- Raising public awareness on stray dogs
 Bucharest 17-19 June 2014 First OIE regional workshop on dog population management- Raising public awareness on stray dogs Alexandra Hammond-Seaman RSPCA International Raising public awareness WHY? - Dog
WHO (HQ/MZCP) Intercountry EXPERT WORKSHOP ON DOG AND WILDLIFE RABIES CONTROL IN JORDAN AND THE MIDDLE EAST. 23/25 June, 2008, Amman, Jordan
 Intercountry EXPERT WORKSHOP ON DOG AND WILDLIFE RABIES CONTROL IN JORDAN AND THE MIDDLE EAST. 23/25 June, 2008, Amman, Jordan") WHO (HQ/MZCP) Intercountry EXPERT WORKSHOP ON DOG AND WILDLIFE RABIES CONTROL IN JORDAN AND THE MIDDLE EAST 23/25 June, 2008, Amman, Jordan Good practices in intersectoral rabies prevention and control
WHO (HQ/MZCP) Intercountry EXPERT WORKSHOP ON DOG AND WILDLIFE RABIES CONTROL IN JORDAN AND THE MIDDLE EAST 23/25 June, 2008, Amman, Jordan Good practices in intersectoral rabies prevention and control
Outcome of the Conference Towards the elimination of rabies in Eurasia Joint OIE/WHO/EU Conference
 Outcome of the Conference Towards the elimination of rabies in Eurasia Joint OIE/WHO/EU Conference WHO (HQ-MZCP) / OIE Inter-country Workshop on Dog and Wildlife Rabies Control in the Middle East 23-25
International Declaration of Responsibilities to Cats
 International Declaration of Responsibilities to Cats Cat welfare is a complex subject and the responsibility for implementation of good welfare for cats falls to a number of organisations as well as to
First OIE regional workshop on dog population management- Identifying the source of the problem and monitoring the stray dog population
 Bucharest 17-19 June 2014 First OIE regional workshop on dog population management- Identifying the source of the problem and monitoring the stray dog population Alexandra Hammond-Seaman RSPCA International
International Declaration of Responsibilities to Cats
 International Declaration of Responsibilities to Cats Cat welfare is a complex subject and the responsibility for implementation of good welfare for cats falls to a number of organisations as well as to
Dog ecology studies oral vaccination of dogs Burden of rabies
 Dog ecology studies oral vaccination of dogs Burden of rabies By F.X. Meslin WHO Geneva at the occasion of the intercountry Expert Workshop on Protecting Humans from Domestic and Wildlife Rabies in the
RURAL VETERINARY PRACTICE IN WESTERN AUSTRALIA 1964 to 2007
 RURAL VETERINARY PRACTICE IN WESTERN AUSTRALIA 1964 to 2007 A thesis submitted for the degree of Doctor of Philosophy from MURDOCH UNIVERSITY by John Alexander Loftus Maxwell, B.V.Sc., M.V.S., M.A.C.V.Sc.,
What do we need to do if rabies is reintroduced into an area after a period of absence?
 5.4.20. What do we need to do if rabies is reintroduced into an area after a period of absence? Table of Contents Involvement of all relevant agencies, p2 Resources, p3 Identify and assemble personnel,
Fertility control to mitigate humanwildlife conflicts in an overcrowded world : an overview
 Fertility control to mitigate humanwildlife conflicts in an overcrowded world : an overview Giovanna Massei National Wildlife Management Group, York, UK 8 th Internat. Conference Fertility Control for
Companion Animal Management Student Activities
 Module 14 Companion Animal Management Questions 1. Humans keep companion, or pet animals, for social contact and pleasure. Identify and describe three of the most prevalent welfare problems that you will
GLOBAL CONFERENCE Global elimination of dog-mediated human rabies The Time Is Now
 GLOBAL CONFERENCE Global elimination of dog-mediated human rabies The Time Is Now BACKGROUND Concept Note Rabies remains an under-reported and neglected zoonosis with a case fatality rate of almost 100%
Dog Population Management and Rabies Control
 Dog Population Management and Rabies Control Tennyson Williams Africa Director 1 st Meeting of the Directors of Rabies Control Programmes in East Africa Regional Canine rabies elimination: prototype for
DECLARATION of the First Conference on Animal Welfare in the Baltic Region RESPONSIBLE OWNERSHIP 5 to 6 May, 2011, Vilnius, Lithuania
 DECLARATION of the First Conference on Animal Welfare in the Baltic Region RESPONSIBLE OWNERSHIP 5 to 6 May, 2011, Vilnius, Lithuania Animal welfare is a complex and multi-faceted issue with an impact
Science Based Standards In A Changing World Canberra, Australia November 12 14, 2014
 Science Based Standards In A Changing World Canberra, Australia November 12 14, 2014 Dr. Brian Evans Deputy Director General Animal Health, Veterinary Public Health and International Standards SEMINAR
OIE Standards for Animal Welfare
 1 OIE Standards for Animal Welfare 23 November 2010 Beyrouth, Lebanon Dr Mariela Varas International Trade Department OIE Outline 2 Standard setting work of the OIE Evolution of the OIE AW agenda A look
Report by the Director-General
 WORLD HEALTH ORGANIZATION ORGANISATION MONDIALE DE LA SANTÉ A31/2З 29 March 1978 THIRTY-FIRST WORLD HEALTH ASSEMBLY Provisional agenda item 2.6.12 f- 6-0- {/> >/\ PREVENTION AND CONTROL OF ZOONOSES AND
Resolution adopted by the General Assembly on 5 October [without reference to a Main Committee (A/71/L.2)]
![Resolution adopted by the General Assembly on 5 October [without reference to a Main Committee (A/71/L.2)]](/thumbs/93/113861770.jpg "Resolution adopted by the General Assembly on 5 October [without reference to a Main Committee (A/71/L.2)]") United Nations A/RES/71/3 General Assembly Distr.: General 19 October 2016 Seventy-first session Agenda item 127 Resolution adopted by the General Assembly on 5 October 2016 [without reference to a Main
United Nations A/RES/71/3 General Assembly Distr.: General 19 October 2016 Seventy-first session Agenda item 127 Resolution adopted by the General Assembly on 5 October 2016 [without reference to a Main
Surveys of the Street and Private Dog Population in Vadodara, India
 The Humane Society Institute for Science and Policy Animal Studies Repository 11-2017 Surveys of the Street and Private Dog Population in Vadodara, India Tamara Kartal Humane Society International Amit
World Society for the Protection of Animals The Role of NGOs in Supporting the Implementation of the OIE s Animal Welfare Standards
 The Role of NGOs in Supporting the Implementation of the OIE s Animal Welfare Standards Joanna Tuckwell Regional Inhumane Culling Campaign Manager, WSPA Asia Pacific Global Animal Welfare Standards Development
Global Conference on Rabies Control: Towards Sustainable Prevention at the Source
 Global Conference on Rabies Control: Towards Sustainable Prevention at the Source Seoul (Republic of Korea), 7-9 September 2011 T he World Organisation for Animal Health (OIE) is committed to supporting
To protect animal welfare and public health and safety
 To protect animal welfare and public health and safety The Dog Meat Trade in Indonesia: A Cruel and Dangerous Trade Every year, millions of dogs are captured and stolen to be transported throughout Indonesia
OIE Regional Commission for Europe Regional Work Plan Framework Version adopted during the 85 th OIE General Session (Paris, May 2017)
") OIE Regional Commission for Europe Regional Work Plan Framework 2017-2020 Version adopted during the 85 th OIE General Session (Paris, May 2017) Chapter 1 - Regional Directions 1.1. Introduction The slogan
OIE Regional Commission for Europe Regional Work Plan Framework 2017-2020 Version adopted during the 85 th OIE General Session (Paris, May 2017) Chapter 1 - Regional Directions 1.1. Introduction The slogan
VETERINARY SERVICES ARE A WORKING COMMUNITY WHICH, IN EVERY COUNTRY OF THE WORLD, PROTECTS THE HEALTH AND WELFARE OF ANIMALS.
 VETERINARY SERVICES WHAT THEY?... ARE ABOVE ALL VETERINARY SERVICES ARE A WORKING COMMUNITY WHICH, IN EVERY COUNTRY OF THE WORLD, PROTECTS THE HEALTH AND WELFARE OF ANIMALS. This community primarily comprises
Strengthening Epidemiology Capacity Using a One Health Framework in South Asia
 Strengthening Epidemiology Capacity Using a One Health Framework in South Asia Pete Jolly, Joanna McKenzie, Roger Morris, Eric Neumann, and Lachlan McIntyre International Development Group Institute of
University of Canberra. This thesis is available in print format from the University of Canberra Library.
 University of Canberra This thesis is available in print format from the University of Canberra Library. If you are the author of this thesis and wish to have the whole thesis loaded here, please contact
Baseline Survey for Street Dogs in Guam
 The Humane Society Institute for Science and Policy Animal Studies Repository 12-28-2014 Baseline Survey for Street Dogs in Guam John D. Boone Humane Society International Follow this and additional works
Domestic Animals Act What s in it; why and how will that affect me?
 Domestic Animals Act 1994 What s in it; why and how will that affect me? Why have issues just emerged? Veterinary engagement project History of legislation The Dog Act 1970 1987: A discussion paper, proposing
Dr Sumathy Puvanendiran, BVSc,M.Phil,PhD(USA) Veterinary Research Officer Dept of Animal Production & Health Sri Lanka
 Veterinary Research Officer Dept of Animal Production & Health Sri Lanka") Dr Sumathy Puvanendiran, BVSc,M.Phil,PhD(USA) Veterinary Research Officer Dept of Animal Production & Health Sri Lanka Sri Lanka Island in Indian Ocean, land extent-64,000sq km, 9 provinces and 25 districts
Dr Sumathy Puvanendiran, BVSc,M.Phil,PhD(USA) Veterinary Research Officer Dept of Animal Production & Health Sri Lanka Sri Lanka Island in Indian Ocean, land extent-64,000sq km, 9 provinces and 25 districts
Companion Animal Welfare Student Activities
 Module 26 Companion Animal Welfare Questions 1. When a shelter with a no kill policy has adequate facilities and resources it can house a certain number of animals comfortably. If admissions to the shelter
Animal Birth Control (Dog) Rules, 2001
 Rules, 2001") Animal Birth Control (Dog) Rules, 2001 Rule 2 - Definition: Note: In any legislation, terms defined by a definition clause will assume the meaning provided in such definition throughout the statute. The
Animal Birth Control (Dog) Rules, 2001 Rule 2 - Definition: Note: In any legislation, terms defined by a definition clause will assume the meaning provided in such definition throughout the statute. The
Mission Rabies Sri Lanka
 Mission Rabies Sri Lanka 10 th to 24 t September 2016 Contents Page Background. 2 Partnership and staffing. 2 Location. 3 Program. 4 Data.. 5 Experiences on the ground.. 11 Health and Safety 12 International
I am writing on behalf of the NSW Division of the Australian Veterinary Association and the Centre for Companion Animals in Community (CCAC).
.") Dear Member of the NSW Legislative Assembly, Re: Animals (Regulation of Sale) Bill 2007 I am writing on behalf of the NSW Division of the Australian Veterinary Association and the Centre for Companion
Dear Member of the NSW Legislative Assembly, Re: Animals (Regulation of Sale) Bill 2007 I am writing on behalf of the NSW Division of the Australian Veterinary Association and the Centre for Companion
SUMMARY OF FINDINGS AND RECOMMENDATIONS. Identifying Best Practice Domestic Cat Management in Australia
 SUMMARY OF FINDINGS AND RECOMMENDATIONS Identifying Best Practice Domestic Cat Management in Australia May 2018 RSPCA Australia gratefully acknowledges financial support from the Office of the Threatened
ANIMAL RABIES IN NEPAL AND RACCOON RABIES IN ALBANY COUNTY, NEW YORK
 ANIMAL RABIES IN NEPAL AND RACCOON RABIES IN ALBANY COUNTY, NEW YORK SHANKAR YADAV MPH Report/Capstone Project Presentation 07/19/2012 CHAPTER 1: FIELD EXPERIENCE AT KANSAS STATE UNIVERSITY RABIES LABORATORY
Dog-mediated human rabies elimination in the Oshana region-control Pilot Project
 Dog-mediated human rabies elimination in the Oshana region-control Pilot Project Dr Rauna Athingo 22 nd conference of the OIE Regional Commission for Africa, Swakopmund, Namibia, 22 nd February 2017 Background
CITY OF ELEPHANT BUTTE ORDINANCE NO. 154
 CITY OF ELEPHANT BUTTE ORDINANCE NO. 154 AN ORDINANCE OF THE CITY OF ELEPHANT BUTTE, NEW MEXICO, AMENDING SECTIONS 91, 155.026, 155.027, 155.028 and 155.033 OF THE CITY MUNICIPAL CODE RELATING TO THE LIMITED
First OIE regional Workshop on (national strategy) Stray Dog population management for Balkan countries
 Stray Dog population management for Balkan countries") First OIE regional Workshop on (national strategy) Stray Dog population management for Balkan countries Topic 3 Improving the level of coordination at national level Bulgarian experience Dr PETYA PETKOVA
First OIE regional Workshop on (national strategy) Stray Dog population management for Balkan countries Topic 3 Improving the level of coordination at national level Bulgarian experience Dr PETYA PETKOVA
RECOM SA seminar dedicated to the communication strategy, awareness and training on rabies for M aghreb countries
 RECOM SA seminar dedicated to the communication strategy, awareness and training on rabies for M aghreb countries 4-5 November 2015 Tunis, Tunisia 1. Do you know the number of human rabies cases that have
Happy dogs, happy people Healthy dogs, healthy people
 Happy dogs, happy people Healthy dogs, healthy people An Effective and Humane Method of Animal Birth Control and Godawari & Badikhel VDC, Lalitpur, Nepal Project in brief NAME OF THE PROJECT: CATCH NEUTER
Report on Owned Dog Population Survey In Lingayen, Philippines
 The Humane Society Institute for Science and Policy Animal Studies Repository 8-2018 Report on Owned Dog Population Survey In Lingayen, Philippines Tamara Kartal Humane Society International Lynne U. Sneddon
FAVA s strategy on MRA
 Regional Professional Organization FAVA s strategy on MRA Achariya Sailasuta, DVM, FRVCS, PhD, Dip.in ACCM Secretary General of Federation of Asian Veterinary Associations (FAVA), Faculty of Veterinary
Companion Animal Management in Victoria
 Companion Animal Management in Victoria Overview Summary of Victorian welfare legislation and control Explanation of animal welfare groups in Vic. Current knowledge of shelter statistics Welfare issues
Global Strategies to Address AMR Carmem Lúcia Pessoa-Silva, MD, PhD Antimicrobial Resistance Secretariat
 Global Strategies to Address AMR Carmem Lúcia Pessoa-Silva, MD, PhD Antimicrobial Resistance Secretariat EMA Working Parties with Patients and Consumers Organisations (PCWP) and Healthcare Professionals
Spay and Neuter Voucher Pilot Project
 Spay and Neuter Voucher Pilot Project 2013/14 to 2014/15 Evaluation Report March 2016 Animal Health Unit Department of Environment Government of Yukon animalhealth@gov.yk.ca Phone: 867-667-5600 Or 1-800-661-0408
Strategies for humane population management in Cozumel. MVZ Erika Flores Reynoso
 Strategies for humane population management in Cozumel MVZ Erika Flores Reynoso Where is Cozumel? 490 km2 79, 579 habitants Humane Society of Cozumel Created in 1993, re-organized in 1997. 1 veterinarian,
Report to ENVIRONMENTAL PLANNING & REGULATIONS Committee for decision
 18 364 Title: Section: Prepared by: Annual Report Dog Control Policy and Practices 1 July 2017 30 June 2018 Environmental Services & Protection Gary McKenzie (Acting Enforcement Manager) Meeting Date:
DOG CONTROL POLICY 2016
 DOG CONTROL POLICY 2016 Contents Why do we need a Dog Control Policy? 1 Legislation 2 Obligations of dog owners 3 General Health and Welfare 3 Registration of dogs 3 Micro-chipping of dogs 3 Working dogs
Veterinary Legislation and Animal Welfare. Tania Dennison and David M. Sherman
 Veterinary Legislation and Animal Welfare Tania Dennison and David M. Sherman Objectives of the Presentation Part 1 Brief background on the OIE Veterinary Legislative Support Program (VLSP) in the context
GOOD GOVERNANCE OF VETERINARY SERVICES AND THE OIE PVS PATHWAY
 GOOD GOVERNANCE OF VETERINARY SERVICES AND THE OIE PVS PATHWAY Regional Information Seminar for Recently Appointed OIE Delegates 18 20 February 2014, Brussels, Belgium Dr Mara Gonzalez 1 OIE Regional Activities
Community Perceptions of Animal Welfare
 Community Perceptions of Animal Welfare A Survey Summary There are a large numbers of stray dogs in the Kathmandu Valley close to 30,000 at any one time (including "community dogs"). Most of urban stray
Rabies Research & Impact
 Rabies Research & Impact Katie.Hampson@glasgow.ac.uk Tiziana.Lembo@glasgow.ac.uk Sarah.Cleaveland@glasgow.ac.uk Daniel.Haydon@glasgow.ac.uk Jim.Caryl@glasgow.ac.uk Dog vaccination Surveillance Community
Second Meeting of the Regional Steering Committee of the GF-TADs for Europe. OIE Headquarters, Paris, 18 December 2007.
 Second Meeting of the Regional Steering Committee of the GF-TADs for Europe OIE Headquarters, Paris, 18 December 2007 Recommendation 1 Support to Regional Animal Health Activities under the regional GF-TADs
Regional Experience on VEEs and VSBs in South-East Asia (SEA)
") Regional Experience on VEEs and VSBs in South-East Asia (SEA) Pennapa Matayompong Programme Coordinator OIE Sub-Regional Representation for South-East Asia (OIE SRR-SEA) 1 Outline Introduction Progress
Regional Experience on VEEs and VSBs in South-East Asia (SEA) Pennapa Matayompong Programme Coordinator OIE Sub-Regional Representation for South-East Asia (OIE SRR-SEA) 1 Outline Introduction Progress
OIE AMR Strategy, One Health concept and Tripartite activities
 Dr Mária Szabó Chargée de mission OIE AMR Strategy, One Health concept and Tripartite activities Training Seminar for Middle East Focal Points for Veterinary Products Beirut, Lebanon 2017 Summary OIE strategy
Cat Alliance of Australia Inc
 Cat Alliance of Australia Inc Animal Welfare Standards Public Consultation Locked bag 3006 Deakin West ACT 2600 Submission into the Australian Animal Welfare Standards and Guidelines Dear Committee, We
WHY STAKEHOLDER ENGAGEMENT IS CRITICAL TO OIE STRAY DOG INITIATIVE
 WHY STAKEHOLDER ENGAGEMENT IS CRITICAL TO OIE STRAY DOG INITIATIVE Dogs & People 2016: Mastering Stakeholder Engagement for Sustainable Impacts Dr Mark Schipp OIE Delegate Australia Vice-President of the
National Action Plan development support tools
 National Action Plan development support tools Sample Checklist This checklist was developed to be used by multidisciplinary teams in countries to assist with the development of their national action plan
Surveillance. Mariano Ramos Chargé de Mission OIE Programmes Department
 Mariano Ramos Chargé de Mission OIE Programmes Department Surveillance Regional Table Top Exercise for Countries of Middle East and North Africa Tunisia; 11 13 July 2017 Agenda Key definitions and criteria
Mathematical models for dog rabies that include the curtailing effect of human intervention
 Mathematical models for dog rabies that include the curtailing effect of human intervention Tiffany Ngo Leung Supervised by Dr Stephen A Davis RMIT University Abstract Rabies is a zoonotic viral disease
Country Report on National Stray Dogs situation Report from Republic of Serbia
 First OIE regional Workshop on (national strategy) Stray Dog population management for Balkan countries Bucharest / Romania 17-19 June 2014 Country Report on National Stray Dogs situation Report from Republic
Key considerations in the breeding of macaques and marmosets for scientific purposes
 Key considerations in the breeding of macaques and marmosets for scientific purposes Key considerations in the breeding of macaques and marmosets for scientific purposes Laboratory Animal Science Association
Census versus Capture-recapture Method to Estimate Dog Population in Lumlukka District, Pathum Thani Province, Thailand, 2010
 Census versus Capture-recapture Method to Estimate Dog Population in Lumlukka District, Pathum Thani Province, Thailand, 2010 Vilaiporn Wongphruksasoong 1, *, Santayakorn S 1, Sitthi W 1, Ardkham B 1,
World Organisation for Animal Health
 World Organisation for Animal Health 2017 Progressive Actions for Achievement of global health security Dr Susan Corning BA MSc BVSc MRCVS FRSPH Global Health Security Agenda Steering Group Meeting Geneva,
21st Conference of the OIE Regional Commission for Europe. Avila (Spain), 28 September 1 October 2004
, 28 September 1 October 2004") 21st Conference of the OIE Regional Commission for Europe Avila (Spain), 28 September 1 October 2004 Recommendation No. 1: Recommendation No. 2: Recommendation No. 3: Contingency planning and simulation
21st Conference of the OIE Regional Commission for Europe Avila (Spain), 28 September 1 October 2004 Recommendation No. 1: Recommendation No. 2: Recommendation No. 3: Contingency planning and simulation
BEHAVIOUR OF THE DOMESTIC DOG (Canis familiaris)
") THE INFLUENCE OF CEREBRAL LATERALISATION ON THE BEHAVIOUR OF THE DOMESTIC DOG (Canis familiaris) A thesis submitted for the Degree of DOCTOR OF PHILOSOPHY by Luke Aaron Schneider B. A. (Hons) School of
THE INFLUENCE OF CEREBRAL LATERALISATION ON THE BEHAVIOUR OF THE DOMESTIC DOG (Canis familiaris) A thesis submitted for the Degree of DOCTOR OF PHILOSOPHY by Luke Aaron Schneider B. A. (Hons) School of
WORLD ANTIBIOTIC AWARENESS WEEK
 # AntibioticResistance WORLD ANTIBIOTIC AWARENESS WEEK 14-20 NOVEMBER 2016 2016 CAMPAIGN TOOLKIT TABLE OF CONTENTS Why we need a global campagin... Campagin objectives... Key messages... Calls to action
Stray dogs in the EU a Commission contribution
 Stray dogs in the EU a Commission contribution SEMINAR STRAY DOGS: PRESENT AND FUTURE 3rd June 2015 IASI (Romania) Alexandra Kostorz Animal Welfare Directorate for Health and Food Safety Short introduction
A 100 Years of Rabies in Kenya A Rabies-FREE Kenya by 2030
 A 100 Years of Rabies in Kenya A Rabies-FREE Kenya by 2030 Thumbi Mwangi 1,2, Bitek A 3, Nanyingi M 4, Rees Muriithi 3, PM Kitala 4, MK Njenga 1, 2 et al 1 Paul G. Allen School for Global Animal Health,
INVERCARGILL CITY COUNCIL. Bylaw 2015/1 Dog Control
 INVERCARGILL CITY COUNCIL Bylaw 2015/1 Dog Control [THIS PAGE IS INTENTIONALLY LEFT BLANK] CONTENTS SECTION Page 1. Short Title and Commencement... 1 2. Object of Bylaw... 1 3. Repeal... 1 4. Exclusions...
ASEAN GOOD ANIMAL HUSBANDRY PRACTICES FOR PIGS
 1 Adopted at the 40 th AMAF Meeting 11 October 2018 Ha Noi, Viet Nam ASEAN GOOD ANIMAL HUSBANDRY PRACTICES FOR PIGS ASEAN SECTORAL WORKING GROUP ON LIVESTOCK 2018 2 ASEAN GOOD ANIMAL HUSBANDRY PRACTICES
OIE s global commitment on fighting animal diseases
 Dr Etienne Bonbon President of the Terrestrial Animal Health Commission OIE s global commitment on fighting animal diseases Animal health Room for national measures in an international perspective Oslo,
Towards Sustainable Prevention of Rabies at Source: Case Report India
 Towards Sustainable Prevention of Rabies at Source: Case Report India S. Abdul Rahman Secretary Commonwealth Veterinary Association President, Association for Prevention and Control of Rabies in India
How do you tell a starving man to feed his dogs?
 How do you tell a starving man to feed his dogs? The economic, social and cultural challenges of running an animal welfare organisation in one of the world s worst economies. Sincere gratitude to Dogs
Building Responsible Pet Ownership Communities The Calgary Model. Thursday, October 22, 15
 Building Responsible Pet Ownership Communities The Calgary Model In North America we do not have a problem with pet overpopulation, stray animals, nuisance or vicious animals we have a problem with responsible
A BASC PUBLICATION REVISED 2016 GUNDOGS IN THE UK A CODE OF PRACTICE
 A BASC PUBLICATION REVISED 2016 GUNDOGS IN THE UK A CODE OF PRACTICE 1. INTRODUCTION BASC strongly recommends that anyone who goes shooting should be accompanied by a trained and competent gundog. Using
Research & Reviews: Journal of Medical and Health Sciences
 Research & Reviews: Journal of Medical and Health Sciences e-issn:2319-9865 Investigation of Dog Bites Victims in Kebribeyah District: Ethiopian Somali Region, Eastern Ethiopia, December 2013 Yusuf Mohammed*
OIE Strategy on Antimicrobial Resistance and the Prudent Use of Antimicrobials in Animals Part I
 Dr Elisabeth Erlacher-Vindel Head of the Antimicrobial Resistance and Veterinary Products Department OIE Strategy on Antimicrobial Resistance and the Prudent Use of Antimicrobials in Animals Part I 2nd
Dog Control Bylaw 2018
 Dog Control Bylaw 2018 Date Made: 07 June 2018 Commencement: 01 July 2018 Dog Control Bylaw 2018 Page 2 Contents Part 1: Introduction... 4 1 Short Title and Commencement... 4 2 Revocation... 4 3 Purpose...
EFFECTS OF SEASON AND RESTRICTED FEEDING DURING REARING AND LAYING ON PRODUCTIVE AND REPRODUCTIVE PERFORMANCE OF KOEKOEK CHICKENS IN LESOTHO
 EFFECTS OF SEASON AND RESTRICTED FEEDING DURING REARING AND LAYING ON PRODUCTIVE AND REPRODUCTIVE PERFORMANCE OF KOEKOEK CHICKENS IN LESOTHO By SETSUMI MOTŠOENE MOLAPO MSc (Animal Science) NUL Thesis submitted
Recommendations of the 3 rd OIE Global Conference on Animal Welfare
 Recommendations of the 3 rd OIE Global Conference on Animal Welfare Seminar for OIE National Focal Points for Animal Welfare Seoul, Republic of Korea, 27 29 August 2013 Dr Tomoko Ishibashi OIE Regional
GENERAL PRESENTATION OF THE OIE
 GENERAL PRESENTATION OF THE OIE Regional Seminar for OIE National Focal Points for Veterinary Products (4 th Cycle) 2-4 March 2016 Tokyo, Japan 1 THE OIE IN BRIEF 2 What is the OIE? An intergovernmental
LAO PEOPLE S DEMOCRATIC REPUBLIC. Instruction on the Regulation on Livestock Management in the Lao PDR
 Page 1 LAO PEOPLE S DEMOCRATIC REPUBLIC PEACE INDEPENDENCE DEMOCRACY UNITY PROSPERITY Ministry of Agriculture and Forestry Instruction on the Regulation on Livestock Management in the Lao PDR 1. Principles
Trends in exposure of veterinarians to physical and chemical hazards and use of
 Trends in exposure of veterinarians to physical and chemical hazards and use of protection practices Lin Fritschi 1 Adeleh Shirangi 2 Ian D Robertson 3 Lesley M Day 4 1. Laboratory for Cancer Medicine,
Information Pack for Vets and Volunteers from India
 Information Pack for Vets and Volunteers from India Mission Rabies was born out of a desire to make a difference to the lives of millions of people and dogs across India. India is the world s rabies hotspot,