Glenelg Ark benefits to biodiversity from long-term fox control 2015 update
|
|
|
- Carol Bradley
- 5 years ago
- Views:
Transcription


1 Glenelg Ark benefits to biodiversity from long-term fox control 2015 update Alan Robley, Paul Moloney and Georgina Neave November 2016 Arthur Rylah Institute for Environmental Research, Department of Environment, Land, Water and Planning Technical Report Series No. 275
2
3 Glenelg ARK 2015 update i
4 Glenelg Ark - benefits to biodiversity from long-term fox control 2015 update Alan Robley, Paul Moloney and Georgina Neave Arthur Rylah Institute for Environmental Research Department of Environment, Land, Water and Planning 123 Brown Street, Heidelberg, Victoria Department of Environment, Land, Water and Planning Heywood, Victoria November 2016 Arthur Rylah Institute for Environmental Research Department of Environment, Land, Water and Planning Heidelberg, Victoria
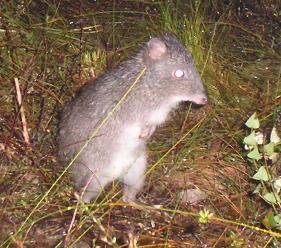
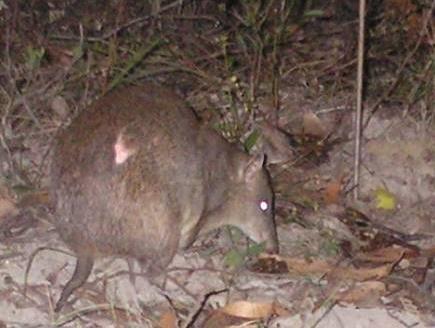
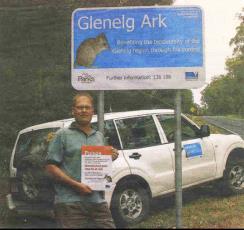
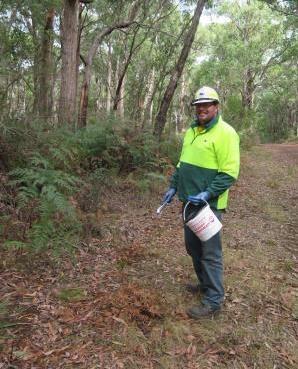
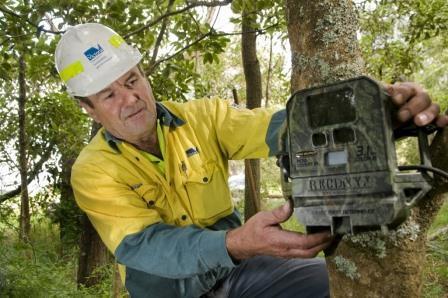
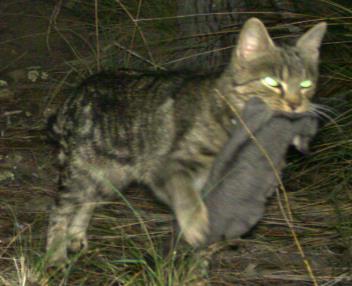
5 Glenelg Ark 2015 Update iii Report produced by: Arthur Rylah Institute for Environmental Research Department of Environment, Land, Water and Planning PO Box 137 Heidelberg, Victoria 3084 Phone (03) Website: Citation: Robley, A., Moloney, P. and Neave G. (2016). Glenelg Ark benefits to biodiversity from long-term fox control 2015 update. Arthur Rylah Institute for Environmental Research Technical Report Series No Department of Environment, Land, Water and Planning, Heidelberg, Victoria. Front cover photo: (a) Members of the Glenelg Ark field team: Tom McKinnon, Fed Warton, Megan Bull, (b) Aileen Smith, (c) Justin Cook, (d) Michael Bowd, (e) Chris Hatfield, (f) Dwayne Hauser and (g) Richard Wilson (photographer: DEWLP). (h) Red Fox, (i) Common Brushtail Possum, (j) Southern Brown Bandicoot and (k) Long-nosed Potoroo (photographer: Alan Robley). (l) Feral Cat (photographer: Marc Perri). The State of Victoria Department of Environment, Land, Water and Planning 2016 This work is licensed under a Creative Commons Attribution 3.0 Australia licence. You are free to re-use the work under that licence, on the condition that you credit the State of Victoria as author. The licence does not apply to any images, photographs or branding, including the Victorian Coat of Arms, the Victorian Government logo, the Department of Environment, Land, Water and Planning logo and the Arthur Rylah Institute logo. To view a copy of this licence, visit Printed by (Print Room, Preston) Edited by Organic Editing ISSN (print) ISSN (pdf)) ISBN (print) ISBN (pdf/online) Accessibility If you would like to receive this publication in an alternative format, please telephone the DELWP Customer Service Centre on , customer.service@delwp.vic.gov.au or contact us via the National Relay Service on or This document is also available on the internet at Disclaimer This publication may be of assistance to you but the State of Victoria and its employees do not guarantee that the publication is without flaw of any kind or is wholly appropriate for your particular purposes and therefore disclaims all liability for any error, loss or other consequence which may arise from you relying on any information in this publication. Arthur Rylah Institute for Environmental Research Technical Report No. 275
6 Glenelg Ark 2015 update Contents Acknowledgements 2 Summary 3 Key recommendations 5 1 Introduction 7 2 Methods Glenelg Ark operations area Monitoring and evaluation design Measuring changes in fox and feral Cat activity Measuring site occupancy changes in mammal species Costs of hair-tube and camera-trap methods Data analysis 12 3 Results Rainfall Fox and feral Cat activity Fox activity Feral Cat activity Transitioning from hair-tubes to camera traps Detection rates Sites occupied in Differences in occupancy at fox treatment and non-treatment sites Costs of implementing methods in the field Changes in the number of sites occupied Common Brushtail Possums Long-nosed Potoroos Southern Brown Bandicoots 26 4 Discussion 28 Recommendations 31 References 33 Appendices 36 Appendix 1. Fox and feral Cat activity model output 36 iv
7 Tables Glenelg Ark 2015 Update v Table 1. The number of monitoring sites at which Common Brushtail Possums were detected at each location, the method(s) used to detect them and the naïve occupancy rate. Both = combination of hair-tube and camera methods Table 2. The number of sites at which Long-nosed Potoroos were detected at each location, the method(s) used to detect them and the naïve occupancy rate. Both = combination of hair-tube and camera methods Table 3. Differences in hair-tube detection rates for Long-nosed Potoroos at sites with possums detected and sites without possums detected. Green shading highlights where there was substantial evidence that the detection probabilities were larger for Long-nosed Potoroos when Common Brushtail Possums were detected. Blue shading highlights where there was substantial evidence that the detection probabilities were smaller for Long-nosed Potoroos when Common Brushtail Possums were detected. HDI=Highest Density Interval (similar to the credible interval in frequentists statistics) Table 4. The number of sites at which Southern Brown Bandicoots were detected at each location, the method(s) used to detect them and the naïve occupancy rate. Both = combination of hair-tube and camera methods Table 5. Differences in hair-tube detection rates for Southern Brown Bandicoots at sites with possums detected and sites without possums detected. Blue shading highlights where there was substantial evidence that the detection probabilities were smaller when Common Brushtail Possums were detected. HDI=Highest Density Interval (similar to the credible interval in frequentists statistics).. 20 Table 6. Probability that the average occupancy estimates were greater on fox control sites compared to non fox control sites. The green shading indicates when the proportion of average modelled occupancy estimates were higher for fox control sites than for non-fox control sites. Where the proportion (from the model iterations) was >0.95 it indicates strong evidence that fox control influenced occupancy Table 7. Relative costs per year of implementing hair-tube and camera-trap surveys in 2013/ v
8 Glenelg Ark 2015 update Figures Figure 1. Glenelg Ark operations area. Tan polygons = treatment monitoring locations; green polygons = non-treatment monitoring Locations; red dots = poison bait stations, orange dots = free feed bait Figure 2. Monitoring sites in the treated (tan polygons) and non-treated (green polygons) monitoring locations of Glenelg Ark are indicated by red dots Figure 3. Layout of nine hair-tubes and possible location (A, B, C or D) of the single digital camera at a monitoring site Figure 4. Difference in mean annual rainfall (%) from the long-term ( ) average for 1980 to Data from the rainfall station at Portland Airport Figure 5. Fox activity (number of images per day at each camera site) at treatment monitoring locations (TMLs) and non-treatment monitoring locations (NTMLs). Bars are 95% credible intervals Figure 6. Feral Cat activity (number of images per day at each camera location) across treatment type (TML = fox control, NTML = no fox control) as measured by digital cameras. Bars are 95% credible intervals Figure 7. Cumulative detection rates [using hair-tubes (a), or cameras (b)] for Common Brushtail Possums at the six monitoring locations in Glenelg Ark Figure 8. Cumulative detection rates [using hair-tubes (a), or cameras (b)] for Long-nosed Potoroos at the six monitoring locations in the Glenelg Ark area. Blue = no possums present; red = possums present Figure 9. Cumulative detection rates [using hair-tubes (a), or cameras (b)] for Southern Brown Bandicoots at the six monitoring locations in the Glenelg Ark area. Blue = no possums present; red = possums present Figure 10. Estimated number of sites occupied by Common Brushtail Possums in 2013 (a) and 2014 (b): hair-tube data only (squares), camera-trap data only (triangles) or both combined (circles). Results sorted by location; no fox control = red; fox control = blue. Symbols represent the mean value, and bars represent the 95% density interval Figure 11. Number of sites occupied by Long-nosed Potoroos in 2013 (a) and 2014 (b) using either hair-tube data only (squares), camera-trap data only (triangles) or both combined (circles). Results sorted by location; no fox control = red; fox control = blue. Symbols represent mean values, while bars represent the 95% density intervals Figure 12. Number of sites occupied by Southern Brown Bandicoots in 2013 (a) and 2014 (b) using either hair-tube data only (squares), camera-trap data only (triangles) or both combined (circles). Results sorted by location; no fox control = red; fox control = blue. Symbols represent mean values, while bars represent the 95% density intervals vi
9 Glenelg Ark 2015 Update Figure 13. Estimated number of sites occupied by Common Brushtail Possums over time at TMLs and NTMLs Figure 14. Estimated number of sites occupied by Common Brushtail Possums in each region over time. Dots indicate the medians and the bars represent the 95% high-density intervals. Left panels NTMLs, right panels- TMLs Figure 15. Estimated number of sites occupied by Long-nosed Potoroos over time at TMLs and NTMLs Figure 16. Estimated numbers of sites occupied by Long-nosed Potoroos in each region over time. Dots indicate the medians and the bars represent the 95% high-density intervals. Left panels NTMLs, right panels- TMLs Figure 17. Estimated number of sites occupied by Southern Brown Bandicoots over time at TMLs and NTMLs Figure 18. Estimated number of sites occupied by Southern Brown Bandicoots in each region over time. Dots indicate the medians and the bars represent the 95% high-density intervals. Left panels NTMLs, right panels- TMLs vii vii
10 Glenelg Ark 2015 update Acknowledgements Data analysis and reporting was funded by the Weeds and Pests on Public Land Initiative of the Department of Environment, Land, Water and Planning (through the Glenelg Ark project and Parks Victoria). Wesley Burns (DELWP) provided valuable support to the project. Members of the Glenelg Ark Working Group (Richard Hill and Bernadette Hoare, among others) also provided guidance and input throughout. Members of the works crew at the Heywood and Dartmoor Depot undertook invaluable project support activities, including baiting and camera set-up (Megan Andrews, Tyler Britten, Allan Duffield, Dave Grassi, Dane Handreck, Mitchell Harker, Chris Hatfield, Robert McDonald, Tom McKinnon, Kane Millard and Irene Whennen), baiting (Ray Albert, Michael Bowd, Dwayne Hauser, Tim Hisscock and Kenny Scott) and camera set-up (Rhys Evans, Leigh Malseed and Leesa Thomas). David Ramsey and Katie Howard provided comments that improved this report. This work was conducted under Department of Environment, Land, Water and Planning Animal Ethics Committee Permit Numbers 8/28, 9/15, 10/23 and 15/08. 2
11 Glenelg ARK 2015 update 3
12 Glenelg Ark 2015 update Summary The Glenelg Ark project was established in 2005 to facilitate the recovery of selected native mammal species considered at risk from Red Fox ( fox ; Vulpes vulpes) predation. The project established continuous landscape-scale fox baiting across 100,000 ha of State Forest and National Park in south-western Victoria. Three native mammal species that are present in the Glenelg Ark project area in low numbers, which have patchy distributions and are thought to be at risk from fox predation were selected for monitoring. These were the Southern Brown Bandicoot (Isoodon obesulus), the Long-nosed Potoroo (Potorous tridactylus) and the Common Brushtail Possum (Trichosurus vulpecula). This report updates the previous 2012 monitoring and evaluation report (Robley et al. 2014) by adding new data on the outcome of the fox control operation and the response of targeted native species from 2013 to During this period, an assessment of the monitoring method for detecting native mammal species (hair-tubes) was compared to a new approach (digital cameras). This report also contains recommendations for future management options and suggests areas of further research aimed at improving land managers knowledge and practices in order to attain better conservation outcomes. Differences between the level of fox activity at locations with and without fox control (i.e., treatment and non-treatment locations) were assessed from the number of independent images captured on camera traps from 2013 to Activity at locations with fox control was significantly lower compared with activity at locations without fox control. There was no significant difference in feral Cat activity between sites with and without fox control, although the point estimates suggest higher levels of Cat activity in treated areas. There was no significant difference in the detection rates of native mammals between the hair-tubes and the digital cameras; however, digital cameras captured a broader range of species, were less expensive to operate in the field, and the camera data had smaller confidence limits. We used data gathered in 2013 and 2014 from hair-tubes, digital cameras, and both methods combined to assess differences in the number of sites occupied by native mammals between locations with and without fox control. In 2013, all three methods showed strong evidence of a positive effect from fox control on the number of sites occupied by Common Brushtail Possums; cameras, and hair-tubes and cameras combined showed strong evidence of a positive effect for Long-nosed Potoroos and inconclusive evidence of a positive effect for Southern Brown Bandicoots. In 2013, cameras and hair-tubes alone, and cameras combined with hair-tubes showed strong evidence of a positive effect on site occupancy from fox control on Common Brushtail Possums and Long-nosed Potoroos, and inconclusive evidence of a positive effect on Southern Brown Bandicoots. In 2014, cameras-only showed no evidence of an effect for Common Brushtail Possums, Southern Brown Bandicoots and Longnosed Potoroos. Hair-tubes alone failed to detect any difference in the number of sites occupied for any of the three species in either year. We used the camera-trap data to update the long-term dataset ( ). Since the previous Glenelg Ark update in 2012, the number of sites occupied by Common Brushtail Possums remained higher in treatment locations compared with the number in non-treatment locations; little change was observed for Long-nosed Potoroos, and there is no indication of a further increase in number of sites occupied since the initial spike in 2008; the site occupancy of Southern Brown Bandicoots remained unchanged until 2015, at which point the number of sites occupied was greater at locations with fox control. 4
13 Glenelg ARK 2015 update Key recommendations The following recommendations are made to improve the outcomes of Glenelg Ark. Item Recommendation Detail Native species response Move to using digital cameras as the main monitoring tool for native species. There was no overall significant difference in detection rates between cameras and hair-tubes; however, cameras are less costly to operate and are able to capture a wider range of species in all weather conditions. Fox control Differences in fox and feral Cat abundances across treatment/nontreatment areas Alternative survey methods for foxes and feral Cats Develop bandicoot and potoroo habitat suitability surfaces for the Glenelg Ark project area using presence/absence data to aid in setting species response targets and potential new control and / or monitoring sites. Using species distribution models of the benefits of fox control for the Heath Mouse, select sites for targeted monitoring on treatment and nontreatment locations. Review the predator control program and investigate options for improving where needed. Use spatially explicit individual-based population models of the reduction in foxes from control operations to develop strategies for increased reduction in fox populations. Undertake camera monitoring specifically to assess the effectiveness of the control operation, and use the information to assist in the development of an integrated feral Cat and fox control strategy. Assess and cost the feasibility of genotyping DNA from fox scats collected using scat detector dogs. The limited response of bandicoots and potoroos may be due to a lack of suitable habitat for these species. We propose that the site occupancy information be used to explore the possible limitation of suitable habitat. This data combined with freely available remotely sensed habitat data (e.g., vegetation type, topography, fire history, distance to drainage lines, forest edge) can be combined with information on detection and non-detection of species at sites to develop a species habitat suitability surface across the project area. This information will be useful in understanding the expected increase in species occurrence and also identify potential new locations for monitoring and or fox control actions. Current monitoring sites were placed in locations based on Ecological Vegetation Divisions mapping and the best understanding of suitable habitat at that time. Predictive species distribution models that incorporate the likely benefit of fox control have been developed in recent years. These could be used to select sites more likely to have the Heath Mouse present. If fox control has delivered a positive benefit, there should be a detectable difference between treated sites and non-treated sites. Bait density and the frequency of bait replacement, as well as bait type and placement can affect the outcome of fox control. A general review of the program with consideration of the items above is warranted. Use existing empirical data and expert elicitation to develop models testing a range of baiting scenarios in order to assess their impact on fox abundance. Despite decades of fox control, we have little understanding of what the best strategy is for reducing and maintaining lower fox abundances. Determine the number of camera sites required through a power analysis to assess differences (if they exist) in fox and feral Cat activity on treated and non-treated sites. Scat detector dogs and genotyping DNA from scats have both been used successfully to enumerate fox populations before and after fox control. A similar approach could be used in Glenelg Ark to assess differences between baited and comparable unbaited areas. Scientific support Continue to source scientific support and advice concerning the ongoing implementation and development of Glenelg Ark. Evaluation and interpretation of monitoring data, development of new projects addressing emerging issues, and general guidance to the project has been essential to its success. 5
14 Glenelg Ark 2015 update Item Recommendation Detail Monitoring and reporting Continue annual monitoring, evaluation and reporting. Continue annual monitoring and reporting in order to closely track changes in predators and prey, thus allowing more responsive management of emerging issues, e.g. a decline in Southern Brown Bandicoots; a change in feral Cat abundance. Filling specific knowledge gaps Develop a set of potential student projects to fill identified knowledge gaps. The current monitoring program does not assess changes in small native mammals (e.g. Heath Mouse and White-footed Dunnarts), or unintended consequences (e.g. the possible negative impacts on biodiversity of overabundant medium- and small-sized herbivores, e.g. wallabies and Common Brushtail Possums). A series of student projects aimed at filling these knowledge gaps and taking advantage of the infrastructure that Glenelg Ark provides would be possible. 6
15 Glenelg ARK 2015 update 1 Introduction The Glenelg Ark project was established in July 2005 to facilitate the recovery of selected native mammal populations considered at risk from Red Fox ( fox ; Vulpes vulpes) predation. The project established continuous landscape-scale fox baiting across 100,000 ha of State Forest and National Park in southwestern Victoria. To justify ongoing government commitment and community support for Glenelg Ark, its benefits to Victoria s biodiversity must be demonstrated. The monitoring and evaluation component of Glenelg Ark measures: (i) the response of foxes to control activities, and (ii) the response to a reduced abundance of foxes of native species that are at risk from fox predation. Without such a program, management will have no capacity to justify reinvestment of scarce public conservation funds, improve management actions based on scientific information, and maintain community support. Thus, monitoring and evaluation forms an essential part of management and is not an imposition or adjunct to it. Three native mammal species that are present in the Glenelg Ark project area in low numbers (Robley et al. 2011), have patchy distributions (Menkhorst 1995) and are thought to be at risk from fox predation were selected for monitoring. These are the Southern Brown Bandicoot (Isoodon obesulus), the Long-nosed Potoroo (Potorous tridactylus) and the Common Brushtail Possum (Trichosurus vulpecula). The bandicoot and potoroo are medium-sized ground-dwelling mammals (c. 1.0 kg and c. 1.2 kg, respectively) with high and moderate fecundity, respectively (Lobert and Lee 1990). Both species are known to be preyed upon by foxes (Seebeck 1978) and have been reported to positively respond to a reduction in foxes (Kinnear et al. 2002; Arthur et al. 2012). The Common Brushtail Possum is a semi-arboreal species weighing c. 3.0 kg, has a low rate of fecundity (Kerle and How 2008) and is known to occur in the diet of foxes (Triggs et al. 1984) and to respond to fox control (Kinnear et al. 2002). Given the role that foxes have played in the decline and extinction of Australian mammals (Short and Smith 1994; Salo et al. 2007), the examples of mammal recovery following sustained reduction in fox abundance (Saunders et al. 2008), and considering our knowledge of the initial status of the targeted prey species, it was reasoned that once fox numbers had been reduced, the prey species would be able to escape limitation and the number of sites occupied by the targeted prey species should increase. We assessed changes in foxes and feral Cats (Felix catus) by comparing their activity (number of independent images captured by digital cameras at a monitoring site) at locations with an ongoing history of continuous fox control (fortnightly replacement baiting) with that at locations with no history of fox control. We assessed the response of native species to the reduction in foxes by comparing the number of monitoring sites occupied by the native species at locations with and without ongoing fox control. The response of native species to the reduction in fox abundance at sites in Glenelg Ark was assessed using detections resulting from species contact with hair-tubes each spring from 2005 to While hair-tubes have been widely used for detecting and assessing the status of ground-dwelling mammals throughout Australia (Lindenmayer et al. 1999), a newer approach using digital cameras to trap animals has been developed in recent years (O Connell et al. 2011). As part of the continuous improvement process for the Glenelg Ark project, an investigation into the use of digital cameras was undertaken from 2013 to We examined the differences (if any) in the occupancy and detection estimates of Common Brushtail Possums, Long-nosed Potoroos and Southern Brown Bandicoots obtained using camera trapping compared with using hair-tubes at the six monitoring locations within the Glenelg Ark project area. The aims were: (i) to determine whether there was any increase in efficacy in changing the monitoring tool used from hair-tubes to digital cameras, (ii) to determine whether in moving to camera based monitoring it would be possible to maintain continuity with the 9-year hair-tube dataset, and (iii) to compare the relative costs of each method of data collection. 7
16 Glenelg Ark 2015 update This report updates the previous monitoring and evaluation report covering (Robley et al. 2014), by incorporating new data on the outcome of the fox control operation and the response of the targeted native species from 2013 to This report also contains recommendations on future management options and suggested areas of further research. The outcome is that land managers, policymakers, and the community can now make informed, evidence-based assessment of the success of broadscale mainland fox control operations, and decisions about future directions. 8
17 Glenelg ARK 2015 update 2 Methods 2.1 Glenelg Ark operations area The Glenelg Ark operations area is located in far south-west Victoria, near the township of Heywood (38 07' 50'' S, ' 45'' E), and includes six locations in State Forests and National Parks. The main ecological vegetation communities across all six locations are heathy woodland, lowland forest, herb-rich woodland, and wet heathland. The area receives an average annual rainfall of 700 mm, and an average minimum and maximum temperature of 8.1 C and 17.6 C, respectively. 2.2 Monitoring and evaluation design Three monitoring areas, known as Treatment Monitoring Locations (TMLs, i.e. locations that are subject to fox control) and three Non-Treatment Monitoring Locations (NTMLs, i.e. locations not subject to fox control) (Fig. 1) were used to assess the benefits of fox control. In the TMLs and NTMLs there had been little fox control prior to In order to achieve a broad-scale reduction in foxes across the public land areas, fox control was consolidated in the southern half of the overall project area (Fig. 1). This meant that random allocation of treatment and non-treatment sites was not feasible. The six monitoring locations are: 1. Lower Glenelg National Park south (LGNP-south; TML; 8954 ha) 2. Lower Glenelg National Park north (LGNP-north; NTML; 4659 ha) (separated from 1 by the Glenelg River) 3. Cobboboonee National Park (TML; 9750 ha) 4. Annya State Forest (NTML; 8520 ha) 5. Mount Clay State Forest (TML; 4703 ha) 6. Hotspur State Forest (NTML; 6940 ha). This strategy was designed to enable the identification of any patterns of association between a reduction in foxes and an increase in targeted native species, but does not allow any statistical interpretation of causality (Lande et al. 1994). 9

18 Glenelg Ark 2015 update Figure 1. Glenelg Ark operations area. Tan polygons = treatment monitoring locations; green polygons = non-treatment monitoring Locations; red dots = poison bait stations, orange dots = free feed bait. 2.3 Measuring changes in fox and feral Cat activity In this update, we examined the difference in fox and feral Cat activity between treatment and nontreatment locations from 2013 to 2015 using data generated from camera traps (see section 2.4 for details of when and where camera traps were set). We used the number of independent images (separated by 1 hr) captured per day at each camera site to generate an index of activity for foxes and feral Cats. Fox and feral Cat activity was assessed using a Bayesian non-linear mixed model with treatment set as a fixed effect and year set as random effect in the fox and feral Cat model; the presence of foxes was included in the Cat model as a fixed effect to test the influence foxes might have on Cat activity. The (log)number of cameras that operated on any given day was used as an offset in the model to allow for differing numbers of camera days per sampling period. 2.4 Measuring site occupancy changes in mammal species Site occupancy of the three target-species (Long-nosed Potoroo, Southern Brown Bandicoot and Common Brushtail Possum) was monitored annually at 40 sites established within each TML and NTML (Fig. 2). The positioning of monitoring sites was based on descriptions of the habitat preferred by the target native mammal species (Menkhorst 1995) and stratified according to the proportion of preferred habitat within each TML and NTML. 10
. Initial sampling, prior to the commencement of poison baiting, was conducted in winter 2005.")
19 Glenelg ARK 2015 update Figure 2. Monitoring sites in the treated (tan polygons) and non-treated (green polygons) monitoring locations of Glenelg Ark are indicated by red dots. Monitoring was typically undertaken in spring (2005, ). Initial sampling, prior to the commencement of poison baiting, was conducted in winter In 2006, sampling was undertaken in late winter due to staff resource issues, and the spring 2007 samplings at Mt Clay and Hotspur were delayed due to staff being allocated to planned burning duties; as a result, monitoring was undertaken in summer 2007/2008. From 2005 to 2012 at each monitoring site, nine Handiglaze hair-tubes (Murray 2005) (baited with peanut butter, rolled oats and honey) were set and checked daily for four consecutive days, with tapes being replaced each day. These daily surveys represented four repeat surveys of the monitoring site per sampling period (Fig. 3). In spring 2013 and 2014, a single digital camera (Reconyx RapidFire ProPC90, Reconyx, LLP Wisconsin, USA) was set at one of four possible locations within a hair-tube grid at each monitoring site (Fig. 3). The location of the camera within a monitoring site was determined by a series of coin tosses. Cameras were placed at an equal distance from the nearest hair-tube to reduce the influence of the presence of the lure in the hair-tube. Cameras were attached to the nearest tree at cm above the ground. A lure of truffle oil, peanut butter, rolled oats and honey was secured to the ground in a small, ventilated container 2 m in front of the camera. Cameras were operated for a minimum of 30 days, with each day representing a repeat survey of the monitoring site per sampling period. In 2015, hair-tubes were discontinued, and only cameras were employed as the survey tool. 11

20 Glenelg Ark 2015 update Figure 3. Layout of nine hair-tubes and possible location (A, B, C or D) of the single digital camera at a monitoring site Costs of hair-tube and camera-trap methods The costs of each method were determined based on the number of person-days required to deploy and retrieve either hair-tubes or cameras, including the cost of processing hair-tube tapes or camera images, respectively, prior to analysis, and the cost of analysis of the hairs. Data analysis for determining occupancy estimates was not included because it would have been the same regardless of the method of detection used. Costs were based on staff costs for DELWP regional services field staff Data analysis Long-term site occupancy changes in native mammals To assess the long-term responses of the selected native mammals, we used a multiseason occupancy model to estimate the occupancy (ψ), detection (p), local colonisation (γ) and local survivorship (ε) for monitoring sites within a location from 2005 to 2015 (MacKenzie et al. 2003, 2006). Models were constructed in a Bayesian framework (Kéry 2010), using a space state formulation (Royle and Kéry 2007). Separate models were constructed for each of the three native species of interest. The data for each species was summarised for each monitoring site. Each model allowed for differences in parameters at each of the six locations: Annya, Hotspur and LGNP-north (NTMLs); and Cobboboonee, Mt Clay and LGNPsouth (TMLs). The models also allowed for differences in daily detection rates due to whether a hair-tube or camera was being used for detections in 2013 and Additionally, hair-tube detection of Long-nosed Potoroos and Southern Brown Bandicoots was allowed to differ depending on whether Common Brushtail Possums were detected at the site. [Hair analysis from the tubes indicated that the tapes were being swamped with possum hairs (B. Triggs pers. comm.), and therefore potoroos and bandicoots could have been under-reported.] Hair-tubes and digital cameras To determine which method (hair-tube or digital camera) best estimated occupancy (ψ) rates, we compared the relative detection rates obtained for each of the three species using each method. We also used data from each method and from the combination of methods to assess the difference in the detection rates and in the number of sites occupied between treated and non-treated areas in 2013 and To do this we used single-season occupancy models (Mackenzie et al. 2003, 2006) in a state space formulation in a Bayesian framework. Three separate models were constructed in order to analyse the data: camera trap data, hair-tube data, and combined camera trap and hair-tube data, with fox treatment (i.e. fox control/no fox control) as a factor. Using a combination of detection methods often improves the probability of detecting the species of interest. We compared this best method with the separate hairtube and camera approaches to gain an understanding of the relative merit of each individual approach. Given that a hair-tube had detected the species of interest at some of the sites, this information was used in the determination of the camera detection rate. For example, hair-tubes may have detected sp. A at 10 of the 40 sites; we would then know that if a camera failed to detect sp. A at one of these sites, it was a lack of detection and not a true absence. This information was used to obtain more precise detection estimates 12
21 Glenelg ARK 2015 update for the camera trap technique. When compared with the combined approach, it allowed us to assess whether camera traps were better at detecting sp. A. A similar approach was applied to the data from the combined method compared with the hair-tube-only data. Of particular interest was any difference in detection between hair-tubes or camera traps relative to the combined method, especially with regard to the other two species in the presence of Common Brushtail Possums, because this species tended to dominate hair-tubes. Each time a model was run it produced a mean estimate of occupancy. We ran models for 10,000 iterations and compared the individual mean estimates with the overall mean estimate (or posterior distribution). The proportion of times the average occupancy was higher for fox control sites than for non fox control sites was used to determine whether fox control impacted occupancy rates for a given species. If this proportion was >0.95 or <0.05, it was assumed to be strong evidence that fox control did or did not influence occupancy, respectively. The models were constructed in JAGS (Plummer 2003) via R (R Development Core Team 2016), using the package R2jags (Su and Yajima 2012). Model chains were run until the chains converged. Convergence was defined as when all Gelman and Rubin s convergence diagnostic potential scale reduction factors were <1.05 (Gelman et al. 2004). Depending on the distribution of the species, some parameters (e.g. occupancy, colonisation or extinction) may have been poorly estimated. For example, if very few sites within an area were occupied, then the estimate of occupancy for the following year would be uncertain because the probability of the true number of sites occupied could be low or very high. Inferences derived from these models were based on changes in occupancy at a site level (i.e. at the sites where hair-tubes or cameras were located), rather than at the broader landscape level (e.g. differences between Cobboboonee National Park and Hotspur State Forest). 13
22 Glenelg Ark 2015 update 3 Results 3.1 Rainfall Mean annual rainfall (recorded at the Portland Airport, ~20 km from the project area centre) differed substantially from the long-term average in a number of years over the period (Fig. 4). The years saw consistently below-average rainfall. The year 2006 saw the largest departure from the long-term annual mean, with a 37% reduction. In the 10 years since the project began in 2005, there have been 7 years with below-average rainfall. Figure 4. Difference in mean annual rainfall (%) from the long-term ( ) average for 1980 to Data from the rainfall station at Portland Airport. 3.2 Fox and feral Cat activity Fox activity Fox activity was significantly lower at locations with fox control compared with locations with no fox control (Fig. 5). There was no difference in fox activity between years for fox control locations; similarly, there was no difference in fox activity between years for no fox control locations (Appendix 1). 14
23 Glenelg ARK 2015 update Figure 5. Fox activity (number of images per day at each camera site) at treatment monitoring locations (TMLs) and nontreatment monitoring locations (NTMLs). Bars are 95% credible intervals Feral Cat activity There was no significant difference in feral Cat activity between treatment and non-treatment monitoring locations (Fig. 6), or between years (Appendix 1). Feral Cat activity was very low across the TMLs and NTMLs. Figure 6. Feral Cat activity (number of images per day at each camera location) across treatment type (TML = fox control, NTML = no fox control) as measured by digital cameras. Bars are 95% credible intervals. 3.3 Transitioning from hair-tubes to camera traps Detection rates Common Brushtail Possums The combination of hair-tubes and cameras was generally better at detecting possums, with 178 site detections at 41.8% of sites over the 2 years (Table 1). Common Brushtail Possums were detected at all locations in both 2013 and At 83 sites (19.4%), only one method detected possums (61 camera-only detections and 22 hair-tube-only detections). 15
24 Glenelg Ark 2015 update Table 1. The number of monitoring sites at which Common Brushtail Possums were detected at each location, the method(s) used to detect them and the naïve occupancy rate. Both = combination of hair-tube and camera methods. Location Year Both methods Camera Hair-tube only Neither Total Naïve occupancy rates Annya Cobboboonee Hotspur Mt Clay LGNP-north LGNP-south Annya Cobboboonee Hotspur Mt Clay LGNP-north LGNP-south Total Cumulative detection rates (for 9 hair-tubes over 4 days and 1 camera over 30 days) for Common Brushtail Possums varied between locations for both types of device (Fig. 7a and 7b), but were consistently higher when using cameras. Figure 7. Cumulative detection rates [using hair-tubes (a), or cameras (b)] for Common Brushtail Possums at the six monitoring locations in Glenelg Ark. (a) (b) 16
25 Glenelg ARK 2015 update Long-nosed Potoroos Cameras were the best method for detecting Long-nosed Potoroos, with detections at 29 sites (6.8% of sites over the 2 years). Long-nosed Potoroos were detected at all locations, but at limited sites within each location (Table 2). At 36 (84.4%) sites, only one method detected Long-nosed Potoroos (29 camera-only detections and 7 hair-tube-only detections). Interestingly, 3 of the 6 locations in 2013 (Hotspur and both LGNP locations) and 5 locations in 2014 had no sites at which both methods detected Long-nosed Potoroos. Of those locations (Hotspur in 2013 and 2014, and Mt Clay and LGNP-north in 2014) had no hair-tube detections, even though Long-nosed Potoroos were known to be present (via the camera data at one site). Table 2. The number of sites at which Long-nosed Potoroos were detected at each location, the method(s) used to detect them and the naïve occupancy rate. Both = combination of hair-tube and camera methods. Location Year Both Camera only Hair-tube only Neither Total Naïve occupancy rates Annya Cobboboonee Hotspur Mt Clay LGNP-north LGNP-south Annya Cobboboonee Hotspur Mt Clay LGNP-north LGNP-south Total Cumulative hair-tube detection rates for Long-nosed Potoroos varied between locations and according to the presence/absence of Common Brushtail Possums (Fig. 8a; Table 3). There was strong evidence that at LGNP-north and LGNP-south, detection rates for Long-nosed Potoroos were reduced when Common Brushtail Possums were present. However, there was strong evidence that at Mt Clay Long-nosed Potoroo detection rates increased when Common Brushtail Possums were detected. Cumulative camera-trap detection rates for Long-nosed Potoroos varied between locations but were all uniformly high (above 0.9). Cobboboonee and Mt Clay had higher detection rates than the other locations (Fig. 8b). 17
26 Glenelg Ark 2015 update (a) (b) Figure 8. Cumulative detection rates [using hair-tubes (a), or cameras (b)] for Long-nosed Potoroos at the six monitoring locations in the Glenelg Ark area. Blue = no possums present; red = possums present. Table 3. Differences in hair-tube detection rates for Long-nosed Potoroos at sites with possums detected and sites without possums detected. Green shading highlights where there was substantial evidence that the detection probabilities were larger for Long-nosed Potoroos when Common Brushtail Possums were detected. Blue shading highlights where there was substantial evidence that the detection probabilities were smaller for Long-nosed Potoroos when Common Brushtail Possums were detected. HDI=Highest Density Interval (similar to the credible interval in frequentists statistics). Location Median Lower 95% HDI Upper 95% HDI Annya Hotspur LGNP North Cobboboonee Mt Clay LGNP South
27 Glenelg ARK 2015 update Southern Brown Bandicoots Cameras were the best method for detecting Southern Brown Bandicoots, with detections at 39 camera only sites (9.15%) and eight combined sites. Southern Brown Bandicoots were detected at all locations, but at limited sites within each location (Table 4). At 44 sites (10.4%), only one method detected this species (39 camera-only detections and 5 hair-tube-only detections). Interestingly, four of the six locations in 2013 (Cobboboonee, Mt Clay and both LGNP areas) had no site at which both methods detected Southern Brown Bandicoots. Two of those areas (Cobboboonee and Mt Clay) had no hair-tube detections, even though Southern Brown Bandicoots were known to be present (via the camera data) at seven sites across the two areas combined. Conversely, one of those areas (LGNP-north) had no camera detections, even though Southern Brown Bandicoots were known to be present (via the hair-tubes at one site). In 2014, three locations (Hotspur, Mt Clay and LGNP-south) had no site at which both methods detected Southern Brown Bandicoots, even though they were known to be present via camera traps. Bandicoots were not detected by any method or combination of methods at LGNP-north in Table 4. The number of sites at which Southern Brown Bandicoots were detected at each location, the method(s) used to detect them and the naïve occupancy rate. Both = combination of hair-tube and camera methods. Location Year Both Camera only Hair-tube only Neither Total Naïve occupancy rates Annya Cobboboonee Hotspur Mt Clay LGNP-north LGNP-south Annya Cobboboonee Hotspur Mt Clay LGNP-north LGNP-south Total Cumulative hair-tube detection rates for Southern Brown Bandicoots varied between some locations and according to the presence/absence of Common Brushtail Possums (Table 5 and Fig. 9a). There was strong evidence that at Hotspur, Mt Clay and LGNP-south, detection rates were reduced when Common Brushtail Possums were present. LGNP-north had a similar result, but without enough evidence to be convincing. Cumulative camera-trap detection rates for Southern Brown Bandicoots varied between locations. Annya had higher detection rates than the other locations, whereas LGNP-north was lower than the other locations (Fig. 9b). 19
28 Glenelg Ark 2015 update Table 5. Differences in hair-tube detection rates for Southern Brown Bandicoots at sites with possums detected and sites without possums detected. Blue shading highlights where there was substantial evidence that the detection probabilities were smaller when Common Brushtail Possums were detected. HDI=Highest Density Interval (similar to the credible interval in frequentists statistics). Location Median Lower 95% HDI Upper 95% HDI Annya Hotspur LGNP North Cobboboonee Mt Clay LGNP South Figure 9. Cumulative detection rates [using hair-tubes (a), or cameras (b)] for Southern Brown Bandicoots at the six monitoring locations in the Glenelg Ark area. Blue = no possums present; red = possums present. (a) (b) Sites occupied in Common Brushtail Possums Overall, the combined camera and hair-tube model and the camera only model tended to provide higher and less variable estimates of occupancy. In 2013, the number of sites occupied by Common Brushtail Possums as estimated from the camera-only model were generally similar to the estimates obtained from the combined camera and hair-tube data, while results from the hair-tube model were generally lower. The exceptions to this were at Hotspur where the combined model estimate was higher than the camera only model (Fig. 10a). Estimates of site occupancy were higher based on all three model outputs at Cobobboonee and LGNP-south compared to Annya and Hotspur. The model estimates for locations combined indicated that at no fox control locations the combined estimate was best, with camera only estimates higher than hair-tube only estimates. At fox control sites, there was no difference between camera only and the camera and hair-tube combined model estimates, while hair-tube only estimates were significantly lower. 20
29 Glenelg ARK 2015 update In 2014, across individual locations there was no significant difference between camera and hair-tube, and combined camera and hair-tube model estimates, with the exception of LGNP-north where camera model estimates were higher and Hotspur where the combined estimate was higher. When locations are combined, there was no difference between camera and hair-tube model estimates at no fox control sites, while the combined model approach provided significantly higher estimates of occupancy. At fox control locations, the same pattern was evident but the differences were not significant (Fig. 10b). (a) (b) Figure 10. Estimated number of sites occupied by Common Brushtail Possums in 2013 (a) and 2014 (b): hair-tube data only (squares), camera-trap data only (triangles) or both combined (circles). Results sorted by location; no fox control = red; fox control = blue. Symbols represent the mean value, and bars represent the 95% density interval. Long-nosed Potoroos Overall there was little difference in occupancy estimates across all models in both years. In 2013, low levels of detection at Annya resulted in very large density estimates. At Mt Clay the camera only and the combined camera and hair-tube estimates were higher than for the hair-tube only model. There was some evidence that the Long-nosed Potoroo occupancy rate was higher overall at TMLs [camera only data , 95% density interval (CI) 0.09, 0.22] compared with at NTMLs (camera only data , 95% CI 0.27, 0.117) (Fig. 11a). In 2014, camera only and combined camera and hair-tube model estimates were higher at LGNP-north, Mt Clay and LGNP-south than hair-tube only estimates. There was a significant effect from method on the estimated number of overall sites occupied in 2014 when comparing no fox control locations and fox control locations based on the camera only and combined camera and hair-tube only data. 21
30 Glenelg Ark 2015 update (a) (b) Figure 11. Number of sites occupied by Long-nosed Potoroos in 2013 (a) and 2014 (b) using either hair-tube data only (squares), camera-trap data only (triangles) or both combined (circles). Results sorted by location; no fox control = red; fox control = blue. Symbols represent mean values, while bars represent the 95% density intervals. Southern Brown Bandicoots Overall there was little difference in occupancy estimates across all models in both years. In 2013, low levels of detection at LGNP-north, on both hair-tubes and cameras, at Cobboboonee, Mt Clay and LGNPsouth on hair-tubes resulted in very large density estimates (Fig 11a). At Annya and Hotspur the camera only and the combined camera and hair-tube estimates were higher than for the hair-tube only model. In 2013 there was some evidence from the combined model that the Southern Brown Bandicoot occupancy rate was lower overall at TMLs compared with at NTMLs but that this had reversed in 2014 (Fig. 11b). In 2014 there was little difference in occupancy across all models (Fig 11b). Overall there was no detectable difference between the three methods in either 2013 or 2014, in part due to large density intervals for the hair-tube only data and at some locations camera only data which resulted from low levels of detection. In 2013, camera only and combined camera and hair-tube model estimates were higher only for Annya. (a) (b) Figure 12. Number of sites occupied by Southern Brown Bandicoots in 2013 (a) and 2014 (b) using either hair-tube data only (squares), camera-trap data only (triangles) or both combined (circles). Results sorted by location; no fox control = red; fox control = blue. Symbols represent mean values, while bars represent the 95% density intervals. 22
Marc Widmer successfully defends WA from European wasp. and the environment. Susan Campbell. Supporting your success
 Marc Widmer successfully defends WA Rabbits: from European wasp destructive attack. pests of agriculture and the environment. Supporting your success Susan Campbell 70 years A brief history 1859 successful
SWIFFT Video conference notes 19 April 2012 Introduced Predators (Red Fox and Feral Cat)
") SWIFFT Video conference notes 19 April 2012 Introduced Predators (Red Fox and Feral Cat) SWIFFT meeting notes are a summary of the video conference and not intended to be a definitive record of presentations
SWIFFT Video conference notes 19 April 2012 Introduced Predators (Red Fox and Feral Cat) SWIFFT meeting notes are a summary of the video conference and not intended to be a definitive record of presentations
Reintroducing bettongs to the ACT: issues relating to genetic diversity and population dynamics The guest speaker at NPA s November meeting was April
 Reintroducing bettongs to the ACT: issues relating to genetic diversity and population dynamics The guest speaker at NPA s November meeting was April Suen, holder of NPA s 2015 scholarship for honours
Amrun Project Feral Animal Monitoring Annual Report August 2017
 Amrun Project Feral Animal Monitoring Annual Report August 2017 A report prepared in accordance with requirements of the Amrun Project EPBC Act Approval 2010/5642, Terrestrial Management Plan, Construction
University of Canberra. This thesis is available in print format from the University of Canberra Library.
 University of Canberra This thesis is available in print format from the University of Canberra Library. If you are the author of this thesis and wish to have the whole thesis loaded here, please contact
FINAL Preliminary Report for CSP Project New Zealand sea lion monitoring at the Auckland Islands 2017/18
 FINAL Preliminary Report for CSP Project New Zealand sea lion monitoring at the Auckland Islands 2017/18 BPM-18-FINAL-Preliminary Report for CSP Project NZSL Auckland Island monitoring 2017-18 v1.1 26/01/2018
Table of Threatened Animals in Amazing Animals in Australia s National Parks and Their Traffic-light Conservation Status
 Table of Threatened Animals in Amazing Animals in Australia s National Parks and Their Traffic-light Conservation Status Note: Traffic-light conservation status for the book was determined using a combination
Wild dog management 2010 to
 Wild dog management 2010 to 2014 National landholder survey results Bill Binks, Robert Kancans & Nyree Stenekes Research by the Australian Bureau of Agricultural and Resource Economics and Sciences Report
Feral Rabbit Management Plan. June 2010
 Introduction Feral rabbits have been a part of the University of Victoria campus for many years. These rabbits are abandoned pets, originally purchased at local pet stores, or descendants of non-sterilized
Hawke s Bay Regional Predator Control Technical Protocol (PN 4970)
") Hawke s Bay Regional Predator Control Technical Protocol (PN 4970) This Regional Predator Control Protocol sets out areas that are Predator Control Areas and the required monitoring threshold to meet the
Hawke s Bay Regional Predator Control Technical Protocol (PN 4970) This Regional Predator Control Protocol sets out areas that are Predator Control Areas and the required monitoring threshold to meet the
AUGUST 2016 Ashford Park Quarry Pest Plant and Animal Control Plan
 AUGUST 2016 Ashford Park Quarry Pest Plant and Animal Control Plan This Pest Plant and Animal Control Plan has been developed for the Ashford Park Quarry, Otaki as required by Conditions 43 and 44 of the
Record of Predation by Sugar Glider on Breeding Eastern Rosellas 33Km NE of Melbourne in November 2016
 Record of Predation by Sugar Glider on Breeding Eastern Rosellas 33Km NE of Melbourne in November 2016 By Frank Pierce [email - jmandfp@bigpond.com.au ] 18/01/2016 SUMMARY Eastern Rosellas nested in a
Development of the New Zealand strategy for local eradication of tuberculosis from wildlife and livestock
 Livingstone et al. New Zealand Veterinary Journal http://dx.doi.org/*** S1 Development of the New Zealand strategy for local eradication of tuberculosis from wildlife and livestock PG Livingstone* 1, N
Naturalised Goose 2000
 Naturalised Goose 2000 Title Naturalised Goose 2000 Description and Summary of Results The Canada Goose Branta canadensis was first introduced into Britain to the waterfowl collection of Charles II in
Predator-prey interactions in the spinifex grasslands of central Australia
 University of Wollongong Research Online University of Wollongong Thesis Collection 1954-2016 University of Wollongong Thesis Collections 2005 Predator-prey interactions in the spinifex grasslands of central
rodent species in Australia to the fecal odor of various predators. Rattus fuscipes (bush
 Sample paper critique #2 The article by Hayes, Nahrung and Wilson 1 investigates the response of three rodent species in Australia to the fecal odor of various predators. Rattus fuscipes (bush rat), Uromys
Effectiveness of feral cat control using paraaminopropiophenone. Hawke's Bay
 Effectiveness of feral cat control using paraaminopropiophenone (PAPP) on Toronui Station, Hawke's Bay Effectiveness of feral cat control using para-aminopropiophenone (PAPP) on Toronui Station, Hawke's
Guide to Preparation of a Site Master File for Breeder/Supplier/Users under Scientific Animal Protection Legislation
 Guide to Preparation of a Site Master File for Breeder/Supplier/Users under Scientific Animal Protection AUT-G0099-5 21 DECEMBER 2016 This guide does not purport to be an interpretation of law and/or regulations
Gambel s Quail Callipepla gambelii
 Photo by Amy Leist Habitat Use Profile Habitats Used in Nevada Mesquite-Acacia Mojave Lowland Riparian Springs Agriculture Key Habitat Parameters Plant Composition Mesquite, acacia, salt cedar, willow,
FIVE RIVERS RESERVE. ENVIRONMENTAL ACCOUNT and Planning
 FIVE RIVERS RESERVE Dr Sally Bryant Head of Science ENVIRONMENTAL ACCOUNT and Planning TLC 2016 1 FIVE RIVERS RESERVE Size 11,113 ha World Heritage listed 10 National, 21 State threatened species and
The Friends of Nachusa Grasslands 2016 Scientific Research Project Grant Report Due June 30, 2017
 The Friends of Nachusa Grasslands 2016 Scientific Research Project Grant Report Due June 30, 2017 Name: Laura Adamovicz Address: 2001 S Lincoln Ave, Urbana, IL 61802 Phone: 217-333-8056 2016 grant amount:
INFORMATION SHEET PROTECTION OF BLACK-COCKATOO HABITAT
 INFORMATION SHEET PROTECTION OF BLACK-COCKATOO HABITAT There are three species of black cockatoo in Western Australia: Red tailed black cockatoo; Carnaby s black cockatoo, and Baudin s black cockatoo.
Wallaby surveillance Detecting small cryptic nocturnal neophobic macropods at low densities
 Wallaby surveillance Detecting small cryptic nocturnal neophobic macropods at low densities Dale Williams, Bay of Plenty Regional Council Phillip Commins 54 Rocky Cutting Road RD5 Tauranga Dama Wallaby
Bushwalking, bokno, cats and cameras
 Bushwalking, bokno, cats and cameras Collaborative work of the Warddeken rangers and Northern Territory Government in the Manmoyi and Kamarrkawan Areas 2012/2013 Who was there Rangers and traditional owners
Marsupial Mole. Notoryctes species. Amy Mutton Zoologist Species and Communities Branch Science and Conservation Division
 Marsupial Mole Notoryctes species Amy Mutton Zoologist Species and Communities Branch Science and Conservation Division Scientific classification Kingdom: Phylum: Class: Infraclass: Order: Family: Animalia
GUIDELINES ON CHOOSING THE CORRECT ERADICATION TECHNIQUE
 GUIDELINES ON CHOOSING THE CORRECT ERADICATION TECHNIQUE PURPOSE... 2 1. RODENTS... 2 1.1 METHOD PROS AND CONS... 3 1.1. COMPARISON BETWEEN BROUDIFACOUM AND DIPHACINONE... 4 1.2. DISCUSSION ON OTHER POSSIBLE
Evaluation of large-scale baiting programs more surprises from Central West Queensland
 Issue 6 February 2000 Department of Natural Resources Issue 15 September 2006 Department of Natural Resources and Water QNRM006261 A co-operative A co-operative project project between between producers
Koala Monitoring Program
 Koala Monitoring Program Yarrabilba Priority Development Area Koala Capture / Monitoring Event October 2017 Summary Report Female 13486 (Jean) with her back young Prepared by: Koala Ecology Group University
Y Use of adaptive management to mitigate risk of predation for woodland caribou in north-central British Columbia
 Y093065 - Use of adaptive management to mitigate risk of predation for woodland caribou in north-central British Columbia Purpose and Management Implications Our goal was to implement a 3-year, adaptive
6/21/2011. EcoFire Update. Research into its effectiveness for biodiversity. AWC in northern Australia
 EcoFire Update Research into its effectiveness for biodiversity AWC in northern Australia 1 Extensive, frequent fires damage biodiversity: Simplifies the structure and species composition of woodlands
GUIDELINES FOR APPROPRIATE USES OF RED LIST DATA
 GUIDELINES FOR APPROPRIATE USES OF RED LIST DATA The IUCN Red List of Threatened Species is the world s most comprehensive data resource on the status of species, containing information and status assessments
Mexican Gray Wolf Reintroduction
 Mexican Gray Wolf Reintroduction New Mexico Supercomputing Challenge Final Report April 2, 2014 Team Number 24 Centennial High School Team Members: Andrew Phillips Teacher: Ms. Hagaman Project Mentor:
SEDAR31-DW30: Shrimp Fishery Bycatch Estimates for Gulf of Mexico Red Snapper, Brian Linton SEDAR-PW6-RD17. 1 May 2014
 SEDAR31-DW30: Shrimp Fishery Bycatch Estimates for Gulf of Mexico Red Snapper, 1972-2011 Brian Linton SEDAR-PW6-RD17 1 May 2014 Shrimp Fishery Bycatch Estimates for Gulf of Mexico Red Snapper, 1972-2011
Subdomain Entry Vocabulary Modules Evaluation
 Subdomain Entry Vocabulary Modules Evaluation Technical Report Vivien Petras August 11, 2000 Abstract: Subdomain entry vocabulary modules represent a way to provide a more specialized retrieval vocabulary
Draft ESVAC Vision and Strategy
 1 2 3 7 April 2016 EMA/326299/2015 Veterinary Medicines Division 4 5 6 Draft Agreed by the ESVAC network 29 March 2016 Adopted by ESVAC 31 March 2016 Start of public consultation 7 April 2016 End of consultation
Acute Toxicity of Sodium Monofluoroacetate (1080) Baits to Feral Cats
 Baits to Feral Cats") Wildl. Res., 1991, 18, 445-9 Acute Toxicity of Sodium Monofluoroacetate (1080) Baits to Feral Cats C. T. Eason and C. M. Frampton Forest Research Institute, P.O. Box 31-011, Christchurch, New Zealand.
Wildl. Res., 1991, 18, 445-9 Acute Toxicity of Sodium Monofluoroacetate (1080) Baits to Feral Cats C. T. Eason and C. M. Frampton Forest Research Institute, P.O. Box 31-011, Christchurch, New Zealand.
A economic justification for government intervention in the control of wild dogs and primary instrument selection
 A economic justification for government intervention in the control of wild dogs and primary instrument selection Service Design Research Working Paper 01-12 Geoff Kaine and Ruth Lourey March 2012 i Authors:
Australian and New Zealand College of Veterinary Scientists. Membership Examination. Veterinary Epidemiology Paper 1
 Australian and New Zealand College of Veterinary Scientists Membership Examination June 2015 Veterinary Epidemiology Paper 1 Perusal time: Fifteen (15) minutes Time allowed: Two (2) hours after perusal
How do dogs make trouble for wildlife in the Andes?
 How do dogs make trouble for wildlife in the Andes? Authors: Galo Zapata-Ríos and Lyn C. Branch Associate editors: Gogi Kalka and Madeleine Corcoran Abstract What do pets and wild animals have in common?
Developing a community-based feral cat control program for Kangaroo Island.
 Developing a community-based feral cat control program for Kangaroo Island. David C. Paton, Dept of Environmental Biology, University of Adelaide, Adelaide SA 5005 Introduction Various methods have been
European Red List of Habitats
 European Red List of Habitats A Red List assessment of all terrestrial, freshwater and benthic marine habitats in the EU28, EU28+ and neighbouring seas European Red List of Habitats A project funded by
Regulating the scientific use of animals taken from the wild Implementation of Directive 2010/63/EU
 Regulating the scientific use of animals taken from the wild Implementation of Directive 2010/63/EU Dr Kim Willoughby, Mr Peter Gray, Dr Kate Garrod. Presented by: Dr Kim Willoughby Date: 26 October 2017
Feral Animals in Australia. An environmental education and sustainability resource kit for educators
 An environmental education and sustainability resource kit for educators Use this presentation with: www.rabbitscan.net.au associated rabbitscan teaching resources the RabbitScan May 2009 Field Excursion
GROWTH OF LAMBS IN A SEMI-ARID REGION AS INFLUENCED BY DISTANCE WALKED TO WATER
 GROWTH OF LAMBS IN A SEMI-ARID REGION AS INFLUENCED BY DISTANCE WALKED TO WATER V. R. SQUIRES* Summary A feature of pastoral zone grazing systems is the long distances which separate the grazing area from
Title of Project: Distribution of the Collared Lizard, Crotophytus collaris, in the Arkansas River Valley and Ouachita Mountains
 Title of Project: Distribution of the Collared Lizard, Crotophytus collaris, in the Arkansas River Valley and Ouachita Mountains Project Summary: This project will seek to monitor the status of Collared
Internship Report: Raptor Conservation in Bulgaria
 Internship Report: Raptor Conservation in Bulgaria All photos credited Natasha Peters, David Izquierdo, or Vladimir Dobrev reintroduction programme in Bulgaria Life History Size: 47-55 cm / 105-129 cm
Victorian Bushfires. February 7, 2009
 Victorian Bushfires. February 7, 2009 Chris Heislers Veterinarian The Veterinary Surgery Yarrambat & North Warrandyte. Constraints to the animal welfare response. Council Media How do horses generally
Recommendations of the Greyhound Reform Panel
 Recommendations of the Greyhound Reform Panel Response from the Australian Veterinary Association Ltd www.ava.com.au The Australian Veterinary Association Limited Recommendations of the Greyhound Reform
WOOL DESK REPORT MAY 2007
 Issue no. 008 ISSN: 1449-2652 WOOL DESK REPORT MAY 2007 FLOCK DEMOGRAPHICS AND PRODUCER INTENTIONS RESULTS OF A NATIONAL SURVEY CONDUCTED IN FEBRUARY 2007 KIMBAL CURTIS Department of Agriculture and Food,
Lizard Surveying and Monitoring in Biodiversity Sanctuaries
 Lizard Surveying and Monitoring in Biodiversity Sanctuaries Trent Bell (EcoGecko Consultants) Alison Pickett (DOC North Island Skink Recovery Group) First things first I am profoundly deaf I have a Deaf
FREE RANGE EGG & POULTRY AUSTRALIA LTD
 FREE RANGE EGG & POULTRY AUSTRALIA LTD ABN: 83 102 735 651 7 March 2018 Animal Welfare Standards Public Consultation PO Box 5116 Braddon ACT 2612 BY EMAIL: publicconspoultry@animalhealthaustralia.com.au
Creating Strategic Capital for EVM. EVA th June 2012 Andrew Hill PROJECT CONTROLS CONSULTING
 Creating Strategic Capital for EVM Responsible for the successful delivery of projects for our clients EVA 17 13 th June 2012 Andrew Hill Strategic Capital What is strategy? Analytical thinking & commitment
Great Horned Owl (Bubo virginianus) Productivity and Home Range Characteristics in a Shortgrass Prairie. Rosemary A. Frank and R.
 Productivity and Home Range Characteristics in a Shortgrass Prairie. Rosemary A. Frank and R.") Great Horned Owl (Bubo virginianus) Productivity and Home Range Characteristics in a Shortgrass Prairie Rosemary A. Frank and R. Scott Lutz 1 Abstract. We studied movements and breeding success of resident
Great Horned Owl (Bubo virginianus) Productivity and Home Range Characteristics in a Shortgrass Prairie Rosemary A. Frank and R. Scott Lutz 1 Abstract. We studied movements and breeding success of resident
Turtle Watch: Enhancing Science Engagement
 Turtle Watch: Enhancing Science Engagement Elaine Lewis, Louise Nielsen, Jennifer Pearson and Catherine Baudains Introduction Engaging students in authentic science settings and real-life contexts is viewed
Assessment of Public Submissions regarding Dingo Management on Fraser Island
 Assessment of Public Submissions regarding Dingo Management on Fraser Island Supplement 2 to Audit (2009) of Fraser Island Dingo Management Strategy for The Honourable Kate Jones MP Minister for Climate
GNARALOO FERAL ANIMAL CONTROL PROGRAM
 GNARALOO FERAL ANIMAL CONTROL PROGRAM Report for sea turtle nesting season 2012/13 30 June 2013 Mike Butcher Animal Pest Management Services (08) 9726 2537 enquires@animalpest.com.au www.animalpest.com.au
Required and Recommended Supporting Information for IUCN Red List Assessments
 Required and Recommended Supporting Information for IUCN Red List Assessments This is Annex 1 of the Rules of Procedure for IUCN Red List Assessments 2017 2020 as approved by the IUCN SSC Steering Committee
A final programmatic report to: SAVE THE TIGER FUND. Scent Dog Monitoring of Amur Tigers-V ( ) March 1, March 1, 2006
 March 1, March 1, 2006") 1 A final programmatic report to: SAVE THE TIGER FUND Scent Dog Monitoring of Amur Tigers-V (2005-0013-017) March 1, 2005 - March 1, 2006 Linda Kerley and Galina Salkina PROJECT SUMMARY We used scent-matching
1 A final programmatic report to: SAVE THE TIGER FUND Scent Dog Monitoring of Amur Tigers-V (2005-0013-017) March 1, 2005 - March 1, 2006 Linda Kerley and Galina Salkina PROJECT SUMMARY We used scent-matching
FALL 2015 BLACK-FOOTED FERRET SURVEY LOGAN COUNTY, KANSAS DAN MULHERN; U.S. FISH AND WILDLIFE SERVICE
 INTRODUCTION FALL 2015 BLACK-FOOTED FERRET SURVEY LOGAN COUNTY, KANSAS DAN MULHERN; U.S. FISH AND WILDLIFE SERVICE As part of ongoing efforts to monitor the status of reintroduced endangered black-footed
Our ref: Your ref: PPL - D. Clendon. Date: 1/10/2015. From: Technical Advisor Ecology - J. Marshall. Waitaha Hydro - Lizards
 Internal Correspondence To: PPL - D. Clendon Our ref: Your ref: Date: 1/10/2015 From: Technical Advisor Ecology - J. Marshall Subject: Waitaha Hydro - Lizards Summary The applicant has employed a respected
CHAPTER 4: OAHU ELEPAIO
 CHAPTER 4: OAHU ELEPAIO 4.1 OIP ELEPAIO MANAGEMENT 2012 4.1.1 Background In 2000, the U.S. Fish and Wildlife Service (USFWS) granted the (Chasiempis ibidis) endangered species status under the federal
Optimizing Antimicrobial Stewardship Activities Based on Institutional Resources
 Optimizing Antimicrobial Stewardship Activities Based on Institutional Resources Andrew Hunter, PharmD, BCPS Infectious Diseases Clinical Pharmacy Specialist Michael E. DeBakey VA Medical Center Andrew.hunter@va.gov
Texas Quail Index. Result Demonstration Report 2016
 Texas Quail Index Result Demonstration Report 2016 Cooperators: Jerry Coplen, County Extension Agent for Knox County Amanda Gobeli, Extension Associate Dr. Dale Rollins, Statewide Coordinator Circle Bar
National Unit Specification: general information. UNIT Animal Care: Breeding (SCQF level 5) CODE F6SS 11 SUMMARY OUTCOMES RECOMMENDED ENTRY
 CODE F6SS 11 SUMMARY OUTCOMES RECOMMENDED ENTRY") National Unit Specification: general information CODE F6SS 11 SUMMARY The candidate will acquire and apply knowledge of the breeding of small animals. The Unit is aimed at those who wish to develop skills
National Unit Specification: general information CODE F6SS 11 SUMMARY The candidate will acquire and apply knowledge of the breeding of small animals. The Unit is aimed at those who wish to develop skills
Position Description PD895 v3.1
 Puppy Development Team Leader Position Level Team Leader Department GDS Location South Australia Direct/Indirect Reports Casual Breeding Centre Attendants Puppy Development Centre Volunteers Direct Reports
For more information, see The InCalf Book, Chapter 8: Calf and heifer management and your InCalf Fertility Focus report.
 What is this tool? This is a gap calculator tool. It assesses the growth of a given group of heifers versus liveweight-for-age targets and its impact on reproductive performance and milksolids production.
Spatial Heterogeneity in Population Trends of Waterfowl Breeding on the Arctic Coastal Plain, Alaska
 Spatial Heterogeneity in Population Trends of Waterfowl Breeding on the Arctic Coastal Plain, Alaska Courtney L. Amundson and Paul L. Flint, Robert Stehn, Robert Platte, Heather Wilson, and Julian Fischer
Geoffroy s Cat: Biodiversity Research Project
 Geoffroy s Cat: Biodiversity Research Project Viet Nguyen Conservation Biology BES 485 Geoffroy s Cat Geoffroy s Cat (Leopardus geoffroyi) are small, little known spotted wild cat found native to the central
American Association of Equine Practitioners White Paper on Telehealth July 2018
 American Association of Equine Practitioners White Paper on Telehealth July 2018 Introduction Telehealth, by definition, encompasses all uses of technology designed to remotely deliver health information
PROJECT SUMMARY. Optimising genetics, reproduction and nutrition of dairy sheep and goats
 PROJECT SUMMARY Optimising genetics, reproduction and nutrition of dairy sheep and goats Introduction The Australian dairy sheep industry currently has six well established businesses, all of which are
of Conferences of OIE Regional Commissions organised since 1 June 2013 endorsed by the Assembly of the OIE on 29 May 2014
 of Conferences of OIE Regional Commissions organised since 1 June 2013 endorsed by the Assembly of the OIE on 29 May 2014 2 12 th Conference of the OIE Regional Commission for the Middle East Amman (Jordan),
PIGEON MAGNET INSTRUCTION MANUAL
 THE PIGEON MAGNET INSTRUCTION MANUAL Version 1. November 2012 Code 07-Trap10 Product Pigeon Magnet Trap Optional Accessories (sold separately): 07-trap9c Pigeon Magnet Storage Bag 07-trap9f Pigeon Magnet
Dingoes can help conserve wildlife and our methods can tell
 Journal of Applied Ecology 2015 doi: 10.1111/1365-2664.12369 FORUM Dingoes can help conserve wildlife and our methods can tell Dale G. Nimmo 1 *, Simon J. Watson 2, David M. Forsyth 3 and Corey J. A. Bradshaw
Responses of the native skink Leiolopisma maccanni to two pest control baits
 Responses of the native skink Leiolopisma maccanni to two pest control baits A. B. Freeman, G. J. Hickling and C. A. Bannock Department of Entomology and Animal Ecology PO Box 84 Lincoln University Canterbury
James Q. Radford. Wildlife Research
 CSIRO PUBLISHING Wildlife Research https://doi.org/10.1071/wr18008 Degrees of population-level susceptibility of Australian terrestrial non-volant mammal species to predation by the introduced red fox
Benefit Cost Analysis of AWI s Wild Dog Investment
 Report to Australian Wool Innovation Benefit Cost Analysis of AWI s Wild Dog Investment Contents BACKGROUND 1 INVESTMENT 1 NATURE OF BENEFITS 2 1 Reduced Losses 2 2 Investment by Other Agencies 3 QUANTIFYING
Trophic Responses to Lethal Control of Placental Predators in Australia: Proceedings of an Expert Workshop, Sydney, 19 th October 2012.
 Trophic Responses to Lethal Control of Placental Predators in Australia: Proceedings of an Expert Workshop, Sydney, 19 th October 2012. Guy Ballard and Peter J.S. Fleming (Eds) April 2013 1 Expert Workshop
UNIT Animal Care: An Introduction to Dog Grooming (SCQF level 5)
") National Unit Specification: general information CODE F6SX 11 SUMMARY The Unit is suitable for candidates who are interested in the care and grooming of dogs. It provides candidates with the knowledge
National Unit Specification: general information CODE F6SX 11 SUMMARY The Unit is suitable for candidates who are interested in the care and grooming of dogs. It provides candidates with the knowledge
AN ORDINANCE TO AMEND CHAPTER 78, ANIMALS WITHIN THE TOWNSHIP OF BLOOMFIELD, ESSEX COUNTY, NEW JERSEY:
 AN ORDINANCE TO AMEND CHAPTER 78, ANIMALS WITHIN THE TOWNSHIP OF BLOOMFIELD, ESSEX COUNTY, NEW JERSEY: BE IT ORDAINED, by the Board of Health of the Township of Bloomfield, County of Essex, State of New
PROGRESS REPORT for COOPERATIVE BOBCAT RESEARCH PROJECT. Period Covered: 1 April 30 June Prepared by
 PROGRESS REPORT for COOPERATIVE BOBCAT RESEARCH PROJECT Period Covered: 1 April 30 June 2014 Prepared by John A. Litvaitis, Tyler Mahard, Rory Carroll, and Marian K. Litvaitis Department of Natural Resources
Population dynamics and spatial ecology of a declining desert rodent, Pseudomys australis: the importance of refuges for persistence
 Journal of Mammalogy, 95(3):615 625, 2014 Population dynamics and spatial ecology of a declining desert rodent, Pseudomys australis: the importance of refuges for persistence CHRIS R. PAVEY,* JEFF R. COLE,
Animal Liberation Queensland Submission on Australian Animal Welfare Standards and Guidelines Section A: Cattle 04/05/13
 Animal Liberation Queensland Submission on Australian Animal Welfare Standards and Guidelines Section A: Cattle 04/05/13 Chapter 1: Responsibilities S1.1 A person must take reasonable actions to ensure
Rat Control & Water Vole Conservation
 Rat Control & Water Vole Conservation Why are water voles important? Water Voles were once a common sight in Sussex but they have declined by over 90% in the last 30 years. Water voles have already become
Fertility Control for Grey Squirrels : what do the next 5 years look like? Giovanna Massei National Wildlife Management Centre APHA
 Fertility Control for Grey Squirrels : what do the next 5 years look like? Giovanna Massei National Wildlife Management Centre APHA RSST, UK Squirrel Accord and Royal Forestry Society Sand Hutton, 19 October
UNIT Animal Care: Reptile and Amphibian Care (SCQF level 5)
") National Unit Specification: general information CODE F6SR 11 SUMMARY This Unit may be suitable for candidates who seek a basic knowledge of caring for reptiles and amphibians. OUTCOMES 1 Identify suitable
National Unit Specification: general information CODE F6SR 11 SUMMARY This Unit may be suitable for candidates who seek a basic knowledge of caring for reptiles and amphibians. OUTCOMES 1 Identify suitable
Native lizards on the Kapiti Coast
 Native lizards on the Kapiti Coast Overview of the project: Our plan has been to monitor lizards at different sites along the Kapiti Coast. Some of these sites would have intensive pest control being undertaken,
Melbourne Water Corporation. Sheoak Striped Legless Lizard, Golden Sun Moth and Vegetation Monitoring Project Striped Legless Lizard Monitoring
 Melbourne Water Corporation Sheoak Striped Legless Lizard, Golden Sun Moth and Vegetation Monitoring Project Striped Legless Lizard Monitoring February 04 Table of contents. Introduction.... Introduction....
Dominance/Suppression Competitive Relationships in Loblolly Pine (Pinus taeda L.) Plantations
 Plantations") Dominance/Suppression Competitive Relationships in Loblolly Pine (Pinus taeda L.) Plantations by Michael E. Dyer Dissertation submitted to the Faculty of the Virginia Polytechnic Institute and Stand University
Dominance/Suppression Competitive Relationships in Loblolly Pine (Pinus taeda L.) Plantations by Michael E. Dyer Dissertation submitted to the Faculty of the Virginia Polytechnic Institute and Stand University
Adjustment Factors in NSIP 1
 Adjustment Factors in NSIP 1 David Notter and Daniel Brown Summary Multiplicative adjustment factors for effects of type of birth and rearing on weaning and postweaning lamb weights were systematically
Investigation into animal welfare and cruelty in the Victorian greyhound industry
 Investigation into animal welfare and cruelty in the Victorian greyhound industry Final Report 30 April 2015 Dr Charles Milne Chief Veterinary Officer 30 April 2015 The State of Victoria Department of
This is an optional Unit within the National Certificate in Agriculture (SCQF level 6) but is also available as a free-standing Unit.
 but is also available as a free-standing Unit.") National Unit specification: general information Unit code: H2N3 12 Superclass: SH Publication date: February 2013 Source: Scottish Qualifications Authority Version: 02 Summary This Unit enables learners
National Unit specification: general information Unit code: H2N3 12 Superclass: SH Publication date: February 2013 Source: Scottish Qualifications Authority Version: 02 Summary This Unit enables learners
Stray Dog Population Control
 Stray Dog Population Control Terrestrial Animal Health Code Chapter 7.7. Tikiri Wijayathilaka, Regional Project Coordinator OIE RRAP, Tokyo, Japan AWFP Training, August 27, 2013, Seoul, RO Korea Presentation
Memorandum. To: Tim Walsh Date: April 16, From: Michael D. Loberg cc: MVCHI Review Team
 Memorandum To: Tim Walsh Date: April 16, 2015 From: Michael D. Loberg cc: MVCHI Review Team Matthew Poole Subject: Tick-Borne Illness Grant: 2013 Year-End Progress Report & 2014 Objectives and Budget TBI
Donkeys Controlling Dogs
 Donkeys Controlling Dogs Jade Hunt, Ellen Mathie, Maggie Jamieson, Michael Walters and Ben Klose Holbrook Public School Creative Catchment Kids Creative Catchment Kids is an initiative of Wirraminna Environmental
Texas Quail Index. Result Demonstration Report 2016
 Texas Quail Index Result Demonstration Report 2016 Cooperators: Josh Kouns, County Extension Agent for Baylor County Amanda Gobeli, Extension Associate Dr. Dale Rollins, Statewide Coordinator Bill Whitley,
A SPATIAL ANALYSIS OF SEA TURTLE AND HUMAN INTERACTION IN KAHALU U BAY, HI. By Nathan D. Stewart
 A SPATIAL ANALYSIS OF SEA TURTLE AND HUMAN INTERACTION IN KAHALU U BAY, HI By Nathan D. Stewart USC/SSCI 586 Spring 2015 1. INTRODUCTION Currently, sea turtles are an endangered species. This project looks
Female Persistency Post-Peak - Managing Fertility and Production
 Female Persistency Post-Peak - Managing Fertility and Production Michael Longley, Global Technical Transfer Manager May 2013 SUMMARY Introduction Chick numbers are most often reduced during the period
Homework Case Study Update #3
 Homework 7.1 - Name: The graph below summarizes the changes in the size of the two populations you have been studying on Isle Royale. 1996 was the year that there was intense competition for declining
Guidelines to Reduce Sea Turtle Mortality in Fishing Operations
 Guidelines to Reduce Sea Turtle Mortality in Fishing Operations Preamble The FAO Code of Conduct for Responsible Fisheries calls for sustainable use of aquatic ecosystems and requires that fishing be conducted
The IUCN Red List of Threatened Species
 The IUCN Red List of Threatened Species: Celebrating 50 years Background, lessons learned, and challenges David Allen Regional Biodiversity Assessment Officer, Global Species Programme, Cambridge The IUCN