Courcier, Emily (2013) Investigating the epidemiology of companion animal overweight/obesity in Great Britain. PhD thesis.
|
|
|
- Sherilyn Powers
- 5 years ago
- Views:
Transcription

1 Courcier, Emily (2013) Investigating the epidemiology of companion animal overweight/obesity in Great Britain. PhD thesis. Copyright and moral rights for this work are retained by the author A copy can be downloaded for personal non-commercial research or study, without prior permission or charge This work cannot be reproduced or quoted extensively from without first obtaining permission in writing from the author The content must not be changed in any way or sold commercially in any format or medium without the formal permission of the author When referring to this work, full bibliographic details including the author, title, awarding institution and date of the thesis must be given Enlighten:Theses theses@gla.ac.uk
2 Investigating the epidemiology of companion animal overweight/obesity in Great Britain Emily Courcier BVetMed BSc MSc DipECVPH Submitted in fulfilment of the requirements for the Degree of Doctor of Philosophy (Ph.D) School of Veterinary Medicine University of Glasgow May 2013 Emily Courcier
3 Summary Obesity is recognised as the leading cause of malnutrition in cats and dogs (Legrand-Defretin 1994) and is reported to be one of the most important and frequently seen welfare issues in small animal practice (Yeates and Main 2011). Despite the recognised burden of overweight/obesity on the companion animal population, a review of the published literature identified several gaps. This thesis aimed to address three of the those gaps. Gap A: No published national prevalence estimates for cats, dogs and rabbits in Great Britain were available and no studies had explored whether prevalence varied across Great Britain. Chapter 3 and 4 estimated the national prevalence of overweight/obesity in cats, dogs and rabbits to be 11.5%, 25% and 7.6% respectively. After adjusting for differences in demographics between locations, there was a significantly higher prevalence of canine overweight/obesity in Scotland compared to England and Wales. But no spatial variations were found in the prevalence of feline overweight/obesity within Great Britain. Gap B: There was a lack of consistency in the risk factors found to be associated with overweight/obesity between previous published studies and no assessment of the impact of various risk factors on the prevalence of canine and feline overweight/obesity was apparent in the literature. Non modifiable risk factors identified for dogs in Chapter 3 included being female, neutered status, and age with peak of risk at 5 to 8 years of age. These effects were independent of location. Chapter 4 identified neutered status, being male and middle age (around 7 years) as feline non modifiable risk factors. Neutered status was the only significant risk factor found for rabbit overweight. Chapter 5 and 7 expanded the canine and feline overweight/obesity risk factor analyses to include modifiable risk factors. Risk factors for canine overweight/obesity (Chapter 5) identified were owner income, owner age, frequency of snacks and treats and hours of exercise the dog received each week. For cats (Chapter 7), the significant risk factors were frequency of feeding and neutered status. The calculated population attributable risks (Chapter 3 and 4) showed possible differences in the impact of non modifiable risk factors between cats and dogs. For cats, neutered status was the most important factor whereas in dogs age and neutered status were equally important. Gap C: Misperception of body shape has been recognised to play an important role in human obesity management. Previous studies had only described owner misperception of pet body shape as a risk factor for obesity/overweight. The objective of Chapter 6 and, in part, Chapter 7 was to explore the concept of owner misperception of canine and feline body shape. Owners of cats and dogs appeared to normalise their animal s body shape i.e owners of overweight animals were more likely to think their pet was an ideal shape rather than overweight and owners of underweight animals were more likely to think they were an ideal shape rather than underweight. Risk factors identified for misperception in dog owners were gender of owner and age of the dog. Only one risk factor was identified for misperception by cat owners; that is whether the cat was long haired or not. i
4 In conclusion, this thesis demonstrates that overweight/obesity in cats, dogs and rabbits is widespread. Despite the limitations of these data, the results show the complexity of risk factors that contribute to overweight/obesity in companion animals and highlight areas for future research. ii
5 Acknowledgements This thesis would not have been possible without the contribution of many people. I am very grateful for the support and encouragement of my supervisors Philippa Yam and Dominic Mellor. Many people were involved in gathering the data for this thesis. Helen Ternent designed the questionnaires while Catriona Dykes, Rachel O Higgins and Rory Thomson carried out the questionnaire surveys during their summer projects. The PDSA (Elaine Pendlebury and Christian Evans) provided the data for Chapter 3 and 4. Elaine Pendlebury also provided valuable feedback for Chapter 3 and 4. I would also like to thank the Veterinary Epidemiology Unit, particularly Darrell Abernethy and Fraser Menzies, for being understanding and supportive through the last two and a half years. This thesis began during a senior clinical training scholarship funded by BSAVA PetSavers and Royal Canin. DARDNI provided additional support through the Assistance to Study Scheme which allowed completion of this thesis. Finally, thank you to Colin for all his support and patience that made this possible. iii
6 Declaration I declare that all of the work submitted herewith has been carried out by myself. Collaborative work is acknowledged where present. Emily Courcier 2013 iv
7 Contents 1 Literature review Development and implications of overweight/obesity Overweight/obesity as a welfare issue Adipose tissue and it s role in obesity related conditions Overweight/obesity and it s association with other diseases The epidemiology of canine and feline overweight/obesity Definitions of overweight/obesity in companion animals Methods for identifying overweight/obese animals in research studies Establishing the prevalence and identifying the determinants of overweight/obesity in companion animals Overweight/obesity in other companion animal species Management of overweight/obesity Prevention of overweight/obesity Background to the thesis Thesis objectives Thesis outline General Materials and Methods Introduction Data collection Data for Chapter 3 and Data for Chapter 5 and Data for Chapter Data analysis Investigating the prevalence and risk factors for canine overweight/obesity Introduction Materials and Methods Results Body condition score Age Sex and neutering Breed Location Temporal trends Multilevel model Discussion Conclusion v
8 4 Investigations into the epidemiology of feline and rabbit overweight/obesity in Great Britain Introduction Materials and Methods Identifying risk factors associated with feline overweight/obesity Identifying risk factors associated with rabbit overweight/obesity Results Results from the analysis of feline records Results from the analysis of rabbit records Discussion Conclusion A cross-sectional study of the risk factors associated with canine overweight/obesity in first opinion practices in Glasgow Introduction Materials and Methods Data collection Statistical analyses Results Descriptive and univariable analysis Binomial logistic regression Discussion Conclusion A cross-sectional study of the prevalence and risk factors for owner misperception of canine body shape in first opinion practice in Glasgow Introduction Materials and Methods Data collection Statistical Analyses Results Agreement between owner and interviewer rating of canine body shape Factors associated with misperception in dogs over 1 year Discussion Conclusion Prevalence and risk factors for feline overweight/obesity in a first opinion practice in Glasgow, Scotland Introduction Materials and Methods Data collection Statistical analyses Results Prevalence of overweight or obese cats Prevalence of cat body shape misperception in cat owners Population demographics vi
9 7.3.4 Diet Owner feeding habits and knowledge about obesity Overweight/obesity risk factor analysis Underweight risk factor analysis Owner misperception risk factor analysis Discussion Conclusion General discussion and conclusions Prevalence of overweight/obesity in cats, dogs and rabbits Risk factors associated with overweight/obesity in cats, dogs and rabbits Prevalence of canine and feline body shape misperception and associated risk factors Application of results Limitations of the thesis and ideas for future work Conclusions References 145 Appendices 168 Appendix A: Canine Nutrition Questionnaire Appendix B: Feline Body Condition Questionnaire Appendix C: partial code vii
10 List of Figures 1.1 Ecological triad (Adapted from Egger and Swinburn 1997) The roles of adipose tissue (Adapted from German et al. 2010a) Location of practices used to gather data for Chapter 3 and Adaptation of S.H.A.P.E. canine body condition scoring system used in Chapter 5 and Hierarchical structures evaluated in the canine GLMM Distribution of canine body condition score categories Country adjusted and unadjusted canine overweight/obesity prevalence Adjusted regional canine overweight/obesity prevalence (NI=Northern Ireland) Temporal trend in adjusted canine overweight/obesity prevalance SaTScan results: statistically significant clusters of canine overweight/obesity risk Age spline from canine generalised additive model Relationship between neutered status and age of dog Age spline for canine generalised additive model for the restricted dataset Hierarchical structures evaluated in the feline generalised linear mixed model Feline body condition scores Prevalence of feline overweight/obesity per country Prevalence of feline overweight/obesity per region Predictive probability of overweight/obesity from the final generalised linear model plotted against age of cat Scatter plot of feline and canine overweight/obesity adjusted prevalence Results of correspondence analysis for rabbit overweight Violin plot of age of dog stratified by owner age category Violin plot of hours of exercise per week grouped by canine body shape (Non obese=1-5, Obese=6-7, Non-overweight=1-4, Overweight=5-7) Predicted probabilities of canine body shapes by hours of weekly exercise Results of CART analysis Predicted probabilities of each outcome plotted against age for each body shape - Multinomial logistic regression model Predicted probabilities of each outcome plotted against age for each body shape - CART analysis ROC curves for final multinomial logistic and CART analyses Interviewer assessment of cat body condition score on a five point scale viii
11 7.2 Boxplot of age with feline body condition score ix
12 List of Tables 1.1 Body condition scoring systems Comparison of age, neutered status and sex between dogs with and without body condition scores Univariable results of association between canine overweight/obesity and sex/neutered status Variance components and fit for multivariable models for canine overweight/obesity (SE=Standard error) (Model 4 has no random effects) Results from final multivariable model for canine overweight/obesity Comparison of canine overweight/obesity models assessing the interaction between age and breed Full model results Population attributable risks for canine overweight/obesity Comparison of age, neutered status and sex between those cats with and without body condition scores Univariable associations between feline overweight/obesity and sex/neutered status Final feline overweight/obesity multivariable analysis results (OR=Odds ratio, 95%CI=95% confidence level) Feline underweight (BCS 1) analysis results (OR=Odds ratio, 95%CI=95% confidence interval, mor=multivariable model odds ratio) Contingency table of risk factors for rabbit overweight.(percentages are in brackets) Results of the univariable analysis of obesity (SHAPE1-5 versus SHAPE 6-7) Table 2 Results of the univariable analysis for overweight (SHAPE 1-4 versus SHAPE 5-7) Results of the multivariable binomial logistic regression obesity model (SHAPE 1-5 versus SHAPE 6-7) Results of the multivariable binomial logistic overweight model (SHAPE 1-4 versus SHAPE 5-7) Individual multinomial associations between body shape and potential owner risk factors. Relative risk ratios=rrr, 1 = mean, 2 = standard deviation Individual multinomial associations between body shape and potential dog level risk factors Final multivariable multinomial logistic regression model results Count of owner rating and interviewer rating of dog body condition score x
13 6.2 Variables used in the risk factor analysis (excluding breed related variables). Percentages (denominator=total number of animals) in brackets Odds ratios of misperception by canine body shape Final multinomial logistic model for canine body shape misperception Results of multinomial logistic regression investigating owner body shape and cat body shape Feline overweight/obesity univariable results Feline overweight/obesity multivariable model Risk factors for being underweight in cats (BCS=1) Owner misperception of feline overweight/obesity univariable results xi
14 Acronyms 95%CI 95% confidence interval AAFP/AAHA American Association of Feline Practitioners/American Animal Hospital Association AIC Akaike information criterion ANOVA Analysis of Variance AUC Area under the curve BCS Body condition score BMI Body mass index CART Classification and regression tree Coef Coeffiecient CRP C-reactive protein DEXA Dual-energy X-ray absorptiometry FE Female entire FN Female neutered GAM Generalised additive model GLM Generalised linear model GLMM Generalised linear mixed model GLUT-4 Glucose transporter type 4 IL Interleukin KC Kennel Club MCP-1 Monocyte chemotactic protein-1 ME Male entire MIF Migration inhibitory factor MN Male neutered MQL Maximum quasi likelihood NGF Nerve growth factor NI Northern Ireland xii
15 OR Odds ratio PAI-1 Plasminogen activator inhibitor type 1 PAR Population attributable risk ROC Receiver operator curve RRR Relative Risk Ratio SAA Serum amyloid A proteins SE Standard error SHAPE Size, Health, and Physical Evaluation T4 Thyroxine TNF Tumor necrosis factor TPB Theory of Planned Behavior TSH Throid stimulating hormone VCP Variance component proportion VPC Variance partition coefficient WSAVA World Small Animal Veterinary Association xiii
16 Publications and Presentations Peer reviewed papers Chapter 3 E. Courcier, D. Mellor, E. Pendlebury, C. Evans,and P. Yam. Investigation into the epidemiology of canine obesity in Great Britain; results of a cross sectional study of 47 practices Submitted for publication. Chapter 4 E. Courcier, D. Mellor, E. Pendlebury, C. Evans,and P. Yam (2012) A preliminary investigation to establish prevalence and risk factors for being overweight in pet rabbits in Great Britain. Veterinary Record 171, 197 E. Courcier, D. Mellor, E. Pendlebury, C. Evans,and P. Yam (2012) Investigation into the epidemiology of feline obesity in Great Britain; results of a cross sectional study of 47 practices Veterinary Record 171, Chapter 5 E. Courcier, R. Thomson, and P. Yam. (2010) An epidemiological study of environmental determinants of canine obesity. Journal of Small Animal Practice 51, Chapter 6 E.Courcier, R. Thomson, R. O Higgins, D. Mellor and P. Yam. (2011) The prevalence and risk factors for owner misperception of canine body shape in first opinion practice Preventive Veterinary Medicine 102, Chapter 7 E.Courcier, R. O Higgins, D. Mellor, and P. Yam. (2010) Prevalence and risk factors for feline obesity in first opinion practice in Glasgow, Scotland Journal of Feline Medicine and Surgery 12, xiv
17 Presentations E. Courcier, R. Thomson, D. Mellor, and P. Yam. (2009) Canine obesity; do owners see what you see? British Small Animal Veterinary Association 52nd Annual Congress, Birmingham UK, April 2009 R. Thomson, E. Courcier and P. Yam. (2009) Canine obesity; the penny drops. British Small Animal Veterinary Association 52nd Annual Congress, Birmingham UK, April 2009 R. O Higgins, E. Courcier, and P. Yam. (2009) Owner ability to assess the body condition of their feline friends. British Small Animal Veterinary Association 52nd Annual Congress, Birmingham UK, April 2009 E. Courcier, R. Thomson, D. Mellor, and P. Yam. canine body shape: an important determinant of canine obesity? (2009) Owner misperception of 12th Conference of the International Society for Veterinary Epidemiology and Economics (ISVEE XII), Durban South Africa, August 2009 E. Courcier, R. Thomson, R. O Higgins, D. Mellor, and P. Yam.(2009) Misperceptions of pet body shape: do cat and dog owners differ? 13th ESVCN (European Society for Veterinary and Comparative Nutrition) congress, Sardinia Italy, October 2009 E. Courcier, R. O Higgins, D. Mellor, and P. Yam.(2009) Owner misperceptions of cat body shape in feline obesity. 13th ESVCN (European Society for Veterinary and Comparative Nutrition) congress, Sardinia Italy, October 2009 (Poster presentation) E. Courcier, P. Yam,R. Thomson and D. Mellor (2009) The importance of owner socioeconomic and demographic factors in canine obesity European College of Veterinary Public Health Annual General Meeting and Conference, Leipzig Germany, October 2009 (Poster presentation) C. Dykes, E. Courcier and P. Yam (2010) Are dog owners able to accurately read a pet food label? Birmingham UK, April 2010 British Small Animal Veterinary Association 53rd Annual Congress, E. Courcier, D. Mellor, R. Thomson, and P. Yam. (2010) The usefulness of classification trees in identifying risk factors in canine obesity. AVTRW Irish Region, Newry Northern Ireland, October 2010 E.Courcier, D. Mellor, R. Thomson, and P. Yam. (2011) A comparison of methods for risk factor investigation in canine and feline obesity. British Small Animal Veterinary Association 54th Annual Congress, Birmingham UK, April 2011 xv
18 E. Courcier, E. Pendlebury, D. Mellor, C. Evans and P. Yam (2011) Prevalence estimates for companion animal obesity in the UK. British Small Animal Veterinary Association 54th Annual Congress, Birmingham UK, April E. Courcier, D. Mellor, E. Pendlebury, C. Evans,and P. Yam. (2012) Exploring the epidemiology of canine and feline overweight/obesity in United Kingdom using a national database of veterinary practices. 13th Conference of the International Society for Veterinary Epidemiology and Economics (ISVEE XIII), Maastricht Netherlands, August 2012 xvi
19 Chapter 1 Literature review Obesity can be defined as the excess accumulation of adipose tissue to such an extent that it results in health problems. There is increasing concern about a human obesity pandemic (Roth et al. 2004) with 58% of the world human adult population predicted to be obese by 2030 (Kelly et al. 2008). In small animal veterinary practice, obesity is considered to be the leading cause of malnutrition (Legrand-Defretin 1994). In line with rising rates of human obesity, the prevalence of companion animal obesity is also accepted to be increasing (German et al. 2006). Klimentidis et al. (2010) described a trend of rising body weight at middle age in eight species from 24 distinct populations including humans, cats and dogs over the past decades suggesting a common aetiology between species. Several potential causes have been put forward to explain these trends. The more widely accepted suggestions are dietary changes and lowering of activity levels as a result of shifting lifestyles and more obesogenic environments. Other suggested potential causes have included infectious agents such as adenovirus-36 (Dhurandhar 2001), endocrine disruptors in the environment (Heindel 2003) and increased exposure to artificial light (Wyse et al. 2011). Obesity is not a benign state in companion animals, with overweight/obesity linked to increased morbidity and mortality in cats (Scarlett and Donaghue 1998) and dogs (Lund et al. 2006; Kealy et al. 2002). It has been reported as one of the most important and frequently seen welfare issues in general small animal practice by veterinary surgeons (Yeates and Main 2011). The epidemiology of overweight/obesity is crucial to understanding the determinants and consequences of overweight/obesity at a population level. Along with basic research, this information can be then used to formulate and implement evidence based prevention and treatment strategies. Investigating the determinants of small animal obesity may also expand understanding of the drivers of the human obesity pandemic as companion animals share the same environment and are potentially subject to the same influences. This introductory chapter is broken into two parts, each reviewing different aspects of the literature, followed by an outline of the thesis. The first part discusses the development and implications of overweight/obesity in cats and dogs. The second part looks at the epidemiology of canine and feline overweight/obesity. Specifically, it explores how obesity and overweight can be defined, the methods that are used to diagnose overweight/obesity, the studies carried out to establish prevalence and to identify the determinants of overweight/obesity, overweight/obesity in other companion animals and, finally, how the findings of epidemiological studies can be used to prevent and treat canine and feline overweight/obesity. 1
20 1.1 Development and implications of overweight/obesity Adipose tissue in dogs, as a percentage of body composition, increases with age from 1% to 2% at birth, 10% to 15% at around 4 to 6 weeks of age, 20% in normal adult dogs, to 25% to 30% in dogs between 8 to 10 years of age (Crane 1991). Females have increased amounts of adipose tissue compared to males. Differential diagnoses for obesity in companion animals include pregnancy, oedema, organomegaly, neoplasia, ascites and endocrinopathies such as hypothyroidism and hyperadrenocorticism (German 2006). Obesity develops due to a long term positive energy balance as the result of a daily energy intake consistently being above the daily energy expenditure. Once the energy balance equilibrates, the animal enters the static obesity phase but retains the altered body composition. The daily energy expenditure is equal to the total of the basal metabolic rate and the energy required for thermogenesis and activity. There is no linear relationship between body weight and energy requirements with a number of equations described for small, medium and large sized dogs (Legrand-Defretin 1994). The ratio between lean tissue and fat tissue affects energy requirements, and therefore body composition is more influential than body weight. In contrast, the energy requirement of adult cats has been described as directly proportional to body weight but there is a large variation in estimates of adult cat energy requirements (Bermingham et al. 2010). However, more recent work has shown that energy requirements per kg may decrease with increasing body weight in inactive cats (Earle & Smith 1991). Bermingham et al. (2010) carried out a meta-analysis of 42 published studies and found the kcal per kg of bodyweight may be lower than the current recommended and should be adjusted relative to sex, neutered status and age. Egger and Swinburn (1997) argued that it is an oversimplification to explain human obesity as a basic energy imbalance that can be understood at the level of the individual. They postulated that obesity is a response to an abnormal environment. They outline the ecological paradigm (Figure 1.1) which consists of three components: host factors, vectors and environmental variables. Onto this triad, types of interventions are described, aimed at both societal and individual factors. There is also increasing evidence that some of the factors influencing the development of obesity, like many chronic diseases, may originate early in life. Therefore there is a need to understand obesity development in the context of the entire life of a companion animal rather than factors involved determining current energy balance. Overfeeding during growth is accepted to lead to increased numbers of adipocytes which may predispose to obesity in adulthood (Brook 1972). Obese dogs between 9 and 12 months of age are 1.5 times more likely to become obese in adulthood than dogs that are lean during this growth period (Glickman et al. 1995). Determination of energy requirements in juvenile dogs is complicated by the differing growth rates and body composition between breeds. For example, Legrand-Defretin (1994) described that Newfoundlands required less energy per kg than Great Danes despite similar growth rates. The increased size and mass of overweight/obese animals results in physical and mechanical problems e.g. osteoarthritis, constriction of upper airways, difficulty in heat dissipation 2
.")
21 Figure 1.1 Ecological triad (Adapted from Egger and Swinburn 1997) and restricted grooming (German et al. 2010a). The endocrine and metabolic effects of excess white adipose tissue lead to conditions such as diabetes mellitus and hypertension (Leroith 2012). These metabolic and physiological effects combine, resulting in decreased quality of life impacting on welfare and ultimately decreased longevity (Kealy et al. 2002). Excess adipose tissue also complicates physical examinations and diagnostics (German 2006), heightens anaesthetic risk and alters drug kinetics (Clutton 1988). But obesity has also been linked to increased survival in animals with concurrent disease. This phenomenon is described as the obesity paradox Overweight/obesity as a welfare issue Obesity is the most frequently seen welfare concern in first opinion practice and was also rated as one of the most important by veterinarians (Yeates and Main 2011). The study by German et al. (2012) demonstrated the detrimental welfare impact of obesity on canine quality of life. Although based on a small sample of dogs (n=50) presenting at a referral veterinary practice, it demonstrated that there was a low quality of life (measured using the canine health related quality of life tool Wiseman-Orr et al. 2004) in obese dogs and that there was a significant improvement in quality of life after weight loss. In a review by Yeates and Main (2011), obesity preventive measures were identified as a priority area for canine welfare research. The Animal Welfare Act (2007), Animal Health and Welfare (Scotland) Act (2005) and Welfare of Animals Act (Northern Ireland) 2011 describe five welfare needs: the need to be protected from pain, suffering, injury and disease, the need for a suitable diet, the need for a suitable environment, the need to be housed with or away from other animals and the need to be able to exhibit normal behaviour (Yeates and Main 2011). Obesity is associated with 3
22 three of these needs. It is the direct consequence of failure to provide a suitable diet relative to the animal s energy expenditure. It also indirectly results in disease and can impact on the ability to perform normal behaviours e.g. grooming. The Acts led to Codes of Practice being published by Defra, Welsh Assembly and Scottish Government. These codes have placed the responsibility for the maintenance of a healthy weight for an animal on to its owner. In England, there have been several successful prosecutions under the Act of owners of obese animals who have failed to follow veterinary advice Adipose tissue and it s role in obesity related conditions As reviewed by German et al. 2010a, adipose tissue has three physiological roles. It acts as an energy store, provides insulation and protection for other organs and has an endocrine function. Half the cells contained in adipose tissue are adipocytes (triglyceride containing cells). These can be divided into two types:- white adipose tissue (WAT) and brown adipose tissue (involved in thermogenesis and most prevalent in neonates). The other half consists of many cell types. Preadipocytes and multipotent mesenchymal stem cells are involved in the expansion of adipose tissue. Macrophages and monocytes are sources of proinflammatory cytokine, procoagulants, and acute phase proteins. Adipose tissue also contains nerve tissue, pericytes and endothelial cells. White adipose tissue serves as a repository for triglycerides and secretes adipokines. Adipokines are involved in the regulation of multiple processes including energy balance, glucose/lipid metabolism, inflammatory and immune responses, haemostasis, vascular functions and angiogenesis (Radin et al. 2009). Leptin is one of the adipokines implicated in obesity development. It is encoded by the ob gene with ob gene mrna having been found in adipose tissue, placenta, mammary gland and liver in humans and rodents (Hoggard et al. 1997; Masuzaki et al. 1997; Señaris 1997; Smith-Kirwin 1998). Transcription of the ob gene and secretion of leptin is triggered by metabolic and inflammatory mediators such as insulin, glucocorticoids, and cytokines (TNFα, IL-1β, and IL-6) (Houseknecht et al. 1998). Leptin receptors are found in the greatest concentrations in the arcuate nucleus of the hypothalamus but are located throughout the body (Hakansson et al. 1998). Leptin leads to suppression of appetite and increased energy expenditure (Houseknecht et al. 1998). Obesity can result in hyperleptinaemia which in turn leads to resistance to leptin developing in the hypothalamus (Wang et al. 2000). This blunts the satiety effect and concurrently lowers the metabolism, resulting in weight gain. It has been hypothesised that this resistance occurs due to saturated transport mechanisms across the blood-brain barrier or due to deficits in the signalling within the hypothalamus. In contrast, there is no peripheral resistance to leptin where it is involved in reproductive and immune function, modulation of insulin secretion and it is proinflammatory and prothrombotic (Margetic et al. 2002). Studies in dogs have shown that leptin concentrations are correlated to fat mass (Sagawa et al. 2002). Ishioka et al. (2007) showed that dogs with higher body condition scores had higher leptin concentrations and this was not influenced by breed, age or gender. Leptin concentrations also change throughout the day in line with feeding and fasting (Ishioka et al. 2005). In cats, leptin concentrations are closely correlated with the amount of adipose tissue present (Appleton et al. 2000). Furthermore, insulin resistance in cats leads to higher concentrations of leptin (Appleton et al. 2002). Increases in leptin concentrations are seen after neutering for both sexes (Hoenig et al. 2002). 4
23 Adiponectin is produced exclusively by adipocytes. It has numerous roles within the body including increasing insulin sensitivity, increasing glucose uptake via GLUT-4 transporter, has inflammatory properties, inhibits atherosclerosis, and is involved in vasodilation (German et al. 2010a). Decreased fat mass in dogs and cats leads to increased adiponectin concentrations (Ishioka et al. 2006; 2009). Adiponectin has been suggested to predispose to the development of the abnormal metabolism associated with canine obesity (German et al. 2010a) and diabetes mellitus in cats (Hoenig 2012). White adipose tissue is also a major source of angiotensinogen in humans and rodents (Karlsson et al. 1998). Increased production of angiotensinogen contributes to the development of cardiovascular and renal disease in humans (Goossens et al. 2003). This is mediated through increased vasoconstriction leading to hypertension and renal dysfunction and a rise in aldosterone concentration resulting in sodium retention. The role of white adipose tissue in the renin-angiotensin-aldosterone system in not well understood in cats and dogs. Obesity ultimately leads to a chronic inflammatory process through the production of interleukins, TNF-α, chemostatic and complement proteins - Figure 1.2 (German et al. 2010a). Inflammatory markers (C-reactive protein (CRP), interleukin-6, TNF-α) are increased in concentration in obese humans while their concentrations become decreased after weight loss (Manco et al. 2007). Trayhurn and Wood (2004) suggested that adipose tissue expansion can lead to increased tissue hypoxia and the production of hypoxia inducible factor-1α that then leads to adipokine production (Wood et al. 2007) Overweight/obesity and it s association with other diseases The links between obesity and disease are well recognised in humans but are not fully described in animals. The mechanisms of action involve both the mechanical and endocrine aspects of excess adipose tissue. In humans, obesity co-morbidities include diabetes mellitus type 2, coronary heart disease, hypertension, and neoplasias such as ovarian, gall bladder and prostate neoplasia (Guh et al. 2009). Obesity can also result as a consequence of disease e.g canine hypothyroidism. Some conditions linked to overweight/obesity in cats and dogs are described below. Orthopaedic conditions Numerous studies have demonstrated associations between obesity and multiple orthopaedic conditions. In dogs, obesity is related to the development of osteoarthritis (Impellizeri et al. 2000; Kealy et al. 2002), cruciate tears and ruptures (Lund et al. 2006), and hip dysplasia (Kealy et al. 2002). Obesity has been shown to be related to lameness in cats (Scarlett & Donoghue 1998). Endocrine and metabolic diseases Obesity is associated with a number of endocrine disorders in dogs and cats. Obesity related insulin resistance is recognised in dogs (Gayet et al. 2004). Diabetes mellitus type 2 is 5
24 Figure 1.2 The roles of adipose tissue (Adapted from German et al. 2010a) 6
25 commonly found in cats (Lutz & Rand 1995) with obesity being identified as a risk factor (Rand et al. 2004). Appleton et al. (2002) showed a strong correlation between leptin concentration and insulin resistance in cats. Dyslipidaemias (abnormality in, or abnormal amounts of, lipids and lipoproteins in the blood) are prevalent in obese humans (Howard et al. 2003). Obese dogs were found to have increases in total cholesterol and serum triglyceride concentrations compared to normal weight dogs (Peña et al. 2008). Jordan et al. (2008) described increased non esterified fatty acid, triglyceride, low density lipoprotein, total cholesterol concentrations and decreased high density lipoprotein concentrations in obese cats compared to lean cats regardless of diet. Overweight status is also associated with acute fatal pancreatitis in dogs (Hess et al. 1999). Cardiac and respiratory disease Manens et al. (2012) described the deleterious effect of obesity on lung function in dogs. Canine expiratory airway dysfunction is also exacerbated by obesity (Bach et al. 2007). Although obesity is known to predispose to hypertension in humans (Esler et al. 2001), the evidence in dogs is inconclusive. Montoya et al. (2006) found that there was a correlation between body condition score and diastolic, systolic and mean arterial blood pressure, while Bodey and Michell (1996) found that body condition score accounted for only a minor amount of variation in blood pressure. Urinary and reproductive disorders Obesity is thought to be a risk factor for canine sphincter mechanism incompetence (Gregory 1994) and canine dystocia (German et al. 2006). Obesity is also a risk factor for the occurrence of urinary calcium oxalate crystals in dogs (Lekcharoensuk et al. 2001) and is linked to the development of feline lower urinary tract disease in male cats (Hostutler et al. 2005). Other conditions Overweight cats may experience problems with grooming which can lead to dermatological problems (German et al. 2006). The link between obesity and several cancers is under debate. For example, there is contradictory evidence associating obesity with mammary gland tumours, with some studies showing a positive relationship (Perez-Alenza et al. 2000; Sonnenschein et al. 1991) while others demonstrate no relationship (Philibert et al. 2003). Weeth et al. (2007) suggested that there may be a differential effect of specific cancer types on weight status of dogs. Obesity paradox The obesity paradox describes the phenomenon in which, despite obesity being associated with higher mortality in the general population, being obese can lead to increased survival 7
26 in certain subpopulations such as patients with cardiac and renal disease (McAudley & Blair 2011). It was first described in the 1990s in obese dialysis patients in the United States (Fleischmann et al. 1999), but the mechanisms underlying the paradox are still not well understood. There is some evidence that the obesity paradox exists in cats and dogs with Finn et al. (2010) showing increased survival in cats with heart failure when they have high body condition scores and Parker and Freeman (2011) finding that overweight dogs with chronic renal failure survived longer than normal weight dogs. 1.2 The epidemiology of canine and feline overweight/obesity Describing the prevalence and identifying the risk factors for overweight/obesity in companion animals are vital to understanding the extent of the disease and welfare burden that overweight/obesity poses and for the formulation of evidence based interventions both at an individual and population level. This section discusses the definitions for overweight/obesity, how overweight/obesity is diagnosed, the methods used for investigating the prevalence of overweight/obesity and the determinants for overweight/obesity and, finally, how this knowledge informs the overweight/obesity prevention and treatment Definitions of overweight/obesity in companion animals. A usable standardised case definition is vital for any epidemiological investigation. It has been defined as a set of standard criteria for deciding whether a person has a particular disease or health-related condition, by specifying clinical criteria and limitations on time, place, and person (Thrusfield 2006). Unfortunately, there is no consensus or a standardised case definition of what constitutes overweight/obesity in companion animals. This has, in part, prevented valid comparisons of results between studies. The following paragraphs discuss the accepted or published definitions in current usage. The broad definition of obesity in cats and dogs is accepted as the excess accumulation and storage of adipose tissue (Burkholder & Toll 2000). Markwell et al. (1994) suggested that definitions of obesity may be divided into two groups: those based on an animal being a certain percentage greater than ideal weight, e.g Brown (1989) and LaFlamme (2006), and those based on whether there are physiological impairments e.g Crane (1991) who defined obesity as a complex, treatable, clinical syndrome with multiple interlinked sequelae. Within the established veterinary nutrition textbooks, animals are considered overweight when their weight is 10-15% above their ideal and obese when it exceeds 25% of their ideal weight. These cut points appear to be arbitrary with no peer reviewed evidence base with the concept of an animal being overweight above 10%-15% appearing first in literature in 1965 (Modern Veterinary Practice Staff Report 1965). The drawbacks to using these cut points were already recognised in 1970 by Joshua. He argued that it was difficult to establish an ideal weight for an individual given the wide variation in types within breed for purebreds and the inability to predict any ideal weight for crossbreeds. Despite this, defining overweight/obesity using ideal weight has continued, with Ramsay and Holden (2009) stating that overweight/obesity can be diagnosed based on ideal weight which, in turn, can be determined using weight charts. 8
27 Although the World Small Animal Veterinary Association (WSAVA) Nutritional Guidelines V5 does not contain a definition of overweight or obesity, it does state that the goal body condition score (BCS) is 4 to 5 on a 9 point scale as disease risk increases above a BCS of 6 (Freeman et al. 2011). The problem of defining what constitutes overweight and obese is not confined to veterinary medicine. Body mass index (BMI) (equal to the body mass in kilograms divided by height squared in metres) has been the accepted method to diagnose overweight and obesity in humans with a BMI equal to and greater than 25 equalling overweight and a BMI equal to or greater than 30 equalling obese. But Shah and Bravermann (2012) demonstrated that BMI misclassified one quarter of obese men and an half of obese women as non obese when adiposity was assessed by dual-energy X-ray absorptiometry (DEXA) Methods for identifying overweight/obese animals in research studies Any definition of overweight/obesity is dependent on the method used for diagnosis. The next section reviews some of the current methods available to assess body composition/adiposity and their usefulness in epidemiological studies. Body composition is defined by Burkholder and Toll (2000) as the relative weight of the different body components including fat and lean body mass. Methods can take two approaches to modelling body composition (as reviewed by Lee and Gallagher 2008). Two compartment models divide the body into fat mass and fat free mass. This model can be inaccurate under the conditions of ageing, pregnancy or growth as the model assumes constant proportions of fat free mass as water, protein and mineral. The four compartment model measures body mass, total body volume, total body water and bone mineral. It is perceived as the most accurate model of body composition but it usually requires specialised equipment and trained operatives. Body weight Body weight is precise, repeatable and objective with calibrated equipment. It has limited usefulness in epidemiological studies of overweight/obesity because of the requirement to determine the optimal weight for an animal in order to classify the animal as overweight or obese. There can also be considerable variability in body type and therefore body weight within dog breeds (Burkholder & Toll 2000). There is also difficulty in establishing ideal weights for cross breeds as no reference ranges exist (Crane, 1991). Although cats are more uniform in body size, there can also be considerable variation with an adult cat varying in weight between 2kg to 7 kg (Lund et al. 2005). In addition, the amount and type of work an animal experiences influences body compositions and can lead to lean active dogs having weights comparable to overweight dogs (Crane, 1991; Jeusette et al., 2010). Bioelectrical impedance analysis This method is based on the two compartment model and on the principle that resistance to a small electric current (50kHz, 800 µa) is affected by tissue composition. Resistance is 9
28 less the greater the lean body mass of an animal. An algorithm then allows the calculation of body fat mass and fat free mass. Its general advantages are that it is non invasive, rapid and portable. German et al. (2010b) described the use of bioimpedance relative to BCS using dual energy X-ray absorptiometry (DEXA) in dogs. Manufacturers had previously shown good correlation between a handheld monitor and percentage body fat calculated by isotope dilution (r 2 = 0.75). German et al. (2010b) found poor correlation between DEXA and bioimpedance (r 2 =0.44) compared with DEXA and BCS (r 2 =0.58). There were significant discrepancies between percentage body fat estimated by DEXA and bioimpedance in cases with high or low body fat where bioimpedance underestimated and overestimated respectively. Also the study recommended multiple measurements are taken to find the mean measurement for an individual as there was a degree of imprecision in repeated measurements from the same animal. The study concluded that bioimpedance did not represent a viable alternative for the routine assessment of body fat. In cats, bioimpedance analysis has been validated by chemical analysis and using isotope dilution techniques (Stanton et al. 1992). It was found to be a reliable and valid measure of fat free mass. Bioimpedance has previously been suggested for use in epidemiological studies (Allan et al. 2000) but the current evidence suggests that it does not perform any better than body condition scoring for classifying an animal as overweight or not. Dual energy X-ray absorptiometry Dual energy X-ray absorptiometry (DEXA) provides estimates of four body components: bone mineral, bone free, fat free mass and fat mass. It involves passing two beams of low and high energy X-rays (70-140kVp) through the body. They are attenuated to differing degrees by bone mineral, soft tissue, fat free mass and fat tissue. Tissue density can then be calculated from the radiographic images using computer algorithms. Using this, estimates for bone mineral content, lean mass (fat-free mass) and fat mass are produced. One of the assumptions in DEXA is that the water content of lean body tissue is around 73% and this may not hold due to disease, species and age (Burkholder & Thatcher 1998; Speakman et al. 2001). Studies have shown that there is high scan repeatability and that changes in body composition can be reliably determined for individual animals (Lauten et al. 2001; Mawby et al. 2001; Munday et al. 1994; Speakman et al. 2001). DEXA has been validated using 2 other methods: chemical analysis of carcasses in cats and dogs (Speakman et al. 2001) and isotope dilution using deuterium oxide in dogs (Mawby et al. 2001). Although accurate, requirements that animals are sedated or anaesthetised to avoid movement, the high financial cost and low availability relative to other methods limit the use of DEXA in epidemiological studies. Morphometric techniques Morphometry can be defined as the measurement of organisms. The most widely accepted measures of human adiposity are morphometric techniques (body mass index, waist circum- 10
29 ference and waist/hip ratio) (Lee & Gallagher 2008). Several morphometric techniques have been described in companion animals, with body condition scoring being the most commonly used method to assess adiposity in cats and dogs. Body condition scoring Body condition scoring involves assigning an animal to a particular point on a scale based on a subjective assessment of subcutaneous fat assessed visually and by palpation of specific areas (ribs, waist and the vertebral dorsal spinous processes). A number of standardized scoring systems have been described but the more commonly used are the 9 point, 7 point (see Figure 2.2) and 5 point scales. The minimum of the scale usually represents the underweight animals while the maximum signifies the most overweight animals. Additional modifications to these systems have been used in studies such as the half point increments in a 5 point system used by McGreevy et al. (2005). Table 1.1 demonstrates these body condition scoring systems. 11
30 Classification 9 point scale 7 point scale 5 point scale Visual assessment Rib palpation Waist palpation Tail base palpation Underweight Bony prominences No fat over ribs Little fat present visible Underweight Underweight 3 Ideal Well proportioned waist and abdominal tuck Individual ribs palpable with no excess fat Ideal Slight fat coverage Overweight 6 5 Slight excess fat covering Overweight Ribs palpable with difficulty Overweight 8 7 Ribs palpable with significant pressure Overweight 9 5 Massive fat deposits over thorax, spine and base of tail. No abdominal tuck and pendulous ventral bulge Table 1.1 Body condition scoring systems Individual ribs not palpable Well proportioned waist Abdominal tuck still visible No visible waist or abdominal tuck Smooth contour with a thin layer of fat Hip bones and dorsal spinal processes not palpable 12
31 Dogs with condition scores above ideal are at greater risk of several diseases (Lund et al. 2006) and early death (Kealy et al. 2002) than those dogs with ideal BCS. Cats with a lower than ideal BCS also have been found to have a higher morbidity than cats with ideal BCS (Doria-Rose & Scarlett 2000). The most recent issue of the WSAVA nutritional assessment guidelines recommended the usage of the 9 point scale (Freeman et al. 2011). This 9 point scale was developed by Nestle Purina. It has been validated in dogs by Mawby et al. (2001); LaFlamme (1997a); Kealy et al. 2002) and in cats by LaFlamme (1997b), Hawthorne et al. (2005), and Bjornvad et al. (2011). It also has been integrated in a system for determining the energy requirements of dogs and cats in a system devised by the United States Research Council (National Research Council 1986). The subjective nature of body condition scoring has led to doubts over its reliability (Burkholder & Toll 2000) but several studies have shown significant associations between body condition score and outcomes such as morbidity and mortality. The usefulness of body condition scoring can be assessed using three measures (Burkholder & Toll 2000): repeatability (within assessor precision), reproducibility (between assessor precision) and accuracy (the extent to which body condition scoring conforms to the true body composition of an animal). Precision is defined by Thrusfield (2006) as consistency of a series of measurements. The repeatability and reproducibility of the 9 point scale in dogs was first discussed by Laflamme (1997a). Speakman et al. (2001) then validated the 9 point system against percentage body fat and body composition assessed by DEXA in dogs. LaFlamme (1997a) and Mawby et al. (2001) found 10% to 15% body weight increase for each integer of the 9 point system. These were estimated by exploring relative differences in weight, body composition and body conditions in populations with varying degrees of adiposity. More recently, German et al. (2006) assessed the 7 point S.H.A.P.E algorithm-based body condition scoring using a population of 20 vet visiting cats, 71 vet visiting dogs and 2 experienced body condition scorers. They found good reproducibility between the two scorers (r 2 =0.957 (dogs) and r 2 =0.987 (cats)) and acceptable accuracy with percentage body fat assessed via DEXA (r 2 = (dog), r 2 =0.833 (cat)). This accuracy was comparable to the established 9 point scale (r 2 = (dog) and r 2 =0.803 (cat)). Validation in cats has been restricted to small numbers of animals from non-representative populations (LaFlamme (1997b) 48 domestic short hair (DSH) entire colony cats, Hawthorne et al. (2005) 60 genetically related colony cats and Bjornvad et al. (2011), and 72 DSH indoor neutered domestic cats). Bjornvard et al. (2011) discussed whether the high prevalence of neutering within the cat pet population (Murray et al. 2009) and indoor confinement may have affected the validity of the 9 point system due to the occurrence of skinny fat in cats. In humans, these are individuals with a body mass index in normal limits but with a high percentage of adipose tissue from lack of physical activity and decreased muscle mass. This may imply that ideal BCS for inactive neutered cats should be a BCS of 4/9. A similar change in the definition of ideal in dogs has taken place with ideal corresponding to a BCS of 4 to 5 out of 9 (Kealy et al. 2002). Body condition scoring in dogs has been suggested to be influenced by breed due to breed 13
32 differences in body composition (Lauten et al. 2001; Speakman et al. 2003). Jeusette et al. (2010) showed that percentage body fat corresponded to different body condition scores according to breed. Similarly, age may also influence body condition scoring through it s effect on body composition (Speakman et al. 2003). Despite the drawbacks discussed in this section, body condition scoring has been used in the majority of peer-viewed epidemiological studies although there is no agreement on the point scale to use. Other morphometric measures Laflamme et al. (2001) showed that percentage body fat could be estimated from abdominal girth in dogs (measured at the 4th and 6th lumbar vertebrae), although there are several disadvantages to this method. A feline body mass index has been proposed based on ribcage circumference and limb length (Hawthorne et al. 2005) and thoracic measurement has been suggested (Butterwick 2000) but there are practical difficulties using these in conscious cats. Allan et al. (2000) found that there was no improvement in the ability to predict obesity between using body weight relative to either body length or leg length and solely body weight in cats. A body mass index has also been suggested for dogs (Pendergrass et al. 1983) but has been little used. Chemical analysis Chemical analysis is regarded as the gold standard for body composition analysis (Mawby et al 2001). The accuracy of this method relies on the ability to produce a fully representative sample of the carcass if the entire body cannot be used. The sample is then autoclaved and homogenised. The homogenate is then divided into aliquots. Some of these aliquots are dried to provide an estimate of body water. Other aliquots are used for quantification of fat using solvent extraction. Lean mass can be estimated by subtracting the calculated fat mass from the total carcase weight or chemically using the Kjeldahl method. Ashing is carried out in a muffled furnace to provide an estimate of bone composition. Both DEXA and deuterium oxide dilution techniques have been validated using chemical analysis (Lauten et al. 2001; Speakman et al. 2001). As this technique is based on analysis of tissues from euthanized animals, it is not practical for widespread use in epidemiological studies for companion animal overweight/obesity. Isotope dilution techniques The isotope dilution method is an indirect estimate of body fat. Body water is associated with non fat tissue. Therefore a measure of total body water allows the mass of non fat tissue to be indirectly measured. Isotopes of hydrogen, deuterium oxide and tritium have been used as stable non toxic tracers. The tracers are given intravenously or orally. After two to three hours, they equilibrate uniformly in the water within the body. Deuterium oxide dilution 14
33 has been validated for determination of body composition in dogs (Burkholder and Thatcher 1998). These techniques require specialist equipment and are time-consuming making them unfeasible for large epidemiological studies. Other techniques Biomarkers are defined as a characteristic that is objectively measured and evaluated as an indicator of normal biologic processes, pathogenic processes, or pharmacologic responses to a therapeutic intervention." Adipokines therefore can be considered as biomarkers. This is discussed further by German et al. (2010a). Several commercial assays for adipokines are already available for use in cats and dogs (Tvarijonaviciute et al. 2010; 2012) but their usefulness to diagnose obesity clinically remains unknown. Body fat has been assessed using Computed Tomography in dogs (Ishioka et al. 2005) and in domestic cats (Bueland et al. 2011). Like DEXA, this technique is costly, requires a general anaesthesia, and has an associated ionising radiation dose. Therefore it is currently unsuitable for epidemiological studies with large sample sizes. Wilkinson and McEwan (1991) showed that body fat percentage determined by chemical analysis was correlated with subcutaneous fat thickness in the mid- lumbar region using one dimensional ultrasound in dogs. Morooka et al. (2001) went on to describe the use of the 6th and 7th lumbar vertebrae and the first sacral vertebrae as a repeatable position for monitoring of the back fat layer in beagles, with the authors suggesting that ultrasonography was a reliable indicator of fat depositions. Despite this, ultrasonography has yet to be used for epidemiological studies. Other measures have been used in humans such as magnetic resonance imaging (MRI), underwater weighing and have been reviewed in detail by Lee and Gallagher (2008) Establishing the prevalence and identifying the determinants of overweight/obesity in companion animals Overweight/obesity presents particular challenges for the design of epidemiological studies. This section discusses the methods used for investigating the prevalence of overweight/obesity and then the determinants for overweight/obesity that have been identified. Prevalence is defined as the proportion of a population with a specific attribute/disease at a point in time (Thrusfield 2006). It is calculated by dividing the number of individuals with a specific attribute by the population size at that point. The prevalence is affected by both the duration of the attribute and the incidence (the number of new disease cases in a population per animal-time at risk). The duration of obesity can be variable but is often chronic so incidence (actual new cases) is likely to make up a small proportion of prevalence. Prevalence estimates for cats and dogs have been published in multiple countries including the United Kingdom, Australia, New Zealand, USA, France and Denmark. Studies assessing overweight/obesity in the canine population have been undertaken worldwide including 15
34 France, where 38.8% of dogs were overweight by veterinary assessment, Australia, where 25% of dogs were considered overweight by their owners and 41% overweight or obese by veterinary assessment and most recently in the UK, where 52% were either overweight or obese according to trained assessors (Holmes et al., 2007; McGreevy et al., 2005; Robertson, 2003). Prevalence estimates for overweight or obesity in cats vary between 18% and 52% (Russell et al. 2000). The most recent estimate for the UK found 48% of 168 cats were overweight and 4% were obese, based on a modified nine point scale (Russell et al. 2000). These estimates have been based on studies with major limitations which affect the inferences that can be made. These limitations are discussed in more detail below. The study population is the actual population of animals on which the study is conducted (Dohoo et al. 2003). Its attributes should be representative of the larger target population (the population to which the results of study will be extrapolated). These attributes include spatial factors such as geographical location, demographic factors e.g age and sex, and the type of population e.g owned cats versus vet visiting cats. Lack of representativeness affects the external validity of the study (the ability to make correct inferences to wider populations Dohoo et al. 2003). Also, studies have generally been confined to having small sample sizes leading to estimates of prevalence with relatively wide confidence intervals. This is a reflection of both resource constraints in small animal epidemiology and the difficulty in sampling companion animal populations. Many studies use vet visiting animals to investigate overweight/obesity rather than populations sourced from other means. The cat and dog population can be divided into three parts (those cats that are owned and visit veterinarians, those cats that are owned but don t visit veterinarians and those cats that are not owned). A recent study investigated factors influencing registration of cats with veterinary practices and found that 13.6% of cats were not registered (Murray & Gruffydd-Jones 2011). The percentage of cats not registered was associated with owner socio-economic status and was not geographically homogenous. Therefore studies based only on vet visiting cats are likely to introduce several sources of bias. Examples of other methods of BCS data collection include interviewer assessment of cats using a door to door survey (Cave et al. 2012). This method has the advantage that they sample a wider section of the cat and dog population and therefore maybe be generalisable to the broader owned animal population. BCS scores have also been collected by asking owners via questionnaires (e.g. Robertson 1999). For the reasons discussed in Section 1.2.5, the prevalence estimates for overweight/obesity based on these methods are likely to be a underestimate. Any study designed to estimate prevalence is reliant on sampling a representative sample of the population. This can be done in a number of ways but knowledge of the underlying population s demographics and geographical distribution is needed to ensure the sample is representative. This basic information is often lacking for companion animals. For instance, Murray et al. (2010) published the most recent estimate of the cat and dog population for the UK based on telephone interviews but this gave no detail on the age/sex/neutered status structure of the population. Studies into overweight/obesity have used both primary and secondary data. Primary data are data collected specifically for the purpose of the study while secondary data are data 16
35 collected for another purpose e.g. clinical records and insurance databases. The validity and reliability of secondary data are important in determining their usefulness. Egenvall et al. (1998) and Penell et al. (2007) showed the validity of insurance databases for cats, dogs and horses are adequate for epidemiological studies. No studies published to date have validated the use of clinical databases in small animal epidemiology. Husbandry may differ greatly between countries (Robertson 1999) and this may not allow the generalisibility of results between countries. For example, Robertson (1999) in Australia found no significant risk of overweight/obesity connected with dry food in cats, despite previous studies. Over 90% of cats in the study were fed dry food, meaning the size of the effect would need to be large to be detected. In contrast, a similar study found a lower prevalence of dry feeding in the United States and dry food was identified as a risk factor (Scarlett et al. 1994). Similarly, Colliard et al. (2006) found that 30% of dogs attending a vaccination clinic in France were fed some homemade food compared to 15.8% in a study by Edney and Smith (1986) in the United Kingdom. Several studies have shown that there are significant spatial differences in human overweight/obesity prevalences within Great Britain. Scotland and Wales have reported higher prevalences of adult and child obesity than England (Rennie and Jebb 2005). Regional variation has also been found within England (Moon et al. 2007). It is not known whether there are regional differences in feline or canine prevalence of overweight/obesity. Therefore it may not be correct to extrapolate findings from one region of a country to another. Lund et al. (2006) demonstrated geographical differences in canine obesity in the United States but did not show similar findings in the cat population (Lund et al. 2005). The majority of observational studies used to investigate associations between risk factors and overweight/obesity status in companion animals are cross sectional. Cross sectional studies involve the selection of individual animals from a larger population (Thrusfield 2006). The numbers of animals with and without the condition is then determined along with the presence and absence of proposed risk factors. The strengths of these studies are the provision of prevalence estimates, the ability to study multiple outcomes and exposures and that they are relatively inexpensive and quick to carry out. But there are also major drawbacks of using these studies to investigate overweight/obesity such as the potential for bias and confounding, the inability to establish a temporal sequence between exposure and outcome and reverse causation. Reverse causation is where the outcome affects the exposure rather than the exposure affecting the outcome and has been shown to be a major issue in investigating human overweight/obesity (Lawler et al. 2006). For example, this is likely to be an issue when exploring the associations between the conditions discussed in as it is difficult to identify whether the condition or overweight/obesity occurred first. Also, overweight/obesity is a state that is easily perceptible to owners. This perception can lead to alterations in lifestyle and result in spurious associations between obesity and risk factors. An example of this is the association seen between diet drinks and obesity in humans (Fowler et al. 2008). Cross sectional studies identify existing cases rather than new cases. This is problematic particularly for identifying risk factors for developing obesity as any association between risk factors and overweight/obese status can be influenced by the risk factor effect on survival. This problem is termed prevalence-incidence bias. Other issues in exploring risk factors for obesity are the 17
36 lag time between initial exposure to the risk factor and the development of overweight/obesity and the cumulative effect of an exposure on the likelihood of overweight/obesity developing. Also risk factors are likely to act together either additively or multiplicatively to result in obesity over time. However, cross sectional studies provide the strongest basis for estimation the prevalence of overweight/obesity within a population. Although cross sectional studies provide the best base for estimating the prevalence of overweight/obesity in companion animals, other observational study designs can provide information on risk factors for overweight/obesity. Cohort studies involve following n groups of animals over time that differ in their exposure to a putative risk factor and recording if and when the outcome occurs. They can be prospective or retrospective. The advantages include that multiple outcomes can be studied along with the sequence of events leading to the outcome, and incidence can be calculated. The disadvantages of these studies include difficulties studying rare diseases, loss of subjects to follow up and the expense involved. In prospective cohort study, exposure occurs before the outcome. They can allow the periodic collection of data on weight and body condition scores. This may improve the power and validity of studies and reduces the likelihood of recall bias (this is where past exposures are reported inaccurately). Therefore, in overweight/obesity, prospective cohort studies may be valuable for investigating nutritional factors. Cross sectional studies can not refute reverse causation while cohort studies can provide the best evidence to determine temporality between exposure and outcome. Case-control studies match subjects with the outcome of interest with subjects without the outcome of interest. The exposures to risk factors are then compared between groups. They are retrospective. Multiple risk factors can therefore be studied. They are useful for studying risk factors with a long latent period before development of the disease. Therefore, they are useful for examining the association between rare diseases and overweight/obesity. The disadvantages include only a restricted range of outcomes can be studied, there is a high likelihood of recall bias, and the problem of reverse causation. The selection of the controls is important as it can lead to selection bias. Studies have primarily depended on questionnaires administered by post, face to face or by telephone. Recall bias therefore presents a problem. Robertson (1999) considers this to affect particularly activities carried out infrequently such as the recall of foods given irregularly/infrequently preferentially compared to foods fed on a daily basis. Unlike in humans, there are few validated dietary questionnaires in dogs (Sallander et al. 2010). Owners may also be reticent to give information connected with certain sensitive characteristics such as income. Using categorical response scale may help to overcome this. However it can be difficult to measure the complex and multidimensional behaviours involved in obesity development. Another consideration is how overweight/obesity is diagnosed and defined. Some studies have used owner classification of overweight/obesity. Human studies have demonstrated that self classification of body shape is unreliable (Kuchler and Variyam 2003) and parents are inaccurate at classifying their child s body shape (Harnack et al. 2009). Therefore, owner ratings may be unreliable. This is discussed in more detail later in this review (Section 1.2.5). 18
37 Susser et al. (1998) criticised risk factor epidemiology generally as being confined to searching for multiple antecedent factors at the individual level. This approach therefore ignores the wider environment in which the individual lives and its potential input. Susser et al. (1998) advocates instead understanding at both the macro (societal/ecological) and micro level of the causation of disease. This criticism also can be levelled at recent studies in companion animal obesity. Observational studies have all focussed on individual risk factors with little effort directed on understanding the environment in which the animal lives. Risk factors associated with overweight/obesity in cats and dogs This section summarises the previous risk factors found for overweight/obesity in cats and dogs. Obesity is a complex and multifactorial condition resulting from genetic, metabolic, lifestyle, dietary, environmental and psychosocial factors. Apart from rare single gene mutations such as melanocortin-4 receptor gene mutations (Loos et al. 2008), none of these factors are necessary or sufficient to result in obesity but combinations of factors could create conditions sufficient for the development of obesity. But this complicates understanding the causation of obesity. This is exacerbated by the inconsistencies between the findings of epidemiological studies. This can be due to either inadequate power or study design or confounding/effect modification by population characteristics as previously discussed. Many studies into companion animal overweight/obesity have amalgamated potential risk factors into groups as it can help to understand the relative importance of inputs into the development and maintenance of overweight/obesity. Most studies have chosen to group risk factors into three groups: innate characteristics of the animal (sex, breed, age and neutered status), husbandry factors (feeding frequency, amount and type of exercise and access to outdoor space), and owner characteristics (income, gender, type of relationship with animal, housing type, location). For example, Bland et al. (2009) classify dog level factors into 3 groups: genetic pre-disposition, reproductive management, and dietary/exercise management. Allan et al. (2000) also used 3 groups (cat characteristics, environmental/management variables and feeding variables). More recently, Michel and Scherk (2012) divided risk factors associated with feline overweight/obesity into 3 groups: those related to the owner; those related to the cat itself; and those associated to the cat s environment. Risk factors can also be divided into the 3 groups seen in the ecological triad seen in Figure 1.1; host (e.g. sex,neutered status and age), vectors (e.g. nutritional factors), and environment (e.g. urban/rural location). However, the three group model has not been followed by all studies. For instance, Buffington (2002) uses internal and external influences to describe risk factors for feline obesity. Dividing risk factors into three groups does not recognise how risk factors interact together between and within groups to modify an individual s risk of overweight/obesity. Some human obesity risk factor studies use the terms modifiable and non modifiable for risk factors (Must et al. 2009). These terms may be useful to use in companion animal epidemiology as they imply the ability to alter or not the exposure to change an individual s risk of overweight/obesity. Age 19
38 The risk of overweight/obesity in cats and dogs appears to follow an inverted U shaped relationship with age. Studies to identify age as a risk factor for obesity include Scarlett et al. (1994), Sloth et al. (1992), Kronfeld et al. (1994), Robertson (1999), Russell et al. (2000), Lund et al. (2005), Lund et al. (2006), and Colliard et al. (2009). The increase in risk with age may be associated with a decrease in maintenance energy requirements in dogs. This is mediated through decreased physical activity and a decrease in basal metabolic rate associated with age related changes in body composition (Harper 1998; Laflamme & Ballam 2002). In cats, a similar relationship is seen in the risk of overweight/obesity and age. Bermingham et al. (2010) showed that energy requirements were higher in younger cats (<2 years) than adult cats (2 to 7 years) while adult cats above 7 years had the same energy requirements as those aged 2 to 7 years. Cats aged 12 to 14 years needed less energy but it is hypothesised that this is probably due to a reduction in digestive ability rather an actual reduction in energy requirements (Taylor et al. 1995). Harper (1998) suggested that cats are unique in that they experience no age related decline in energy requirements. Sex Female dogs have been found by several studies to be more likely to be overweight or obese than male dogs (Colliard et al. 2006; Edney and Smith 1986; Holmes et al. 2007; McGreevy et al. 2005). Male cats, in contrast, were at higher risk of obesity than female cats (Lund et al. 2005; Scarlett et al. 1994; Sloth 1992; Robertson 1999). Robertson (1999) proposed that the larger body frames of male cats may led to owners misclassifying them as overweight. Neutered status Studies in cats and dogs from multiple countries have identified neutered status as a risk factor (Colliard et al. 2009; Fettman et al. 1997; Holmes et al. 2007; Kanchuk et al. 2002; Lund et al. 2006; McGreevy et al. 2005; Nguyen et al. 2004; Robertson 1999, Robertson 2003; Russell et al. 2000). Hypotheses for this increased risk in neutered animals include a decrease in metabolic rate, alterations in feeding behaviour (Fettmann et al. 1997) and reduced physical activity (Sloth et al. 1992). Cave et al. (2007) suggested that gonadal oestrogen was important for the regulation of food intake in cats and oestrogenic compounds could inhibit adipogenesis and promote lean tissue development in neutered cats. Interpreting the impact of neutering on obesity/overweight prevalence is difficult as neutering has been found to be related to several other animal and owner risk factors for overweight/obesity in cats and dogs (Murray et al. 2009; Trevajo et al. 2011). Early neutering has recently been advised to help population control. Howe et al. (2000) found no difference in owner perceived obesity between cats neutered before 24 weeks and those neutered after but these cats were only followed for a short time period (3 months following neutering). In addition, Salmeri et al. (1991) found no differences in the amount of lumbar fat, weight gain or feed intake between dogs neutered early (at 7 weeks) and at the traditional age (at 7 months) in a 15 month prospective study but this study included only 32 dogs. However, a retrospective population study of 1842 dogs followed for up to 11 years 20
39 found that neutering of dogs before 6 months of age was associated with lower prevalence of obesity compared to neutering of dogs after 6 months of age (Spain et al. 2004). Other conditions or diseases Lund et al. (2006) described the following diseases as being associated with overweight status in dogs - hyperadrenocorticism, ruptured cruciate ligament, hypothyroidism, lower urinary tract disease, and oral disease, and the following conditions as being associated with obesity - ruptured cruciate disease, hypothyroidism, diabetes mellitus, pancreatitis and neoplasia. Panciera (1994) identified that around 40% of dogs with hypothyroidism were overweight while Martin et al. (2006) found 11 of 31 clinically normal obese dogs had low thyroidstimulating hormone (TSH) and baseline free thyroxine (T4), therefore suggesting a diagnosis of hypothyroidism. Feline obesity has been linked to a multitude of diseases including hepatic lipidosis (Marks et al. 1994), feline urinary tract disease (Willeberg & Priester, 1976) and dermatological conditions (Scarlett & Donoghue 1998). Obese cats were found to be 3.9 times more likely to develop diabetes, 4.9 times more likely to develop lameness and 2.3 times more likely to have non-allergic skin conditions, compared with cats of optimal body condition (Scarlett & Donoghue 1998). As previously discussed in Section 1.1.3, overweight/obesity are more likely to result in many of these diseases although certain conditions, such as the endocrinopathies, may predispose to the development of overweight/obesity. Drugs and treatments Iatrogenic causes of obesity include pharmaceutical agents and certain procedures. Drugs known to be associated with obesity include anticonvulsants, glucorticoids, and progestagens. Procedures such as bilateral thyroidectomy can lead to hypothyroidism that then predisposes to obesity. Breed Certain breeds of dogs appear to be at higher risk of overweight/obesity than others. Edney and Smith (1986) observed that Labrador retrievers, Cairn terriers, Dachshunds, Shetland sheepdogs and Beagles were breeds at risk for development of obesity. Decreased risk appeared to exist in German shepherd dogs, racing greyhounds, Yorkshire terriers and Dobermanns (Edney and Smith 1986). Lund et al. (2006) also found that certain breeds were more likely to be overweight (Labrador/Cocker spaniel/dalmatians/ Dachshund/ Rottweiler/ Golden retriever/ Shetland sheepdog/ Mixed breed) and more likely to be obese (Labrador/Dachshund/Golden retriever). Colliard et al. (2006) also found retrievers were more likely to be overweight. Breed was also a risk factor in studies of feline overweight/obesity. Colliard et al. (2009) found purebred and longhaired at decreased risk but Persians were overrepresented in the study population. Lund et al. (2005) identified domestic short haired, domestic long haired, mixed and Manx cats as risk factors for obesity. Crossbreeds have also been found to be 21
40 associated with overweight/ obesity by Scarlett et al. (1994) and Robertson (1999). Häring et al. (2011) recently calculated a heritability of 0.41 (±0.06) for overweight status in an experimental cat population and hypothesised a polygenic origin. Other animals and number of people in the household Robertson (1999) found that cats in households with 1 or 2 cats were more likely to be overweight/obese compared to cats in households with more than 2 cats. The study hypothesised that cats not in multiple cat households have less competition for food and reduced opportunities for play and fighting. In contrast, Bradley and Harper (2000) identified cats that lived in household with 4 or more cats had a higher mean body condition score than cats living in households with 3 or fewer cats. They suggested that this may reflect increased stress in multi-cat households as cats housed in groups don t appear to develop social hierarchies or have conflict resolution strategies unlike other species such as dogs. This view is strengthened by the findings of Bernstein and Strack (1996) who found that cats in multi-cat households tended to avoid each other and that this may result in decreased activity. The picture is also confused when assessing the effect of dogs on the risk of feline obesity. Russell et al. (2000) described an increased risk of obesity in cats living in the same household as dogs while Allan et al. (2000) found a decreased risk of obesity in cats in households with dogs. Allan et al. (2000) went on to discuss the possible reasons behind this. These included that dogs may prevent cats from eating or cat owners without dogs may have different relationships with their cats than cat owners with dogs. For dogs, the number of people within a household may affect risk of overweight/obesity. Bland et al. (2009) found that the mean number of people per household was lower in households with normal weight dogs compared to households with overweight/obese dogs. Activity levels and confinement indoors The level of activity greatly impacts on the energy maintenance requirements of an animal (Markwell et al. 1994). Several studies have found an association between activity levels or indoor confinement and overweight/obesity in cats (Kikuchi et al. 2010; Scarlett et al. 1994; Sloth 1992; Robertson 1999). Owners of normal weight cats have been found to play with their cats more often than owners of overweight cats (Kienzle and Berger 2006). Robertson (2003) described a 10% reduction in the odds of canine obesity for each additional hour of exercise while Bland et al. (2009) found that frequency of exercise (weekly versus daily) and confinement to a yard were associated with canine overweight/obesity. Interestingly, Cutt et al. (2008) found that the amount of exercise a dog received was more affected by environmental constraints than internal owner motivations. Thermogenesis is one of the contributory factors to energy expenditure; therefore, ambient temperature may be an important determinant of energy requirements. The zone of thermal neutrality (the temperature range where heat production and heat loss to the environment are in equilibrium) in dogs is C and C in cats. Energy expenditure occurs when the ambient temperature moves outside this zone. Finke (1991) showed that average daily energy intake increases with decreasing temperature in outdoor kennelled dogs. 22
41 Feed types Cats and dogs can be fed a combination of dry and wet food. Dry food tends to be energy dense and higher in carbohydrate, while wet food is lower in energy density and higher in protein. Dry food is associated with canine and feline obesity (Mason 1970; Scarlett et al. 1994; Robertson 1999). This may be due to its high energy density compared to other feed types. Feeding snacks and treats can result in excess calorie intake and it has been found to be a risk factor for obesity in cats (Bradley and Harper 2000), and dogs (Bland et al. 2009). Owners who fed table scraps were more likely to have overweight dogs (Heuberger & Wakshlag 2011). Heuberger and Wakshlag (2011) found differences in the kcal consumed per kilogram of bodyweight. They also described that lean dogs consumed more crude fibre compared to overweight dogs. Another contributing factor could be varying calorie content of different pet food brands as found by Linder and Freeman (2010). One major difficulty is in the assessment of the role of diet and feeding routine as risk factors for overweight/obesity is the reliance on accurate owner recall of feeding history. Underestimation of energy intake is likely to occur, especially when asking about infrequently fed items or if the animal has access to other sources of food. For instance, Legrand-Defretin (1994) estimated that a bowl of milk can represent 15% of the energy requirement of cats and a mouse carcase 30% for a 4kg cat. German et al. (2011) also described imprecision and inaccuracy in owner use of measuring cups for dry kibbled food leading to overfeeding. Feeding frequency Feeding frequency is associated with canine obesity (Bland et al. 2009), with frequency of feeding increased in overweight dogs compared to normal weight dogs. Castronguay (1981) and Kane et al. (1981) found that cats offered diets of identical palatability but different calorie intakes quickly adjusted the amount of food to maintain a constant calorie intake. Thorne (1982) also demonstrated that cats had a similar ability to adjust calorie intake with foods with different water content. Harper et al. (2001) showed that female neutered cats given ad-libitum food increased in bodyweight by 30% in 12 months compared to an 8% increase in cats with controlled access to food. Several studies have identified increasing frequency of feeding as a risk factor for feline obesity (Harper et al. 2001; Kienzle and Berger 2006; Robertson 1999). The association between ad libitum feeding and frequency of feeding in cats has not been found consistently, with some studies identifying the risk factor (e.g. Harper et al. 2001; Russell 2000) while others found no association (e.g. Cave et al. 2012; Colliard et al. 2009; Scarlett et al 1994). Housing Apartment dwelling cats are thought to be at more risk of overweight/obesity compared to non apartment dwelling cats (Scarlett et al. 1994). Also, being confined indoors has been found to be a risk factor for feline overweight/obesity (Robertson 1999; Sloth et al. 1992). But Colliard et al. (2009) did not find an association with indoor living, although this may be due to the urban study population. Buffington (2002) attributed the association with indoor living to inactivity and boredom. Also an indoor environment has been suggested to be monotonous for cats, leading to stress (Van Rooijen 1991). 23
42 The type of housing has also been significantly associated with canine overweight/obesity, with dogs in apartments being at greater risk of overweight/obesity at the univariable level (Colliard et al. 2006). McGreevy et al. (2005) found that dogs from rural and semi rural areas were more likely to overweight/obese than urban or suburban dogs. Owner characteristics Joshua (1970) was the first published study to suggest a link between owner socio-economic factors and dog obesity, while Mason (1970) described how the prevalence of obesity increased with owner age. More studies have subsequently explored the relationship between owner factors and canine overweight/obesity. Owner overweight status has been associated with overweight/obesity in dogs (Holmes et al. 2007; Kienzle et al. 1998; Nijland et al. 2010; Peña et al. 2008). Colliard et al. (2006) linked owner age and retired owners with canine overweight/obesity. Holmes et al. (2007) and Suarez et al. (2011) also identified increasing owner age as a risk factor for canine obesity. Heuberger and Wakshlag (2011) found that overweight status in dogs was associated with overweight in older owners ( 60 years) and poorer health in these owners. Younger dog owners were more likely to have overweight dogs if they themselves were obese. Similarly, owner age has been found to be a risk factor for feline obesity (Heuberger & Wakhshlag 2011). In the study by Kienzle et al. (2006), no difference in age, number of people within the household, owner education level, owner profession, or owner income was found between overweight and normal cats. But Kikuchi et al. (2010) described that owners over 60 years old were more likely to have cats that were overweight and Colliard et al. (2009) found that cats with owners between 40 and 60 years old were more likely to be overweight than cats with owners in other age groups. In contrast to dog owners, the overweight status of cat owners was not related to the overweight status of their animal (Nijland et al. 2010). Owner factors such as age and income are not likely to be directly linked to canine overweight/obesity. Instead they are likely to modify the relationship with animal factors such as diet and exercise. Dotson and Hyatt (2008) described how owner demographic factors such as age, gender, and education level affect the type of relationship between a dog and its owner. This is likely to be relevant to canine overweight/obesity. Owners who are less attached to their dog have been found to be less likely to take their dog for a walk (Schofield et al. 2005). There have been a number of studies that have pointed to a different relationship between overweight dogs and their owners (Kienzle et al. 1998) or different owner attitudes to nutrition and exercise (Rohlf et al. 2010). Kienzle et al. (1998) found that the human-animal bond between overweight dogs and their owners was no closer than non overweight dogs and their owners but the study did find evidence of over humanising in the relationship between overweight dogs and their owners. Suarez et al. (2012) described how owners of overweight dogs were more likely to be influenced by special offers and low cost when deciding what to feed their dogs, while owners of non overweight dogs are more likely to choose based on presentation, quality and composition. The authors suggested that owners of overweight dogs were less interested in nutrition. As other studies have shown that overweight owners have overweight dogs (Holmes et al. 2007; Kienzle et al. 1998; Nijland et al. 2010), Suaraz et al. (2012) proposed that there 24
43 may be a link to owner attitude to their own nutrition. Kienzle and Berger (2006) suggested that the relationship between owners and overweight cats and owners and normal weight cats differed. In particular, they hypothesised that owners with overweight cats had closer relationships with their pets. Elements suggestive of over humanisation and cats being substitutes for human companionship were present in these relationships. It has also been suggested that there may be differences in the relationship between overweight pets and their owners between cats and dogs, with closer relationships being more common with overweight cats (Kienzle and Berger 2006) than with overweight dogs (Kienzle et al. 1998). Rohlf et al. (2010) described how dog owner attitudes predicted feeding and exercise intentions and behaviours. They used the theory of planned behaviour (TPB) which links attitudes with intentions and then with subsequent behaviours (Ajzen 1991). TPB states that these intentions are predicted by behavioural attitudes (positive or negative beliefs held about the behaviour), subjective norms (how important others may perceive the behaviour and how much the individual wants to conform to the beliefs of others) and perceived behavioural control (the individuals perception of the difficulty of carrying out the behaviour). Intentions to feed and exercise appropriately were best predicted by behavioural beliefs and control beliefs but not normative beliefs. The authors described how the knowledge will be useful for the formulation of interventions. Geographical differences Lund et al. (2006) found geographical differences in the prevalence of canine obesity in the United States, while Lund et al. (2005) found no geographical differences in feline obesity/overweight prevalence in the United States. Within countries, studies have shown that rural dogs are at increased risk compared to urban dogs (McGreevy et al. 2005). Other risk factors Other risk factors described in cats include hunting behaviour, owners reporting the cat being fed elsewhere, and owner misinterpretation of behaviour in cats. Other studies have identified owner underestimation of body condition in companion animals as a risk factor (Allan et al. 2000). This is discussed later in this literature review Overweight/obesity in other companion animal species. Overweight/obesity has been described in several other companion animal species such as horses (Wyse et al. 2008; Thatcher et al. 2008) and small mammals such as rabbits (Harcourt- Brown 2002). Obesity in these species is likely to represent as serious a welfare issue as in cats and dogs. But compared to canine and feline obesity, there is less published literature on equine or pet rabbit obesity. Adiposity in the horse can be assessed through measures of bodyweight (Ellis & Holland 1998) and morphometric techniques such as body condition scoring (Henneke et al. 1983; Webb and Weaver 1979). The limitations to these methods in horses (see Carter et al for a detailed discussion) are similar to those previously described for cats and dogs. Estimates 25
44 of prevalence of overweight/obesity in leisure horses in Great Britain have been 20.6% based on a sample of 160 (Stephenson et al. 2011) and 45% based on a sample of 319 (Wyse et al. 2008). No epidemiological studies have formally explored risk factors for overweight/obesity in horses. The concept of owner misperception of body shape has been evaluated in horse owners. Stephenson et al. (2011) found that owners were most likely to underestimate their horse s body condition while Wyse et al. (2008) described only fair agreement between owner s perceptions and the actual body condition score. Both studies recruited horses from small geographical areas, limiting the ability to generalise their findings to the wider equine population. As with cats and dogs, obesity in horses is associated with several co-morbidities such as laminitis (Treiber et al. 2006) and strangulating lipomas (Watson et al. 1992). Rabbit body condition scoring systems have been described for commercial production (Cardinali et al. 2008) or have been aimed at owners and not fully validated i.e. PFMA Size- O-Meter ( There are few peer reviewed studies investigating pet rabbit obesity. In a study of 52 rabbit owners, Edgar and Mullan (2011) found that many rabbit owners had a limited knowledge of rabbit dietary requirements. Rabbit obesity has been anecdotally associated with several health disorders of rabbits such as myiasis, pododermatitis, pregnancy toxaemia, gastrointestinal stasis and ileus (Harcourt- Brown 2002) Management of overweight/obesity Ultimately, the goal of studies into the epidemiology of canine and feline overweight/obesity is to formulate effective prevention and treatment strategies. Obesity management in humans can involve dietary modifications, pharmacological agents, exercise, behavioural therapy, and surgery. The three main treatments used in companion animal obesity management are dietary management, lifestyle management, and drug therapy. Disappointingly, weight loss is often temporary, with weight regain occuring in around 50% of obese dogs following successful weight loss (German et al. 2012). Dietary management This primarily involves calorie restriction while ideally maintaining essential nutrients in the diet and promoting fat loss and not lean tissue loss. Weight loss relies on establishing a negative energy balance therefore ideally individual energy requirements are determined as accurately as possible. Mean energy requirements for weight loss in dogs are 60% of the calories needed at target bodyweight while cats require around 32kcal per kg of target bodyweight for weight loss (German 2006). Diets with high levels of both protein and fibre have the greatest effect on satiety in dogs when compared to diets high in either protein or fibre (German et al. 2010a) and have been shown to result in successful weight loss (Blanchard et al. 2004). Protein has a higher thermic effect than carbohydrate. This means that energy expenditure is higher in digestion and processing of protein than of carbohydrate. Dietary fibre has very low energy density and is used to bulk out the food. In cats, protein 26
45 levels drive food intake; therefore, feline diets should be moderately high in protein and fibre. Water in the form of canned food may further reduce the energy density. Weighing the amount of food for an animal has been found to be more accurate than other methods such as measuring cups (German et al. 2011) and therefore helps to control calorie intake. As previously discussed, the feeding of snacks/treats and table scraps are connected with the development of overweight/obesity. Therefore, excluding these may help retain a neutral or promote a negative energy balance. Drug therapy Microsomal triglyceride transfer protein is involved in the process of incorporating fatty acids and protein into cylomicrons in the cytoplasm of enterocytes. Two microsomal triglyceride transfer protein inhibitors (dirlotapide (Slentrol, Pfizer) and mitratapide (Yarvitan, Janssen Pharmaceutica) are currently licensed for use in dogs for up to 12 months. The inhibition of this protein leads to a reduction in fat absorption. The intracellular accumulation of these fatty acids leads to peptide YY release from the enterocyte. Peptide YY then results in appetite suppression and this is thought to account for 90% of the weight loss attributable to dirlotapide (Wren et al. 2007). Wren et al. (2007) showed a 10% reduction in food intake in clinical trials. Side effects occur in up to 20% of patients (Gossellin et al. 2007) and include diarrhoea and vomiting. Unless lifestyle changes occur, rapid weight gain will occur once treatment is ceased. Nutraceutical therapy is also used in obesity management despite conflicting evidence on their efficacy (Laflamme 2006). L-carnitine has been used to enhance fat metabolism and maintain lean muscle mass. Lifestyle management Exercise is beneficial for weight loss through raised metabolic rate, increased fat loss and preservation of lean tissue. Increasing amounts of exercise have been reported to decrease the risk of being overweight (Bland et al. 2009) and helps in weight loss (Chauvet et al. 2011; Trippany et al. 2003). Environmental enrichment and play in cats increases activity levels which may, in turn, benefit weight loss (Clarke et al. 2005; Trippany et al. 2003). Owner counselling Owner related factors are regarded as a major contributor to the development of overweight/obesity (Bland et al. 2009; Bland et al. 2010) and therefore understanding these factors is likely to be extremely important for successful weight management. Owner non compliance with weight loss advice is likely to lead to failure (Gentry 1993; LaFlamme et al. 1995) with German et al. (2011) stating that changing owner behaviour was imperative for successful and long term weight loss. Interestingly, Bland et al. (2010) discussed the disparities in expectations between owners and veterinarians in how to achieve weight loss. This emphasised the need for clear communication between owners and veterinarians. 27
46 Owner education in animal husbandry and nutrition may be an important component of obesity management, although it should be noted that Yaissle et al. (2004) previously found no added benefit from incorporating owner education on nutrition into obesity treatment protocols. In addition, Bland et al. (2009) found that awareness of the health risks of obesity was not associated with canine obesity. Human public health literature has also shown that the amount of nutritional knowledge an individual has is not associated with obesity but a negative perception of obesity is protective (Harris (1983) and Gordon-Larsen (2001)). Owner education on dog body shape Many owners are reluctant to acknowledge that their pet is overweight. Freeman et al. (2006) found that, although many owners thought their animals were obese, only 8% of owners reported obesity as a problem in their pets. Understanding the individual human-animal bond is an important aspect in changing owner opinion and behaviour (Sibley 1984). Body shape misperception is where there is a mismatch between self perceived and actual body shape. This misperception is important in human obesity management and prevention (Kuchler and Variyam 2003). This is because it has implications for advice to individuals and public health campaigns as behaviour change is motivated by an individual s perception of risk. Generally males underestimate and females overestimate their weight status (Kuchler & Variyam 2003). The prevalence of body shape misperception has increased between 1997 and 2007 in parallel with rising obesity prevalence (Johnson et al. 2008), either due to increasing stigma attached to being overweight or changing perception of what constitutes a normal body shape. Risk factors for body weight misperception have included gender, age and level of education (Kuchler and Variyam 2003). Body weight perception has also been described when parents rate their child s body shape (Harnack et al. 2009). Factors associated with underestimation of weight status by parents include the child s age, rapid weight gain in infancy, the mother s and child s higher weight status, and lower educational attainment. Parental misclassification of the child s weight status has been found to impede healthy body weight management of children (Mathieu et al. 2010). This is pertinent to owner misperception of an animal s body shape as, like parents, owners have control of many aspects of an animal s environment and therefore altering owner behaviour is essential for successful and long term weight loss and management (German et al. 2011). There are few published studies formally investigating body shape misperception in dog owners despite dog owners misperceiving their obese dog s body shape being previously suggested by Mason (1970) and Holmes et al. (2007). Singh et al. (2002) used a logistic regression equation to describe the probability of a dog being overweight. Along with other factors, the equation contained the owner perception of body condition score multiplied by 1.7, implying owners were likely to underestimate body condition score. Despite many studies showing the importance of body shape misperception to human obesity prevention and treatment (Kan & Tsai 2004), a recent study of veterinarians in Victoria, Australia, found only 3% thought the owner perception of ideal weight was an important factor in canine obesity (Bland et al. 2010). 28
47 Body shape misperception has also been found in cat owners (Allan et al. 2000; Colliard et al. 2009; Kienzle et al. 2006; Kikuchi et al. 2010). Underestimation of body shape has also been found to be associated with overweight/obesity in cats (Allan et al. 2000; Colliard et al. 2009; Kienzle et al. 2006) Prevention of overweight/obesity Disease preventive measures can be grouped into 3 categories: primary, secondary and tertiary (Gordon 1974). Primary prevention This is where overweight/obesity is prevented before its biological onset. In child obesity, primary preventive measures include regular and accurate measurements, following current dietary and exercise guidelines and limits on consumption of energy dense food. Current primary preventive measures carried out in cats and dogs are based on regular body condition scoring of animals, education about overweight/obesity and associated risks including educating owners on correct animal body shape, advice on avoiding weight gain after neutering and during middle age and promoting a healthy lifestyle (German 2006). American Animal Hospital Association (AAHA) recommends increased activity, tailoring calorie intake to lifestyle and conditions, environmental enrichment, lowering the energy density of food, portion control, and introduce foraging devices and barriers to food access to prevent feline obesity (Hoyumpa Vogt et al. 2010). WSAVA Nutritional Assessment Guidelines advised that a nutritional assessment and specific nutritional recommendations for each animal at every presentation. Nutritional risk factors evaluated at this assessment should include age, body condition score, muscle loss, diet, feed management, environmental factors, medical conditions and appetite changes. German and Morgan (2008) found that body condition scoring was rarely carried out in first opinion practice. Secondary prevention Secondary preventive measures involve lowering the rate of established cases within the population. This would involve the measures previously described in the management section. Carciofi et al. (2005) cited factors such as lack of time to exercise the dog and the cost of specialised dog foods as barriers preventing compliance with weight loss advice. Tertiary prevention These preventive measures stabilise or reduce the amount of co-morbidities and the reduction of quality of life associated with the disorder. In dogs and cats, this may include measures 29
48 to reduce the impact from osteoarthritis in overweight dogs (Mlacnik et al. 2006) or reduce the risk of hepatic lipidosis in cats. One issue with this categorisation is that it focuses primarily on changing or modifying individual owner behaviour and potentially ignores the impact of environmental factors. Ecological models of obesity, such as Egger and Swinburn (1997) in Figure 1.1, may help to guide the formulation of successful preventive measures and interventions. Evidence based medicine techniques have been applied to veterinary clinical nutrition (Roudebush et al. 2004). The hierarchy of evidence pyramid ranks evidence from strong (randomised controlled studies and systematic reviews) to weak (case series). It is based on principle of causation and bias. Recently, quality of evidence guidelines adapted from US Preventive Services Task Force have been applied to veterinary medicine (Marshall et al. 2010; Roudebush et al. 2008). In this methodology, the quality of evidence is categorised into grades from Grade I (evidence obtained from at least 1 randomised controlled study in the target species with naturally occurring disease) to Grade IV (evidence obtained from 1 or more sources such as clinical opinions and descriptive studies ) (Roudebush et al. 2004). Roudebush et al. (2008) discussed the application of this evidence grading system to current weight management strategies. The strongest evidence exists for therapeutic foods designed for weight management and for drugs such as dirlotapide. Formulating preventive measures, therefore, relies on accurate findings from epidemiological studies. 1.3 Background to the thesis The review of the literature identified several apparent knowledge gaps in the literature. This thesis concentrates on some areas requiring further investigation:- No peer reviewed/published prevalence estimates were available for overweight/obesity in cats, dogs or rabbits from nationally distributed study populations in Great Britain. No published or peer reviewed studies investigated spatial variation in overweight/obesity prevalence for cats, dogs and rabbits in Great Britain. The majority of risk factor studies have concentrated on identification of risk factors rather than quantifying their impact on the prevalence of overweight/obesity. The lack of any published information on the prevalence or risk factors for pet rabbit overweight/obesity. Little assessment of owner related risk factors for canine or feline overweight/obesity in populations in Great Britain. Sparse literature reviewing whether the concept of body shape misperception was relevant to canine and feline overweight/obesity. 30
49 1.3.1 Thesis objectives The main objectives of this thesis were to: Provide up to date prevalence estimates for overweight/obesity in cats, dogs and rabbits in Great Britain. Explore the spatial variation in overweight/obesity prevalence in cats, dogs and rabbits in Great Britain. To determine the impact of non modifiable risk factors such as sex, age and neutering on the risk of being overweight/obese in cats and dogs in Great Britain. Provide an initial investigation into the risk factors associated with overweight/obesity in rabbits in Great Britain. Investigate associations between modifiable and non modifiable risk factors and obesity/overweight status in cats. Establish the prevalence and explore risk factors associated with owner incorrect assessment of canine and feline body shape Thesis outline This thesis is divided into 7 further chapters. The second chapter describes and discusses the general method and datasets used in the subsequent chapters. Chapter 3 looks at the prevalence and spatial distribution of overweight/obesity in dogs from a national database. These data are then used to investigate non modifiable risk factors such as age, sex and neutered status in this dog population. The fourth chapter repeats this analysis using practice records from rabbits and cats. Chapter 5 then expands the risk factor analysis for canine overweight/obesity by looking at modifiable risk factors for overweight/obesity such as owner factors and investigates the effect of changing definitions of overweight/obesity on the risk factors identified. Chapter 6 explores the concept of owner incorrect assessment of their dog s body shape (misperception) and explores potential risk factors for this. Chapter 7 uses data gathered from cat owners in veterinary practice to explore modifiable risk factors for feline overweight/obesity and assesses the concept of owner incorrect assessment of feline body shape. Finally, the general findings, their limitations and suggestions for further studies are discussed in Chapter 8. 31
50 Chapter 2 General Materials and Methods 2.1 Introduction The objectives of this thesis were to describe the prevalence of overweight/obesity in cats, dogs and rabbits in Great Britain and identify possible risk factors associated with the condition. Chapter 3 and 4 used a database from a nation wide practice group to describe the prevalence of canine and feline overweight/obesity, investigate spatial differences in prevalence and identify animal demographic risk factors. Chapters 5 and 7 then go on to evaluate both animal related risk factors and owner related risk factors from cross sectional studies of cat and dog owners visiting veterinary practices in Glasgow. Chapter 6 and 7 use the same data to investigate whether the concept of body shape misperception occurs in cats and dogs. 2.2 Data collection Two data collection methods were used. Chapters 3 and 4 are based on secondary data whereas Chapter 5, 6 and 7 used primary data collection. The sources of data are described below Data for Chapter 3 and 4 The data were collected from a nation wide database consisting of 47 primary companion animal practices in a nationwide charity veterinary group (Figure 2.1). Thirty eight practices were in England, 5 practices were in Scotland, 3 practices were in Wales and 1 practice was in Northern Ireland. The practices in England were distributed among 9 regions: East (2 practices), East Midlands (3 practices), London (6 practices), North East (4 practices), North West (4 practices), South East (6 practices), South West (3 practices), West Midlands (5 practices) and Yorkshire and Humberside (5 practices). Each record corresponded to an animal (cat, dog and rabbit) presenting for a veterinary consultation. Data consisted of body condition score (BCS) from a 5 point scale, sex/neutered status, age, location of practice and date of birth of animals presenting at each of 11 32
51 Figure 2.1 Location of practices used to gather data for Chapter 3 and 4 33
52 time points throughout 2008 and These time points were: 01/02/2008, 30/4/2008, 31/07/2008, 03/11/2008, 02/02/2009, 30/04/2008, 02/08/2009, 02/11/2009, 02/02/2010, 30/04/2010 and 31/07/2010. The aim was to have each time point 90 days apart in order to minimise the number of individual animals presenting more than once. This was varied to avoid weekends and bank holidays. The time varied between 87 to 94 days with a mean of 91 days and a standard deviation of 3. Animals were rated at each veterinary consultation using a widely used, familiar 5 point scale (1=Very underweight, 2=Thin, 3=Ideal, 4=Overweight, 5=Obese) by the attending veterinarian. Animals were divided into two groups based on this score. Overweight/obese animals were defined as animals with a BCS greater than 3 while non overweight animals were classed as all animals with a BCS of 3 or under. Not all records were complete. The data were provided as a download from the practice group. It is unknown the proportion of consultations of the recording days that were not included in the data. Further details are given in Chapter 3 and Data for Chapter 5 and 6 A questionnaire was developed and distributed to two different practice types in July 2007; first, to a single charitable first opinion small animal veterinary practice and second, to four private first opinion veterinary practices. The questionnaire is available in Appendix A. Questions were included based on previous literature and the questionnaire was designed by Helen Ternent. All practices were located in and around the Glasgow area. The survey ran for five consecutive weeks. The questionnaire was part of a larger study into canine nutrition from which some results have been previously published (Thomson et al. 2008). The questionnaire was laid out in several clear sections and consisted of both open and closed questions. Detailed questions were asked about the dog s signalment and diet including how often the dog was fed, with what type of food and whether it was fed table scraps, snacks and treats. Owners were also asked whether they were aware of health risks associated with canine obesity. Finally, owners provided details about their own age, the amount they exercised their dog and their annual household income. The questionnaire took around 15 minutes to complete. Each dog had a body condition score (BCS) assigned by one of the participating veterinary surgeons or a veterinary student trained in this procedure using published guidelines (German et al. 2006). A morphometric technique was chosen, and was adapted from S.H.A.P.E (Size, Health And Physical Evaluation) for the obesity assessment (Figure 2.2). The algorithm (Waltham Shape Guide for Dogs 2009) was provided to all participating practices. The numbers from one to seven were interpreted in numerical order as 1: extremely thin (the dog has a very small amount or no total body fat), 2: thin (the dog has only a small amount of total body fat), 3: lean (the dog is at the low end of the ideal range with less than normal body fat), 4: ideal (the dog has an ideal amount of total body fat), 5: mildly overweight (the dog is at the upper end of the ideal range with a small amount of excess body fat), 6: moderately overweight (the dog has an excess of total body fat) and 7: extremely overweight 34
53 (the dog has a large amount of excess total body fat that is affecting its health and well being) (Waltham Shape Guide for Dogs 2009). 35
54 36 Figure 2.2 Adaptation of S.H.A.P.E. canine body condition scoring system used in Chapter 5 and 6
55 The questionnaire was pretested on a group of staff and students at the University of Glasgow, School of Veterinary Medicine who were asked to comment on the understandability and the overall design of the questionnaire. This feedback led to minor refinement of the questionnaire. Conventional validation of the majority of the questionnaire was impossible as it recorded owner perceptions and opinions, rather than facts verifiable by alternative means. Other components of the questionnaire were also difficult to validate due to their sensitive nature, such as personal income; but, suitably wide ranges were specified to allow owners to feel comfortable about the resolution at which such disclosures were made. On-the-spot visual validation of the dog s signalment by the interviewer was taken to indicate that the owner was providing information about the correct animal. The objectives and methods were carefully explained to all practices taking part in the study, and the questionnaire was approved by the University of Glasgow Ethics Committee. The questionnaire was distributed to owners who agreed to take part in the survey by the veterinary student or veterinary surgeon, in the waiting area during normal consultation hours and each dog was only included in the study once. In addition, only one dog per household was included. Either a veterinary surgeon or veterinary student administered the questionnaires. The survey ran for five consecutive weeks Data for Chapter 7 This questionnaire survey took place in one first opinion charity practice in Glasgow during a 3-week period in July Owners of cats over 1 year old were asked to complete a short questionnaire (see Appendix B) which included questions about signalment, feeding and lifestyle. One questionnaire was completed per household and only closed questions were included. A veterinary student trained in the procedure assessed BCS of cats using a five point body condition scoring system both visually and by palpation over ribs and abdomen as previously described by LaFlamme (1997). Animals with a BCS of 1 were classed as very thin, 2 as thin, 3 as ideal, 4 as overweight and those with a BCS of 5 as obese. The objectives and methods were explained to the participating practice and the study was approved by the University of Glasgow Ethics and Welfare Committee. Owners, without being given any guidance, were asked to assign their cat to one of the following word descriptions: far too thin, a bit thin, just right, a bit overweight or very overweight. 2.3 Data analysis All data analyses were carried in R (The R Foundation for Statistical Computing), an open source programming language and software environment for statistical computing and graphics. A range of packages from the Comprehensive R Archive Network (CRAN) website were used for specific parts of the analysis and detailed in each Chapter. The epicalc package (Chongsuvivatwong 2011) and epitools package (Aragon 2010) were used for all initial data exploration. 37
56 The chapters within this thesis focus primarily on risk factor identification using logistic regression. This technique is described in more detail by Hosmer and Lemeshow (2003). Statistical significance was defined as p<0.05. Forward and backward stepwise logistic regression was used to build final multivariable models. All variables with a p-value <0.25 in the preceding univariable screening were included in the stepwise selection (Dohoo et al. 2003). Interactions and confounding between explanatory variables were assessed. Model fit was examined using Hosmer and Lemeshow goodness of fit test. Residuals were plotted to detect any outlying or influential observations. Continuous variables in the final model were categorised into 4 dummy variables according to quartiles to assess linearity. The log odds for these variables were calculated and plotted. Linearity was then visually assessed. Other methods used to assess determinants of overweight/obesity included multinomial logistic regression, classification and regression trees, correspondence analysis and generalized additive models. The details of all methods are described in more depth within each chapter. 38
57 Chapter 3 Investigations into the prevalence and risk factors for canine overweight/obesity in Great Britain. 3.1 Introduction This chapter describes the prevalence, geographical distribution and demographic risk factors of canine overweight/obesity from a national first opinion veterinary practice database. Obesity prevalence in humans is known to vary geographically in Great Britain. There are presently no studies investigating whether a similar phenomenon occurs in canine overweight/obesity and this is a major constraint in understanding the epidemiology of canine overweight/obesity. Risk factors for canine overweight/obesity described to date can be divided into 3 interdependent groups; dog factors (sex, neutered status, age, breed - McGreevy et al. (2005)), owner related factors (age of owner, owner sex, owner socio economic group Chapter 5) and environmental/husbandry factors (dog s diet and exercise - Robertson (1999)). Studies assessing overweight/obesity in the UK dog populations have stated prevalences between 17% and 52% (Bland et al. 2009; Holmes et al. 2007). Unlike previous studies on companion animal overweight/obesity in United Kingdom, which have been based on populations sourced from practices or households in defined geographical areas, this study is based on data gathered from a UK wide practice group. The objectives of this chapter were to describe the prevalence of overweight/obesity in dogs from this national database, evaluate potential dog level risk factors (age, sex, breed) for overweight/obesity and explore possible national and regional variations in overweight/obesity prevalence. 3.2 Materials and Methods The data were collected from a national database consisting of 47 primary companion animal practices in a nationwide veterinary group. Data consisted of body condition score (BCS), sex/neutered status, age, location of practice and date of birth of animals presenting at 11 time points throughout 2008 and 2010 (see Chapter 2.2.1). Animals were rated at each veterinary consultation using a 5 point scale (1= Very underweight, 2= Underweight, 3= Ideal, 4=Overweight, 5=Obese) by the veterinarian. Animals were divided into two groups based on this score. Overweight/obese animals were defined as animals with a BCS over 3 while non overweight animals were classed as all animals with a 39
58 BCS of 3 or under. Age was treated as both a continuous and a categorical variable (Groups= under 5 years, 5 to 7 years, 8 to 11 years, 12 years and over). The number of animals in the data with no BCS were counted. Differences in the proportion neutered, male or female, and in age between those animals with a BCS score reported and those without were assessed using chi square test and Mann Whitney U test as appropriate. Associations between age, breed and sex and being overweight/obese (BCS4/5) were evaluated using either Fishers exact or Chi square test as appropriate. Odds ratios and 95% confidence intervals were also calculated. For the categorical variables: - age, breed and sex, the level with the most observations was chosen as the reference level. The overall prevalence of overweight/obesity was calculated with binomial approximate confidence intervals. Prevalences for country and region were adjusted for age category and neutered status using direct standardisation. Adjustment by neutered status and age was carried out as these factors appeared to be consistently found as risk factors by other studies (see Chapter 1.2.3). The standard population distribution was defined as the overall average of the sample. The locations of the practices were grouped into countries; England, Scotland and Wales. England was further broken down into regions based on government office regional classifications (National Statistics 1999). The overweight/obesity prevalences between countries/regions were compared visually. Northern Ireland only contained one participating practice. It was excluded from the analysis into differences between countries because of the small number of animals involved. Changes over time were investigated by calculating age and sex direct standardised prevalence for each time point with associated 95% confidence intervals. Seasonality was explored using the same method. To evaluate sources of spatial variation in overweight/obesity risk and to further explore individual risk factors associated with obesity, binomial logistic regression with random effects was carried out using the statistical package MLWin version 2.0 (Rasbash et al. 2004), and the lme4 package in R (Bates & Maechler 2010). The model was fitted using a generalised linear random intercept model with an unstructured covariance structure. In MLWin, 1st order marginal quasi likelihood (MQL) estimates were derived using Iterative Generalised Least Square (IGLS). All animals with a body condition score of 1 were excluded as these dogs were likely to have concomitant disease (Doria-Rose & Scarlett 2000). Diagnostic evaluation was carried out in R through analysis of the residuals. The hierarchical structures introduced into the model are shown in Figure 3.1. The variable Region was composed of England broken down into regions (as described previously), and Scotland and Wales as separate areas. The most appropriate hierarchical structure was selected by comparing the area under the receiver operating curve (AUC) and Akaike information criterion (AIC) of the models. Models were also compared using likelihood ratio tests. For each random effect in a model, the variance partition coefficient (VPC) and variance component proportion (VCP) were calculated. The total Level 1 variance was assumed to be a standard logistic distribution variance and therefore equal to π2 3 (3.29) (Goldstein et al. 2001). Goldstein et al. (2001) and Snijders & Bosker (1999) consider this approach to be adequate where the binary response 40
59 Figure 3.1 Hierarchical structures evaluated in the canine GLMM is derived from an underlying continuum such as the body condition scoring system used here. The VPC for each level was calculated to be the ratio of a level variance to the sum of all level variances (total variance of the model). The variance component reduction was also calculated to describe the reduction of variance for each random effect between the null random intercept model and the model containing all the fixed effects. For each level above level 1, the VCP was calculated as the ratio of the level variance to the sum of the total level variances minus The spatial differences identified in the multilevel analysis were explored further. Scanning for any clustering in practice overweight/obesity prevalence of practices was carried out using the Discrete Poisson Probability Model with the SaTScan version software. The software overlays the spatial area with overlapping circles with varying radii centred on each practice containing up to 50% of the population. For each circle, the spatial scan statistic calculates the likelihood of seeing the observed case rate inside the circle given the case rate outside the circle. The model was set up to take account of differences in population structure between practices in terms of sex, neutered status and age groups. This method is discussed in detail by Kulldorf (1997). The partial attributable risk can be interpreted as the percent of overweight/obese dogs attributable to that risk factor taking into account the other risk factors. It gives a measure of the potential importance of a particular risk factor in the population. Partial attributable risk estimates were created through the partial package (Lehnert-Batar 2006) in R, As this package is no longer available, the code for the function used is presented in Appendix C. These estimates were based on a logistic regression model containing 3 dichotomous variables:neutered status, sex and middle age (5-11 years) as indicated by the previous models. 95% confidence limits were calculated around these estimates. Previous studies had identified that breed was an important risk factor for obesity although breed did not significantly improve the fit of the previous hierarchical models. The risk of overweight/obesity is thought to peak in middle age (Holmes et al. 2007). With the great variation in life span in different breeds (Galis et al. 2007; Greer et al. 2007), the age in years 41
60 corresponding to middle age is likely to differ between breeds. This may result in different breeds having peaks in overweight/obesity prevalence at different ages. The hypothesis was explored by first using generalised additive models (GAM) with a smoothing spline for age. Neutered status, sex and location were forced into the model to account for their effects. The model was constructed using the mgcv package in R (Wood 2000). To reduce unmeasured effects, the data were restricted to England. The results of the GAM allowed age to be categorised into 4 groups (less than 8years, 8 to 10 years, 11 to 13 years and above 13 years). The dataset was restricted to dogs aged 4 to 14 years and dogs within the most numerous 10 breeds. This was necessary as the proportion of animals neutered was likely to be age dependent and allowed the effect of breed to be fully evaluated. A GLMM with practice location as a random effect was then used to assess interactions between sex, neutered status and breed with age. AIC and AUC was used to select the model that provided the best fit to the data. 3.3 Results Body condition score BCS was available for 7,847 dogs. Figure 3.2 shows the distribution of body condition score categories. The majority of dogs (69.2%, n=5428) had a BCS of % (n=1696) of dogs were overweight (BCS=4) and 3.4% (n=265) were obese (BCS=5). The overall prevalence of being overweight or obese (BCS 4 or BCS 5) was 25% ( %). Body condition scores were not available for 106 dogs (1.3%). There appeared to be no difference in the sex, neutered status or age between those dogs with BCS and those without (Table 3.1). Variable Level BCS available (n(%)) BCS not available (n(%)) P value Neutered status Neutered 3388(43%) 42(40%) Entire 4459(57%) 64(60%) 0.53 Sex Female 3949(50%) 56(53%) Male 3878(49%) 50(47%) Unknown 20(0.2%) Age Median= 4 years (0-26) Median=5 (0-18) 0.16 Missing values=67 Missing values =3 Table 3.1 Comparison of age, neutered status and sex between dogs with and without body condition scores Age Data on age group and BCS were available for 7,821 dogs. The majority of dogs (52.5%, n=4107) were 4 years or younger. 15% (n=1175) were aged 5 to 7 years, 20.7% (n=1617) were between 8 to 11 years, and 11.8% (n=922) were aged 12 years or more. Body condition 42
61 Figure 3.2 Distribution of canine body condition score categories scores were not available for 106 dogs (1.3%). There appeared to be no difference in the sex, neutered status or age between those dogs with BCS and those without (Table 3.1). The odds of being overweight/obesity were increased for all age groups compared to dogs aged 4 years or younger (Table 3.2). Dogs that were 5 to 7 years old were 5.5 times more likely to be overweight/obesity, dogs aged 8 to 11 years were 5.6 times more likely to be overweight/obesity whereas dogs aged 12 years or more were 3.5 times more likely to be overweight/obesity compared to dogs that were 4 years or younger. Not overweight Overweight Odd ratio Age < 4 years to 7 years ( ) 8 to 11 years ( ) >12 years ( ) Sex Female entire Female neutered ( ) Male entire ( ) Male neutered ( ) Table 3.2 Univariable results of association between canine overweight/obesity and sex/neutered status 43
62 3.3.3 Sex and neutering Complete information on neutered status, sex and BCS was available for 7,827 animals. 33% (2,606) of dogs were male entire, 29% (2,299) were female entire, 21% (1,650) were female neutered and 16% (1272) were male neutered. 37.2% (2,960) of dogs were neutered. Males were 32% less likely to be neutered than females (OR=0.68 ( ), p<0.001) The percentage of dogs overweight/obese in each category varied dramatically. 42.8% of neutered females, 40.9% of neutered males, 17.8% of female entire and 12.3% of male entire were overweight or obese. There were significant differences in the likelihood of being overweight between categories (Table 3.2). Compared to entire females, neutered females were 3.5 times more likely to be overweight while neutered males were 3.2 times more likely to be overweight. Entire males were 35% less likely to be overweight than entire females. Overall, neutered dogs were 4.14 times more likely to be overweight than entire dogs (OR=4.14 (95%CI )) Breed There were 144 breed descriptions from 7,847 dogs for which records for both BCS and breed available. The ten most popular breed descriptions were: Crossbreed (2369, 30.2%), Staffordshire Bull Terrier (1266, 16.1%), Jack Russell Terrier (532, 6.8%), Yorkshire Terrier (495, 6.3%), German Shepherd Dog (324, 4.1%), Labrador (266, 3.3%), Rottweiler (259, 3.3%), West Highland White Terrier (208, 2.7%), Shih Tzu (157, 2.0%), and English Springer Spaniel(114, 1.5%). Pedigree dogs were no more likely to be overweight/obese than crossbreeds (OR=1( ), p=0.97). Nineteen breeds, with more than ten individuals, were significantly associated with an increased or decreased risk of overweight or obesity. There were nine breeds at increased risk compared to cross breeds: Cairn Terrier, Cavalier King Charles Spaniel, Cocker Spaniel, King Charles Spaniel, Golden Retriever, Labrador Retriever, Shetland Sheepdog, English Springer Spaniel and West Highland White Terrier. There were also 10 breeds at decreased risk of obesity compared to cross breeds: American bulldog, Border Terrier, German Shepherd Dog, Greyhound, Jack Russell Terrier, Japanese Akita, Lurcher, Shar Pei, Shih Tzu and Staffordshire Bull Terrier Location Dog overweight/obesity adjusted prevalences differed markedly between countries. Scotland (31.7% (95%CI %) had a significantly higher prevalence than either England (23.8% (95%CI %) or Wales (24.9% (95%CI %)) (Figure 3.3). There were also significant inter-regional differences in adjusted prevalence in England (Figure 3.4). 44
63 45 Figure 3.3 Country adjusted and unadjusted canine overweight/obesity prevalence
64 46 Figure 3.4 Adjusted regional canine overweight/obesity prevalence (NI=Northern Ireland)
65 3.3.6 Temporal trends There appeared to be some variation in the adjusted prevalence during the study period (Figure 3.5) although these differences were not statistically significant. The large confidence intervals in 2010 reflect the relative small number of observations from these time points. 47
66 48 Figure 3.5 Temporal trend in adjusted canine overweight/obesity prevalance
67 3.3.7 Multilevel model Hierarchy The null random intercept model with the lowest AIC and highest AUC (Table 3.3) consisted of three hierarchical levels: individual, practice and region. 49
68 Random Intercept model Source of variation Variance (SE) Variance component proportion (%) Final mixed effect model Variance Variance Variance Variance partition (SE) coefficient component proportion (%) partition coefficient Model explanation Variance AUC AIC component reduction(%) MODEL STRUCTURE 1 Level 3: Region (k) 0.04 (0.027) (0.022) Level 2: Practice (j) (0.020) (0.017) Level1: Animal (i) MODEL STRUCTURE 2 Level 3: Country(k) (0.04) (0.021) Level 2: Practice (j) (0.023) (0.018) Level1: Animal (i) MODEL STRUCTURE 3 Level 2: Practice (j) (0.027) (0.022) Level1: Animal (i) MODEL STRUCTURE 4 Table 3.3 Variance components and fit for multivariable models for canine overweight/obesity (SE=Standard error) (Model 4 has no random effects) 50
69 Sources of variation Table 3.3 shows that the majority of variation existed between individuals at the practice level. Only 2% of variation in the full model was attributable to between practice and regional differences. The addition of risk factors to the full model reduced the between site and the between region variation suggesting that the distribution of risk factors (age, neutered status and sex) varied between practices and regions. Fixed effects associated with being overweight All fixed effects were significantly associated with the outcome and improved the goodness of fit in the model (as assessed by AIC). The final model fixed effect coefficients and associated odds ratios are shown in Table 3.4. Males were 20% less likely than females to be overweight. Neutering increased the likelihood of being overweight by 2.8 times compared to being entire. Animals were more likely to be overweight with increasing age, with a peak in middle age (5 to 8 years). The estimates of these coefficients and their standard errors changed little between models with different hierarchical structures indicating that the effect of these risk factors is independent of location. 51
70 Model Structure 1 Intercept Sex Sex Male Neutered Neutered Age Age 5 to Age 8 to Age Over Female No Yes Under 5 8 years 12 years 12 years years Coefficient (SE) (0.09) (0.06) (0.06) (0.08) (0.07) (0.09) Odds ratio (95% ) 0.77 ( ( ( ( ) 3.17) 4.95) 4.66) (2-2.86) Table 3.4 Results from final multivariable model for canine overweight/obesity. 52
71 Spatial clustering The SaTScan results indicated two statistically significant clusters of overweight/obesity risk (Figure 3.6). Cluster 1 was centred on Aberdeen and included Dundee, Glasgow East and Edinburgh. Animals at these practices were 34% more likely to be overweight than the population outside this cluster (Relative risk = 1.34, p=0.012). Cluster 2 was centred on Middlesbrough and included Sunderland, Gateshead, Newcastle, Leeds, Bradford, Hull, Huddersfield, Sheffield, Manchester, Blackpool, Huyton, and Kirkdale. Animals here were 22% less likely to be reported as overweight compared to the population outside the cluster (Relative risk= 0.78, p<0.001). Figure 3.6 SaTScan results: statistically significant clusters of canine overweight/obesity risk 53
72 Investigating the potential interaction between age and breed. These results were produced from a dataset restricted to practices within England and dogs from breeds with the top 10 breeds (Crossbreed, Staffordshire Bull Terriers, Yorkshire terriers, Jack Russell Terrier, German Shepherds, Labrador Retriever, Rottweiler, Border Collies, West Highland White Terriers, and Boxers). First a generalised additive model was fitted with age described using penalised regression splines. Neutered status, breed, sex and practice location were also entered into the model. Figure 3.7 below shows the result for age. As expected, it follows an inverted U shape relationship with the risk of overweight/obesity. Figure 3.7 Age spline from canine generalised additive model Next, interactions between each dog level variable and age were investigated. The proportion of animals neutered was likely to be age dependent (Figure 3.8). 54

73 55 Figure 3.8 Relationship between neutered status and age of dog
74 For this reason, the data were restricted to dogs aged between 5 to 14 years. Age was then categorised to correspond to the curve in Figure 3.9 (less than 8 years, 8 to 10 years, 11 to 13 years and above 13 years). Figure 3.9 Age spline for canine generalised additive model for the restricted dataset Comparing the models using AIC (Table 3.5) showed that the model with an interaction between age and breed did not improve the fit of the model. The full results of the model with no interactions are shown in Table 3.6. Interaction term AIC AUC Model 1 None Model 2 Breed:Age Table 3.5 Comparison of canine overweight/obesity models assessing the interaction between age and breed Population attributable risks The calculated population attributable risks (PAR) are shown in Table 3.7. Neutered status and age (5 to 11 years) appeared to contribute the most to the prevalence with no significant difference between these risk factors. 56
75 Variable Coefficient (SE) Odd ratio (95% CI) Sex Neutered Age Breed Intercept 0.5 ( ) Female (n=1438) Male (n=1301) (0.09) 0.81 ( ) Entire (n=1273) Neutered (n=1475) 0.70 (0.09) 1.93 ( ) Under 8 years (n=839) 8 to 10 years (n=869) 0.13 (0.11) 1.14 ( ) 11 to 13 years (n=822) (0.12) 0.81 ( ) 14 years and over (n=218) (0.25) 0.41 ( ) Cross breed (n=1033) Border Collie (n=116) 0.37 (0.21) 1.45( ) Boxer (n=88) (0.26) 0.49( )) German Shepherd Dog (n=184) (0.19) 0.52( ) Jack Russell Terrier (n=207) 0.07 (0.17) 1.1( ) Labrador Retriever (n=142) 0.64 (0.19) 1.9( ) Rottweiler (n=120) 0.40 (0.21) 1.5( ) Staffordshire Bull Terrier (n=417) 0.17 (0.13) 1.2( ) West Highland White Terrier (n=125) (0.20) 1.3( ) YorkshireTerrier (n=316) (0.14) 0.76( ) Table 3.6 Full model results. Variable Sex Neutered status Age (5 to 11 years) PAR (95% CI) 0.10 ( ) 0.31 ( ) 0.37 ( ) Table 3.7 Population attributable risks for canine overweight/obesity 3.4 Discussion This chapter estimated the prevalence of canine obesity/overweight at 25%. This is comparable with the two other studies in the UK using a 5 point BCS system (Mason % based on a survey of 1000 dogs and Edney & Smith % based on a survey of 8268 dogs). The study prevalence was lower than Chapter 5 (58.9% based on a 7 point BCS system). The ability to compare studies accurately is limited due to differences in methods, e.g. the BCS system used, and the population sampled. The odds of being overweight/obese peaked in middle aged dogs (8-11 years old) and then declined in old age (over 12 years). Age related changes in likelihood of obesity have also been found in previous studies (Colliard et al. 2006; Holmes et al. 2007; Lund et al. 2006; Mason 1970, McGreevy et al. 2005; Robertson 2003). The specific peak in risk in middle age for dogs was also found by Lund et al. (2006), Mason (1970) and McGreevy et al. (2005). The reduction in risk in geriatric animals compared to middle aged animals may be associated with concurrent geriatric diseases associated with weight loss such as dental disease (DeBowes 2000), neoplasia (Withrow & Vail 2006), and cardiovascular disorders (Kvart & Haggstrom 2000). This could have had a particular impact on this study population as it consisted entirely of vet visiting animals. Alternatively, overweight/obesity may severely impact the probability of the likelihood of animals reaching old age. Age was reported by the owner and the reliability of these data could not been assessed. In addition, there may be issues in establishing what age corresponds to middle age due to the wide variation in lifespan between 57
76 breeds (Galis et al. 2007; Greer et al. 2007). Neutered status and being female were also risk factors for dogs being overweight or obese. Again, this has been found by several previous studies (Colliard et al. 2006; Edney & Smith 1986; Mason 1970; McGreevy et al. 2005; Lund et al. 2006). Hypotheses for this increased risk in neutered animals include a decrease in metabolic rate, alterations in feeding behaviour and reduced physical activity as discussed by German (2006). This study found that certain dog breeds had differing risks of being overweight/obese. Although breed and obesity have been linked in previous studies (Edney & Smith 1986 and Mason 1970), breed may act as a proxy for other confounders including husbandry such as exercise levels or energy intake. Therefore, it is difficult to rank breed propensity for obesity as other factors such as urban or rural habitats, sex and neuter status have been shown to affect breed risk (McGreevy et al. 2005). The univariable analysis showed that Scotland had a higher canine overweight/obesity prevalence than England or Wales. Within England, there was some regional variation in dog overweight/obesity prevalence with the East and West Midlands having a higher percentage of dogs overweight or obese. The multilevel model helped to explain these spatial associations further. The hierarchical structure that fitted the data consisted of practice and region. Only 2% of variation was attributable to practice and region suggesting that non spatial risk factors (age/neutered status/sex) play a larger role in being overweight/obese. Also the variation decreased by nearly a third between the random intercept model and the final model containing the fixed effects. This may indicate that there is substantial variation in population structure in terms of age, neutered status and sex between practices and regions. This may be relevant for resource management within this practice group. Also, the calculation of the population attributable risk established that neutered status and age were the most influential in this population suggesting that preventive measures should be targeted at neutered dogs and dogs in middle age (5 to 11 years old) to obtain the greatest reduction in prevalence of canine overweight/obesity. The SaTScan identified clusters of increased and decreased risk. The results reinforce the observed risk in Scotland and the decreased risk in the North East of England seen in the residual plot of the final multilevel model. Human studies have shown higher prevalence of adult obesity in Scotland relative to England (Rennie & Jebb 2005) similar to our study, but regional differences in England show higher rates of obesity in the West Midlands and South Yorkshire (Moon et al. 2007). To our knowledge, no other studies have identified regional variation in dog obesity prevalence in United Kingdom. However, Lund et al. (2006) found regional variation in dog obesity prevalence in United States and concluded that these differences could be attributed to differing lifestyles of dogs and owners across the geographic areas. Other reasons for these spatial differences include measurement biases. Inter rater and inter practice reliability and differences between practice validity of body condition scoring were not evaluated. The spatial distribution and age related increases in obesity prevalence were similar to those found in humans (Rennie & Jebb 2005). Human obesity results in a 9 year reduction in 58
77 average life expectancy (National Audit Office 2001) and European national obesity prevalences have risen by 10 to 20% in the last decade (International Obesity Taskforce 2002). Animal models are commonly used in experiments to explore genetic, physiological and environmental aspects of obesity. The similarities in the distribution of obesity between humans and dogs warrants further investigation. Dogs have been already proposed as sentinels for infectious diseases in urban environments (Cleaveland et al. 2006); they may also have an important role in understanding the environmental causes of chronic disease processes such as obesity. This chapter s results indicated geographical variation in overweight/obesity prevalence. When interpreting this finding, two factors need to be taken into account. Firstly, the study is likely to have insufficient power to detect differences in area prevalences because of small numbers of practices in certain areas. Secondly, the pooling of data for defined area may have disguised intra-area variation and led to misleading results. Furthermore, specific investigation into the spatial pattern of overweight/obesity in U.K. is needed to explore this issue. As with any study based on secondary data, the findings need to be interpreted with caution. The data were gathered from 47 practices by multiple vets. This could inevitably lead to non-conformity of BCS classification. One of the aims of this practice group is to provide free veterinary services to people in need. To qualify for treatment at the practices within this study, owners needed to demonstrate they received state financial assistance due to low household incomes and have lived within a defined catchment area. Therefore, the practices tend to be sited in or near areas of greatest demand which, in turn, are more likely to be socio-economically deprived; the generalisability of this study results to the wider UK companion animal population therefore may be limited. Specifically, the canine obesity prevalence estimate may be greater than the true national prevalence as previous studies have linked low owner incomes to increased risk of canine obesity (Kienzle et al. 1998, Chapter 5). In addition, there were fewer body condition scores reported at the last two time points suggesting potential declining participation in entering scores over the time period. It therefore is inappropriate to draw any conclusions about temporal trends in obesity over the study period. However, there appeared to be no difference in the demographic characteristics (age, neutered status and sex) between those dogs with a BCS score and those dogs without a BCS score. This suggests that non-response bias may be absent from these data. 3.5 Conclusion In summary, body condition scores were available for 7,847 dogs. 1 in 4 dogs were classified as overweight or obese. Scotland had a significantly higher prevalence of obesity than England or Wales. Using both SatScan and generalised linear mixed effects models (GLMM), the higher prevalence of overweight/obesity in dogs within Scotland was confirmed after adjusting for differences in demographics between locations. The GLMM also showed that males were 20% less likely than females to be overweight, neutering increased the likelihood of being overweight by 2.8 times compared to being entire and dogs were more likely to be overweight with increasing age, with a peak in middle age (5 to 8 years). These effects were independent of location as the odd ratios did not change between different hierarchical GLMM models. 59
78 This study has confirmed that neutering, age and sex are important risk factors for overweight/obesity. There was considerable variation in overweight/obesity prevalence in United Kingdom mirroring human obesity. The underlying reasons for this deserve further exploration. 60
79 Chapter 4 Investigations into the epidemiology of feline and rabbit overweight/obesity in Great Britain Published in part in Veterinary Record (2012) and Veterinary Record (2012) Introduction This chapter provides a description of the prevalence and risk factors for overweight/obesity from a nationally distributed population of cats and rabbits. Previous studies from Great Britain have estimated the prevalence of feline overweight/obesity as between 39% and 52% (Russell et al. 2000; Chapter 7). Risk factors found for feline overweight/obesity can be divided into non-modifiable factors, such as being male (Robertson, 1999), neutered status (Fettman et al. 1997), age (Russell et al. 2000), crossbreed (Colliard et al. 2009), and modifiable factors such as being confined indoors (Robertson, 1999), the presence of dogs in the household (Allan et al. 2000), and increased frequency of feeding (Chapter 7). It is postulated that these factors lead directly or indirectly to a positive energy balance and eventual weight gain. Unlike feline overweight/obesity, little peer reviewed literature currently exists describing pet rabbit obesity or identifying potential risk factors. Using data gathered from a nationwide database for 47 veterinary practices, the objectives of this study were to estimate the prevalence of feline overweight/obesity, evaluate potential non modifiable risk factors such as sex, neutering and age and explore possible national and regional variations in overweight/obesity prevalence. No studies to date have evaluated whether there are spatial variations in feline overweight/obesity prevalence in Great Britain or assessed the impact of non modifiable risk factors such as sex, neutered status and age on the prevalence of obesity. This chapter also describes the prevalence of obesity in rabbits and explores demographic risk factors associated with overweight/obesity. 4.2 Materials and Methods Data were obtained from a national database consisting of 47 primary companion animal practices in a nation wide charity veterinary group (see Chapter 2). Data consisted of BCS, sex/neutered status, age, location of practice and date of birth of cats and rabbits presenting at 11 time points between 2008 and Cats and rabbits were rated at each veterinary consultation using a 5 point scale (1=very underweight, 2=underweight, 3=ideal, 4=overweight, 5=obese) by the attending veterinarian. 61
80 They were then divided into two groups based on this score. Overweight/obese animals were defined as animals with a BCS of 4 and 5, whereas non-overweight animals were classed as all animals with a BCS of 1, 2, or 3. Associations between age, breed and sex and being overweight/obese were evaluated using either Fishers exact or Chi square test as appropriate in R version (R Foundation for Statistical Computing). Odds ratios and 95% confidence intervals were also calculated. Feline age was categorised based on the American Association of Feline Practitioners/American Animal Hospital Association (AAFP/AAHA) Feline Life Stage Guideline (Hoyumpa Vogt et al. 2010). For the categorical variables, age, breed and sex, the grouping with the most observations was chosen as the reference level. The number of animals in the data with no BCS were counted. Differences in the proportion neutered, male or female, and in age between those animals with a BCS score reported and those without were assessed using chi square test and Mann Whitney U test as appropriate. The overall prevalence of overweight/obesity was calculated with binomial approximate confidence intervals. Prevalences for country and region were adjusted for age category and neutered status using direct standardisation. The standard population distribution was defined as the overall average of the sample. The locations of the practices were grouped into countries: England, Wales, Scotland and Northern Ireland. England was further broken down into regions based on government office regional classifications (National Statistics, 1999). The overweight/obesity prevalence differences between countries/regions were compared graphically. Northern Ireland only contained one practice and therefore was excluded from the analysis of differences between countries because of the small number of animals involved Identifying risk factors associated with feline overweight/obesity To evaluate sources of spatial variation in feline obesity risk and to further explore individual risk factors associated with overweight/obesity, binomial logistic regression analysis with random effects was applied using the statistical package MLWin version 2.0 (Rasbash et al. 2004) and the lme4 package in R (Bates & Maechler 2010). Data from animals less than 1 year of age and for a BCS of 1 were excluded from the logistic regression model because BCS may not be reliable for animals less than 1 year old and animals with a BCS of 1 may have concomitant disease (Allan et al. 2000; Colliard et al. 2009). The model was fitted using a generalised linear random intercept model with an unstructured covariance structure. In MLwiN, 1st order marginal quasi likelihood (MQL) estimates were derived using Iterative Generalised Least Square (IGLS). Diagnostic evaluation was carried out in R through analysis of the residuals. The hierarchical structures introduced into the model are shown in Figure 4.1: Model 1-Cat/Practice/Region; Model 2- Cat/Practice/Country; Model 3-Cat/Practice. The variable Region was comprised of England broken down into governmental regions, and Scotland and Wales as separate areas. The most appropriate hierarchical structure was selected by evaluating the area under the receiver operating curve (AUC) and Akaike information criterion (AIC) of the models. Models were also compared using likelihood ratio 62
81 Figure 4.1 Hierarchical structures evaluated in the feline generalised linear mixed model. tests. Age was introduced into the model both as a continuous and a categorical variable based on the AAFP/AAHA: Feline Life Stage Guidelines (Hoyumpa Vogt et al ). As it was expected that the relationship between the probability of being overweight/obese and age would be non-linear, restricted cubic regression splines written in general B-spline basis function were used to model the effect of age. The number of knots was set a priori at 4. First order interactions between variables were introduced into the final model to investigate whether they improved the fit of the model. In addition to identifying risk factors related to being overweight/obese, the study attempted to find risk factors connected with being BCS 1 (very underweight). These cats had been excluded in the previous analysis for overweight/obese and this analysis was carried out to assess the effect of this. Animals were divided into 2 groups, those with a BCS of 1 and those with a BCS 2 to 5. Risk factors (sex, age and neutered status) were first assessed using a univariable logistic regression model. All variables were entered into a multivariable logistic regression analysis. Forward and backward stepwise logistic regression analysis was then used to build the multivariable model. Interactions between variables were not assessed due to data sparsity. The partial attributable risk can be interpreted as the percentage of overweight/obese cats attributable to that risk factor taking into account the other risk factors. It gives a measure of the potential importance of a particular risk factor in the population. Partial attributable risk estimates were created through the partial package (Lehnert-Batar, 2006) in R (code for function available in Appendix C as it is no longer available online). These estimates were based on a logistic regression model containing 3 dichotomous variables:- neutered status, sex and middle age (5-7 years) as indicated by the previous model. 95% confidence levels were calculated around the estimates. 63
82 In addition, the correlation between feline overweight/obesity prevalence and canine overweight/obesity prevalence was assessed. Canine body condition scores and age were available from the same source database as the feline data used in this study. The results of the analysis of the canine data are presented in Chapter 3. Age adjusted prevalences based on 4 categories corresponding to less than 5 years, 5 to 7 years, 8 to 11 years and 12 years and above were calculated using direct standardisation in R (The standard population was taken as the average of the study populations). These were plotted and visually assessed. Correlation was assessed using Kendall s tau Identifying risk factors associated with rabbit overweight/obesity As there are no published guidelines proposing age ranges for different life stages of rabbits, we defined age categories, derived from date of birth and consultation dates, as less than 8 months juveniles, 8 months-2.5 years adults, years older adults, and 5 years and over geriatric, based on clinical experience. Associations between age, breed, sex, and neutered status and being overweight/obese (BCS 4 or 5) were evaluated using either Fishers exact or Chi square tests as appropriate. Odds ratios (OR) and 95% confidence intervals were also calculated. Statistical significance was defined as p<0.05. Differences in age between neutered and entire categories were assessed using Mann-Whitney U test. All analyses were carried out in R version 2.10 (R Development Core Team 2009). As exploring the data through multivariable significance testing was not appropriate due to data sparsity, correspondence analysis was used to examine the relationship between variable categories as described by Sourial et al. (2010). This analysis used the FactoMineR package (Husson et al. 2010). 4.3 Results Results from the analysis of feline records Records were available from 3277 cats. These records were derived from 47 practices. Practices provided a mean of 70 (Standard deviation ±32) cat records each with a range of 1 to 147. The mean number of records provided by a practice per day was 8 (±5.6) with a range between 1 to 36. Body condition score BCS information was available for 3219 (98.23%) cats. Figure 4.2 shows the distribution of cats in each BCS category. Nearly three quarters of the cats were ideal (BCS 3) (72%, n=2318). 9.7% (n=313) were overweight (BCS 4) and 1.8% (n=57) were obese (BCS 5). 15% (n=483) had a BCS of 2 and 1.5% (n=48) had a BCS of 1. The overall prevalence of feline overweight/obesity (BCS 4 and 5) was 11.5% (95%CI %). Body condition scores were not available for 58 cats (1.8%). There appeared to be no difference in the sex and 64
83 neutered status between those cats with BCS and those without (Table 4.1) but there was a significant difference in age. Figure 4.2 Feline body condition scores. Variable Level BCS available (n(%)) BCS not available (n(%)) P value Neutered status Neutered Entire Sex Female Male Unknown Age Median=4 (0-26) Median=10 (0-18) Missing values=36 Missing values= Table 4.1 Comparison of age, neutered status and sex between those cats with and without body condition scores 65
84 Age 3181 cats (97.1%) had records both on age and BCS. Using the AAFP/AAHA Feline Life Stage Guidelines (Hoyumpa Vogt et al. 2010), 1360 cats (42.8%) were classed as being in the junior life stage (up to 2 years), 473 cats (14.9%) were in the prime life stage (3 to 6 years), 403 cats (12.7%) were in the mature life stage (7 to 10 years), 536 cats (16.9%) were in the senior life stage (11 to 14 years) and 409 cats (12.9%) were in the geriatric life stage (15 years plus). Sex 3194 cats (97.5%) had both sex and BCS records. 67% (n=1055) of cats were neutered. 34.9% (n=1116) of cats were male neutered, 32% (n=1023) were female neutered, 16.3% (n=535) were female entire and 16.3% (n=520) were male entire. There appeared to be no difference between the odds of being neutered between females and males (OR=1.14 ( ), p=0.09). 18.2% (n=203) of male neutered cats, 12.8% (n=131) of female neutered cats, 3.6% (n=19) of female entire and 5.6% (n=41) of male entire cats were either overweight or obese. Table 4.2 shows the relationship between overweight/obese and sex and neutered status. Neutered individuals were 3.55 times as likely to be overweight as those that were not (OR=3.55( ), p<0.001). Odds ratio (95% CI) Female entire * Female neutered 3.99( ) Male entire 0.74 ( ) Male neutered 6.02 ( ) Table 4.2 Univariable associations between feline overweight/obesity and sex/neutered status Breed In total, 3217 cats (98.2%) had records for both breed and BCS. There were 18 breeds recorded. 83.9% (n=2698) of cats were domestic short hair and 12.4% (n=399) were domestic long hair. The remaining 3.7% (n=120) were 16 different breeds. There were 5 breeds with more than 5 individuals: Persian (n=43, 1.3%), Siamese (n=26, 0.8%), British short hair (n=10, 0.3%), Bengal (n=7, 0.2%), and Ragdoll (n=6, 0.2%). Domestic short hairs and longhairs were not significantly more or less likely to be overweight/obese compared with pedigrees (OR= 1.45 ( ), p=0.3). No individual breeds appeared at increased risk of obesity. 66
85 Location There were variations in prevalence between countries (Figure 4.3). Scotland had a significantly greater prevalence of overweight/obese cats than England. Within England, there was no statistically significant regional variation in prevalence (Figure 4.4). Figure 4.3 Prevalence of feline overweight/obesity per country 67
86 68 Figure 4.4 Prevalence of feline overweight/obesity per region
87 Logistic regression models Results from the mixed model hierarchies tested showed no improvement in the explanatory ability or any significant change in the coefficient estimates between the fixed effect only model and the mixed models. model. Therefore the final model chosen was the fixed effect only The multivariable overweight/obese model contained age, sex and neutered status (Table 4.3). Male cats were 1.3 times more likely to be overweight/obese than females and being neutered increased the risk of being overweight/obese by a factor of 2 times. The multivariable model with age as a categorical variable showed that cats between 7 and 10 years were most at risk of being overweight/obese while the multivariable model with age as a continuous variable showed a peak in probability at 7 years of age. For the final model with age as a categorical variable, AUC was 71% indicating moderate explanatory ability while the AUC from the final model, with age described with splines, was 77%. Interaction terms between variables did not improve the fit of the final models. Figure 4.5 presents the predictive probabilities from the final model with age as a continuous variable. All age groups compared to the junior life stage (1-2 years) were at greater risk of overweight/obesity with a peak in the mature age group (7-10 years) in the generalised linear model (GLM) with age as a categorical variable. The GLM in which age was modelled with a spline was a better fit to the data and showed that there was a peak in prevalence at 6 to 7 years of age (Figure 4.5). Variable Level Model with age groups Model with age as b-spline OR (95% CI) OR (95% CI) Sex Female (n=1089) * * Male(n=1190) 1.33( ) 1.27(1-1.60) Neutered status Entire(n=383) * * Neutered(n=1904) 2.21( ) 2.24( ) Age 1 to 2 years(n=528) * * 3 to 6 years(n=445) 3.48( ) NA 7 to 10 years(n=416) 5.39( ) NA 11 to 14 years(n=557) 2.9( ) NA >15 years(n=341) 1.36( ) NA Table 4.3 Final feline overweight/obesity multivariable analysis results (OR=Odds ratio, 95%CI=95% confidence level) The partial attributable risk (PAR) can be interpreted as the percentage of overweight/obese cats attributable to the risk factor, taking into account the other risk factors. It gives a measure of the potential importance of the risk factor in the population. The PAR were:- Male 0.08 (95%CI ), neutered status 0.44 (95%CI ) and prime/mature life stages (3 to 10 years) 0.22 (95%CI ). Neutering appeared to contribute the most to the prevalence of obesity, followed by middle age (3-10 years of age). Over one quarter, the remainder, (0.26) of the disease burden was unexplained by the modelled risk factors. The univariable results for the underweight (BCS 1) analysis found only one risk factor (age) to be statistically significant (Table 4.4). The final multivariable underweight model 69
88 Figure 4.5 Predictive probability of overweight/obesity from the final generalised linear model plotted against age of cat (ME= Male entire, MN= Male neutered, FE= Female entire, FN= Female neutered) contained neutered status and age categories (Table 4.4). There was an increase in odds of being underweight (BCS 1) with each lifestage with cats over 15 years most at risk. Also neutered cats were 73% less likely to be BCS 1 than entire cats. Risk factor Level BCS 1 BCS 2 to 5 OR(95%CI) mor(95%ci) Neutered status Entire Neutered ( ) 0.27 ( ) Age 1 to 2 years to 6 years ( ) 3.84( ) 7 to 10 years ( ) 10.03( ) 11 to 14 years ( ) 11.85( ) >15 years ( ) 36.35( ) Sex Female Male ( ) NA Table 4.4 Feline underweight (BCS 1) analysis results (OR=Odds ratio, 95%CI=95% confidence interval, mor=multivariable model odds ratio) Correlation between canine and feline prevalence at practice level. There was no evidence of correlation between canine and feline prevalence at the practice level (Kendall s tau=0.05, p=0.622). Figure 4.6 shows visually that this lack of relationship was consistent between countries. 70
89 Figure 4.6 Scatter plot of feline and canine overweight/obesity adjusted prevalence 71
90 4.3.2 Results from the analysis of rabbit records Forty one practices submitted records on 157 rabbit BCSs. Nearly three quarters of the rabbits were ideal (BCS 3) (76.4%, n=120). 7.6% (n=12) were overweight (BCS 4) and none were obese (BCS 5). Five rabbits were classed as very underweight (BCS 1, 3.2%) and 20 rabbits were underweight (BCS 2, 12.7%). 152 (96.8%) rabbits had records for both age and BCS. 27% (n=41) were 8 months or younger, 41% (n=62) were between 8 months and 2.5 years, 21% (n=32) were between 2.5 years and 5 years and 11.1% (n=17) were 5 years or older. The median age of the rabbits was 1.5 years (range= years). Entire males made up 52.4% (n=79) of rabbits, 5.3% (n=8) were male neutered, 37% (n=56) female entire and 5.0% (n=8) female neutered. Overall, 10.6% (n=16) of rabbits were neutered and there was no significant difference in the prevalence of neutering between males and females (males =9.2%, females=12.5%, p=0.53). There was no significant difference in the age of neutered and entire rabbits (Entire median=0.5 years (Interquartile range=3), Neutered median=1 year (Interquartile range =2), p=0.26). Risk factors for being overweight (BCS 4) Risk factors stratified by overweight status are summarised in Table 4.5. Risk Factor Level Overweight Not overweight Missing values Age <8 months 1 (0.6) 40 (25.5) 8 8 months to 2.5 years 4 (2.5) 55 (35) 2.5 to 5 years 5 (3.4) 27 (18.1) >5 years 1 (0.7) 16 (10.7) Sex Female 7 (4.7) 56 (37.8) 9 Male 5 (3.4) 80 (54.1) Neutered status Entire 8 (7.6) 133 (84.7) 3 Neutered 4 (2.5) 12 (5) Country England 7 (4.5) 116 (73.9) 0 Scotland 4 (2.5) 17 (10.6) Wales 1 (0.6) 12 (7.6) Table 4.5 Contingency table of risk factors for rabbit overweight.(percentages are in brackets) Age The percentage overweight differed between age categories although this difference was not statistically significant (<8mths 2.4% (n=1), 8 months to 2.5 years 6.8% (n=4), 2.5 years to 5 years 15.6% (n=5), and 5 years and above 5.9% (n=1), p=0.198). 72
91 Sex and neutered status Six percent (n=5) of male rabbits were overweight whereas 11.1% (n=7) of female rabbits were overweight. There was no statistically significant association between sex and being overweight (OR=0.5 ( ), p=0.249), but this lack of significance may be an artefact of the low power of the study. However, neutered rabbits were 5.4 times more likely to be overweight than entire rabbits (OR=5.44 ( ), p=0.006). It was not possible to explore interactions between neutering, sex and being overweight because of the small numbers of subjects involved. Country differences There was variation in the proportion of rabbits that were overweight between countries, although the differences were not statistically significant, again due to low power in this study (England 5.7%, Wales 7.7%, and Scotland 20%, p=0.145) Multiple Correspondence Analysis The multiple correspondence analysis was run on the 141 records with no missing values using all risk factors. The correspondence plot is shown in Figure 4.7. Rabbits that were female, neutered or in Scotland were more likely to be overweight than rabbits in the other categories. 73
92 74 Figure 4.7 Results of correspondence analysis for rabbit overweight. Correspondence analysis measures the distance between the rows and columns of a contingency table and presents the relationship between variables in 2d space. The distance between two points is directly proportional to the correlation between two variables and the distance from the origin can be interpreted as significance.
93 4.4 Discussion More than one in ten cats within our study was found to be overweight or obese. To my knowledge, this estimate is based on the largest sample to date of cats in the United Kingdom. This estimate is lower than the previous UK estimate of 52% which was based on 136 cats recruited by a house to house survey (Russell et al. 2000) and 40% in vet-visiting cats in Glasgow (Chapter 7). There is a multitude of possible reasons behind this estimate being lower than others. This could relate to the way the data were gathered, that is this study used secondary data while most other published studies have used primary data, or due to actual differences between this study population of cats relative to other previous study populations; these cats were from a population where the owners would have relatively low incomes. This study confirms the associations of age, sex and neutered status with feline overweight status. Neutered cats were four times more likely to be overweight/obese than entire cats. Neutering has been shown to lower significantly the maintenance energy requirements of female cats and decrease physical activity levels (Belsito et al. 2009). Of interest is the relatively low proportion of cats that were neutered. From a telephone cross sectional study, Murray et al. (2009) found over 90% of cats were neutered. Further research is needed to explore the low proportion of neutering in this study. Male cats were at increased risk of overweight/obesity compared to female cats and this concurs with previous studies (see Section 1.2.3). Male cats are more at risk of diabetes mellitus than females (Panciera et al. 1990) as they are thought to be more insulin resistant than females (Appleton et al. 2001). The relationship between obesity development, diabetes mellitus and insulin resistance is complex, but the evidence suggests that underlying metabolic differences may account for increased risk in males. An interaction term between neutered status and sex did not improve the fit of the final model and was not statistically significant. This therefore suggests that the effect of neutering on the risk of being overweight/obese is equal for males and females. Age appeared to be an important risk factor for feline overweight/obesity, with increased risk during middle age. All age groups compared to the junior life stage (1-2 years) were at greater risk of overweight/obesity, with a peak in the mature age group (7-11 years) in the GLM with age as a categorical variable. The GLM in which age was modelled with a spline was a better fit to the data and showed that there was a peak in prevalence at 6 to 7 years of age. A peak in risk during middle age was also found by Russell et al. (2000), Scarlett et al. (1994) and Robertson (1999). The reduction in risk seen in older age is probably due to concurrent geriatric diseases, such as feline hyperthyroidism (Peterson 2000) and chronic renal disease (Polzin et al. 2000). Chapter 3 investigated the geographical distribution of canine obesity using a similar database and showed geographical variation in prevalence. No spatial variation in feline overweight/obesity prevalence, at a regional level, was found by the analysis in this chapter once risk factors such as sex, neutered status and age were taken into account. Indoor cats are shown to be at greater risk of obesity than cats with outdoor access (Scarlett et al. 1994) so it might have been expected some geographical variation correlating with differences in the percentage of 75
94 multi-unit housing between locations. Lund et al. (2005) found a similar lack of geographical variation in a cross-sectional study of cats from private practices in the United States. There are a number of possible reasons behind this. Lund et al. (2005) proposed that the geographical homogeneity in prevalence in the United States could be due to similar lifestyles throughout the country. Breed was not identified as a risk factor for feline overweight/obesity in this analysis. A recent study suggested a genetic component to the development of obesity in cats (Häring et al. 2011) and it might be expected that this could lead to variations in risk between breeds similar to that seen in dogs (McGreevy et al. 2005; Lund et al. 2006). One reason for this difference may be that the majority of genetic diversity in the cat population is demonstrated within breeds rather than between breeds in contrast to the domestic dog population which shows a much greater between breed variation than within breed (Menotti-Raymond et al. 2008). In addition, this study contained mostly domestic short and long haired cats, so it had little power to detect any variations in risk between breeds. The AUC result from the final overweight/obesity model showed that non modifiable risk factors such as age, sex and neutered status do not fully explain an individual s risk of obesity. Modifiable risk factors not included in our models, such as activity level, husbandry and owner characteristics (Allan et al. 2000; Robertson 1999; Russell et al. 2000), have been shown to affect the probability of a cat being overweight/obese, and their absence from the model may explain the moderate explanatory ability. In addition, there is likely to be a complex web of multiple interactions between risk factors which the model failed to capture, for example, neutering in cats is related to age and confinement indoors (Murray et al. 2009). Although the partial attributable risk results need to be treated with caution due to the wide confidence intervals, they provide an indication of the potential benefits of targeted interventions aimed at various risk factors to prevent the development of feline overweight/obesity. Preventing obesity in neutered cats could bring the greatest reduction in prevalence. Given the accepted benefits of neutering, targeting obesity prevention measures to owners at the time of neutering may be prudent in obesity reduction. The unexplained variance related to the variation within the model that was not explained by the included risk factors. Husbandry related risk factors (see Section 1.2.3) were not in the final model and these factors are likely to explain some of this variance. The study found no correlation between canine and feline age adjusted prevalence at the practice level. Chapter 3 showed significant spatial variation in canine prevalence of overweight/obesity. Although there are demonstrable country differences in prevalence of potentially important magnitude, these were not statistically significant once other risk factors were taken into account. This result was not unexpected. Several studies have shown the close ties between canine obesity and owner factors such as owner age and income. Studies have shown positive relationships between dogs being overweight and the degree of overweight in their owners (Heuberger & Wakshlag, 2011; Nijland et al. 2010). Nijland et al. (2010) failed to find this relationship in cats whereas Heuberger & Wakshlag (2011) found the strength of the relationship to be inversely related to the age of the owner. The built 76
95 environment and socio demographic features of each area may therefore have more impact on the prevalence of canine and human overweight/obesity than feline overweight/obesity, leading to little spatial variation in feline overweight/obesity prevalence compared to human and canine overweight/obesity. Relative to the prevalences of cat and dog obesity calculated in this chapter and Chapter 3, the prevalence of overweight/obesity in rabbits was low. The descriptive statistics and correspondence analysis did suggest that rabbits that were female and/or had been neutered were more likely to be overweight. Interestingly, these are similar risk factors to those identified in cats and dogs (see review by German 2006). Data were not available on husbandry factors, which is disappointing as, if rabbits are similar to other species, these are likely to be influential in the development of obesity. This warrants further investigation in other studies given the disease/welfare burden obesity is likely to present to the pet rabbit population. However 16% were classified as underweight (BCS 1 or 2) and this also deserves further exploration. There are several limitations to this study as discussed in Chapter 3. The data were gathered from 47 practices by multiple vets (the study population). This would have been likely to have led to misclassification of BCS as assessment of the uniformity of BCS scoring was not feasible. It would have been useful to have information on inter and intraobserver agreement on body condition scoring to evaluate this. There appeared to be no difference in the neutered status and sex of cats with a BCS score and those cats without a BCS score. However, there was a significant difference in age between these two groups of cats. Given the small number of cats in the non response group, it is difficult to comment on whether this finding was spurious. Overall, the evidence suggests that non-response bias may be absent from these data. Therefore it is difficult to prove this conclusively as data on why BCS was missing were not available and multiple reasons are possible. The data were sourced from a population of vet-visiting cats and this has been previously recognised to introduce several biases into the study (Murray & Gruffydd-Jones, 2011). In addition, this practice group has criteria for owners to register i.e. owners must live within a certain distance of the practice and demonstrate low household incomes. It is also possible that one individual cat may contribute to more than one record if the individual presented more than once although the total numbers of cats included mean that the effects of infrequent occurrence of this is likely to be negligible. One of the aims of this practice group is to provide free veterinary services to people in need. To qualify for treatment at the practices within this study, owners needed to demonstrate they received state financial assistance due to low household incomes and have lived within a defined catchment area. Therefore, the practices tend to be sited in or near areas of greatest demand which, in turn, are more likely to be socio-economically deprived. These factors may have affected the generalisability of the findings outside this study population to the target population (the vet-visiting population of cats in the U.K). Body condition scoring in rabbits is not well described and has not been validated in small animal practice. Further studies are needed to describe and validate a rabbit body condition scoring system in the first opinion setting as previous published studies have been limited to commercial production for food (Cardinali et al. 2008) or the scoring size has been aimed at owners and not fully validated i.e. PFMA Size-O-Meter ( Consulting veterinarians may be 77
96 less accustomed to body condition scoring rabbits than other species because of the lower proportion of consultations that involve rabbits. Nevertheless, dichotomising these data into overweight and not overweight categories should have greatly reduced the potential for misclassification bias in the study. The mean number of records contributed by each practice per day was 8, a relatively small number. However, the range was large with between 1 to 36 records per practice. This probably reflects the different practice sizes within the PDSA. 4.5 Conclusion In conclusion, this chapter demonstrates that overweight/obesity is common in the vet visiting cat population with more than one in ten cats being overweight/obese. Neutered status, the prime/mature life stages, and being male were identified as risk factors for overweight/obesity, with neutered status being the greatest driver of overweight/obesity in cats. Breed did not appear as a significant risk factor. This chapter also shows that the prevalence of being overweight in rabbits does not appear to be as great as for other companion animals. Interestingly, from the limited data available here, it appears as though the risk factors associated with overweight are likely to be similar as for other species, providing evidence to support a common aetiology. A larger study, among vets trained in body condition scoring specifically for rabbits, allowing investigation of risk factors including husbandry is desirable, as this information is vital for successful obesity management and prevention. Interpretation of these findings should be cautious bearing in mind the multitude of potential biases inherent in these studies. 78
97 Chapter 5 A cross-sectional study of the risk factors associated with canine overweight/obesity in first opinion practices in Glasgow Published in part in Journal of Small Animal Practice (2010) Introduction The objectives of this chapter were to assess the relationships between socioeconomic and other modifiable factors and canine obesity. Chapter 3 provided an estimate of the prevalence of canine overweight/obesity from a nationally distributed population and identified non modifiable risk factors for canine overweight/obesity. The objectives of this study were to investigate the prevalence of canine overweight/obesity in the Glasgow area, Scotland and to explore the effect of potential modifiable risk factors of lifestyle, owner demographic influences and assess owner understanding of canine overweight/obesity. Relationships between owner factors such as income and age and canine obesity have been reported but these studies have either been outside the United Kingdom and based on small sample sizes (Kienzle et al. 1998). 5.2 Materials and Methods Data collection A questionnaire was developed and distributed to two different practice types: first, to a single charitable first opinion small animal veterinary practice; and second, to four private first opinion veterinary practices in July All practices were located in and around the Glasgow area. The questionnaire was laid out in several clear sections and consisted of both open and closed questions. Detailed questions were asked about the dog s signalment and diet, including how often the dog was fed, with what type of food, and whether it was fed table scraps, snacks and treats. Owners were also asked if they were aware of health risks associated with canine obesity. Finally, owners provided details about their own age, the amount they exercised their dog and their annual household income. The questionnaire is available in the Appendix A. Each dog had a body condition score assigned by one of the participating veterinary surgeons or a veterinary student trained in this procedure using published guidelines (German et al. 79
98 2006). A morphometric technique was chosen, and was adapted from S.H.A.P.E (Size, Health And Physical Evaluation) for overweight/obesity assessment (see Figure 2.2). This is noninvasive as well as being inexpensive, more standardised between breeds than body weight and it has been shown to have reproducible results (German et al. 2006). In addition, German et al. (2006) demonstrated a highly significant association between the algorithm system score and estimated body fat percentage determined by dual X-ray absorptiometry. The algorithm (Waltham Shape Guide for Dogs ) was provided to all participating practices. The numbers from one to seven were interpreted in numerical order as 1: extremely underweight (the dog has a very small amount or no total body fat), 2: underweight (the dog has only a small amount of total body fat), 3: lean (the dog is at the low end of the ideal range with less than normal body fat), 4: ideal (the dog has an ideal amount of total body fat), 5: mildly overweight (the dog is at the upper end of the ideal range with a small amount of excess body fat), 6: moderately overweight (the dog has an excess of total body fat) and 7: extremely overweight (the dog has a large amount of excess total body fat that is affecting its health and well being) (Waltham Shape Guide for Dogs 2009). The body condition score is henceforth called the SHAPE score to minimise confusion with other body condition scoring systems used in veterinary medicine. The objectives and methods were carefully explained to all practices taking part in the study, and the questionnaire was approved by the University of Glasgow Ethics Committee. The questionnaire was administered to a convenience sample of owners who agreed to take part in the survey by the veterinary student or veterinary surgeon, in the waiting area during normal consultation hours and each dog was only included in the study once. No owners asked refused to participate in the survey. In addition, only one dog per household was included. Either a veterinary surgeon or veterinary student administered the questionnaires. The survey ran for five consecutive weeks. No records were kept on the number of questionnaires collected at each visit at a practice Statistical analyses All the statistical analyses were carried out in R version (The R Foundation for Statistical Computing). Statistical significance was defined as p<0.05. Only dogs reported by their owners to be 1 year or above were included in the analyses, as in previous studies (Mason 1970; McGreevy et al. 2005). Owner household income was split into groups of less than 10,000, 10,000-20,000, 20,000-40,000 and greater than 40,000. Two statistical methods were used to examine the data. The first analysis used binomial logistic regression and split the dog population into overweight and non overweight. The second analysis used multinomial logistic regression and the dog population was divided into four groups (underweight, ideal, overweight and obese). These separate analyses were carried out to examine the effect of different statistical methods and definitions of overweight/obesity on the identification of potential risk factors for overweight/obesity in dogs. 80
99 Binomial logistic regression Dogs were divided into two groups: those with a SHAPE score of 1-5 were classed as not significantly overweight and those with a SHAPE score of 6-7 (moderately and extremely overweight) as obese. To examine associations between obesity and risk factors, crude odds ratios (OR) and 95% confidence intervals (95%CI) were calculated. Fisher s exact tests or Chi square tests were carried out as appropriate (Fisher s exact test was used where any counts in cells in the contingency table were under 4). Relevant risk factors were also examined for association with owner income and age. Mantel Haenszel odds ratios were calculated to explore potential confounding. Mann Whitney U tests or Kruskal Wallis tests were used to assess associations between obesity and continuous variables, such as age of dog, as these variables were not normally distributed according to graphical assessment. Finally, forward and backward stepwise logistic regression was used to build the multivariable model. All variables with a p-value <0.25 in the univariable analysis were included in the stepwise selection (Dohoo et al. 2003). Interactions and confounding between explanatory variables were assessed. Model fit was examined using Hosmer and Lemeshow goodness of fit test. Residuals were plotted to detect any outlying or influential observations. Continuous variables in the final model were categorised into 4 dummy variables according to quartiles. The log odds for these variables were calculated and plotted. Linearity was then visually assessed. To explore interactions within the final model, plots of the predicted probability of a dog being obese were created, stratified by the potential risk factors. The final model also was rerun excluding dogs with SHAPE score 1 to 2. The associations in this model were checked against the original model for changes in direction and magnitude which may have indicated any undue influence from this subgroup. A second set of univariable and multivariable analyses was carried out (identical to the original method) where the dogs with SHAPE score 5 were placed into the overweight group. Based on data presented by German et al. (2006), these dogs had a body fat percentage equivalent to a body condition score (BCS) of 6 on the Purina 9 point scale (classed as too heavy). Although it was felt these dogs were not significantly overweight/obese, they were likely to have reduced longevity as a consequence of their weight (Kealy et al. 2002). The results from this analysis were then compared to the original analysis. Multinomial logistic regression Dogs were divided into four body shape groups: those with a SHAPE score of 1-2 were classed as underweight, those with a SHAPE score of 3-4 as ideal, dogs with a SHAPE score of 5 as overweight, and those with a SHAPE score of 6-7 as obese. These classifications were based on previous classifications and groupings by German et al. (2006) and Kealy et al. (2002). To examine associations between obesity and individual risk factors, relative risk ratios (RRR) and 95% confidence intervals (95%CI) were calculated using multinomial logistic regression (reference category = ideal (SHAPE score 3-4)). Finally, forward and backward stepwise 81
100 logistic regression was used to build the multivariable multinomial model. All variables with a p-value <0.25 in the first analysis were included in the stepwise selection (Dohoo et al. 2003). To assess model fit, three separate logistic regression models for each pair of comparisons (ideal/underweight, ideal/overweight and ideal/obese) were created containing the risk factors. Residuals were plotted from each model to detect any outlying or influential observations. The final model was rerun excluding any outlying or influential observations and the coefficients were evaluated for any significant change. 5.3 Results Descriptive and univariable analysis In total, 829 questionnaires were adminstered by interview. Four hundred questionnaires were completed at the charity practice and 429 in the private practices. Responses from 696 questionnaires from dogs one year old or over with recorded SHAPE scores were used in the analyses. Of the 696 dogs, 35.3% (n=246) were classed as an ideal body shape (SHAPE score 3 and 4), 38.9% (n=271) were overweight (SHAPE score 5), 20.4% (n=142) were obese (SHAPE score 6 and 7) and 5.3% (n=37) were underweight (SHAPE score 1 and 2). The prevalence of overweight and obesity in the study population was 59.3% (binomial approximate 95%CI %) while the prevalence of obesity was 20.4% (95%CI %). There was no statistically significant difference between the proportion of animals overweight/obese between practice types (p=0.21). Breed Pure breed dogs accounted for 63% of dogs included in the survey. Yorkshire terriers (11%), Labrador retrievers (8.4%), German Shepherd dogs (8.1%), Border collies (6.1%) and West Highland white terriers (5.9%) were the most popular breeds reported by owners. Twenty six owners (5.2%) reported having purebred dogs but did not state the breed. These five breeds made up 38.9% of the pure breed dogs and 24.7% of all the dogs within the study. Almost all the 20 most popular breeds shown in the Kennel Club registrations 2006 were represented in the most numerous breeds in this survey. Of the Kennel Club breed groups (Kennel Club 2009), the Toy (19.0%) and Gundog (19.7%) groups were most strongly represented in the study population. Age In total, 149 dogs (21.4%) were two years old or younger, 278 dogs (39.9%) were between three and eight years old and 269 dogs (38.6%) were nine years or older. There was a significant correlation between owner age and dog age (Kendall s tau =0.20, p<0.001), Figure 5.1). 82

101 83 Figure 5.1 Violin plot of age of dog stratified by owner age category.
102 Sex and neutered status The overall sex distribution was 251 (36%) entire male, 144 (21%) entire female, 119 (17%) male neutered and 178 (26%) female neutered. These data were missing for four dogs. The odds of being neutered compared to entire significantly increased with owner income (< 10,000 Odds ratio(or) =1, 10-20,000 OR=1.93 ( ), 20-40,000 OR=1.95 ( ) and > 40,000 OR=2.25 ( ), p<0.001). There was no significant association between sex of the dog and income (p=0.356). No significant differences were found between the median ages of female and male dogs (p=0.345) or neutered and entire dogs (p=0.119). There was no significant association between age of owner and neutered status (p=0.60). Feeding habits The vast majority of owners (96.5%, n=673) fed either a commercial maintenance or dietetic diet. The remaining owners fed a homemade diet exclusively. Feeding scraps tended to be less common in higher income owners (< 10,000 OR = 1, 10-20,000 OR = 0.67 ( ), 20-40,000 OR = 0.53 ( ), > 40,000 OR = 0.55 ( ), p=0.013). There was no association between age of owner and feeding of scraps (p=0.84). Exercise There was no relationship between income and the amount of owner reported exercise per week (p= 0.965) or between owner age group and reported exercise (p=0.984). Owner awareness Owner awareness of the risks of obesity and of the dog s weight were significantly associated with income level of the owner (Awareness of the risk of obesity < 10,000 OR = 1, 10-20,000 OR = 1.75 ( ), 20-40,000 OR = 2.27 ( ), > 40,000 OR = 2.62 ( ) p<0.001; Awareness of dog s weight < 10,000 OR = 1, 10-20,000 OR = 2.78 ( ), 20-40,000 OR = 3.72 ( ), > 40,000 OR = 2.63 ( ) p<0.001). Owner awareness of risks of obesity and owner age group were significantly associated (18-35 years OR=1, years OR=1.54 ( ), years OR=2.11 ( ), over 65 years OR=0.83 ( ), p=0.002). Stratified analysis using Mantel Haenszel odds ratios showed no evidence of confounding between owner awareness, owner income and owner age (p=0.93). 84
103 Owner Income and Owner Age Owner age and income were significantly associated. Owners that were 51 to 65 years and older than 65 years were 44% and 79% less likely have an income above 20,000 compared to 18 to 35 year old owners respectively (18-35 years OR =1, 35 to 50 years OR= 1.1 ( ), 50 to 65 years OR=0.56 ( ) and above 65 years OR=0.21 ( )) Binomial logistic regression The results of the univariable analysis for obesity are presented in Table 5.1 (SHAPE score 1 to 5, considered not to be clinically obese (n=554), and SHAPE score 6 and 7, clinically obese (n=142)). The results of the univariable analysis for being overweight are presented in Table 5.2 (SHAPE score 1 to 4, considered not to be overweight (n=283), and SHAPE score 5 to 7, overweight (n=413). Breed Pure breeds and crossbreeds did not appear to differ in their risk of being SHAPE score 6 or 7 (OR = 0.89 ( ) p=0.563) or being SHAPE score 5 to 7 (OR 0.86 ( ), p=0.360). There appeared to be no association between the Kennel Club breed groups and being SHAPE score 6 or 7 (p=0.25) or being SHAPE score 5 to 7 (p=0.26). There was no association between individual breed and being SHAPE score 6 or 7 for any of the breeds analysed which had more than 5 representatives in the survey. Three breeds were significantly associated with overweight status. Boxers were less likely to be overweight compared to other dogs (n=19, OR=0.32 ( ), p=0.019). Shih Tsus were also at reduced risk (n= 14, OR=0.28 (0.06-1), p=0.03). West Highland White Terriers were over three times more likely to be overweight than other dog breeds (n=26, OR=3.28 ( ), p=0.014). Age Dogs with SHAPE score 6 or 7 had a statistically significant higher median owner reported age than non obese dogs (dogs with SHAPE score 6 or 7 median age =8 years (range = 1-19), dogs with SHAPE score 1 to 5 median age = 7 years (range = 1-22 years), Kruskal Wallis test p<0.001). This relationship was also found to be statistically significant when comparing overweight and non overweight dogs (dogs with SHAPE score 5 to 7 median age = 7 years (range = 1-22 years), dogs with SHAPE score 1 to 4 median age = 6 years (range = 1 18), Kruskal Wallis test p=0.008). Sex No significant association was found between obesity and the four individual groups, male entire, female entire, female neutered, male neutered (p=0.169). However, female dogs 85
104 Table 5.1 Results of the univariable analysis of obesity (SHAPE1-5 versus SHAPE 6-7) Variable Income of the owner Owner knowledge of dog s weight Number Number of dogs of missing values Odds ratio (95%CI) P value 1 to 5 6 to 7 < 10, ,000-20, ( ) 20,000-40, ( ) > 40, ( ) No Yes ( ) Owner awareness of the health risks of obesity Sex of owner Age of owners (years) Sex of dog Neutered status of dog Frequency of feeding dog per day Frequency of feeding dog table scraps Frequency of feeding the dog snacks/treats No Yes ( ) 0.65 Male Female ( ) ( ) ( ) > ( ) <0.001 Male Female (1-2.18) Entire Neutered ( ) 0.18 Once Twice ( ) Three times ( ) Ad libitum ( ) Never Month ( ) Week ( ) Daily ( ) Never Month ( ) Week ( ) Daily ( )
105 Table 5.2 Table 2 Results of the univariable analysis for overweight (SHAPE 1-4 versus SHAPE 5-7) Variable Income of the owner Owner knowledge of dog s weight Owner awareness of the health risks of obesity Sex of owner Age of owners (years) Dog sex Dog neutered status Frequency of feeding the dog per day Frequency of feeding snacks/treats to dog Frequency of feeding the dog table scraps Number of dogs Number of missing values Odds ratio (95%CI) P 1 to 4 5 to 7 < 10, , ( ) 20,000 20, ( ) 40,000 > 40, ( ) No Yes ( ) No Yes ( ) Male Female ( ) ( ) ( ) > ( ) <0.001 Male Female ( ) Entire Neutered ( ) Once Twice ( ) Three ( ) times Ad libitum ( ) Never Month ( ) Week ( ) Daily ( ) Never Month ( ) Week ( ) Daily ( )
106 (neutered and entire) were significantly more likely to be clinically obese than male dogs (OR =1.47 (1-2.18), p= 0.039). Neutered status had no association with obesity (p= 0.18). The converse situation occurred with overweight/obese animals. There was no association between sex and overweight/obese status (p=0.130) although neutered dogs were significantly more likely to be overweight/obese than entire dogs (OR = 1.62 ( ), p=0.002). Female neutered dogs were 68% more likely to be overweight/obese compared to male entire dogs (Male entire OR=1, Female entire OR=1.42 ( ), Female neutered OR=1.68 ( ), Male neutered OR=1.19 ( ), p=0.018). Feeding habits There were no significant associations between obesity and feeding habits; namely frequency of feeding per day, frequency of snacks or treats and frequency of feeding table scraps (Table 5.1). There were no associations between frequency of feeding per day and frequency of feeding table scraps and being overweight/obese (p=0.701, p=0.079). However, there was a significant relationship between the frequency of snacks or treats and overweight/obese status (Never OR=1, Monthly OR=2.28 ( ), Weekly OR=1.36 ( ), Daily OR=1.75 ( ), p=0.004). Exercise Dogs classified as obese were reported to receive significantly fewer exercise hours per week than non obese dogs (Obese dog median = 10 hours per week (range= 1-60), Non obese dogs = 11 hours per week (range= 1-100), p =0.029 Figure 5.2). There was no significant difference in the number of exercise hours per week reported between overweight/obese and non overweight/obese dogs (Overweight dog median = 10 (range= 0-60), non overweight dog median = 10 (range= 1 60), p=0.110 Figure 5.2). 88
107 89 Figure 5.2 Violin plot of hours of exercise per week grouped by canine body shape (Non obese=1-5, Obese=6-7, Non-overweight=1-4, Overweight=5-7)
108 Owner awareness Owner awareness of the risks of obesity and of their dog s weight were not significantly associated with obesity or overweight/obesity status although both factors were significantly associated with income level of the owner (Awareness of the risk of obesity < 10,000 OR = 1, 10-20,000 OR = 1.75 ( ), 20-40,000 OR = 2.27 ( ), > 40,000 OR = 2.62 ( ) p<0.001; Awareness of dog s weight < 10,000 OR = 1, 10-20,000 OR = 2.78 ( ), 20-40,000 OR = 3.72 ( ), > 40,000 OR = 2.63 ( ) p<0.001). Owner Income and Owner Age Owner age and income were both significantly associated with overweight/obesity and obesity. Owners aged between years and over 65 years were significantly more likely to have dogs that were overweight/obese and obese compared to owners aged 18 to 35 years. Owners that had incomes between 10,000 to 20,000 were 1.9 times more likely to be overweight/obese than owners with incomes below 10,000. Owners with incomes between 20,000 to 40,000 and over 40,000 were significantly less likely to have obese dogs than owners with less than 10,000. Multivariable binomial logistic regression analysis The results from the obesity analysis (SHAPE score 6 to 7) are presented in Table 5.3. Three variables emerged in the final obesity model. The multivariable overweight (SHAPE score 5 to 7) results are presented in Table 5.4. Four variables were in the final overweight model. Variable Level Odds ratio (95%CI) P value Income of owner < 10, ,000-20, ( ) ,000-40, ( ) 0.02 > 40, ( ) 0.01 Age of owner (years) ( ) ( ) 0.19 > ( ) 0.95 Exercise (hours per week) 0.91 ( ) 0.04 Age of owner: Exercise per week ( ) ( ) 0.75 > ( ) 0.1 Table 5.3 Results of the multivariable binomial logistic regression obesity model (SHAPE 1-5 versus SHAPE 6-7) 90
109 Variable Level Odds Ratio (95%CI) P value Income of owner < 10, ,000-20, ( ) ,000-40, (0.36-1) 0.05 > 40, ( ) 0.95 Age of owner (years) ( ) ( ) 0.01 > ( ) 0.01 Sex/neutered status Male entire 1 Female entire 1.85 ( ) 0.03 Female neutered 2.25 ( ) <0.001 Male neutered 1.94 ( ) 0.03 Frequency of feeding snacks and treats Never 1 Month 3.23 ( ) <0.001 Week 1.44 ( ) 0.35 Daily 2.01 ( ) 0.12 Table 5.4 Results of the multivariable binomial logistic overweight model (SHAPE 1-4 versus SHAPE 5-7) The final obesity model contained owner age, exercise and owner income (Table 5.3). Income of owner was strongly associated with obesity risk. Owners earning more than 40,000 were 69% less likely to have clinically obese dogs compared to owners who earn less than 10,000 (OR = ( )). There was an interaction between age of owner and amount of exercise in that the effect of exercise did not appear uniform between owner age groups. Dogs with owners in the age groups (18-35 years old) and (51-65 years old) appeared to have the greatest reduction in risk from each hour of exercise compared to the other age groups. The obesity model was rerun excluding dogs within SHAPE score 1 to 2, which accounted for 37 dogs (5.3%). There were no significant differences in the magnitude or direction of the odds ratios and associated confidence intervals compared to the original model. Two owners reported exercising their dog for more than 60 hours a week and these assessments were probably erroneous. These owners were then excluded and the model was rerun. Again, there were no significant differences in this model compared to the final model. The final model for being overweight contained owner age, owner income, sex of dog and the frequency of snacks and treats (Table 5.4). There was rising risk of a dog being overweight with increasing owner age. There was also a significant relationship with owner income. Those owners who reported any feeding of snacks and treats were more likely to have an overweight dog compared to those who did not. Female neutered dogs were more likely to be overweight than male entire dogs. When SHAPE score 1 to 2 dogs were excluded, there were no significant differences in the magnitude or direction of the odds ratios and associated confidence intervals. Multinomial logistic regression The results of the univariable multinomial risk factor analysis are presented in Table 5.5 and Table 5.6 and are summarised in the paragraph below. 91
110 Purebreeds did not appear to be significantly associated with any of the body shapes. Individual breeds were also not significantly associated with any body shape. Dogs that were classified as either obese or underweight were more likely to be older than those dogs in the ideal category. Female neutered dogs appeared to be at higher risk of being overweight and obese compared to male neutered dogs. There were no significant associations between any of the body shapes and frequency of feeding per day. Also, dogs whose owners reported feeding table scraps monthly were more likely to be classed as obese rather than ideal and dogs who received any frequency of snacks and treats were significantly more likely to be overweight than ideal. There was no significant difference in the number of exercise hours per week reported between dogs with different body shapes (underweight median=10 hours (1-60), ideal median=12 hours (0-100), overweight median=10 hours (1-56), obese median=10 hours (1-60)). The risk of obesity and being overweight was significantly associated with the income of owner. There was also an increasing risk of obesity and being overweight with increasing owner age (p<0.001). 92
111 Obese (n=142) Overweight (n=271) Underweight (n=37) Variable Number of Number of RRR(95%CI) P value RRR(95%CI) P value RRR (95%CI) Pvalue missing dogs values 10, Income of the owner 10,000-20, (0.69,2.39) (1.26,3.64) (0.17,2.33) ,000-40, (0.22,0.76) (0.54,1.4) (0.39,2.24) , (0.14,0.84) (0.86,2.58) (0.26,2.63) No Owner knowledge of Yes (0.67,1.65) (0.7,1.48) (0.26,1.09) dog s weight No Awareness of health Yes (0.6,1.58) (0.75,1.71) (0.52,2.83) risks of obesity Sex of owner Female Male (0.71,1.9) (0.76,1.71) (0.91,4.11) Age of owner (years) (0.63,2.14) (0.63,1.52) (0.32,1.65) (1.68,6) (0.9,2.49) (0.24,1.95) > (1.85,8.5) (0.91,3.37) (0.11,2.59) Table 5.5 Individual multinomial associations between body shape and potential owner risk factors. Relative risk ratios=rrr, 1 = mean, 2 = standard deviation 93
112 Obese (n=142) Overweight (n=271) Underweight (n=37) Variable Number of Number of RRR(95%CI) P value RRR(95%CI) P value RRR (95%CI) Pvalue missing dogs values Male entire Sex of dog Female entire (0.83,2.59) (0.63,1.66) (0.54,3.05) Female neutered (1.25,3.67) (1.04,2.57) (0.36,2.43) Male neutered (0.78,2.76) (0.94,2.56) (0.30,2.63) 0.84 Once Frequency of feeding Twice (0.61,1.74) (0.56,1.31) (0.45,2.74) per day Three times (0.36,1.85) (0.34,1.31) (0.3,4.18) Ad libitum (0.43,3.2) (0.33,1.89) (0.22,6.6) Never Frequency of feeding Month (1.26,4.66) (0.96,2.98) (0.67,5.9) table scraps Week (0.64,1.83) (0.59,1.38) (0.66,3.48) 0.33 Daily (0.73,2.39) (0.57,1.54) (0.29,2.74) Never 6 59 Frequency of Month (0.71,2.85) (1.64,6.97) (0.31,3.35) snacks/treats Week (0.38,1.64) (1.03,4.51) (0.38,3.94) Daily (0.37,2.2) (1.11,5.98) (0.08,2.85) Age of dog Per Year ( ) 1.09(1.04,1.14) (1,1.08) (1.01,1.19) Exercise Per hour per week ( ) 0.98(0.95,1) (0.97,1.01) (0.94,1.03) Table 5.6 Individual multinomial associations between body shape and potential dog level risk factors. Relative risk ratios=rrr, 1 = mean, 2 = standard deviation 94
113 Multivariable multinomial logistic regression analysis The results from the multivariable analysis are presented in Table
114 Obese (n=142) Overweight (n=271) Underweight (n=37) RRR(95%CI) P value RRR(95%CI) P value RRR(95%CI) P value Frequency of snacks/treats Never Month 2.82(0.9,8.81) (1.56,9.25) (0.19,3.65) Week 1.47(0.46,4.76) (0.77,4.87) (0.31,5.47) Daily 1.94(0.51,7.43) (0.86,7) (0.03,3.99) 0.41 Age of owner (years) (0.47,2.05) (0.46,1.32) (0.25,1.82) (1.23,6.22) (0.79,2.93) (0.03,1.81) > (1.97,24.8) (1.38,13.61) (0.33,13.73) Income of the owner < 10,000 10,000-20, (0.6,2.84) (1.22,4.58) (0.28,4.56) ,000-40, (0.17,0.77) (0.43,1.36) (0.29,2.68) , (0.1,0.84) (0.7,2.5) (0.18,2.92) 0.64 Exercise Per hour per 0.96(0.92,0.99) (0.96,1) (0.94,1.03) 0.58 week Table 5.7 Final multivariable multinomial logistic regression model results 96
115 The final model consisted of owner age, exercise, frequency of snacks and treats and owner income. Owner income was significantly associated with obesity. Owners earning more than 40,000 were 61% less likely to have clinically obese dogs compared to owners who earned less than 10,000. There also appeared to be a similar relationship between a dog being overweight/obese and owner income. Increasing owner age also significantly increased the odds of a dog being either overweight or obese rather than an ideal body shape. Dogs belonging to owners who reported feeding snacks or treats monthly were found to be at greater risk of being overweight compared to those dogs belonging to owners who reported never feeding snacks or treats. The risk of a dog being obese decreased by 4% for each additional hour of exercise a dog received per week. To visualise the effect of exercise on body shape, the predicted probabilities of each body shape from the final model were plotted against the number of reported hours of exercise per week (Figure 5.3). There was a decline in the probability of a dog being obese, while the probability of a dog being ideal increased with increasing weekly exercise time. No risk factors in the final model were significantly associated with an underweight body shape. Interactions terms were introduced into the model but did not significantly improve the model fit. Figure 5.3 Predicted probabilities of canine body shapes by hours of weekly exercise 5.4 Discussion Overweight/obesity occurs when animals are in positive energy balance for an extended period of time either due to excessive dietary intake or inadequate energy utilisation. It can be 97
116 defined as a condition of excessive energy storage, in the form of adipose tissue, to the degree that it results in adverse effects on health and longevity (Burkholder & Toll 2000). In this study, 59% of dogs were above their ideal body condition, with 20% being considered clinically obese (SHAPE score 6 and 7). Earlier studies in the United Kingdom using the 5 point scale for body condition scoring classified 24% of dogs as obese (Edney & Smith 1986) and one in four dogs were classified as overweight or obese in Chapter 3. However, the use of the 7 point S.H.A.P.E system for overweight/obesity assessment in this study, and lack of uniformity in methods between previously published studies, limits the potential for useful comparisons to be made. The three multivariable models contained different risk factor combinations. All three models identified owner age and income as risk factors. Owner income greater than 20,000 was associated with decreased risk of obesity/overweight while increasing owner age was associated with increased risk of obesity/overweight. Hours of exercise were present in the multinomial model and in the binomial obese model, with each additional hour of exercise being associated with decreased risk of obesity. However, in the binomial obesity model, there was an interaction with age of owner that led to age of owner becoming non-significant. The binomial overweight model and the multinomial model also contained frequency of feeding snacks and treats, and both showed that monthly feeding of snacks and treats was associated with being overweight. The univariable analyses demonstrated that obese dogs had a higher median age and were more likely to be female neutered, in accordance with Colliard et al. (2006). Neutered status was found to be a risk factor in previous reports (Colliard et al. 2006; Edney & Smith 1986; Sloth 1992). Hypotheses for this increased risk in neutered animals include a decrease in metabolic rate, alterations in feeding behaviour and reduced physical activity. These are discussed in more detail by German (2006). There was a significant increase in the probability of neutered status with increasing income which may be due to either the owner s ability to afford preventive health measures for their dog or a reflection of their awareness of the health and other benefits of neutering. Associations between socio-economic factors and neutered status have also been found by Finkler et al. (2011). No associations were found with breed or breed group and obesity. Previous reports have described the effect of genetics and obesity (Edney & Smith 1986; Mason 1970). It is possible that, in some previous studies, breed may have been cited as a proxy for other unmeasured (or poorly measured) confounders. This includes environmental factors such as exercise levels or caloric intake that are often more proximally associated with health related outcomes. More recently, a study showed that crossbreed dogs are more likely to be overweight than purebreds (McGreevy et al. 2005). Nevertheless, it may be difficult to rank breed propensity to become obese, as other factors such as urban or rural habitats, sex and neutered status have been shown to affect breed risk (McGreevy et al. 2005). Dogs classed as obese received significantly fewer exercise hours per week than non-obese dogs. More specific in-depth information about intensity or type of exercise was not obtained and results should be interpreted with this in mind. It must also be taken into account that household members may exercise the dog other than the owner completing the questionnaire. It is important to bear in mind that it is recognised in humans that self-reported physical 98
117 activity is prone to errors from day-to day variations, inaccurate memory and estimation, and biased recall associated with overweight/obesity status. Objective measures of physical activity, such as the use of accelerometry (Yam et al. 2011), would improve the validity and precision of measurements. This may be particularly pertinent since there is a strong inverse relationship between socio-economic status and prevalence of obesity which can in part be explained by patterns of physical inactivity rather than by changes in dietary fat intake (Prentice & Jebb 1995). The binomial obesity model suggested that exercise may moderate the relationship between owner age and obesity. Owner age did not affect the amount of exercise a dog received but the intensity of exercise may differ according to the age of the owner. Further work to explore this relationship would help inform preventive and management protocols. Monthly feeding of snacks and treats appeared as a risk factor in the final multinomial multivariable model for being overweight and the binomial overweight model. It was not a risk factor for obesity and those dogs whose owners reported feeding snacks and treats on a more regular basis (weekly or daily) were not at increased risk of being overweight. This is contrary to the findings of some previous studies where the feeding of snacks has been shown to be associated with obesity (Robertson 2003; Mason 1970; Sloth 1992), although in agreement with Holmes et al. (2007). Owner response bias may have played a role in these results. The validity of self reported dietary history in humans has been reported to be poor, especially in obese subjects (Little et al. 1999), and this may have been the case in this study. Interestingly, only owner related factors remained in the final multinomial model. Despite the study limitations, this would suggest that factors specific to the owner, such as their age, income and the amount of exercise they give their dog are more influential than dog level factors such as breed, age or neutered status in canine obesity. None of the factors were significant for underweight dogs in the final model. While the moderate sample size may have been a factor, it was possible that these dogs had unmeasured factors such as concurrent disease which resulted in SHAPE scores 1 and 2. This is supported by a study by Doria-Rose & Scarlett (2000), which identified pre-existing disease as a risk factor for emaciation in cats. Socioeconomic status seems to be an important factor in the development of canine obesity. The risk of obesity was significantly associated with owner income; those in the highest income bracket being much less likely to have obese dogs. Neither lower household income nor obesity were found to be associated with the feeding of table scraps, snacks or treats, reduced exercise levels or neutering. The possibility of recall bias cannot be discounted. Differences in demography of the pet owning public have previously been investigated in Germany where people on lower incomes were over-represented among the owners of obese dogs (Kienzle et al. 1998). Similarities in human medicine have also been reported. In women, there is an inverse association between socio-economic position and obesity in developed societies; women of lower income are approximately 50% more likely to be obese than those with higher income levels (Bennett et al. 2008). Furthermore, in human obesity, those groups of people with the lowest level of education have approximately 5% higher prevalence of obesity than more educated subpopulations (Gutiérrez-Fisac et al. 2002; Ball et al. 2003). 99
118 The differences between the multivariable multinomial and binomial models partially exist through amalgamating BCS categories leading to loss of information and also differences in the statistical models themselves. Statistical techniques capable of describing complex interactions between variables such as structural equation modelling may be more appropriate to explore the probable intricate web of interactions among risk factors for canine obesity/overweight. However, the data used for this study are unlikely to be of sufficient quality to justify these approaches. But despite the differences between the final models, they suggest that, although there may be factors which may predispose a dog to being overweight, the most important contributing factors to obesity are owner related. This suggests that understanding owner attitudes and behaviour is paramount in obesity prevention and treatment. Studies carried out by Rohlf et al. (2010) and Dehling et al. (2011) have begun to explore this area in companion animals. Understanding these attitudes and behaviours allows a more holistic approach to be taken to management that is more likely to be successful (Brown & Wimpenny 2011). 5.5 Conclusion It is clear that overweight/obesity was a substantial problem in this dog population, with 20% of the population investigated being obese. As with any questionnaire survey, there may have been reporting bias in the form that the questionnaire took. However, the factors that were most strongly and consistently associated with obesity were owner age, exercise and owner income. Although these factors in themselves cannot be said to cause canine obesity and are likely to be proxies for unmeasured confounders, they are clearly related to impacts on health and welfare of dogs, levels of education about obesity and approach to pet ownership. As with the association between human obesity and its social determinants, these are complex relationships. 100
119 Chapter 6 A cross-sectional study of the prevalence and risk factors for owner misperception of canine body shape in first opinion practice in Glasgow Published in part in Preventive Veterinary Medicine (2011) 102, Introduction The objectives of this chapter were to investigate whether owners were able to assign the correct body shape to their dog and to assess the dog and owner level factors associated with incorrect owner assessment of dog body shape. Successful treatment of obesity and long term weight management are priorities for first opinion companion animal practices. Current treatment options include lifestyle and dietary management and pharmaceuticals (microsomal triglyceride transfer protein inhibitors: dirlotapide (Slentrol, Pfizer), and mitratapide (Yarvitan, Jannsen)) (German et al. 2006). The success of any treatment plan is heavily reliant on owner compliance with veterinary advice (Barter 1996) and owner non compliance has been linked to failure in canine and feline weight loss programmes (Gentry, 1993). One major barrier to compliance identified in human obesity treatment is body shape misperception; that is when there is a mismatch between a person s perceived body shape and their actual body shape (Kuchler and Variyam 2003). Parental misclassification of the child s body shape has also been found to impede healthy body weight management of children (Mathieu et al., 2010). Despite many studies showing the importance of body shape misperception to human obesity prevention and treatment (Kan & Tsai 2004), a recent study of veterinarians in Victoria, Australia, found only 3% thought the owner perception of ideal weight was an important factor in canine obesity (Bland et al., 2010). No studies have formally investigated this phenomenon despite dog owners misperceiving their obese dog s body shape being previously suggested by Mason (1970) and Holmes et al. (2007). The objectives of this chapter were to describe the occurrence of canine body shape misperception by owners and to identify factors associated with owner misperception that would allow targeted interventions for prevention or treatment of canine obesity for high risk owner groups. Because a complex relationship between risk factors and misperception was likely, identification of factors was carried out using two methods: multinomial logistic regression and classification trees (a non-parametric method which would allow for higher order interactions between factors to be visualised). The predictive abilities and overall accuracies of the two approaches were then compared. 101
120 6.2 Materials and Methods Data collection A questionnaire (as described in Chapter 2) was developed and distributed to two different practice types: first, to a single charitable first opinion small animal veterinary practice; and second, to four private first opinion veterinary practices in July The survey ran for five consecutive weeks. All practices were located in and around the Glasgow area. A convenience sample of owners were asked to fill in the questionnaire while in the waiting room. No owners refused to participate. The questionnaire was laid out in several clear sections, consisted of both open and closed questions and took around 15 minutes to complete. Detailed questions were asked about the dog s signalment and diet. Owners were asked to rate their dog s body shape according to 5 word descriptions: far too thin ; a bit thin ; just right ; a bit overweight ; or very overweight (a five point scale extrapolated from Edney & Smith, 1986). No guidance was given to the owners about body condition scoring. Finally, owners provided details about their own age, the amount they exercised their dog and their annual household income. A copy of the questionnaire is available in the Appendix A. The questionnaire was pre tested on a group of staff and students at the university who were asked to comment on the understandability and the overall design of the questionnaire. This feedback led to minor refinement of the questionnaire. No records were kept on the number of questionnaires collected at each visit at a practice. Conventional validation of the majority of the questionnaire was impossible as it recorded owner perceptions and opinions, rather than facts verifiable by alternative means. Other components of the questionnaire were also difficult to validate due to their sensitive nature, such as personal income, but suitably wide ranges were specified to allow owners to feel comfortable about the resolution at which such disclosures were made. On-the-spot visual validation of the dog s signalment by the interviewer was taken to indicate that the owner was providing information about the correct animal. Once the questionnaire had been completed, each dog had a body condition score (BCS) assigned by one of the participating veterinary surgeons or a veterinary student trained in this procedure using published guidelines (German et al. 2006) - Figure 2.2. A validated morphometric body condition scoring (BCS) technique was chosen, and was adapted from S.H.A.P.E (Size, Health And Physical Evaluation) for the obesity assessment. This is noninvasive as well as being inexpensive and it has been shown to have been repeatable and reproducible within and between animals of different breeds (German et al. 2006). The algorithm (Waltham Shape Guide for Dogs 2009) was provided to all participating practices. The numbers from one to seven were interpreted in numerical order as: 1: extremely underweight (the dog has a very small amount or no total body fat); 2: underweight (the dog has only a small amount of total body fat); 3: lean (the dog is at the low end of the ideal range with less than normal body fat); 4: ideal (the dog has an ideal amount of total body fat); 5: mildly overweight (the dog is at the upper end of the ideal range with a small amount of excess body fat); 6: moderately overweight (the dog has an excess of total body fat); and 7: extremely overweight (the dog has a large amount of excess total body fat that is affecting its health and well being) (Waltham Shape Guide for Dogs 2009). 102
121 The project objectives and methods were carefully explained to all practices taking part in the study, and the questionnaire was approved by the University of Glasgow Ethics and Welfare Committee. All owners with dogs attending the practice during normal consultation hours were asked to participate. The questionnaire was administered to clients who agreed to take part in the survey by the veterinary student or veterinary surgeon, in the waiting area. Each dog and household was only included in the survey once. In cases where more than one dog was with an owner, the first dog waiting to present to the veterinarian was chosen Statistical Analyses All the statistical analyses were carried out in R version ( ) (The R Foundation for Statistical Computing). Dogs were excluded from the analyses if they were less than 1 year of age as in previous studies (Mason 1970; McGreevy et al 2005) or if either interviewer or owner BCS assessment was missing. Statistical significance was defined as p<0.05. Dogs were divided into three body shape groups according to the interviewer assessment: those with a BCS of 1 to 2 were classed as underweight; those with a BCS of 3 to 4 as ideal; and dogs with a BCS of 5,6 or 7 as overweight. These classifications were based on previous classifications and groupings (German et al. 2006; Kealy et al. 2002; Chapter 4). The owner assessment of dog body shape was similarly divided into three groups: underweight (owner assessments = far too thin or a bit thin ); ideal (owner assessment = just right ); and overweight (owner assessments= a bit overweight or very overweight ). Owner assessment of their own body shape was divided into 2 groups: not overweight or overweight. Agreement between owner and interviewer ratings of dog body shape was assessed using weighted Kappa statistic with Fleiss-Cohen weights. The kappa statistic was interpreted as: <0.2= slight agreement; 0.2 to 0.4= fair agreement; 0.4 to 0.6 = moderate agreement; 0.6 to 0.8= substantial agreement; and >0.8= almost perfect agreement (Dohoo et al. 2003). The interviewer s assessment was taken as the gold standard. To examine the direction of owner misperception, misperception was classified into 3 categories: correct estimation (the owner gave the same shape as the interviewer); underestimation (the owner gave the dog a more underweight shape than the interviewer); and overestimation (the owner gave the dog a more overweight shape than the interviewer). The prevalence of misperception was estimated as the proportion of owners who incorrectly estimated their dog s body shape with approximate binomial 95% confidence intervals. The association between the misperception categories and dog body shape was assessed with multinomial logistic regression, with ideal acting as the reference category. The multinomial logistic regression analysis was initially carried out using the nnet package (Ripley, 2009). Separation within the data led to unstable and unrealistic estimates of the relative risk ratios and associated 95% confidence intervals. Because of this, a penalised likelihood approach using Jeffreys prior was adopted using the pmlr package (Corby et al. 2010). The odds for underestimation for BCS 4 to 7 were calculated using binomial logistic regression with Firth s bias reduction using the logistf package (Ploner et al. 2010) to investigate whether there was 103
122 any change in the likelihood of underestimation as the dog increased in BCS (BCS 4 acted as the reference level). Owner risk factors were: age of owner (18 to 35 years; 36 to 50 years; 51 to 65 years; and >65 years), income of owner ( < 10,000; 10,000 to 20,000; 20,000 to 40,000; and > 40,000), self reported overweight status of owner (overweight or not overweight), and sex of owner (male or female). Dog risk factors were: age of dog; gender; neutered status; pedigree or crossbreed; breed; breed group (pedigree dogs were assigned into one of the seven UK Kennel Club (KC) breed groups (Kennel Club 2009) according to the breed reported); and breed size (breeds were classified according the UK Kennel Club breed size groups into small, medium or large). Each variable was individually assessed in the model. Age of dog was introduced into the model as a continuous variable and as categorical variables based on tertiles (cut points = 4 and 9 years) and quartiles (cut points = 3, 7, and 11 years). The resulting Pearson residuals were examined to assess the assumption of linearity for the continuous variable (age of dog). Forward and backward stepwise selection was used to build the multivariable model. Dog body shape was forced into the models assessing dog and owner level risk factors to control for its effect. All variables significant at p<0.25 in the univariable analysis were included in the stepwise selection. First order interactions between explanatory variables were also explored. The overall accuracy of the model was compared to the proportional by chance criteria (sum of the proportion of each response category squared and multiplied by 1.25). Multinomial logistic regression has one major assumption, the independence of irrelevant alternatives, i.e. the model odds ratios for each level of the response variable are independent of the other levels. The Hausman-McFadden Test was used to assess whether the assumption was appropriate (Hausman and McFadden, 1984). Two binary logistic regression models were created from the final multivariable model (Correct estimation/overestimation and Correct estimation/underestimation). As described in Dohoo et al. (2003), regression diagnostics were carried out on each model. Covariate patterns with outlying standardised Pearson residual and delta beta values were identified. The models were then rerun excluding individuals from within these patterns and the changes in the resulting coefficients were examined. Hosmer-Lemeshow goodness of fit tests were used to assess the fit of the models. As there was potential for multiple interactions in the multinomial model, the data were reanalysed using the classification and regression tree (CART) technique. CART analysis is non-parametric so no assumptions are made about underlying distribution of the predictor variables. A tree was fitted using the full data using the rpart package with Gini splitting criterion for each node (Therneau and Atkinson, 2009). A CART model is fitted by binary recursive partitioning where the dataset is successively split into increasingly homogeneous subsets until a specified criterion is satisfied. The best tree was selected via the one-standard error rule. The full technique is described in detail by Speybroeck et al. (2004). The predictive ability of the final multinomial logistic regression model and the CART tree were compared by plotting receiver operating curves (ROC) and calculating the area under the curve (AUC) for each pairwise comparison (one class versus all other classes) using the ROCR package (Sing et al. 2005) and by comparing the overall accuracy for each model. In addition, the weighted kappa was calculated for the agreement between the predictions for each 104
123 model and the original data and between the predictions for each model. The percentage of observations correctly predicted between each model was compared overall and for each outcome category. 6.3 Results In total, 829 questionnaires were collected by interview. No owners refused to participate. Responses from 680 questionnaires from dogs one year old or over with body condition scores recorded both by the interviewer and owner were used in these analyses. 29.4% (n=200) of dogs were classified as having a normal body shape, 11% (n=75) were underweight and 59.6% (n=405) were overweight. The prevalence of owner misperception in the study was 44.1% (n=300). Underestimation of BCS was the most common form of misperception in these owners (77%, 231 owners) whereas 23% of owners (n=69) overestimated their dog s body shape Agreement between owner and interviewer rating of canine body shape There was slight to fair agreement between an owner s rating of his/her dog and the interviewer s rating (Weighted κ= 0.21, 95% confidence interval (95%CI = ) (Table 6.1). Although owners who reported themselves as overweight were significantly more likely to have overweight dogs (OR=6.85 ( ), p<0.001), the degree of agreement between owners and interviewer was similar for both overweight and non overweight owners (Overweight owner weighted κ = 0.27 (95%CI = ), Non overweight owner weighted κ = 0.20 (95%CI = )). INTERVIEWER Underweight Ideal Overweight TOTAL OWNER Underweight Ideal Overweight TOTAL Table 6.1 Count of owner rating and interviewer rating of dog body condition score Factors associated with misperception in dogs over 1 year Multinomial logistic regression results Associations between dog characteristics and misperception Variables connected with dog characteristics are summarised in Table 6.2. Sex, neuter status, age of dog as both a continuous variable and a categorical variable were not significantly associated with underestimation/overestimation in the multinomial regression with dog body shape forced into the model. The only dog characteristic associated with misperception was 105
124 Variable Levels Overall Correct estimation Overestimation Underestimation Number of missing values Age of owner (23.1) 85 (12.5) 20 (2.9) 52 (7.6) 11 (1.6) (38.5) 150 (22.1) 28 (4.1) 84 (12.4) (24.7) 93 (13.7) 11 (1.6) 64 (9.4) >65 82 (12.1) 45 (6.6) 9 (1.3) 28 (4.1) Sex of owner Female 471 (69.3) 272 (40) 49 (7.2) 150 (22.1) 37 (5.4) Male 172 (25.3) 84 (12.4) 19 (2.8) 69 (10.1) Overweight owner No 536 (78.8) 299 (44) 51 (7.5) 186 (27.4) 32 (4.7) Yes 112 (16.5) 62 (9.1) 16 (2.4) 34 (5) Income of owner 10, (40.6) 162 (23.8) 29 (4.3) 85 (12.5) 84 (12.4) 10, (16.3) 58 (8.5) 6 (0.9) 47 (6.9) 20,000 20, (19) 65 (9.6) 22 (3.2) 42 (6.2) 40,000 40, (11.8) 48 (7.1) 4 (0.6) 28 (4.1) Underweight 75 (11) 29 (4.3) 46 (6.8) 0 (0) 0 (0) Body shape Normal 200 (29.4) 160 (23.5) 23 (3.4) 17 (2.5) Overweight 405 (59.6) 191 (28.1) 0 (0) 214 (31.5) Age of dog Year 7.1 ( 4.3) 7.4(4.4) 6.9(4.648) 6.7(4.1) 0 (0) Categorised age of dog 1-4 years 160 (26.32) 4-9 years 226 (37.17) 9-22 years 222 (36.51) 88 (14.47) 16 (2.63) 56 (9.21) 0 (0) 118 (19.41) 18 (2.96) 90 (14.80) 138 (22.70) 23 (3.78) 61 (10.03) Sex of dog Female entire 141 (20.7) 81 (11.9) 15 (2.2) 45 (6.6) 4 (0.6) Female neutered 176 (25.9) 101 (14.9) 15 (2.2) 60 (8.8) Male entire 241 (35.4) 131 (19.3) 28 (4.1) 82 (12.1) Male 118 (17.4) 65 (9.6) 10 (1.5) 43 (6.3) neutered Table 6.2 Variables used in the risk factor analysis (excluding breed related variables). Percentages (denominator=total number of animals) in brackets. 106
125 dog age categorised into 3 groups. Underestimation was 50% less likely in dogs over 9 years compared to dogs under 4 years (Relative risk ratio (RRR)= 0.50 ( ), p=0.007). The type of misperception (underestimation or overestimation) appeared to be associated with the dog s body shape. Fifty three per cent (214/231) of owners with overweight dogs underestimated their dog s body shape while 61.3% (46/69) owners with underweight dogs (BCS=1) overestimated their dog s body shape. Of those owners with dogs of ideal body shape, 80% (160/200) correctly estimated their dog s body shape, 11.5% (23/200) overestimated their dog s body shape while 8.5% (17/200) underestimated their dog s body shape. The results of the multinomial regression showed that overestimation was 11 times more likely with underweight dogs while underestimation was 10.3 times more likely with overweight dogs compared to ideal dogs (Table 6.3). The odds of underestimation for BCS scores 4 to 7 were calculated to examine the effect of increasing BCS on underestimation. Using BCS 4 as the reference level, the odds of underestimation decreased as the dog became more overweight (BCS 4 OR = 1, BCS 5 OR=17.89 (95%CI ), BCS 6 OR = 4.13 (95%CI ) and BCS 7 OR= 0.28 (95%CI )). 107
126 Overestimation Underestimation Variable Coef/SE RRR (95%CI) P value Coeff/SE RRR (95%CI) P value Intercept -1.92/ /0.25 Body shape = Normal * * Body shape = Underweight 2.38/ (5.80,20.61) < / (0.001,1.20) 0.08 Body shape = Overweight -4.03/ (0,0.13) < / (6.20,18.02) <0.001 Table 6.3 Odds ratios of misperception by canine body shape (Correct estimation and normal body shape are reference categories) - Coef= coefficient; SE=Standard Error; RRR= Relative risk ratio; 95%CI= 95% confidence interval 108
127 A minority of dog owners (217, 31.9%) reported owning cross breed dogs while 35 owners (5.1%) did not give an answer. Of the 62.9% (428) of owners owning pedigree dogs, Yorkshire Terriers (10.5%, 45), Labrador Retrievers (8.4%, 36), German Shepherd Dogs (8.4%, 36), Border Collies (6.3%, 27 ) and West Highland White Terriers (6.1%, 26) were the five most popular breeds from the 70 breeds reported. These breeds made up 39.7% of the pedigree dogs. The breed groups represented in the pedigree dogs were: Gundogs (19.4%, 83); Toy (18.9%,81); Pastoral (17.1%,73), Terrier (16.6%,71); Utility (10.5%,45); Working (8.9%,38); and Hound (1.9%,8). Twenty nine people (6.8%) reported owing pedigree dogs but did not give an answer that corresponded with a recognised KC breed. Breeds were divided into size categories. 285 dogs (41.9%) could not be categorised by size as they were either crossbreeds or unrecognisable breeds. 145 dogs (21.3%) were large breeds, 100 dogs (14.7%) were medium breeds and the remaining 150 (27.1%) were small breeds. No breed variables were significantly associated with either under or over estimation of body shape. Associations between owner characteristics and misperception Demographic data are summarised in Table 6.2. Male owners were 1.63 times more likely to underestimate their dog s body shape than female owners (RRR =1.63 ( )). Those owners with incomes over 40,000 were around 70% less likely to overestimate their dog s body shape when compared to owners with incomes below 10,000 (RRR = 0.29( )). Neither an owner s self reported overweight status or age group were associated with overestimation and underestimation. Final multivariable multinomial logistic regression model Sixteen variables significant at p<0.25 at the univariable stage were offered to the final model. The final model contained sex of the owner, age of the dog categorised into three groups (1 to 4 years, 4 to 9 years (reference level), and 9 to 18 years), the body shape of the dog, and an interaction term between dog body shape and categorised age of the dog (Table 6.4). Male owners were 1.8 times more likely to underestimate their dog s body shape than female owners. The relationship between categorised age of dog and under and overestimation was dependent on the body shape of the dog. Owners with dogs between 4 and 9 years old that were underweight were 45 times more likely to overestimate their dog s body shape compared to owners of normal dogs between 4 and 9 years old (reference group). Conversely, owners of underweight dogs over 9 years were 93% less likely to overestimate their dog s body shape than the reference group. A similar relationship was seen between underestimation and age of dog with underestimation being 11 times more likely in overweight dogs aged 4 to 9 years and 76% less likely in overweight dogs over 9 years old compared to the reference group. The model percentage accuracy rate was 64.99%, satisfying the proportional by chance accuracy criteria of 54.89%. This showed that the model achieved greater accuracy than that expected by chance. Diagnostics of the two binomial logistic regression models formed from the final model showed adequate fit and the models were not affected by influential covariate patterns. The Hausman 109
128 Overestimation Underestimation Variable Coef/SE RRR (95%CI) Coeff/SE RRR (95%CI) Intercept -2.46/ /0.66 Sex of owner (Male) -0.07/ (0.37,2.19) 0.58/ (1.11,2.86) Age of dog -1 to 4 years 0.39/ (0.30,8.88) -0.16/ (0.16,4.29) Age of dog - 9 to 18 years Underweight body shape 1.36/ (1.03,21.42) 0.88/ (0.67,10.58) 3.8/ (9.20,326.16) 0.33/ (0.01,20.01) Overweight body shape -2.27/ (0,1.32) 2.39/ (3.85,41.86) Age of dog 1 to 4 yrs: Underweight body shape Age of dog 9 to 18 yrs: Underweight body shape Age of dog 1 to 4 yrs: Overweight body shape -1.52/ (0.02,1.92) -0.93/ (0.01,20.01) -2.71/ (0.01,0.47) -2.13/ (0,26.9) 0.47/ (0.01,352.75) 0.44/ (0.28,8.63) Age of dog 9 to 18 yrs: Overweight body shape -1.46/ (0,49.39) -1.42/ (0.05,0.96) Table 6.4 Final multinomial logistic model for canine body shape misperception Friedman χ 2 test statistic was with 3 degrees of freedom (p<0.001) indicating that the assumption of independence of irrelevant alternatives was inappropriate and therefore any model coefficient estimates may be invalid. Classification and regression tree analysis Final CART model Figure 6.1 shows the results of this analysis. Three variables were in the final tree: sex of owner, age of the dog and the body shape of the dog. 110
129 111 Figure 6.1 Results of CART analysis
130 Comparison of the final multivariable logistic regression and classification tree The predicted probabilities of each outcome were plotted against age for each body shape to visualize the interactions between risk factors in the final multinomial logistic and CART analyses (Figure 6.2 Final multinomial model and Figure CART analysis). Both models had an interaction between body shape and dog age. The CART analysis also contained a further interaction with owner gender, and interaction between body shape and dog age existed only for overweight dog body shape. 112
131 113 Figure 6.2 Predicted probabilities of each outcome plotted against age for each body shape - Multinomial logistic regression model
132 114 Figure 6.3 Predicted probabilities of each outcome plotted against age for each body shape - CART analysis
133 ROC curves and AUC for each category were created and compared - Figure 6.4. The ROC curves and AUC appeared similar for the classification tree and the multinomial model. The weighted kappa for the multinomial model was 0.36 (95%CI ) and the weighted kappa for the classification tree was 0.40 (95%CI ). The weighted kappa between the tree and multinomial models showed substantial agreement (κ 0.82 (95%CI )). The percentage of observations that were correctly predicted by the classification tree and multinomial model were 67.91% and 64.99% respectively. The methods also performed similarly in the proportion correctly predicted in each category (Multinomial model under = 0.78, none = 0.55, Over= 0.46; classification tree under=0.75, none=0.68, over=0.93). These results indicate that the classification tree has improved predictive ability when compared to the multinomial model. 115
134 116 Figure 6.4 ROC curves for final multinomial logistic and CART analyses
135 6.4 Discussion The study found that 44% of dog owners misperceived their dog s body shape. The degree of agreement between owners and interviewers was similar to other studies (riding horses in Scotland Kappa = Wyse et al. (2008), cats in France Kappa = Colliard et al. (2009)) despite variations in methodology and scales used. Dog body shape was present in both the final multinomial model and the classification tree, and the importance of dog body shape as a risk factor is reflected by the factor accounting for 74% of the total variation in the model. As expected, owners with dogs with non ideal body shapes appeared to normalise their perception of their dog s body shape e.g. 53% of owners of overweight dogs underestimated their dog s weight while 61% of owners of underweight dogs overestimated their dog s weight. However misperception was not confined to owners of dogs with non-ideal body shapes, with around 20% of owners of ideal dogs misperceiving their dog s body shape. As dog BCS increased, the odds of underestimation decreased significantly. This has also been found in human studies (Johnson-Taylor et al. 2008). From the final multinomial model and the classification tree, one owner factor, sex of owner, was significantly associated with underestimation. In human misperception studies, males have been found to be more likely to underestimate their own weight than females (Kuchler and Variyam 2003) and perceive themselves as too thin (Mikolajczyk et al. 2010). Males have been suggested to be less concerned by body shape or have a different perception of ideal body shapes than females (Madrigal et al. 2000). The classification tree suggested that only a subsection of dogs owned by male owners were at risk of misperception (overweight dogs aged 7 years or over). Owner gender has been reported to affect the types of relationships owners have with their dogs, with the six types of dog-companionship dimensions occurring in significantly different proportions between female and male owners (Dotson and Hyatt 2008). It would be interesting to explore whether these dimensions influence the likelihood of misperception or if this result is due to gender differences in ability to judge body shape. There was a significant interaction term between age of dog and body shape in the multinomial model. This showed that the probability of misperception changed for both overweight and underweight animals with age of the dog. Owners of underweight and overweight animals were more likely to estimate their dog s shape correctly in the oldest age category (9 to 18 years) and overweight and underweight adult dogs (4 to 9 years of age) were most at risk of body shape misperception. This may indicate that owner attitudes to acceptable body shape change over a dog s life span. These results point to the necessity for owner education on canine nutrition to be continued throughout a dog s life rather than confined to the puppy stage. The classification tree model revealed similar findings to the multinomial model but suggested two cut offs where the likelihood of owner misperception altered. This may be a more realistic interpretation than the multinomial model s assumption of misperception being related to 3 categories of age. An owner s categorisation of a dog into a particular life stage (e.g. middle age or elderly) may be more likely to affect an owner s perception of body shape than the dog s chronological age. Owner perceptions of these dog life stages and the impact this has on an owner s attitude to their animal would be an interesting area to investigate further. 117
136 Breed variables were not significant in the analyses. The analysis of owner body shape misperception in cats presented in Chapter 6 found that long hair was a risk factor. Therefore, there was the expectation that variables which described body conformation, size and coat such as breed would be associated with owner misperception in dogs. This lack of association may be, in part, due to data collection. There was a high percentage of cross breeds within the study. No data were collected on their size, coat or conformation due to time constraints and difficulty in standardising definitions for these characteristics. Also, the gold standard (body condition scoring) has been shown to be affected by breed (Jeusette et al. 2010) which may further disguise any relationship between misperception and breed related variables. One major difference to parent-child misperception studies was the absence of association between owner weight status and misperception. This study was based on self reported weight status which is recognized to be only moderately sensitive for identifying overweight individuals (Larsen et al. 2008). As the prevalence of overweight in the human study sample population differed markedly from the reported prevalence (26.8% based on clinical assessment of BMI) in Scotland (ScotPHO 2007), a substantial proportion of owners who self reported not being overweight are likely to have a body mass index (BMI) above 25, i.e are overweight, and already misperceiving their own body shape. This may have altered the results of the association between overweight owner status and misperception of their dog s body shape. A study based on objective clinical assessment of owner body shape via body mass index may overcome this limitation. Classification trees assume a hierarchical relationship between variables. This may not be entirely appropriate in this context but it allows some indication of the relative importance of the variables within the model. Dog body shape appears the most important determinant of misperception followed by dog age, with sex of owner being important only in a subset of owners. The assumption underlying the logistic model was violated, suggesting the logistic model may not be suitable for this analysis and provided unreliable coefficient estimates. But the finding of little practical difference between logistic models and classification trees is common (Marshall, 2001) and offers a degree of confidence due to the repeatability of the risk factors that emerged from the final analyses. Neither model was likely to capture fully the relationship between age of dog and misperception. This may be due to weaknesses in data collection and the likely complexity of factors involved in misperception. This relationship presents an area for further research. This chapter found that the likelihood of misperception is correlated to the body shape of the dog. Therefore, the prevalence of misperception is likely to be highly related to the prevalence of obesity in a population. This correlation suggests that, as the prevalence of obesity in a population increases over time, then the prevalence of misperception may also increase. This has already been found in human studies (Johnson et al. 2008). A follow up study on this population could confirm if this phenomenon also occurs in dog owners. These temporal trends are important due to the positive relationship between awareness of weight status and taking steps to manage weight (Johnson et al. 2008). In addition, this was a population of vet visiting animals, increasing the likelihood of having some knowledge of their dog s body condition compared to the general dog owner population. This may then decrease the likelihood of misperception relative to the wider population. 118
137 The study had a number of limitations in its design. No assessment of the repeatability or reproducibility of the BCS system used was carried out, although previous studies in which clear and standardised BCS guidelines have been used (similar to this study) have given repeatability estimates of around 0.5 (Burkholder & Toll 2000). German et al. (2006) found a high degree of agreement between rater scores of dogs using the Waltham SHAPE system. In addition, information was not gathered surrounding the reasons the owners were visiting the practice, so it was not possible to investigate how these reasons affected the likelihood of body shape misperception. As with any questionnaire study, there is likely to be reporting bias. Obesity is increasingly being portrayed in a negative light by the media and it has been thought this affects the willingness of parents to describe their children as obese (Gregory et al. 2008). Therefore, an owner s choice of descriptive term for their dog s body shape is likely to be an interaction between their actual perception and their willingness to use certain terms. 6.5 Conclusion This study confirmed that owner misperception of their dog s body shape is widespread. Correcting misperception is likely to be one part of canine obesity prevention and management and may result in greater success in subsequent information campaigns. Owner education on the risks posed by obesity is also vital, although it should be noted that Yaissle et al. (2004) previously found no added benefit from incorporating owner education on nutrition into obesity treatment protocols. In addition, Bland et al. (2009) found that awareness of the health risks of obesity was not associated with obesity. Human public health literature has also shown that the amount of nutritional knowledge an individual has is not associated with obesity but a negative perception of obesity is protective (Harris (1983) and Gordon- Larsen (2001)). Furthermore, human studies have found that obese humans tend to recognise the risks posed by increased BMI but underestimate the risks relative to non obese humans. Tackling both misperception of body shape and emphasising and personalising the impact of being overweight on the dog to owners may prove more successful than general education on canine nutrition and obesity. 119
138 Chapter 7 Prevalence and risk factors for feline overweight/obesity in a first opinion practice in Glasgow, Scotland Published in part in Journal of Feline Medicine and Surgery 12 (10) Introduction Chapter 4 concentrated on estimating the prevalence and describing the non modifiable risk factors (age, breed, neutered status and sex) for feline obesity from a national clinical database. No data were available on modifiable risk factors in this dataset. The objectives of this chapter were to describe the prevalence of overweight or obesity in cats, investigate modifiable risk factors and non modifiable risk factors, assess the ability of owners to rate their cat s body shape and to determine whether any risk factors were associated with owner misperception of their cat s body shape in a cat population from a first opinion practice in Glasgow. Prevalence estimates for overweight or obesity in cats vary between 18% and 52% (Russell et al. 2000). The most recent estimate for the UK found 48% of 168 cats were overweight and 4% were obese, based on a modified nine point BCS scale (Russell et al. 2000). Feline obesity is considered a multi-factorial condition, with risk factors identified by others including apartment dwelling, inactivity, middle age, being male, neutering age and being neutered, being of mixed breeding, feeding of treats and ad libitum feeding and being in multi-cat households (Russell et al. 2000; Scarlett et al. 1994; Sloth, 1992). Previous studies have shown associations between owner underestimation and cat obesity (Allan et al. 2000) and moderate agreement between owners and vets when rating cat body condition score (BCS) (Colliard et al. 2009). Increased owner awareness of normal feline body shape may be the first step in promoting weight management and may be key to the long-term success of weight loss programmes (Kan & Tsai 2004). 7.2 Materials and Methods Data collection The questionnaire survey took place in a first opinion charity practice in Glasgow during a 3 week period in July A convenience sample of owners of cats over 1 year old were 120
139 asked to complete a short questionnaire (see Appendix B) which included questions about signalment, feeding and lifestyle. One questionnaire was completed per household and only closed questions were included within the questionnaire. No owners refused to participate. A veterinary student, trained in the procedure, assessed the body condition score (BCS) of cats using a five point body condition scoring system based on visual assessment and by palpation over the ribs and abdomen as previously described by LaFlamme (1997). Animals with a BCS of 1 were classed as very underweight, 2 as underweight, 3 as ideal, 4 as overweight and those with a BCS of 5 as obese. The objectives and methods were explained to the participating practice and the study was approved by the University of Glasgow Ethics and Welfare Committee. Owners, without being given any guidance, were asked to assign their cat to one of the following word descriptions: far too thin, a bit thin, just right, a bit overweight or very overweight. No records were kept on the number of questionnaires collected at each visit at a practice Statistical analyses All statistical analyses were carried out in R version (R Foundation for Statistical Computing). Statistical significance was defined at p<0.05. Prevalence estimates were calculated with binomial exact 95% confidence intervals. One-way analysis of variance (one-way ANOVA) test was used to compare mean cat age between BCS categories. The assumption of homogeneity of variances was checked using Bartlett s test. Tukey s honest significant difference (HSD) test was used as the test of multiple comparisons following the one-way ANOVA. Fisher s exact test was used to investigate whether there was an association between frequency of feeding (a categorical variable) and whether cats were fed an exclusively dry diet. Possible risk factors for being overweight or obese (BCS 4 and 5) were evaluated using binary logistic regression. BCS was collapsed into two groups: BCS 2/3 not overweight and BCS 4/5 overweight. Cats with a BCS of 1 were excluded from this analysis as they may have had concomitant disease that would have unduly influenced the results, as carried out in similar studies e.g Allan et al. (2000); Colliard et al. (2009). Potential risk factors were selected on the basis that they had previously been identified as risk factors for feline obesity. Age was introduced into the model both as a continuous and a categorical variable based on the AAFP/AAHA: Feline Life Stage Guideline (Hoyumpa Vogt et al. 2010). All variables significant at p<0.25 were entered into multivariable analysis. Forward and backward selections were used to build the final multivariable model. First order interactions and confounding between variables were assessed. Residuals were plotted from each model to detect any outlying or influential observations. Hosmer Lemeshow goodness of fit test was used to assess how well the final model fitted the data. The final model was rerun excluding any outlying or influential observations and the coefficients were evaluated for any significant change. The explanatory ability of the model was determined by using a receiver operating curve (ROC). A model with an area under the ROC of greater than 0.7 was considered to have acceptable discriminatory power (Dohoo et al. 2003). The method above was repeated to investigate demographic risk factors connected with being underweight. BCS was collapsed into two groups; BCS 1 underweight and BCS 2, 3, 4 and 5 121
140 not underweight. This was carried out in order to assess the effect of excluding underweight animals from the previous analysis. Weighted and unweighted kappa statistics were calculated to assess the degree of agreement between interviewer and owner BCS rating. The kappa statistics were interpreted as: <0.2 slight agreement, 0.2 to 0.4 fair agreement, 0.4 to 0.6 moderate agreement, 0.6 to 0.8 substantial agreement, and >0.8 almost perfect agreement (Dohoo et al. 2003). The interviewer rating was taken as the gold standard for cat BCS. Misperception was categorised into three groups: correct estimation (no difference between interviewer and owner rating of BCS); underestimation (owner rated the cat as a lower BCS than the interviewer); and overestimation (owner rated the cat as a higher BCS than the interviewer). Possible risk factors for owner misperception of BCS were assessed using multinomial logistic regression analysis, with ideal acting as the reference category using nnet package (Ripley 2009) in R version Possible risk factors assessed were cat age, life stage of cat, neutered status, sex, whether the cat was a cross breed, and whether the cat was longhaired. Correct estimation was the reference category. BCS was forced into the model to account for variation due to BCS. Each variable was individually assessed in the model. Forward and backward stepwise logistic regression analysis was then used to build the multivariable model. All variables significant at p< 0.25 in the univariable analysis were included in the stepwise selection. Interactions between explanatory variables were not assessed in this model because of the complexity of interpreting the results. For the final model diagnostics, two binary logistic regression models were created from the final multivariable model (correct estimation/overestimation and correct estimation/underestimation). The residuals were plotted from these models to detect any outlying or influential observations. 7.3 Results A total of 118 questionnaires were available for analysis Prevalence of overweight or obese cats Figure 7.1 shows the assessment of cat BCS by the interviewer. In total, 28.8% (n= 34) of cats were rated as overweight (BCS 4) and 10. 2% (n= 12) of cats rated as obese (BCS 5). Twenty-eight percent (n= 33) of cats were rated as ideal (BCS 3). The overall prevalence for overweight or obese cats was 39% [95% confidence interval (CI) ]. The mean age of cats varied significantly across BCS categories (p < 0.001). Cats with a BCS of 1 were significantly older than cats with BCS 3, 4 and Prevalence of cat body shape misperception in cat owners Sixty-four cat owners (54.2%) were able to identify their cat s BCS correctly, 11.9% (n= 14) of owners overestimated their cat s BCS, while 33.9% of owners (n= 40) underestimated their 122

141 Figure 7.1 Interviewer assessment of cat body condition score on a five point scale where animals with a BCS of 1 were classed as underweight, 2 as slightly underweight, 3 as ideal, 4 as overweight and those with a BCS of 5 as obese. Bars are divided into owner misperception types (underestimation, overestimation and correct estimation) 123
142 cat s BCS. The agreement between owner and vet assessment of BCS showed moderate to high agreement [unweighted κ = (0.289 to 0.522), weighted κ = (0.584 to 0.973)]. Figure 7.1 shows the distribution of owner misperception of cats in each BCS category. Owners of cats with BCS 1 were 15.3 (95%CI 1.69 to ) times as likely to overestimate as correctly estimate their cat s BCS (Table 7.1). Conversely, owners of cats with BCS 4 were 2.7 (95%CI ) times more likely to underestimate their cat s BCS. The majority of owners (92.6% n= 50) who incorrectly identified their cat s BCS were incorrect by one BCS category. 124
143 Underestimation Correct estimation Overestimation Body condition score n RRR (95%CI) P value n n RRR (95%CI) P value 1 0 NA ( ) ( ) ( ) * * 21 1 * * (1-7.41) NA ( ) NA NA Table 7.1 Results of multinomial logistic regression investigating owner body shape and cat body shape 125
144 7.3.3 Population demographics The mean age of the population was 9.08 (±5.42) years. Using the AAFP/AAHA Feline Life Stage Guidelines (Hoyumpa Vogt et al. 2010), 21 cats (17.8%) were classed as being in the junior life stage (1 to 2 years), 20 cats (16.9%) were in the prime life stage (3 to 6 years), 30 cats (25.4%) were in the mature life stage (7 to 10 years), 25 cats (21.2%) were in the senior life stage (11 to 14 years) and 22 cats (18.6%) were in the geriatric life stage (15 years plus). The relationship between age and body condition score is shown in Figure 7.2. Figure 7.2 Boxplot of age with body condition score in cats (dots correspond to individual observations) Of the cats included, 46.6% (n= 55) were male neutered, 44.1%, (n= 52) were female neutered, 5.9% (n= 7) were female entire and 3.4% (n= 4) were male entire. The majority of cats were reported as cross breeds (91.5%, n=108). The remaining 10 cats comprised seven different breeds: Devon Rex (n= 2), Persian (n= 2), British Shorthair (n= 1), Burmese (n= 1), Havana (n= 1), Maine Coon (n= 1), Manx (n= 1) and Ragdoll (n= 1). Of all cats taking part, 90.7% (n= 107) were classed as shorthaired and 9.3% (n= 11) were longhaired. Fifty-five cats (46.6%) had access outdoors while 53.4% of cats (n= 63) were kept indoors Diet A majority of cats were fed some amount of wet food (91.5%, n= 108). Over half of the cats were fed ad libitum (53.4%, n= 63), whereas 18.6% (n= 22) of cats were fed three times a day, 27.1% (n= 32) were fed twice a day and one cat was fed once a day. There was no difference in the frequency of feeding between cats who were fed on an exclusively dry diet and those fed on wet food (Fisher s exact test p=0.49). In total, 44.9% of owners never gave snacks or treats to their cats (n= 53), 12.7 % (n= 15) of owners gave snacks/treats a few times a month, 23.7% (n= 28) gave snacks and treats a few times a week and 18.6% (n= 126
145 22) gave snacks/treats daily; 24.6% (n= 29) of owners never gave table scraps to their cats, 16.1% (n= 19) of owners gave scraps a few times a month, 41.5% (n= 49) gave scraps a few times a week and 17.8% (n= 21) gave scraps daily Owner feeding habits and knowledge about obesity Owners were asked how they decided how much to feed their cat. The majority (69.5%, n= 82) fed until their cat stopped eating, 16.1% (n= 19) used the instructions on the pet food, 7.6% (n= 9) said it was the amount they always fed their cat, 4.2% (n=5) asked their vet, one owner assessed their cat s body shape and adjusted the amount accordingly and 1.7% (n=2) said they didn t know. Fifty-three (44.9%) owners were aware of the health risks of obesity Overweight/obesity risk factor analysis After excluding 19 cats with a BCS of 1, 99 cats were entered into this analysis. A BCS of 2 or 3 was obtained for 53.5% of cats (n= 53) while 46.5% (n= 46) were BCS 4 or 5. Table 7.2 shows the results of the univariable analysis. One risk factor was significantly associated with being overweight or obese: cats that were fed twice a day were four times more likely to be overweight or obese than cats fed ad libitum (p= 0.006). Neutered status was also strongly associated with being overweight or obese (p= 0.063). Five variables significant at p< 0.25 in the univariable analysis were entered into the multivariable logistic regression analysis. The final model contained two variables (Table 7.3). Neutered status was strongly associated with obesity. Also owners who reported feeding their cats twice or three times a day were more likely to have overweight or obese cats than those owners who fed ad libitum. The AUC (0.686) indicated the multivariable model approached acceptable accuracy when explaining whether cats were either overweight or not overweight (Dohoo et al. 2003). 127
146 Variable BCS 2/3 BCS 4/5 Odds ratio Sex Male (95%CI) Female ( ) Age Years 8.792(4.40) 7.261(5.41) 0.94( ) 0.13 Life stage Junior 9 11 Prime ( ) Mature ( ) Senior ( ) Geriatric ( ) Neutered status Entire Neutered ( ) Indoor/outdoor Indoor only How do you decide how much to feed? Dry diet Frequency of feeding Awareness of health risk of obesity in cats Frequency of feeding snacks/treats Frequency of feeding table scraps Has outdoor access ( ) Instructions on the can or packet Advice from the vet Feed until cat stops eating Assess body condition and adjust Always fed my cat this way NA ( ) NA ( ) I don t know 1 0 NA Exclusively dry diet 4 6 Some wet food ( ) Once a day 0 1 NA Twice a day ( ) Three times a day ( ) Ad libitum Yes No ( ) Every day Twice a day ( ) Three times a day ( ) Ad libitum ( ) Every day ( ) Few times a week ( ) Few times a month ( ) Never 9 17 Cross breed Cross Pure ( ) Long haired Long haired 5 4 Short haired ( ) Table 7.2 Feline overweight/obesity univariable results P
147 Variable Level Coefficient/SE Odds ratio (95% CI) P value Neutered Entire * * Neutered -2.23/ ( ) Frequency of feeding Ad libitum * * Once a day / NA Twice a day 1.420/ ( ) Three times a day 1.131/ ( ) Table 7.3 Feline overweight/obesity multivariable model 129
148 7.3.7 Underweight risk factor analysis Only one risk factor was significant in the univariable analysis lifestage (Table 7.4). Compared to cats in the junior lifestage, geriatric cats were 15 times more likely to be underweight (OR =15.66 (95% )). The AUC for the model was 0.82 showing good explanatory ability (Dohoo et al. 2003). Variable Level Underweight Not underweight Odds ratio Neutered Entire 0 11 Neutered NA Sex Female 9 50 Male ( ) Age Junior 1 20 Prime 0 20 NA Senior ( ) Geriatric ( ) Table 7.4 Risk factors for being underweight in cats (BCS=1) Owner misperception risk factor analysis All 118 cats were entered into the analysis. The results of the analysis are shown in Table 7.5. Owners with longhaired cats were 11.5 times more likely to underestimate their cat s BCS than owners of shorthaired cats (p= 0.04). No multivariable model was built as only one variable was significant at p<
149 Underestimation Correct estimation Overestimation Variable n Coeff/SE RRR(95%CI) P value n n Coeff/SE RRR (95%CI) P value Age -0.05/ ( ) / ( ) Life stage Junior Prime / ( ) / NA Mature / ( ) / ( ) Senior / ( ) / ( ) Geriatric / ( ) / ( ) Sex Male Female / ( ) / ( ) Neutered Entire Neutered / ( ) / ( ) Breed Cross breed Pure / ( ) / NA breed Coat Long haired Short / ( ) / ( ) haired Indoor/outdoor Indoor only Has / ( ) / ( ) access to outdoors Table 7.5 Owner misperception of feline overweight/obesity univariable results 131
150 7.4 Discussion Over a third (39%) of cats in this study were overweight or obese on a five point scale. Over half (54.2%) of the cat owners surveyed were able to describe their cat s body shape accurately. There was moderate to high agreement between owner and vet assessment of BCS and this is similar to another study that also found moderate agreement (kappa=0.46) (Colliard et al. 2009). Owner underestimation of feline body shape was most common in overweight cats. This has also been found in a previous study (Allan et al. 2000). The high prevalence of feline obesity is likely to be multi-factorial. This study found that neutered status and feeding frequency were risk factors. Risk factors identified by others have included neutered status, age, feeding of treats and ad libitum feeding and multi-cat households (Russell et al. 2000). The results of both the prevalence and risk factor analyses need to be interpreted with caution as the study population may not necessarily be representative of the general population throughout the UK. Interpretation of overweight/obesity risk factor analysis and the misperception risk factor analysis also needs to take into account that this study was under-powered and the moderate fit of the final model to the data. As with any questionnaire survey, there was also likely to be reporting bias (Dohoo et al. 2003). This prevalence estimate is smaller than the most recent published study in the UK which estimated the overweight or obese prevalence to be 48% (Russell et al. 2000). This is surprising given that this owner population was likely to have lower incomes than average due to the practice type and this has been linked to higher rates of canine obesity (Kienzle et al. 1998). Possible associations between owner income and feline obesity warrant further investigation. The previous study in the UK (Russell et al. 2000) was based on a cat population recruited via house-to-house interviews while our study population consisted of vet-visiting cats. Therefore, our study was more likely to include cats with concurrent disease that may be more likely to have lower BCS. Data surrounding the reasons for the individual cat s presentations at the veterinary practice were not gathered so we were unable to verify these and this presents a limitation to our study. Other limitations in the study design include the short data collection period and lack of data on the repeatability of the BCS scoring. The effect of the short data collection period is difficult to evaluate. Although no studies have been published to show seasonal variations in feline BCS, this cannot be discounted as a potential bias. An assessment of the repeatability of the BCS scoring was also not carried out. Previous studies where clear and standardised BCS guidelines have been used (similar to this study) have given repeatability estimates of around 0.5 (Donoghue & Scarlett 1998). Several other studies have found that neutered cats were at increased risk of being overweight or obese (Colliard et al. 2009; Robertson 1999). Neutering has been proposed to lead to increased food intake and lowering of resting metabolic rate in neutered animals (Fettman et al. 1997), while it has also been suggested neutering may lead to decreased physical activity (Sloth 1992). These results emphasise again the importance of communicating the risks of neutering and its association with obesity to owners. The frequency of feeding emerged as a risk factor in the final multivariable model. Owners who reported feeding twice or three times a day were more likely to have overweight or obese 132
151 cats than owners who fed ad libitum. Other studies have found no difference in the risk of overweight and obesity between feeding frequencies (Scarlett et al. 1994; Allan et al. 2000; Butterwick 2000), while Russell et al. (2000) found that cats fed ad libitum were more at risk of obesity. Clearly, there is a lack of consensus on the effect of feeding in feline obesity. The differences in findings between studies could be attributed in part to questionnaire wording. Owner education on suitable methods of determining the right quantity to feed their cat and clearer instructions on pet food labels have been recommended as potential obesity preventative measures (Butterwick 2000; Gregory et al. 2008). Our findings reinforce the importance of owner awareness and use of feeding guidelines as preventative measures for obesity. These findings and inconsistencies between previous study findings in this area demonstrate the need for further investigation into optimum feeding strategies for cats. Several studies have identified activity level as a predictor of obesity (Sloth 1992; Scarlett et al. 1994). Access to outdoors can be used as a proxy for activity levels (Russell et al. 2000). This study found no difference in the risk of obesity between cats that had outdoor access and those that did not. In addition, age or life stage were not found to be risk factors for overweight or obesity in contrast to others (Russell et al. 2000). The inconsistencies found between this study and others may be explained by insufficient statistical power in this analysis or unseen differences in the underlying population characteristics. Cats that were geriatric were 15 times more likely to be underweight than cats that were in the junior lifestages. The high AUC showed the importance of age in determining whether cats were underweight whereas husbandry factors appeared unassociated with this body condition. These animals are likely to have concomitant disease more common in old age and therefore including these cats in the overweight/obese risk analysis may have obscured the relationship between risk factors and overweight. Owners appeared to normalise their perception of their cat s BCS. Owners of cats of BCS 1 overestimate their cats BCS and owners of cats with BCS 4 underestimate their cats BCS. No significant increase in the likelihood of underestimation was detected in cats with BCS 5. This may be due to insufficient power to detect an effect due to the relatively small number of cats with BCS 5. Underestimation of cat body condition scoring has been previously been found by Allan et al. (2000), Colliard et al. (2009) and Kikuchi et al. (2010). Only one factor emerged in the risk factor analysis for owner misperception of BCS. Owners of longhaired cats were more likely to underestimate their cat s body shape than owners of shorthaired cats. Long hair is likely to disguise adipose deposits to a greater degree than short hair. Owner body condition scoring systems as part of owner education packages based both on visual cues and palpation may therefore be more effective than visual assessment alone. The lack of other identified risk factors for misperception may reflect that the problem may be more a product of unmeasured owner factors such as demographic factors and socioeconomic status as seen in studies of human body shape misperception (Johnson et al. 2008). Also current negative attitudes to obesity in humans and animals may lead to reluctance in owners to use certain descriptive terms for their cat s body shape, such as very overweight as discussed in Chapter 6. Therefore, an owner s choice of descriptive term may be an interaction between their true perception and their willingness to use certain descriptive terms (Johnson 133
152 et al. 2008). Human studies have shown that misperception prevalence is dynamic and affected by the social environment, e.g. media reports, public health campaigns and the overall prevalence of obesity (Johnson et al. 2008). It would be interesting to investigate temporal changes in owner s ability to assess whether their pet is overweight. This would be especially helpful when evaluating the impact of owner educational campaigns to reduce companion animal obesity. A decline in sensitivity or recognition of overweight has important implications for health messages as those owners of animals marginally overweight are unlikely to see messages as being personally relevant (Johnson et al. 2008). 7.5 Conclusion The findings demonstrate that the prevalence of obesity in cats was high within a population of cats visiting a veterinary practice in Glasgow, Scotland. The risk factors identified were broadly in agreement with others including studies in Australia (Robertson 1999), France (Colliard et al. 2009) and United States (Lund et al. 2005) possibly indicating that the factors influencing the development of feline obesity may be similar throughout these countries. Further research needs to be undertaken to establish optimum feeding frequency in cats. Given the high rate of owner misperception of feline body shape, veterinarians should develop strategies to help these owners correct their assessment of their cat s BCS particularly in longhaired cats using visual cues and palpation. Although the causes of feline obesity are likely to be multi-factorial, the study highlighted the continuing need for owner education in feline nutrition, especially at neutering. 134
153 Chapter 8 General discussion and conclusions Overweight/obesity has been identified as a major welfare issue for companion animals by veterinary surgeons (Yeates and Main 2011) and understanding the causal web of overweight/obesity is imperative to successfully preventing and treating the condition. Previous published work has been confined to a description of prevalence and the risk factors associated with canine and feline overweight/obesity in small, spatially localised populations (with the exception of the studies by Lund et al and 2006). This thesis represents the first attempt to describe the prevalence of overweight/obesity in a nationally distributed population of cats, dogs and rabbits, to explore spatial differences in prevalence and to quantify the association of non-modifiable risk factors such as sex, age and neutered status on the prevalence of overweight/obesity. In addition, no published studies had formally assessed potential owner risk factors, such as owner income and age within Great Britain, and this thesis aimed to investigate these factors more fully. Misperception of body shape has been recognised to play an important role in human obesity management. Previous studies have only described owner misperception of pet body shape as an adjunct to risk factor identification for canine and feline overweight/obesity (Allan et al. 2000; Bland et al. 2010; Colliard et al. 2009; Holmes et al. 2007; Singh et al. 2002). This thesis investigated this phenomenon in more depth and identified several risk factors associated with misperception. The thesis used three separate sources of data for the cross-sectional studies. The first were clinical records of body condition scores, sex, neutered status, and breed from cats, dogs and rabbits from 47 practices. The data were derived from 47 charity companion animal practices distributed throughout United Kingdom. The body condition scores were collected from 11 equally spaced time points from 2008 to Records were available for 7847 dogs and 3277 cats. The second was data derived from a questionnaire study of dog owners from five practices (a mixture of private and charity practices) in the Glasgow area while the third source was a questionnaire study of cat owners from one charity practice in Glasgow. 829 questionnaires were gathered from dog owners in July 2007 while 118 questionnaires were collected from cat owners in July The data from all studies were analysed using a variety of statistical methods including generalised linear models, generalised linear mixed models, multinomial regression, classification and regression trees and correspondence analysis. 8.1 Prevalence of overweight/obesity in cats, dogs and rabbits Six out of ten dogs were classed as overweight or obese from the canine questionnaire study whereas one in four dogs were found to be overweight/obese from the database of 47 practices. 135
154 One in ten cats were overweight/obese from this practice database. In constrast, four in ten cats were overweight/obese from the feline questionnaire study. The practice database also described that around 7% of rabbits were overweight in Great Britain. All the estimates demonstrated that overweight/obesity is common in the companion animal population. The extent of the overweight/obesity burden seemed to be dependent on species with increased prevalence in dogs compared to cats. Rabbits appear to have the lowest burden for these three species but, given the limitations of this source of data, further investigations are needed to verify this. The implication of the higher prevalence of canine compared to feline overweight/obesity is difficult to gauge as the definition and clinical significance of feline overweight/obesity may not be comparable to the definition and clinical significance of canine overweight/obesity. The reasons for the discrepancies in the canine and feline prevalence estimates were likely to be related to the data type (secondary data compared to primary data), differences in the characteristics of the underlying populations, and differences in types of body condition scoring systems used and ways in which the body condition scoring was carried out. In particular, the body condition scoring used for the questionnaire studies were carried out using a standardised method by one scorer while the body condition scoring from the practice database were carried out by a number of different scores with no standarised methodology. The spatial variation in the prevalence of feline and canine overweight/obesity in Great Britain was explored using the practice database. There were spatial differences in prevalence of canine overweight/obesity but no spatial differences apparent in the feline prevalence. This is similar to the findings of Lund et al and 2006 in the spatial distribution of canine and feline overweight/obesity in the United States. No correlation between canine and feline overweight/obesity prevalence for each location was found. The thesis discusses the risk factors associated with canine and feline overweight/obesity but it is clear that the probability of a dog being overweight/obese was influenced to a greater degree by owner related factors than a cat s probability. It could be hypothesised that there are substantial differences between the causal webs for canine and feline overweight/obesity with cat body condition being less influenced directly or indirectly by their environment than dog body condition or, as suggested by Lund et al. 2005, the husbandry of cats is more homogenous than for dogs. Further studies are needed to investigate these hypotheses and their potential impact on spatial variation of canine and feline overweight/obesity prevalence. 8.2 Risk factors associated with overweight/obesity in cats, dogs and rabbits For these studies, potential risk factors were split into modifiable and non modifiable risk factors. Non modifiable risk factors for feline overweight/obesity identified were middle age (around 7 years), being male and being neutered from the database of 47 practices. contrast, the feline questionnaire study found neutered status as the only non modifiable risk factor for feline overweight/obesity. Given the relatively small size of the feline questionnaire study, the absence of age and sex as significant risk factors is probably a reflection of the low power of the study. However, finding neutered status as a risk factor despite the low power of this study reinforces the importance of this risk factor. It also confirms the likely large 136 In
155 impact of neutered status on the prevalence of overweight/obesity suggested by the partial attributable risk analysis based on the database from the 47 practices. As expected, non modifiable risk factors found for canine overweight/obesity from the analysis of the database from the 47 practices were similar to those found for cats (gender, neutered status and middle age). The canine questionnaire study followed on from this and split the risk factor analysis to look at associations with overweight/obesity and associations with obesity. Sex and neutered status were the only non modifiable risk factors to remain in the multivariable model for overweight/obesity. None were present in the obesity model which consisted of four owner associated risk factors (age of owner, income of owner, hours of exercise per week and an interaction between exercise and age of owner). This could suggest that non modifiable risk factors may predispose to overweight/obesity but owner factors push the animal towards obesity rather than overweight. The population attributable risks calculated from the database of clinical records from the 47 practices showed possible differences in the importance of the non modifiable risk factor to overweight/obesity between cats and dogs. For cats, neutered status appeared to be the most important risk factor followed by age (prime/mature life stages) whereas in dogs neutered status and age were equally important risk factors. The possible explanations for this are diverse. One hypothesis is that this finding reflects age related decline in metabolic rate experienced by dogs but not cats (Harper 1998) leading to dogs becoming more susceptible to overweight/obesity in middle age. It is not possible to exclude the fact that this result could be due to the definitions of middle age in cats and dogs used in these chapters. Therefore, this finding requires verification with additional studies. Although no estimates of partial attributable risks were produced for different breeds, breed was also a more important factor in dogs than in cats. This may be due to greater between breed variation in dogs compared to cats (Menotti-Raymond et al. 2008) but it cannot be discounted that this finding might also have arisen because of lack of statistical power in the cat study. The questionnaire studies expanded on the analysis of clinical records from 47 practices to explore possible associations with modifiable risk factors. The feline modifiable risk factors evaluated by the questionnaire were related to the diet (whether the cat was fed a dry diet, the frequency of feeding, frequency of treats and snacks), environment (whether the cat had outdoor access), or the owner s attitude (how the owner decides what to feed and owner awareness of the health risks of obesity). The analysis found that only frequency of feeding was significant in the multivariable analysis, namely cats fed twice or three times a day were at greater risk of overweight/obesity than cats fed once a day or ad libitum. Other studies have not found this association e.g Colliard et al. (2009). It cannot be excluded that this results from questionnaire wording rather than a true association. In contrast to the feline questionnaire study, several modifiable risk factors were found to be associated with overweight/obesity and obesity by the canine questionnaire study. Three separate multivariable models were created each with a separate outcome variable. Both the binomial obesity model and the obesity section of the multinomial model identified age of owner, income of owner and hours of weekly exercise as risk factors significantly associated with obesity. The binomial obesity model also found the frequency of snacks and treats as 137
156 a risk factor as well as an interaction between hours of exercise and owner age. The results of the overweight section of the multinomial model and the binomial overweight/obesity model showed that age of owner, income and frequency of feeding of snacks and treats were significant risk factors. These models reinforced previous findings that modifiable risk factors are important contributors to canine overweight/obesity (Bland et al. 2010). Owner socioeconomic status seemed to be an important factor in the development of canine obesity from the canine questionnaire study. The risk of obesity was significantly associated with owner income; those in the highest income bracket being much less likely to have obese dogs although the possibility of recall bias cannot be discounted. Differences in demography of the pet owning public have previously been investigated in Germany where people on lower incomes were over-represented among the owners of obese dogs (Kienzle et al. 1998) and was suggested by Mason (1970). However, this was the first study to formally assess this risk factor in conjunction with others and in a epidemiological study. Although owner income is likely to be a proxy for unmeasured factors, this has implications for intervention strategies. It implies that universal treatment plans may not be as successful as those tailored to individual owner groups which take into account the constraints and characteristics of these groups. The risk factors suggested by the correspondence analysis for rabbits need to be judged as only preliminary. But it is interesting that sex and neutered status were associated with overweight/obesity in rabbits, similar as for other species. This suggests elements of a common aetiology with cats and dogs. Some of the findings of the questionnaire studies did not agree with previous findings. Replication of results between studies can be difficult to achieve, but it is important for inferring causation. Lack of replication can be due to differences in the study populations altering the associations between risk factors and overweight/obesity (i.e. through effect modification or confounding) despite the underlying biological mechanisms being similar. It can also be due to the lack of a consistent and standardised useable definition of overweight/obesity between studies. An example of a result inconsistent with previous studies is the finding that cats fed two or three times a day were more likely to be overweight/obese than those fed ad libitum or once a day. Given that this finding was based on data derived from owners attending one veterinary practice, the potential for extraneous factors to result in effect modification or confounding is large. These studies used several techniques novel to companion animal overweight/obesity epidemiology for risk factor identification such as correspondence analysis and classification and regression trees. Correspondence analysis proved useful with data sparsity in the rabbit risk factor identification while the classification tree was beneficial in validating the results of the logistic regression models and allowing for higher order interactions to be modelled. There is scope for wider use of these techniques. 138
157 8.3 Prevalence of canine and feline body shape misperception and associated risk factors The questionnaire studies investigated whether owners were able to assess their animal s body shape correctly. No previous studies have attempted to identify risk factors for this. The prevalence of owner incorrect assessment (misperception) of their cat or dog s body shape was 45.6% and 44.1% respectively. In both cats and dogs, owners with underweight animals were likely to overestimate their animal s body condition, whereas owners with overweight animals were likely to underestimate their animal s body condition. Only one risk factor, besides body shape, was identified as a risk factor for owner misperception of cat body shape. This was whether the cat was longhaired or shorthaired. The dog risk factor analysis found several associated with body shape misperception; gender of owner, age of the dog and dog body shape. Previous studies have suggested that owner misperception may result in overweight/obesity rather than be a result of overweight/obesity (Allan et al. 2000; Colliard et al. 2009). These studies chose to investigate misperception as the result of body shape. These studies hypothesised that misperception happens due to normalisation of non ideal body shapes in the immediate environment. This then affects the owner s judgement of their own animal s body shape. In turn, the owner is therefore unlikely to take measures to counteract weight gain. Since the publication of the findings in the last paragraphs, a peer viewed study (White et al. 2011) has confirmed that owner misperception of canine overweight/obesity is an important issue in dogs. Cave et al. (2012) also identified owner misperception of cat body shape as an important risk factor for feline overweight/obesity. The results of the misperception study could be used to design owner education materials on what constitutes a normal body shape. One interesting finding was that canine body shape misperception is affected by the age of the dog. It would be useful to explore this finding further as it implies that owner attitudes to acceptable body shape change over a dog s life span. These results point to the necessity for owner education on canine nutrition to be continued throughout a dog s life rather than confined to the puppy stage. 8.4 Application of results These results can be used in two ways. The findings have immediate applicability to companion animal practice. They emphasise the importance of owners in animal health and welfare. The results also expand the knowledge of the potential causality of overweight/obesity in cats, dogs and rabbits and suggest future avenues for research. The results reiterate the importance of nutritional advice at neutering and during middle age for all species studied. Owner misperception of pet body shape is also a common phenomenon and owners require guidance on what constitutes a normal body shape for their animal. Further studies are needed to investigate the best ways to communicate this information and 139
158 what barriers prevent owners from adhering to the advice given. These findings reinforce the fact that preventive health care is vitally important to protect an animal s health and welfare. Relating the findings back to the ecological triad described in Figure 1.1, the risk factors identified in the chapters appear to be distributed throughout the three factor groups: host (sex,neutered status and age), vector (wet/dry food and snacks and treats) and environment (owner age, income, location). This could be interpreted that the development of successful intervention strategies needs to be aimed at both an individual owner and at a population level. Overweight/obesity appears to be widespread in cats, dogs and rabbits throughout Great Britain. The prevalence estimates provided will help guide subsequent study design especially sample size calculations. The results of owner misperception of pet body shape suggest that studies based on owner assessment of overweight status need to be interpreted with caution given the high likelihood of differential misclassification. The prevalence of canine overweight/obesity was not uniform across the country. Although more research is needed to verify this finding, it does suggest that resources aimed at treatment and prevention may be better directed at specific areas to achieve a greater reduction in the national prevalence. Understanding why these spatial disparities occur may help identify potential risk factors. Ultimately, the aim of clinical epidemiology is to understand the causation of a condition in order to formulate successful intervention strategies to treat and prevent cases. The results presented here are not by themselves of sufficient quality needed to prove causality but they help expand the understanding of companion animal overweight/obesity. The importance of owner factors, especially for dogs, reinforces the need to understand the wider context in which these animals live and helps explain the difficulty in achieving and maintaining successful weight loss. 8.5 Limitations of the thesis and ideas for future work There are a number of general limitations to the findings reported. These are likely to have affected the validity and generalisability of the results. The main limitation to the findings is the study populations used. Data for all the studies were sourced from vet-visiting animals. This limits the generalisability of the results to the wider cat and dog population. The data derived from the clinical database orginated from a veterinary practice group for which owners had to prove low incomes to attend. This may affect how well the results can be extrapolated to the wider dog population as the owners of these animals were likely to live in socio-economically deprived areas and have low incomes. It would have been useful to explore the differences using data from dogs not attending the charity clinics and to gather data from these owners simultaneously with the current studies. Within these owners, a subgroup could be chosen, from which the responses to various questions would be validated. The questionnaire studies were carried out at a convenience sample of practices. This non random sample is unlikely to be representative of 140
159 the wider veterinary practice population of the country. All the studies would have benefited from extending the number and type of veterinary practices used to gather data from. The design of the questionnaires used could have been improved. Questions could be included that enable internal consistency of the questionnaire to be assessed. The questionnaires used were trialled on individuals within the university. Additional benefits would have been gained through piloting it on non veterinary trained owners from the study population. Ideally the questionnaire would have been administered to a random sample of owners attending the practices and the number of owners refusing from participating would be recorded. Including a question on the interviewee s role in the care of the presenting animal may help in the interpretation of the results. In addition, the consulting vet could be asked to record the signalment of the animal and reasons for the animal presenting at the practices. these data could be used to validate the owner responses within the questionnaire. Part of Bias can be separated into three types : selection bias (which subjects are included in the studies), information bias (factors connected to the collection of accurate data) and confounding bias (whether other factors affect the relationship between an exposure and outcome without being on the causal pathway) (Dohoo et al. 2003). Biases are important to understand as they affect the ability of the results of the study to be applied to the target population. The studies within this thesis were affected by these biases. Selection bias cannot be excluded from the data gathered from the 47 practices. No data was available on why certain animals had no body condition score or on the actual number of consultations that took place on the days the data was gathered. The questionnaire studies also are affected as the selection of owners to participate was based on convenience rather than a random sampling approach. In addition, the practices visited were again chosen through convenience sampling rather than random sampling. Information bias affected the collection of data on both the outcome and the exposures. As discussed in Chapter 1, there are a number of definitions for overweight/obesity in companion animals and multiple body condition scoring systems. Within this thesis, multiple body condition scoring systems were used to assess canine body shape. No attempt was made to assess the intra or inter observer reliability of the body condition scoring in any of the thesis. The collection of data on exercise and feeding was gathered via questionnaire and was not validated. Recall bias was likely to affect the response of owners. Overweight/obesity is a multifactorial condition that develops as the result of a complex web of interaction factors. Many of the risk factors investigated in this thesis may be proxies for more proximal risk factors in the causal pathway or may be confounders. The decision to classify an animal as overweight or not was based on body condition scoring. The use of body condition scoring has been discussed in detail in the literature review. There is no standard body condition scoring system for dogs and cats and, even within the studies presented here, multiple systems were used. This leads to issues surrounding the comparability of results. Also it is likely that there was some misclassification of animals. Studies evaluating intra and inter observer reliability would have provided valuable information about the level of misclassification but were impractical given the distributed locations at which observations were made and recorded. For the clinical database, it would have been 141
160 useful to know how many animals that presented in the observation days were not present in the data and the reasons behind the absence of body condition scoring for these animals. In addition, data on the reasons for all animals presenting on the days would have provided valuable information. One important aspect this thesis fails to explore is the concept of the human-animal bond. Understanding how this influences the behaviours and opinions of owners is likely to be important for successful obesity management and prevention. We identified several owner factors associated with canine obesity and owner body shape misperception. These factors may be proxies for describing the different relationships between animals and owners which are more proximally associated with obesity. This view is supported by previous studies which found owner characteristics affected the owner animal relationship. Exploring how owner perceptions of an animal s body shape and nutritional needs are altered by the animal s lifestage, sex and disease status would provide information relevant to obesity prevention and management. A standardised case definition needs to be formulated to enable comparisons between studies and the generalisation of the results. This may entail the use of an agreed body condition score validated for use between and within breeds. This is apparent within the thesis where two different body condition scoring systems for dogs were used (5 point and 7 point). A wider issue is whether the dichotomous outcome overweight/obesity or not overweight is the correct outcome to measure. Continuous outcome variables such as energy balance, body condition score or adiposity/body composition may provide more useful information as they don t impose artificial cut offs. Recent evidence in humans has proposed that inactivity has a greater impact on health and well being than overweight/obesity. This further raises the issue to whether overweight/obesity is the most appropriate outcome at which to target research. A number of methods have been suggested to validate questionnaires. For example, Schlesselman (1982) proposed distributing questions randomly throughout the questionnaire along with alternatively phrased questions about the same topic to help prevent bias. Data can also be gathered using other methods alone or in conjunction with questionnaires. Human nutritional research relies on pre trialled standardised questionnaires to collect data on physical activity and diet. The development of standardised questionnaires to collect data in these areas, similar to those developed to assess canine quality of life would provide a step forward. This work has been started by Cutt et al. (2008). Accelerometers can be used to gather data on the amount of physical exercise and have been validated for use in dogs (Yam et al. 2011) and cats (Lascelles et al. 2008). It would also be useful to validate the accuracy of information given by owners about breed, neutered status and age of their dog. As previously described, the accuracy and precision of owner related data is also likely to be poor especially in relation to socio economic variables. Postcodes have been used in human obesity research as proxies for socio-economic status (e.g Evans et al. (2000)) and their suitability for veterinary research into obesity should be explored. In addition, understanding the psycho-social (i.e. aspects of social and psychological behavior) background connected to overweight/obesity research in humans has proved useful. This has been used to a limited extent by White et al. (2011) to investigate body shape misperception and may provide a better 142
161 understanding of owner behaviour than more distal risk factors such as owner socio-economic status (Kienzle et al. 1998). Inaccurate and incomplete assessment of energy balance is a well known limitation in human obesity epidemiology (Canoy and Buchan 2007) and it is likely to be a major limitation for the questionnaire studies. In addition to clarifying owner risk factors, it would also be beneficial to gather data on a number of dog related variables. Longevity differs between dog breeds and this may, in turn, affect what chronological ages correspond with each life stage. Without this information, it is difficult to explore age and breed effects on the probability of being overweight. Neutered status emerged as an important risk factor for both cats and dogs. As discussed in the literature review, there is some conflicting evidence on whether the age of neutering affects the risk of overweight/obesity later in life (Howe et al. 2000; Salmeri et al. 1991; Spain et al. 2004). We had no data for any studies on the date of neutering. Having these data (if reliable) may allow some investigation of whether age at neutering was significant. As neutering is a widely accepted procedure for cats and dogs (Murray et al. 2009; Trevejo et al. 2011). As most animals are fed a commercial diet, current feeding guidelines accompanying commercial foods may need to be modified with separate recommended feeding amounts for neutered and entire animals. The appropriateness of current energy requirement guidelines for cats and dogs may need to be reviewed in order for this to be successful. Current studies have concentrated on identifying risk factors for the presence of overweight/obesity at one time point. Given the issues with reverse causation, biases and case definition, this approach may not be suitable to full understanding of the pathogenesis of overweight/obesity. Partitioning studies into understanding why and how juvenile animals become overweight/obese adults, why and how these adults remain overweight/obese and then finally why and how previously normal weight adults become overweight/obese may allow a clearer picture to emerge. Also, descriptive studies investigating the normal variations in body condition scores over the lifespan of dogs and cats have not been carried out. These studies would help to examine the temporal and cumulative relationships between obesity development and risk factors. The temporal relationship between the conditions described in Subsection and overweight/obesity is difficult to unravel. Prospective cohort studies would provide the best evidence on whether overweight/obesity or the condition came first in time. Overweight/obesity is seen as a major welfare issue (Subsection 1.1.1). Understanding this temporal relationship may help to evaluate the actual impact of overweight/obesity on companion animal welfare and, in turn, the effort that should be afforded to combating overweight/obesity in the population. 8.6 Conclusions The main findings of this thesis are: The national prevalence of overweight/obesity in cats, dogs and rabbits was estimated to be 11.5%, 25% and 7.6% respectively. There was a significantly higher prevalence of canine overweight/obesity in Scotland compared to England and Wales. However, there 143
162 were no apparent spatial variations in the prevalence of feline overweight/obesity within Great Britain. The questionnaire studies also found that feline overweight/obesity was lower than canine overweight/ obesity (39% compared to 59%). Whether this is a real effect or a spurious finding is difficult to assess given that the comparability of the feline and canine definitions of overweight/obesity is unknown. Non modifiable risk factors identified for dogs included being female, neutered status, and age with peak of risk at 5 to 8 years of age. These effects were independent of location. Feline non modifiable risk factors identified neutered status, being male and middle age (around 7 years). Neutered status was the only significant risk factor found for rabbit overweight. The questionnaire studies expanded on the canine and feline overweight/obesity risk factor analyses to include modifiable risk factors. Risk factors for canine overweight/obesity identified were owner income, owner age, frequency of snacks and treats and hours of exercise the dog received each week. For cats, the significant risk factors were frequency of feeding and neutered status. The calculated population attributable risks showed that neutered status was the most important factor whereas in dogs age and neutered status were equally important. Owners of cats and dogs appeared to normalise their animal s body shape i.e owners of overweight animals were more likely to think their pet was an ideal shape rather than overweight and owners of underweight animals were more likely to think they were an ideal shape rather than underweight. Risk factors identified for misperception in dog owners were gender of owner and age of the dog. One risk factor was identified for misperception by cat owners; that is whether the cat was long haired or not. The results reiterated the importance of nutritional advice at neutering and during middle age for all species studied. The prevalence estimates provided in the thesis will help guide subsequent study design especially sample size calculations. Owner factors deserve further study in both the aetiology of canine and feline overweight/obesity. Owner misperception of pet body shape is also a common phenomenon and owners require guidance on what constitutes a normal body shape for their animal.the results of owner misperception of pet body shape suggest that studies based on owner assessment of overweight status need to be interpreted with caution given the high likelihood of differential misclassification. In conclusion, the work presented here demonstrates the widespread nature of overweight/obesity within the vet visiting cat, dog and rabbit populations. Some findings have immediate relevance to companion animal veterinary practice such as the importance of neutered status to the prevalence of overweight/obesity, whereas other findings will guide future studies e.g. the prevalence of rabbit overweight. Despite the limitations of this research, these studies show the complexity of risk factors that contribute to overweight/obesity and the importance of understanding the contributors to a positive energy balance both at an individual and a population level. 144
163 References Ajzen, I. (1991). The Theory of Planned Behaviour. Organizational Behavior and Human Decision Processes, 50, Allan, F. J., Pfeiffer, D. U., Jones, B. R., Esslemont, D. H. B., & Wiseman, M. S. (2000). A cross-sectional study of risk factors for obesity in cats in New Zealand. Preventive Veterinary Medicine, 46(3), Appleton, D. J., Rand, J. S., & Sunvold, G. D. (2000). Plasma leptin concentrations in cats: reference range, effect of weight gain and relationship with adiposity as measured by dual energy X-ray absorptiometry. Journal of Feline Medicine and Surgery, 2(4), Appleton, D. J., Rand, J. S., & Sunvold, G. D. (2001). Insulin sensitivity decreases with obesity, and lean cats with low insulin sensitivity are at greatest risk of glucose intolerance with weight gain. Journal of Feline Medicine and Surgery, 3(4), Appleton, D. J., Rand, J. S., & Sunvold, G. D. (2002). Plasma leptin concentrations are independently associated with insulin sensitivity in lean and overweight cats. Journal of Feline Medicine and Surgery, 4(2), Aragon, T. (2010). epitools: Epidemiology Tools. Retrieved from Bach, J. F., Rozanski, E. A., Bedenice, D., Chan, D. L., Freeman, L. M., Lofgren, J. L. S., Oura, T. J., et al. (2007). Association of expiratory airway dysfunction with marked obesity in healthy adult dogs. Journal of the American Veterinary Medical Association, 230(11), Ball, K., Mishra, G. D., & Crawford, D. (2003). Social factors and obesity: an investigation of the role of health behaviours. International Journal of Obesity and Related Metabolic Disorders, 27(3), Barter, L. S., Watson, A. D. J., & Maddison, J. E. (1996). Owner compliance with short term antimicrobial medication in dogs. Australian Veterinary Journal, 74(4), Bates, B., & Maechler, M. (2010). lme4: Linear mixed-effects models using S4 classes. Retrieved from 145
164 Belsito, K. R., Vester, B. M., Keel, T., Graves, T. K., & Swanson, K. S. (2009). Impact of ovariohysterectomy and food intake on body composition, physical activity, and adipose gene expression in cats. Journal of Animal Science, 87(2), Bennett, G., Wolin, K. Y., & Duncan, D. T. (2008). Social determinants of obesity. In F. Hu (Ed.), Obesity Epidemiology. (pp ). New York: Oxford University Press. Bermingham, E. N., Thomas, D. G., Morris, P. J., & Hawthorne, A. J. (2010). requirements of adult cats. The British Journal of Nutrition, 103(8), Energy Bernstein, P. L., & Strack, M. (1996). A Game of Cat and House: Spatial Patterns and Behavior of 14 Domestic Cats (Felis Catus) in the Home. Anthrozoos: A Multidisciplinary Journal of The Interactions of People & Animals, 9(1), Bjornvad, C. R., Nielsen, D. H., Armstrong, P. J., McEvoy, F., Hoelmkjaer, K. M., Jensen, K. S., Pedersen, G. F., et al. (2011). Evaluation of a nine-point body condition scoring system in physically inactive pet cats. American Journal of Veterinary Research, 72(4), Blanchard, G., Nguyen, P. G., Gayet, C., Leriche, I., Siliart, B. S., & Paragon, B. M. (2004). Rapid Weight Loss with a High-Protein Low-Energy Diet Allows the Recovery of Ideal Body Composition and Insulin Sensitivity in Obese Dogs. Journal of Nutrition, 134, Bland, I. M., Guthrie-Jones, A., Taylor, R. D., & Hill, J. (2009). attitudes and behaviour. Preventive Veterinary Medicine, 92(4), Dog obesity: Owner Bland, I. M., Guthrie-Jones, A., Taylor, R. D., & Hill, J. (2010). Dog obesity: Veterinary practices and owners opinions on cause and management. Preventive Veterinary Medicine, 94(3-4), Bodey, A. R., & Michell, A. R. (1996). Epidemiological study of blood pressure in domestic dogs. Journal of Small Animal Practice, 37(3), Brook, C. G. D. (1972). Evidence for a sensitive period in adipose - cell replication in man. The Lancet, 300(7778), Brown, R. G. (1989). Dealing with canine obesity. Canadian Veterinary Journal (La Revue Vétérinaire Canadienne), 30(12), Brown, J., & Wimpenny, P. (2011). Developing a holistic approach to obesity management. International Journal of Nursing Practice, 17(1), Buelund, L. E., Nielsen, D. H., McEvoy, F. J., Svalastoga, E. L., & Bjornvad, C. R. (2011). Measurement of body composition in cats using computed tomography and dual energy X-ray absorptiometry. Veterinary Radiology & Ultrasound, 52(2),
165 Buffington, C. A. T. (2002). External and internal influences on disease risk in cats. Journal of the American Veterinary Medical Association, 220(7), Burkholder, W. J., & Thatcher, C. D. (1998). Validation of predictive equations for use of deuterium oxide dilution to determine body composition of dogs. American Journal of Veterinary Research, 59(8), Burkholder, W.J. & Toll, P.W. Obesity. In: Hand, M.S., Thatcher, C.D., Reimillard, R.L., Roudebush, P., Morris, M.L., Novotny, B.J., editors. Small Animal Clinical Nutrition, 4th edition. Topeka, KS: Mark Morris Institute. 2000; p Butterwick, R. (2000). How fat is that cat? Journal of Feline Medicine & Surgery, 2(2), Canoy, D., & Buchan, I. (2007). Challenges in obesity epidemiology. Obesity Reviews, 8 Suppl 1, Carciofi, A. C., Gonçalves, K. N. V., Vasconcellos, R. S., Bazolli, R. S., Brunetto, M. A., & Prada, F. (2005). A weight loss protocol and owners participation in the treatment of canine obesity. Ciência Rural, 35(6), Cardinali, R., Dalbosco, A., Bonanno, A., Digrigoli, A., Rebollar, P., Lorenzo, P., & Castellini, C. (2008). Connection between body condition score, chemical characteristics of body and reproductive traits of rabbit does. Livestock Science, 116(1-3), Carter, R. A., Geor, R. J., Burton Staniar, W., Cubitt, T. A., & Harris, P. A. (2009). Apparent adiposity assessed by standardised scoring systems and morphometric measurements in horses and ponies. Veterinary Journal, 179(2), Castronguay, T. W. (1981). Dietary dilution, and intake in the cat. Physiol. Behav., 27, Cave, N. J., Allan, F. J., Schokkenbroek, S. L., Metekohy, C. A. M., & Pfeiffer, D. U. (2012). A cross-sectional study to compare changes in the prevalence and risk factors for feline obesity between 1993 and 2007 in New Zealand. Preventive Veterinary Medicine, 107, Cave, N. J., Backus, R. C., Marks, S. L., & Klasing, K. C. (2007). Oestradiol, but not genistein, inhibits the rise in food intake following gonadectomy in cats, but genistein is associated with an increase in lean body mass. Journal of Animal Physiology and Animal Nutrition, 91(9-10), Chauvet, A., Laclair, J., Elliott, D. A., & German, A. J. (2011). Incorporation of exercise, using an underwater treadmill, and active client education into a weight management program for obese dogs. Canadian Veterinary Journal (La Revue Vétérinaire Canadienne), 52(5),
166 Chongsuvivatwong, V. (2011). epicalc: Epidemiological calculator. Retrieved from Clarke, D. L., Wrigglesworth, D., Holmes, K., Hackett, R., & Michel, K. (2005). Using Environmental and Feeding Enrichment to Facilitate Feline Weight Loss. Journal of Animal Physiology and Animal Nutrition, 89(11-12), Cleaveland, S., Meslin, F. X., & Breiman, R. (2006). Dogs can play a useful role as sentinel hosts for disease. Nature, 440(7084), 605. Clutton, R. E. (1988). The medical implications of canine obesity and their relevance to anaesthesia. The British Veterinary Journal, 144(1), Colliard, L., Ancel, J., Benet, J.J., Paragon, B.M., & Blanchard, G. (2006). Risk Factors for Obesity in Dogs in France. Journal of Nutrition, 136(7), 1951S Colliard, L., Paragon, B.-M., Lemuet, B., Bénet, J.-J., & Blanchard, G. (2009). Prevalence and risk factors of obesity in an urban population of healthy cats. Journal of Feline Medicine & Surgery, 11(2), Corby, S., Lee, S., Lewinger, J., & Bull, S. (2010). pmlr: Penalized Multinomial Logistic Regression. Retrieved from Crane, S. W. (1991). Occurrence and management of obesity in companion animals. Journal of Small Animal Practice, 32(6), Cutt, H., Giles-Corti, B., & Knuiman, M. (2008). Encouraging physical activity through dog walking: Why don t some owners walk with their dog? Preventive Medicine, 46(2), Cutt, H. E., Giles-Corti, B., Knuiman, M. W., & Pikora, T. J. (2008). Physical activity behavior of dog owners: development and reliability of the Dogs and Physical Activity (DAPA) tool. Journal of Physical Activity & Health, 5 Suppl 1, S DeBowes L. (2000) Dentistry: peridontal aspects. In: Ettinger SJ, Feldman EC, eds. Textbook of Veterinary Internal Medicine. 5th ed. (pp ) Philadelphia: WB Saunders. Degeling, C., Rock, M., Toews, L., & Teows, L. (2011). Portrayals of canine obesity in English-language newspapers and in leading veterinary journals, : implications for animal welfare organizations and veterinarians as public educators. Journal of Applied Animal Welfare Science, 14(4), Dhurandhar, N. V. (2001). Infectobesity: obesity of infectious origin. Journal of Nutrition, 131(10), 2794S 2797S. 148
167 Dohoo, I., Martin, W., & Stryhnn, H. (2003). Veterinary Epidemiologic Research. Charlottetown, Prince Edward Island, Canada: AVC Inc. Donoghue, S., & Scarlett, J. M. (1998). Diet and Feline Obesity. Journal of Nutrition, 128(12), 2776S. Doria-Rose, V. P., & Scarlett, J. M. (2000). Mortality rates and causes of death among emaciated cats. Journal of the American Veterinary Medical Association, 216(3), Dotson, M. J., & Hyatt, E. M. (2008). Understanding dog-human companionship. Journal of Business Research, 61(5), Earle, K. E., & Smith, P. M. (1991). Digestible energy requirements of adult cats at maintenance. Journal of Nutrition, 121(11 Suppl), S45 6. Edgar, J. L., & Mullan, S. M. (2011). Knowledge and attitudes of 52 UK pet rabbit owners at the point of sale. Veterinary Record, 168(13), 353. Edney, A., & Smith, P. (1986). Study of obesity in dogs visiting veterinary practices in the United Kingdom. Veterinary Record, 118(14), Egenvall, A., Bonnett, B. N., Olson, P., & Hedhammar, Å. (1998). Validation of computerized Swedish dog and cat insurance data against veterinary practice records. Preventive Veterinary Medicine, 36(1), Egger, G., & Swinburn, B. (1997). An ecological approach to the obesity pandemic. BMJ, 315(7106), Ellis, J. M., & Hollands, T. (1998). Accuracy of different methods of estimating the weight of horses. Veterinary Record, 143(12), Esler, M., Rumantir, M., Kaye, D., & Lambert, G. (2001). The sympathetic neurobiology of essential hypertension: disparate influences of obesity, stress, and noradrenaline transporter dysfunction? American Journal of Hypertension, 14(6 Pt 2), 139S 146S. Evans, J. M. M., Newton, R. W., Ruta, D. A., MacDonald, T. M., & Morris, A. D. (2000). Socio-economic status, obesity and prevalence of Type 1 and Type 2 diabetes mellitus. Diabetic Medicine, 17(6), Fettman, M. J., Stanton, C. A., Banks, L. L., Hamar, D. W., Johnson, D. E., Hegstad, R. L., & Johnston, S. (1997). Effects of neutering on bodyweight, metabolic rate and glucose tolerance of domestic cats. Research in Veterinary Science, 62(2), Finke, M. D. (1991). Evaluation of the energy requirements of adult kennel dogs. Journal of Nutrition, 121(11 Suppl), S
168 Finkler, H., Hatna, E., & Terkel, J. (2011). The Impact of Anthropogenic Factors on the Behavior, Reproduction, Management and Welfare of Urban, Free-Roaming Cat Populations. Anthrozoos, 24(1), 19. Finn, E., Freeman, L. M., Rush, J. E., & Lee, Y. (2010). The relationship between body weight, body condition, and survival in cats with heart failure. Journal of Veterinary Internal Medicine, 24(6), Fleischmann, E., Teal, N., Dudley, J., May, W., Bower, J. D., & Salahudeen, A. K. (1999). Influence of excess weight on mortality and hospital stay in 1346 hemodialysis patients. Kidney International, 55(4), Fowler, S. P., Williams, K., Resendez, R. G., Hunt, K. J., Hazuda, H. P., & Stern, M. P. (2008). Fueling the obesity epidemic? Artificially sweetened beverage use and long-term weight gain. Obesity, 16(8), Freeman, L. M., Abood, S. K., Fascetti, A. J., Fleeman, L. M., Michel, K. E., Laflamme, D. P., Bauer, C., et al. (2006). Disease prevalence among dogs and cats in the United States and Australia and proportions of dogs and cats that receive therapeutic diets or dietary supplements. Journal of the American Veterinary Medical Association, 229(4), Freeman, L. M., Becvarova, I., Cave, N., MacKay, C., Nguyen, P., Rama, B., Takashima, G., et al. (2011). WSAVA nutritional assessment guidelines. Journal of Feline Medicine and Surgery, 13(7), Galis, F., Van der Sluijs, I., Van Dooren, T. J. M., Metz, J. A. J., & Nussbaumer, M. (2007). Do large dogs die young? Journal of experimental zoology. Part B, Molecular and Developmental Evolution, 308(2), Gayet, C., Bailhache, E., Dumon, H., Martin, L., Siliart, B., & Nguyen, P. (2004). Insulin resistance and changes in plasma concentration of TNFalpha, IGF1, and NEFA in dogs during weight gain and obesity. Journal of Animal Physiology and Animal Nutrition, 88(3-4), Gentry, S. J. (1993). Results of the clinical use of a standardised weight-reduction program in dogs and cats. Journal of American Animal Hospital Association, 29, German, A. J., Holden, S. L., Wiseman-Orr, M. L., Reid, J., Nolan, A. M., Biourge, V., Morris, P. J., & Scott, E.M. (2012). Quality of life is reduced in obese dogs but improves after successful weight loss. Veterinary Journal, 192(3), German, A. J., Holden, S. L., Bissot, T., Morris, P. J., & Biourge, V. (2009). Use of starting condition score to estimate changes in body weight and composition during weight loss in obese dogs. Research in Veterinary Science, 87(2),
169 German, A. J., Holden, S. L., Mason, S. L., Bryner, C., Bouldoires, C., Morris, P. J., Deboise, M., & Biourge, V. (2011). Imprecision when using measuring cups to weigh out extruded dry kibbled food. Journal of Animal Physiology and Animal Nutrition, 95(3), German, A. J., & Morgan, L. E. (2008). How often do veterinarians assess the bodyweight and body condition of dogs? Veterinary Record, 163(17), German, A. J., Ryan, V. H., German, A. C., Wood, I. S., & Trayhurn, P. (2010a). Obesity, its associated disorders and the role of inflammatory adipokines in companion animals. Veterinary Journal, 185(1), 4 9. German, A. J, Holden, S. L., Morris, P. J., & Biourge, V. (2010b). Comparison of a bioimpedance monitor with dual-energy x-ray absorptiometry for noninvasive estimation of percentage body fat in dogs. American Journal of Veterinary Research, 71(4), German, A. J. (2006). The Growing Problem of Obesity in Dogs and Cats. Journal of Nutrition, 136(7), 1940S German, A. J., Holden, S. L., Moxham, G. L., Holmes, K. L., Hackett, R. M., & Rawlings, J. M. (2006). A Simple, Reliable Tool for Owners to Assess the Body Condition of Their Dog or Cat. Journal of Nutrition, 136(7), 2031S Glickman, L. T., Soonenschein, E. G., Glickman, N. W., Donoghue, S., & Goldschmidt, M. H. (1995). Pattern of diet and obesity in female adult pet dogs. Veterinary Clinical Nutrition, 2, Goldstein, H., Browne, W., & Rasbash, J. (2001). Partitioning Variation in Multilevel Models. Understanding Statistics, 1, Goossens, G. H., Blaak, E. E., & van Baak, M. A. (2003). Possible involvement of the adipose tissue renin-angiotensin system in the pathophysiology of obesity and obesity-related disorders. Obesity Reviews, 4(1), Gordon, R. S. (1974). An operational classification of disease prevention. Public Health Reports, 98(2), Gordon-Larsen, P. (2001). Obesity-Related Knowledge, Attitudes, and Behaviors in Obese and Non-obese Urban Philadelphia Female Adolescents. Obesity, 9(2), Gossellin, J., Wren, J. A., & Sunderland, S. J. (2007). Canine obesity an overview. Journal of Veterinary Pharmacology and Therapeutics, 30, Greer, K. A., Canterberry, S. C., & Murphy, K. E. (2007). Statistical analysis regarding the effects of height and weight on life span of the domestic dog. Research in Veterinary Science, 82(2),
170 Gregory, C. O., Blanck, H. M., Gillespie, C., Michele Maynard, L., Serdula, M. K., & Maynard, L. M. (2008). Health perceptions and demographic characteristics associated with underassessment of body weight. Obesity, 16(5), Gregory, S. P. (1994). Developments in the understanding of the pathophysiology of urethral sphincter mechanism in competence in the bitch. The British Veterinary Journal, 150(2), Guh, D. P., Zhang, W., Bansback, N., Amarsi, Z., Birmingham, C. L., & Anis, A. H. (2009). The incidence of co-morbidities related to obesity and overweight: a systematic review and meta-analysis. BMC Public Health, 9(1), 88. Gutiérrez-Fisac, J. L., Regidor, E., Banegas Banegas, J. R., & Rodríguez Artalejo, F. (2002). The size of obesity differences associated with educational level in Spain, 1987 and 1995/97. Journal of Epidemiology and Community Health, 56(6), Hakansson, M.-L., Brown, H., Ghilardi, N., Skoda, R. C., & Meister, B. (1998). Leptin Receptor Immunoreactivity in Chemically Defined Target Neurons of the Hypothalamus. Journal of Neuroscience, 18(1), Harcourt-Brown, F. (2002). Textbook of rabbit medicine. London; Butterworth-Heinemann. Harnack, L., Lytle, L., Himes, J. H., Story, M., Taylor, G., & Bishop, D. (2009). Low awareness of overweight status among parents of preschool-aged children, Minnesota, Preventing Chronic Disease, 6(2), A47. Harper, E. J. (1998). Changing Perspectives on Ageing and Energy Requirements: Ageing and Energy Intakes in Humans, Dogs and Cats. Journal of Nutrition, 128(12), 2623S. Harper, E. J., Stack, D. M., Watson, T. D. G., & Moxham, G. (2001). Effects of feeding regimens on bodyweight, composition and condition score in cats following ovariohysterectomy. Journal of Small Animal Practice, 42(9), Häring, T., Wichert, B., Dolf, G., & Haase, B. (2011). Segregation analysis of overweight body condition in an experimental cat population. Journal of Heredity, 102 (Suppl 1), S Harris, M. B. (1983). International Journal of Obesity, 7(3), Eating habits, restraint, knowledge and attitudes toward obesity. Hausman, J., & McFadden, D. (1984). Specification Tests for the Multinomial Logit Model. Econometrica, 52(5), Hawthorne, A. J., Bradley, R., & Butterwick, R. F. (2005). Body fat measurement system. US Patent No. 600/300; 128/898; 128/
171 Heindel, J. J. (2003). Endocrine Disruptors and the Obesity Epidemic. Toxicological Sciences, 76(2), Henneke, D. R., Potter, G. D., Kreider, J. L., & Yeates, B. F. (1983). Relationship between condition score, physical measurements and body fat percentage in mares. Equine Veterinary Journal, 15(4), Hess, R. S., Kass, P. H., Shofer, F. S., Van Winkle, T. J., & Washabau, R. J. (1999). Evaluation of risk factors for fatal acute pancreatitis in dogs. Journal of the American Veterinary Medical Association, 214(1), Heuberger, R., & Wakshlag, J. (2011). The relationship of feeding patterns and obesity in dogs. Journal of Animal Physiology and Animal Nutrition, 95(1), Hoenig, M. (2012). The cat as a model for human obesity and diabetes. Journal of Diabetes Science and Technology, 6(3), Hoenig, M., & Ferguson, D. C. (2002). Effects of neutering on hormonal concentrations and energy requirements in male and female cats. American Journal of Veterinary Research, 63(5), Hoggard, N., Hunter, L., Duncan, J. S., Williams, L. M., Trayhurn, P., & Mercer, J. G. (1997). Leptin and leptin receptor mrna and protein expression in the murine fetus and placenta. Proceedings of the National Academy of Sciences, 94(20), Holmes, K., Morris, P. J., Abdulla, Z., Hackett, R., & Rawlings, J. (2007). Risk factors associated with excess body weight in dogs in the UK. Journal of Animal Physiology and Animal Nutrition, 91(3-4), Hosmer, D. W., & Lemeshow, S. (2000). Applied Logistic Regression (Vol. 2). John Wiley and Sons. Hostutler, R. A., Chew, D. J., & DiBartola, S. P. (2005). Recent Concepts in Feline Lower Urinary Tract Disease. Veterinary Clinics of North America: Small Animal Practice, 35, House of Commons Health Committee. (2004). Obesity Third Report of Session Retrieved from Houseknecht, K. L., Baile, C. A., Matteri, R. L., & Spurlock, M. E. (1998). The biology of leptin: a review. Journal of Animal Science, 76(5), Howard, B. V., Ruotolo, G., & Robbins, D. C. (2003). Obesity and dyslipidemia. Endocrinology and metabolism clinics of North America, 32(4),
172 Howe, L. M., Slater, M. R., Boothe, H. W., Hobson, H. P., Fossum, T. W., Spann, A. C., & Wilkie, W. S. (2000). Long-term outcome of gonadectomy performed at an early age or traditional age in cats. Journal of the American Veterinary Medical Association, 217(11), Hoyumpa Vogt, A., Rodan, I., Brown, M., Brown, S., Buffington, C. A. T., LaRue Forman, M. J., Neilson, J., & Sparks, A.. (2010). AAFP-AAHA: Feline Life Stage Guidelines. Journal of Feline Medicine & Surgery, 12(1), Husson, F., Josse, J., Le, S., & Mazet, J. (2010). FactoMineR: Multivariate Exploratory Data Analysis and Data Mining with R. Retrieved from Impellizeri, J. A., Tetrick, M. A., & Muir, P. (2000). Effect of weight reduction on clinical signs of lameness in dogs with hip osteoarthritis. Journal of the American Veterinary Medical Association, 216(7), International Obesity Taskforce. (2002). Obesity in Europe: The Case for Action. Retrieved from Ishioka, K, Hatai, H., Komabayashi, K., Soliman, M. M., Shibata, H., Honjoh, T., Kimura, K., et al. (2005). Diurnal variations of serum leptin in dogs: effects of fasting and re-feeding. Veterinary Journal, 169(1), Ishioka, K, Hosoya, K., Kitagawa, H., Shibata, H., Honjoh, T., Kimura, K., & Saito, M. (2007). Plasma leptin concentration in dogs: effects of body condition score, age, gender and breeds. Research in Veterinary Science, 82(1), Ishioka, K, Okumura, M., Sagawa, M., Nakadomo, F., Kimura, K., & Saito, M. (2005). Computed tomographic assessment of body fat in beagles. Veterinary Radiology & Ultrasound, 46(1), Ishioka, K, Omachi, A., Sagawa, M., Shibata, H., Honjoh, T., Kimura, K., & Saito, M. (2006). Canine adiponectin: cdna structure, mrna expression in adipose tissues and reduced plasma levels in obesity. Research in Veterinary Science, 80(2), Ishioka, Katsumi, Omachi, A., Sasaki, N., Kimura, K., & Saito, M. (2009). Feline adiponectin: molecular structures and plasma concentrations in obese cats. The Journal of Veterinary Medical Science [The Japanese Society of Veterinary Science], 71(2), Jeusette, I., Greco, D., Aquino, F., Detilleux, J., Peterson, M., Romano, V., & Torre, C. (2010). Effect of breed on body composition and comparison between various methods to estimate body composition in dogs. Research in Veterinary Science, 88(2), Johnson, F., Cooke, L., Croker, H., & Wardle, J. (2008). Changing perceptions of weight in Great Britain: comparison of two population surveys. BMJ, 337, a
173 Johnson-Taylor, W. L., Fisher, R. A., Hubbard, V. S., Starke-Reed, P., & Eggers, P. S. (2008). The change in weight perception of weight status among the overweight: comparison of NHANES III ( ) and NHANES. International Journal of Behavioral Nutrition and Physical Activity, 5, 9 Jordan, E., Kley, S., Le, N.A., Waldron, M., & Hoenig, M. (2008). Dyslipidemia in obese cats. Domestic Animal Endocrinology, 35(3), Joshua, J. O. (1970). The obese dog and some clinical repercussions. Journal of Small Animal Practice, 11(9), Kan, K., & Tsai, W.D. (2004). Obesity and risk knowledge. Journal of Health Economics, 23(5), Kanchuk, M. L., Backus, R. C., Calvert, C. C., Morris, J. G., & Rogers, Q. R. (2002). Neutering induces changes in food intake, body weight, plasma insulin and leptin concentrations in normal and lipoprotein lipase-deficient male cats. Journal of Nutrition, 132(6 Suppl 2), 1730S 2S. Kane, E., Rogers, Q. R., & Morris, J. G. (1981). Feeding behavior of the cat fed laboratory and commercial diets. Nutrition Research, 1, Karlsson, C., Lindell, K., Ottosson, M., Sjöström, L., Carlsson, B., & Carlsson, L. M. (1998). Human adipose tissue expresses angiotensinogen and enzymes required for its conversion to angiotensin II. Journal of Clinical Endocrinology and Metabolism, 83(11), Kealy, R. D., Lawler, D. F., Ballam, J. M., Mantz, S. L., Biery, D. N., Greeley, E. H., Lust, G., Segre, M., & Smith, G.K. (2002). Effects of diet restriction on life span and agerelated changes in dogs. Journal of the American Veterinary Medical Association, 220(9), Kelly, T., Yang, W., Chen, C.S., Reynolds, K., & He, J. (2008). Global burden of obesity in 2005 and projections to (2005). International Journal of Obesity, 32(9), Kennel Club. (2009). Breed Registration Statistics. Retrieved from Kienzle, E., & Bergler, R. (2006). Human-animal relationship of owners of normal and overweight cats. Journal of Nutrition, 136(7 Suppl), 1947S 1950S. Kienzle, E., Bergler, R., & Mandernach, A. (1998). A Comparison of the Feeding Behavior and the Human-Animal Relationship in Owners of Normal and Obese Dogs. Journal of Nutrition, 128(12), 2779S. 155
174 Kikuchi, A., Bleach, E., & Chikunya, S. (2010). Influence of cat owners feeding practice and attitude towards obesity on body condition of cats. Advances in Animal Biosciences, 1(01), 107. Klimentidis, Y. C., Beasley, T. M., Lin, H.-Y., Murati, G., Glass, G. E., Guyton, M., Newton, W., et al. (2011). Canaries in the coal mine: a cross-species analysis of the plurality of obesity epidemics. Proceedings of the Royal Society B: Biological Sciences, 278(1712), Kronfeld, D. S., Donoghue, S., & Glickman, L. T. (1994). Body condition of Cats. Journal of Nutrition, 124, 2683S 2684S. Kuchler, F., & Variyam, J. N. (2003). Mistakes were made: misperception as a barrier to reducing overweight. International Journal of Obesity, 27(7), Kulldorf, M. (1997). A spatial scan statistic. Communication in statistics: Theory and Methods, 26, Kvart, C., & Haggstrom, C. (2000). Acquiried valvular heart disease (pp ). Philadephia: WB Saunders. Laflamme, D. (1997a). dogs. Canine Practice, 22, Development and validation of a body condition score system for Laflamme, D. (1997b). Development and validation of a body condition score system for cats: a clinical tool. Feline Practice, 25, Laflamme, D., & Ballam, J. M. (2002). Effect of age on maintenance energy requirements of adult cats. Compend Contin Edu Pract Vet, 24 (Suppl), 82. Laflamme, D., Kuhlman, G., & Lawler, D. (1997). Evaluation of weight loss protocols for dogs. Journal of the American Animal Hospital Association, 33(3), Laflamme, D. P. (2001). Determining metabolizable energy content in commercial pet foods. Journal of Animal Physiology and Animal Nutrition, 85(7-8), Laflamme, D. P. (2006). Understanding and managing obesity in dogs and cats. Veterinary clinics of North America. Small animal practice, 36(6), Laflamme, D. P., Abood, S. K., Fascetti, A. J., Fleeman, L. M., Freeman, L. M., Michel, K. E., Bauer, C., Kemp, B.L.E.,Van Doren, J.R., & Willoughby, K.N. (2008). Pet feeding practices of dog and cat owners in the United States and Australia. Journal of the American Veterinary Medical Association, 232(5), Larsen, J. K., Ouwens, M., Engels, R. C. M. E., Eisinga, R., & van Strien, T. (2008). Validity of self-reported weight and height and predictors of weight bias in female college students. Appetite, 50(2-3),
175 Lascelles, B. D. X., Hansen, B. D., Thomson, A., Pierce, C. C., Boland, E., & Smith, E. S. (2008). Evaluation of a digitally integrated accelerometer-based activity monitor for the measurement of activity in cats. Veterinary Anaesthesia and Analgesia, 35(2), Lauten, S. D., Cox, N. R., Brawner, W. R., & Baker, H. J. (2001). Use of dual energy x-ray absorptiometry for noninvasive body composition measurements in clinically normal dogs. American Journal of Veterinary Research, 62(8), Lawlor, D.A.; Hart, C.L.; Hole, D.J.; Davey Smith, G. (2006) Reverse causality and confounding and the associations of overweight and obesity with mortality. Obesity, 14 (12), Lee, S. Y., & Gallagher, D. (2008). Assessment methods in human body composition. Current opinion in clinical nutrition and metabolic care, 11(5), Legrand-Defretin, V. (1994). Energy requirements of cats and dogs what goes wrong? International Journal of Obesity and Related Metabolic Disorders, 18 Suppl 1, S8 13. Lehnert-Batar, A. (2006). partial: partial package. R package Version See Appendix C. Lekcharoensuk, C., Osborne, C. A., Lulich, J. P., Pusoonthornthum, R., Kirk, C. A., Ulrich, L. K., Koehler, L. A., Carpenter, K. A., & Swanson, L.L. (2001). Association between dietary factors and calcium oxalate and magnesium ammonium phosphate urolithiasis in cats. Journal of the American Veterinary Medical Association, 219(9), Leroith, D. (2012). Pathophysiology of the metabolic syndrome: implications for the cardiometabolic risks associated with type 2 diabetes. The American Journal of the Medical Sciences, 343(1), Linder, D. E., & Freeman, L. M. (2010). Evaluation of calorie density and feeding directions for commercially available diets designed for weight loss in dogs and cats. Journal of the American Veterinary Medical Association, 236(1), Little, P., Barnett, J., Margetts, B., Kinmonth, A., Gabbay, J., Thompson, R., Warm, D., et al. (1999). The validity of dietary assessment in general practice. Journal of Epidemiology and Community Health, 53(3), Loos, R. J. F., Lindgren, C. M., Li, S., Wheeler, E., Zhao, J. H., Prokopenko, I., Inouye, M., et al. (2008). Common variants near MC4R are associated with fat mass, weight and risk of obesity. Nature Genetics, 40(6), Lund, E.M., Armstrong, P., Kirk, C., & Klausner, J. (2005). Prevalence and Risk Factors for Obesity in Adult Cats from Private US Veterinary Practices. International Journal of Applied Research in Veterinary Medicine, 3(2),
176 Lund, E.M., Armstrong, P., Kirk, C., & Klausner, J. (2006). Prevalence and Risk Factors for Obesity in Adult Dogs from Private US Veterinary Practices. International Journal of Applied Research in Veterinary Medicine, 3(2), Lutz, T. A., & Rand, J. S. (1995). Pathogenesis of feline diabetes mellitus. Veterinary Clinics of North America: Small Animal Practice, 25(3), Madrigal, H., Sánchez-Villegas, A., Martínez-González, M. A., Kearney, J., Gibney, M. J., de Irala, J., & Martínez, J. A. (2000). Underestimation of body mass index through perceived body image as compared to self-reported body mass index in the European Union. Public Health, 114(6), Manco, M., Fernandez-Real, J. M., Equitani, F., Vendrell, J., Valera Mora, M. E., Nanni, G., Tondolo, V., et al. (2007). Effect of massive weight loss on inflammatory adipocytokines and the innate immune system in morbidly obese women. Journal of Clinical Endocrinology and Metabolism, 92(2), Manens, J., Bolognin, M., Bernaerts, F., Diez, M., Kirschvink, N., & Clercx, C. (2012). Effects of obesity on lung function and airway reactivity in healthy dogs. Veterinary Journal, 193(1), Margetic, S., Gazzola, C., Pegg, G. G., & Hill, R. A. (2002). Leptin: a review of its peripheral actions and interactions. International Journal of Obesity and Related Metabolic Disorders, 26(11), Marks, S. L., Rogers, Q. R., & Strombeck, D. R. (1994). Nutritional support in hepatic disease. Part II. Dietary management of common liver disorders in dogs and cats. Comp. Cont. Educ. Pract. Vet., 16, Markwell, P. J., Butterwick, R. F., Wills, J. M., & Raiha, M. (1994). Clinical studies in the management of obesity in dogs and cats. International Journal of Obesity and Related Metabolic Disorders, 18 Suppl 1, S Marshall, R. J. (2001). The use of classification and regression trees in clinical epidemiology. Journal of Clinical Epidemiology, 54(6), Marshall, W. G., Hazewinkel, H. A. W., Mullen, D., De Meyer, G., Baert, K., & Carmichael, S. (2010). The effect of weight loss on lameness in obese dogs with osteoarthritis. Veterinary Research Communications, 34(3), Martin, L. J. M., Siliart, B., Dumon, H. J. W., & Nguyen, P. G. (2006). Hormonal disturbances associated with obesity in dogs. Journal of Animal Physiology and Animal Nutrition, 90(9-10), Mason, E. (1970). Obesity in Pet Dogs. Veterinary Record, 86(21),
177 Masuzaki, H., Ogawa, Y., Sagawa, N., Hosoda, K., Matsumoto, T., Mise, H., Nishimura, H., Yoshimura, Y., Tanaka, I., Mori, T. & Nakao, K. (1997). Nonadipose tissue production of leptin: Leptin as a novel placenta-derived hormone in humans. Nature Medicine, 3(9), Mathieu, M.-E., Drapeau, V., & Tremblay, A. (2010). Parental Misperception of Their Child s Body Weight Status Impedes the Assessment of the Child s Lifestyle Behaviors. International Journal of Pediatrics, 2010, Mawby, D. I., Bartges, J. W., D Avignon, A., Laflamme, D. P., Moyers, T. D., & Cottrell, T. (2001). Comparison of various methods for estimating body fat in dogs. Journal of the American Animal Hospital Association, 40(2), McAuley, P. A., & Blair, S. N. (2011). Obesity paradoxes. Journal of Sports Sciences, 29(8), McGreevy, P. D., Thomson, P. C., Pride, C., Fawcett, A., Grassi, T., & Jones, B. (2005). Prevalence of obesity in dogs examined by Australian veterinary practices and the risk factors involved. Veterinary Record, 156(22), McLaren, L. (2007). Socioeconomic status and obesity. Epidemiologic Reviews, 29(1), Menotti-Raymond, M., David, V. A., Pflueger, S. M., Lindblad-Toh, K., Wade, C. M., O Brien, S. J., & Johnson, W. E. (2008). Patterns of molecular genetic variation among cat breeds. Genomics, 91(1), Michel, K., & Scherk, M. (2012). From problem to success: feline weight loss programs that work. Journal of Feline Medicine and Surgery, 14(5), Mikolajczyk, R., Maxwell, A., El Ansari, W., Stock, C., Petkeviciene, J., & Guillen-Grima, F. (2010). Relationship between perceived body weight and body mass index based on self-reported height and weight among university students: a cross-sectional study in seven European countries. BMC Public Health, 10(1), 40. Mlacnik, E., Bockstahler, B. A., Müller, M., Tetrick, M. A., Nap, R. C., & Zentek, J. (2006). Effects of caloric restriction and a moderate or intense physiotherapy program for treatment of lameness in overweight dogs with osteoarthritis. Journal of the American Veterinary Medical Association, 229(11), Modern Veterinary Practice. (1965). Modern Veterinary Practice Staff Report, 46, 58. Montoya, J. A., Morris, P. J., Bautista, I., Juste, M. C., Suarez, L., Pena, C., Hackett, R. M., & Rawlings, J. (2006). Hypertension: a risk factor associated with weight status in dogs. Journal of Nutrition, 136(7), 2011S
178 Moon, G., Quarendon, G., Barnard, S., Twigg, L., & Blyth, B. (2007). Fat nation: Deciphering the distinctive geographies of obesity in England. Social Science & Medicine, 65(1), Morooka, T., Niiyama, M., Uchida, E., Uemura, M., Miyoshi, K., & Saito, M. (2001). Measurement of the back fat layer in beagles for estimation of obesity using two-dimensional ultrasonography. Journal of Small Animal Practice, 42(2), Munday, H., Earle, K., & Anderson, P. (1994). Changes in the body composition of the domestic shorthaired cat during growth and development. Journal of Nutrition, 124, 2622S 2623S. Murray, J. K., Roberts, M. A., Whitmarsh, A., Gruffydd-Jones, T. J., & Whitmars, A. (2009). Survey of the characteristics of cats owned by households in the UK and factors affecting their neutered status. Veterinary Record, 164(5), Murray, J. K., Browne, W. J., Roberts, M. A., Whitmarsh, A., & Gruffydd-Jones, T. J. (2010). Number and ownership profiles of cats and dogs in the UK. Veterinary Record, 166(6), Murray, J. K., & Gruffydd-Jones, T. J. (2011). Proportion of pet cats registered with a veterinary practice and factors influencing registration in the UK. Veterinary Journal, 192, Must, A., Barish, E. E., & Bandini, L. G. (2009). Modifiable risk factors in relation to changes in BMI and fatness: what have we learned from prospective studies of school-aged children? International Journal of Obesity (2005), 33(7), National Audit Office. (2001). Tackling Obesity in England. Retrieved from National Research Council (U.S.). Subcommittee on Cat Nutrition. (1986). Nutrient Requirements of Cats (Revised Ed.). Washington DC: National Academy Press. National Statistics. (1999). Geography - government office regions (GOR). Retrieved from Nguyen, P. G., Dumon, H. J., Siliart, B. S., Martin, L. J., Sergheraert, R., & Biourge, V. C. (2004). Effects of dietary fat and energy on body weight and composition after gonadectomy in cats. American Journal of Veterinary Research, 65(12), Nijland, M. L., Stam, F., & Seidell, J. C. (2010). Overweight in dogs, but not in cats, is related to overweight in their owners. Public Health Nutrition, 13(01), Panciera, D. L. (1994). Hypothyroidism in dogs: 66 cases ( ). Journal of the American Veterinary Medical Association, 204(5),
179 Panciera, D. L., Thomas, C. B., Eicker, S. W., & Atkins, C. E. (1990). Epizootiologic patterns of diabetes mellitus in cats: 333 cases ( ). Journal of the American Veterinary Medical Association, 197(11), Parker, V. J., & Freeman, L. M. (2011). Association between body condition and survival in dogs with acquired chronic kidney disease. Journal of Veterinary Internal Medicine, 25(6), Peña, C., Suárez, L., Bautista, I., Montoya, J. A., & Juste, M. C. (2008). Relationship between analytic values and canine obesity. Journal of Animal Physiology and Animal Nutrition, 92(3), Pendergrass, P. B., Bartley, C. M., Nagy F., Ream, L. J., & Stuhlman, R. (1983). A rapid method for determining normal weights of medium-to-large mongrel dogs. Journal of Small Animal Practice, 24(5), Penell, J. C., Egenvall, A., Bonnett, B. N., & Pringle, J. (2007). Validation of computerized Swedish horse insurance data against veterinary clinical records. Preventive Veterinary Medicine, 82(3-4), Perez-Alenza, M. D. P., Pena, L., Castillo, N. del, & Nieto, A. I. (2000). Factors influencing the incidence and prognosis of canine mammary tumours. Journal of Small Animal Practice, 41(7), Peterson, M. (2000). Hyperthyroidism (pp ). In: Ettinger SJ, Feldman EC (eds): Textbook of Veterinary Internal Medicine: Diseases of the Dog and Cat (Fifth Edition). Philadelphia, Saunders Philibert, J. C., Snyder, P. W., Glickman, N., Glickman, L. T., Knapp, D. W., & Waters, D. J. (2003). Influence of host factors on survival in dogs with malignant mammary gland tumors. Journal of Veterinary Internal Medicine, 17(1), Ploner, M., Dunkler, D., Southworth, H., & Heinze, G. (2010). logistf: Firth s bias reduced logistic regression. Retrieved from Polzin, D. J., Osborne, C. A., Ross, S., & Jacob, F. (2000). Dietary management of feline chronic renal failure: where are we now? In what direction are we headed? Journal of Feline Medicine and Surgery, 2(2), Prentice, A. M., & Jebb, S. A. (1995). Obesity in Britain: gluttony or sloth? BMJ, 311(7002), R Development Core Team. (2009). R: A language and environment for statistical computing. Vienna, Austria: R Foundation for Statistical Computing. 161
180 Radin, M. J., Sharkey, L. C., & Holycross, B. J. (2009). Adipokines: a review of biological and analytical principles and an update in dogs, cats, and horses. Veterinary Clinical Pathology, 38(2), Ramsey, I. K., & Holden, S. L. (2009). Veterinary Nursing Journal, 24(1), Advances in the management of obesity in dogs. Rand, J. S., Fleeman, L. M., Farrow, H. A., Appleton, D. J., & Lederer, R. (2004). Canine and Feline Diabetes Mellitus: Nature or Nurture? Journal of Nutrition, 134(8), 2072S Rasbash, J., Steele, F., Browne, W., & Prosser, B. (2004). A User s Guide to MLwiN. Centre for Multilevel Modelling, Institute of Education, University of London. Rennie, K. L., & Jebb, S. A. (2005). Prevalence of obesity in Great Britain. Obesity Reviews: An Official Journal of the International Association for the Study of Obesity, 6(1), Ripley, B. (2009). nnet: Feed-forward Neural Networks and Multinomial Log-Linear Models. Retrieved from Robertson, I. D. (1999). The influence of diet and other factors on owner-perceived obesity in privately owned cats from metropolitan Perth, Western Australia. Preventive Veterinary Medicine, 40(2), Robertson, I. D. (2003). The association of exercise, diet and other factors with ownerperceived obesity in privately owned dogs from metropolitan Perth, WA. Preventive Veterinary Medicine, 58(1-2), Rohlf, V. I., Toukhsati, S., Coleman, G. J., & Bennett, P. C. (2010). Dog obesity: can dog caregivers (owners ) feeding and exercise intentions and behaviors be predicted from attitudes? Journal of Applied Animal Welfare Science, 13(3), Roth, J., Qiang, X., Marbán, S. L., Redelt, H., & Lowell, B. C. (2004). The obesity pandemic: where have we been and where are we going? Obesity Research, 12 Suppl 2, 88S 101S. Roudebush, P., Allen, T. A., Dodd, C. E., & Novotny, B. J. (2004). Application of evidencebased medicine to veterinary clinical nutrition. Journal of the American Veterinary Medical Association, 224(11), Roudebush, P., Schoenherr, W. D., & Delaney, S. J. (2008). An evidence-based review of the use of nutraceuticals and dietary supplementation for the management of obese and overweight pets. Journal of the American Veterinary Medical Association, 232(11), Russell, K., Sabin, R., Holt, S., Bradley, R., & Harper, E. J. (2000). Influence of feeding regimen on body condition in the cat. Journal of Small Animal Practice, 41(1),
181 Sagawa, M. M., Nakadomo, F., Honjoh, T., Ishioka, K., & Saito, M. (2002). Correlation between plasma leptin concentration and body fat content in dogs. American Journal of Veterinary Research, 63(1), Sallander, M., Hedhammar, A., Rundgren, M., & Lindberg, J. E. (2010). Feeding patterns and dietary intake in a random sample of a Swedish population of insured-dogs. Preventive Veterinary Medicine, 95(3-4), Salmeri, K. R., Bloomberg, M. S., Scruggs, S. L., & Shille, V. (1991). Gonadectomy in immature dogs: effects on skeletal, physical, and behavioral development. Journal of the American Veterinary Medical Association, 198(7), Scarlett, J. M., & Donoghue, S. (1998). Association between body condition and disease in cats. Journal of the American Veterinary Medical Association, 212, Scarlett, J. M., Donoghue, S., Saidla, J., & Wills, J. (1994). Overweight cats: prevalence and risk factors. International Journal of Obesity, 18, S22 S28. Schlesselman, J. (1982). Case-Control Studies: Design, Conduct, Analysis (p. 368). Oxford University Press. Schofield, G., Mummery, K., & Steel, R. (2005). Dog ownership and human health-related physical activity: An epidemiological study. Health Promotion Journal of Australia : Official Journal of Australian Association of Health Promotion Professionals, 16, ScotPHO. (2007). Obesity in Scotland : An epidemiology briefing Retrieved from epidemiology-briefing- Señaris, R. (1997). Synthesis of Leptin in Human Placenta. Endocrinology, 138(10), Shah, N. R., & Braverman, E. R. (2012). Measuring adiposity in patients: the utility of body mass index (BMI), percent body fat, and leptin. PloS one, 7(4), e Sibley, K. W. (1984). Diagnosis and management of the overweight dog. British Veterinary Journal, 140(2), Sing, T., Sander, O., Beerenwinkel, N., & Lengauer, T. (2005). ROCR: visualizing classifier performance in R. Bioinformatics, 21(20), Singh, B. R., Laflamme, D. P., Ballam, J. M., Nielsen, M., & Kalishman, D. (2004). Methods and systems for predicting a body condition score for pets. US Patent No. 10/038,
182 Sloth, C. (1992). Practical management of obesity in dogs and cats. Journal of Small Animal Practice, 33(4), Smith-Kirwin, S. M. (1998). Leptin expression in human mammary epithelial cells and breast milk. Journal of Clinical Endocrinology & Metabolism, 83(5), Snijders, T. A. B., & Bosker, R. J. (1999). Multilevel analysis. an introduction to basic and advanced multilevel modelling (pp ). London; Sage Publications. Sonnenschein, E. G., Glickman, L. T., Goldschmidt, M. H., & McKee, L. J. (1991). Body conformation, diet, and risk of breast cancer in pet dogs: a case-control study. American Journal of Epidemiology, 133(7), Sourial, N., Wolfson, C., Zhu, B., Quail, J., Fletcher, J., Karunananthan, S., Bandeen-Roche, K., et al. (2010). Correspondence analysis is a useful tool to uncover the relationships among categorical variables. Journal of Clinical Epidemiology, 63(6), Spain, C. V., Scarlett, J. M., & Houpt, K. A. (2004). Long-term risks and benefits of earlyage gonadectomy in dogs. Journal of the American Veterinary Medical Association, 224(3), Speakman, J. R., Booles, D., & Butterwick, R. (2001). Validation of dual energy X-ray absorptiometry (DXA) by comparison with chemical analysis of dogs and cats. International Journal of Obesity and Related Metabolic Disorders, 25(3), Speakman, J. R., van Acker, A., & Harper, E. J. (2003). Age-related changes in the metabolism and body composition of three dog breeds and their relationship to life expectancy. Aging Cell, 2(5), Speybroeck, N., Berkvens, D., Mfoukou-Ntsakala, A., Aerts, M., Hens, N., Van Huylenbroeck, G., & Thys, E. (2004). Classification trees versus multinomial models in the analysis of urban farming systems in Central Africa. Agricultural Systems, 80(2), Stanton, C. A., Hamar, D. W., Johnson, D. E., & Fettman, M. J. (1992). Bioelectrical impedance and zoometry for body composition analysis in domestic cats. American Journal of Veterinary Research, 53(2), Stephenson, H. M., Green, M. J., & Freeman, S. L. (2011). population of horses in the UK. Veterinary Record, 168(5), 131. Prevalence of obesity in a Suarez, L., Peña, C., Carretón, E., Juste, M. C., Bautista-Castaño, I., & Montoya-Alonso, J. A. (2012). Preferences of owners of overweight dogs when buying commercial pet food. Journal of Animal Physiology and Animal Nutrition, 96(4), Susser, M. (1998). Does risk factor epidemiology put epidemiology at risk? Peering into the future. Journal of Epidemiology & Community Health, 52(10),
183 Taylor, E. J., Adams, C., & Neville, R. (1995). Some nutritional aspects of ageing in dogs and cats. Proceedings of the Nutrition Society, 54, Thatcher, C. D., Pleasant, R. S., Geor, R. J., Elvinger, F., Negrin, K. A., Franklin, J., Gay, L., et al. (2008). Prevalence of obesity in mature horses: an equine body condition study. Journal of Animal Physiology and Animal Nutrition, 92(2), Therneau, T. M., & Atkinson, B. (2009). rpart: Recursive Partitioning. Retrieved from Thomson, R. M., Hammond, J., Ternent, H. E., & Yam, P. S. (2008). Feeding practices and the use of supplements for dogs kept by owners in different socioeconomic groups. Veterinary Record, 163(21), Thorne, C. J. (1982). Feeding behaviour in the cat recent advances. Journal of Small Animal Practice, 23(9), Thrusfield, M. (2006). Veterinary Epidemiology (3rd ed.). Oxford, U.K.: Blackwell Scientific. Trayhurn, P., & Wood, I. S. (2004). Adipokines: inflammation and the pleiotropic role of white adipose tissue. The British Journal of Nutrition, 92(3), Treiber, K. H., Kronfeld, D. S., Hess, T. M., Byrd, B. M., Splan, R. K., & Staniar, W. B. (2006). Evaluation of genetic and metabolic predispositions and nutritional risk factors for pasture-associated laminitis in ponies. Journal of the American Veterinary Medical Association, 228(10), Trevejo, R., Yang, M., & Lund, E. M. (2011). Epidemiology of surgical castration of dogs and cats in the United States. Journal of the American Veterinary Medical Association, 238(7), Trippany, J., Funk, J., & Buffington, C. (2003). Effects of environmental enrichments on weight loss in cats. Program of the 21st Annual ACVIM Forum Charlotte, NC, June 2-7, 2003 (pp ). Tvarijonaviciute, A., German, A. J., Martínez-Subiela, S., Tecles, F., & Ceron, J. J. (2012). Analytical performance of commercially-available assays for feline insulin-like growth factor 1 (IGF-1), adiponectin and ghrelin measurements. Journal of Feline Medicine and Surgery, 14(2), Tvarijonaviciute, A., Martínez-Subiela, S., & Ceron, J. J. (2010). Validation of 2 commercially available enzyme-linked immunosorbent assays for adiponectin determination in canine serum samples. Canadian Journal of Veterinary Research (Revue Canadienne de Recherche Vétérinaire), 74(4),
184 Van Rooijen, J. (1991). Predictability and boredom. Applied Animal Behaviour Science, 31, Waltham Shape Guide for Dogs. (2009). Retrieved June 10, 2009, from Wang, Z., Zhou, Y. T., Kakuma, T., Lee, Y., Kalra, S. P., Kalra, P. S., Pan, W., et al. (2000). Leptin resistance of adipocytes in obesity: role of suppressors of cytokine signaling. Biochemical and Biophysical Research Communications, 277(1), Watson, T. D. G., Murphy, D., & Love, S. (1992). Equine hyperlipaemia in the United Kingdom: clinical features and blood biochemistry of 18 cases. Veterinary Record, 131, Webb, A. I., & Weaver, B. M. Q. (1979). Body Composition of the Horse. Equine Veterinary Journal, 11(1), Weeth, L. P., Fascetti, A. J., Kass, P. H., Suter, S. E., Santos, A. M., & Delaney, S. J. (2007). Prevalence of obese dogs in a population of dogs with cancer. Journal of the American Veterinary Medical Association, 230(8), White, G. A., Hobson-West, P., Cobb, K., Craigon, J., Hammond, R., & Millar, K. M. (2011). Canine obesity: is there a difference between veterinarian and owner perception? Journal of Small Animal Practice, 52(12), Wilkinson, M. J., & McEwan, N. A. (1991). Use of ultrasound in the measurement of subcutaneous fat and prediction of total body fat in dogs. Journal of Nutrition, 121(11 Suppl), S Willeberg, P., & Priester, W. A. (1976). Feline urological syndrome: associations with some time, space and individual patient factors. American Journal of Veterinary Research, 37, Wiseman-Orr, M. L., Nolan, A. M., Reid, J., & Scott, E. M. (2004). Development of a questionnaire to measure the effects of chronic pain on health-related quality of life in dogs. American Journal of Veterinary Research, 65(8), Withrow, S., & Vail, D. (2006). Withrow and MacEwen s Small Animal Oncology (4th ed.). Missouri; Saunders Wood, I. S., Wang, B., Lorente-Cebrián, S., & Trayhurn, P. (2007). Hypoxia increases expression of selective facilitative glucose transporters (GLUT) and 2-deoxy-D-glucose uptake in human adipocytes. Biochemical and Biophysical Research Communications, 361(2),
185 Wood, S. (2000) mgcv: Mixed GAM Computation Vehicle with GCV/AIC/REML smoothness estimation. Retrieved from Wren, J. A., Gossellin, J., & Sunderland, S. J. (2007). Dirlotapide: a review of its properties and role in the management of obesity in dogs. Journal of Veterinary Pharmacology and Therapeutics, 30 Suppl 1, Wyse, C. A., McNie, K. A., Tannahil, V. J., Murray, J. K., & Love, S. (2008). Prevalence of obesity in riding horses in Scotland. Veterinary Record, 162(18), Wyse, C. A., Selman, C., Page, M. M., Coogan, A. N., & Hazlerigg, D. G. (2011). Circadian desynchrony and metabolic dysfunction; did light pollution make us fat? Medical hypotheses, 77(6), Yaissle, J. E., Holloway, C., & Buffington, C. A. T. (2004). Evaluation of owner education as a component of obesity treatment programs for dogs. Journal of the American Veterinary Medical Association, 224(12), Yam, P. S., Penpraze, V., Young, D., Todd, M. S., Cloney, A. D., Houston-Callaghan, K. A., & Reilly, J. J. (2011). Validity, practical utility and reliability of Actigraph accelerometry for the measurement of habitual physical activity in dogs. Journal of Small Animal Practice, 52(2), Yeates, J. W., & Main, D. C. J. (2011). Veterinary surgeons opinions on dog welfare issues. Journal of Small Animal Practice, 52(9),
186 Appendices Appendix A: Canine Nutrition Questionnaire 168
187 169
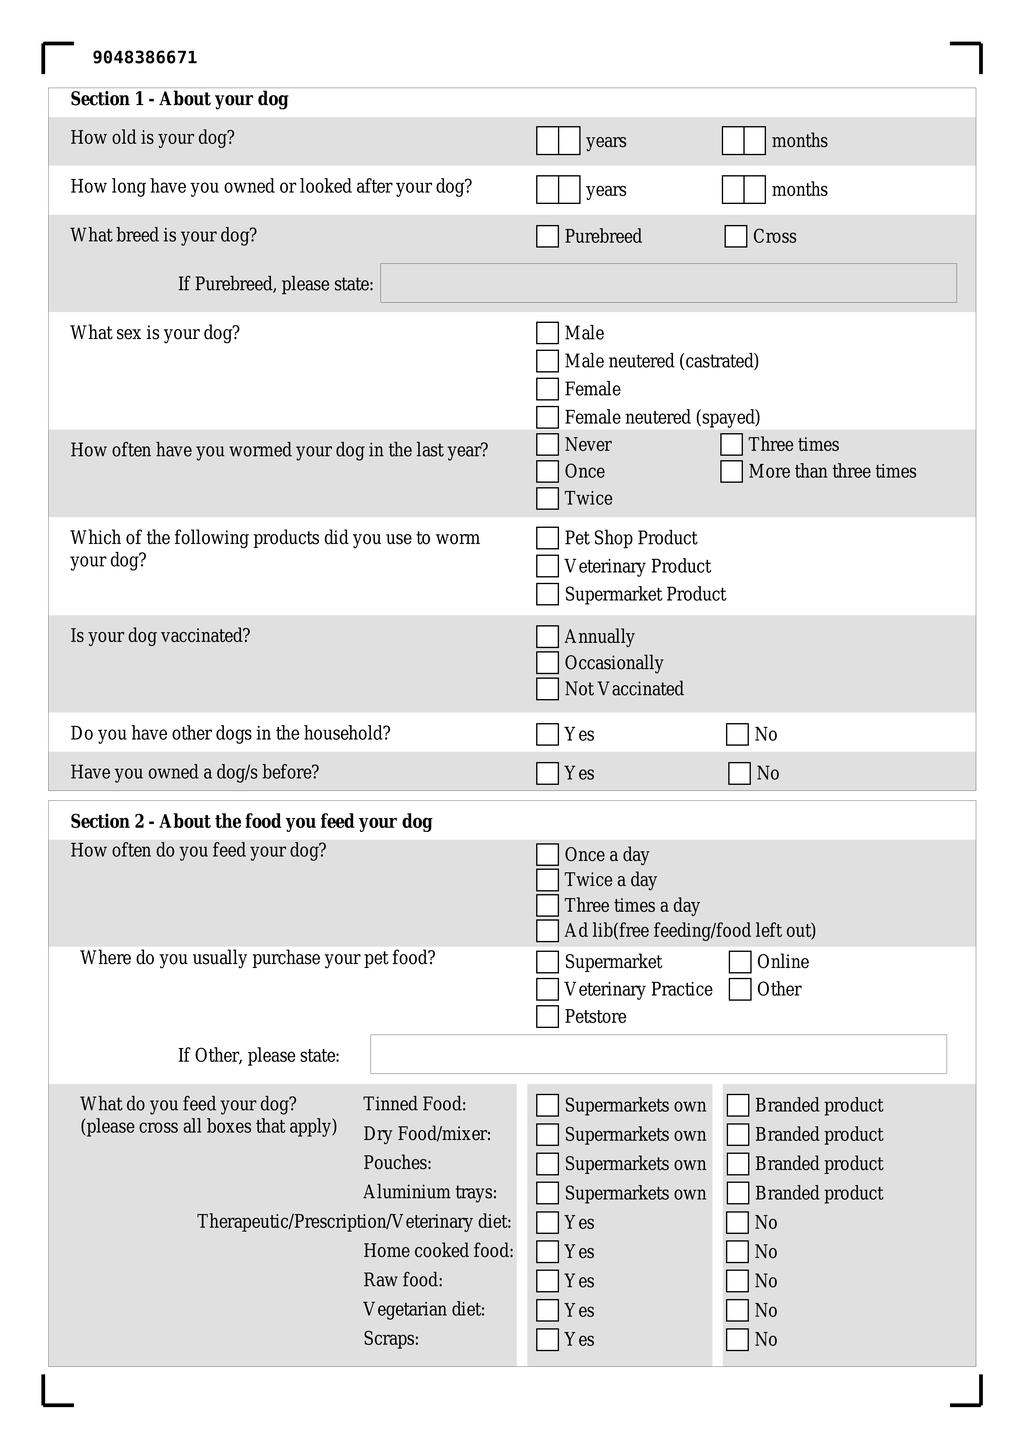
188 170
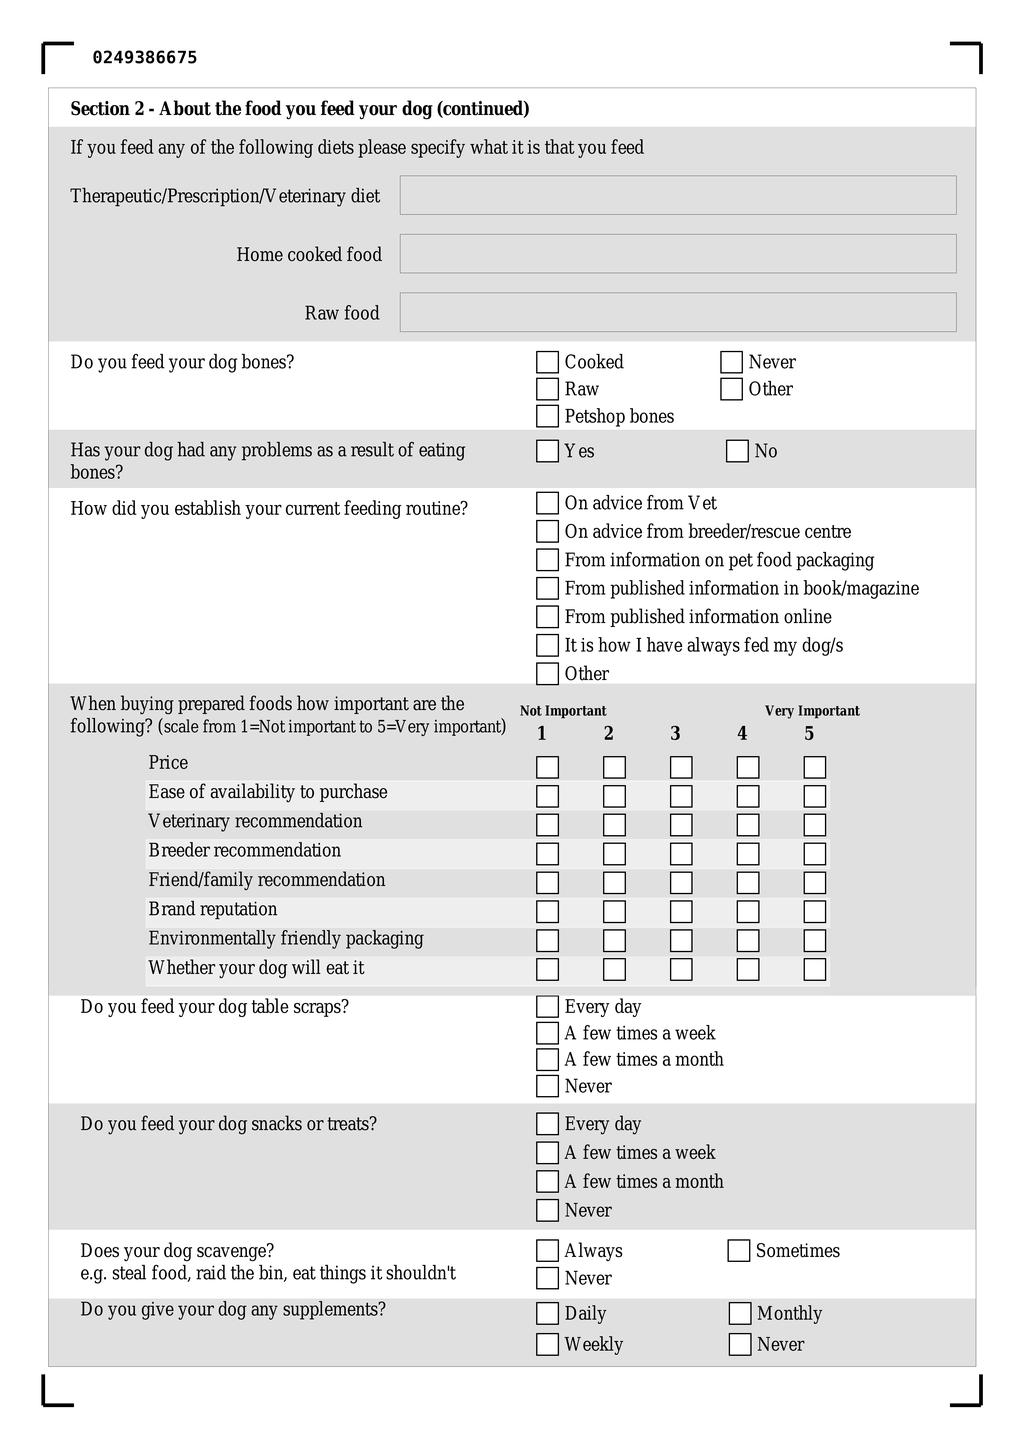
189 171
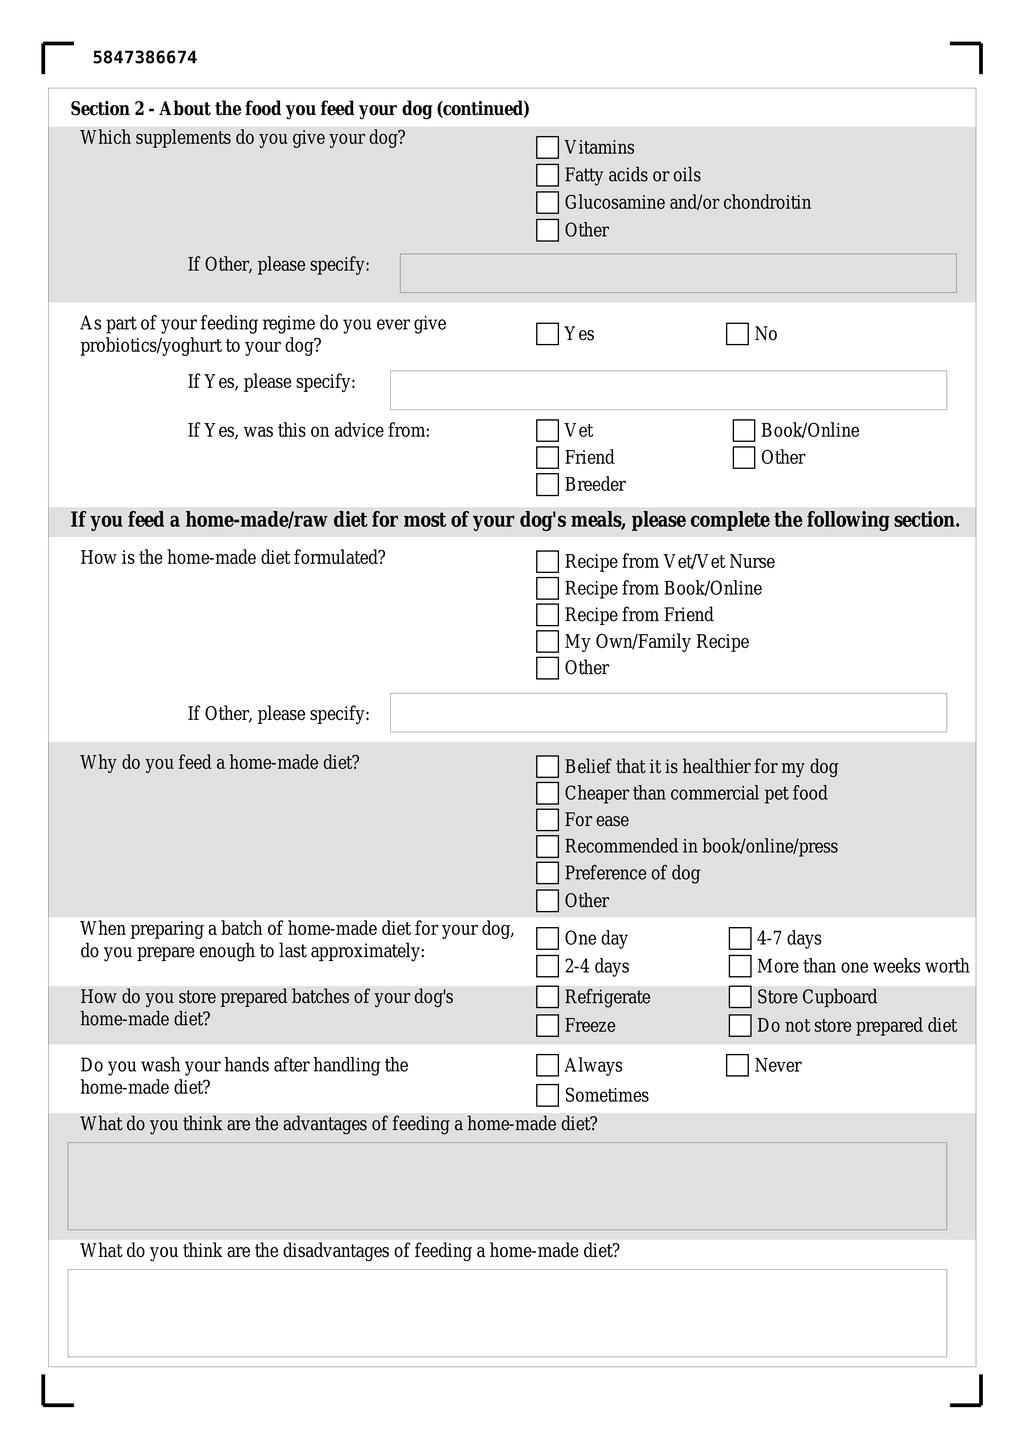
190 172
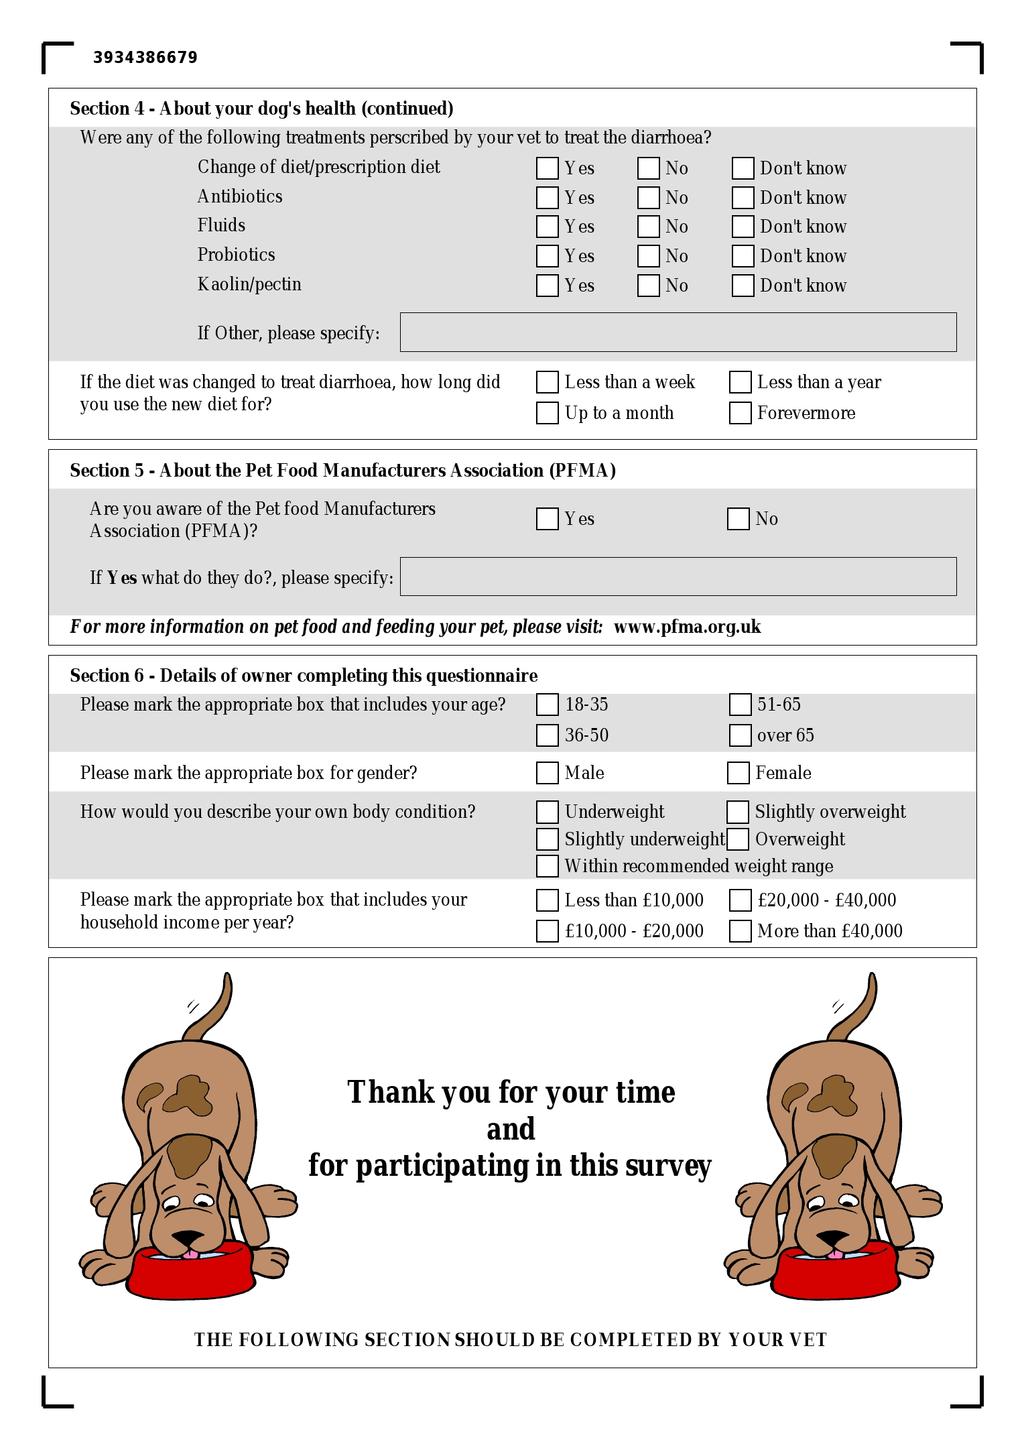
191 173
MANAGING NUTRITION AND ACTIVITY IN NEUTERED COMPANION ANIMALS
 Vet Times The website for the veterinary profession https://www.vettimes.co.uk MANAGING NUTRITION AND ACTIVITY IN NEUTERED COMPANION ANIMALS Author : TIM WATSON Categories : Vets Date : August 19, 2013
The Analysis of Computer Data regarding Obesity and Associated Diseases in Cats Examined at Private Veterinary Practices
 Acta Scientiae Veterinariae, 2017. 45: 1506. RESEARCH ARTICLE Pub. 1506 ISSN 1679-9216 The Analysis of Computer Data regarding Obesity and Associated s in Cats Examined at Private Veterinary Practices
SUPPORTED BY ROY AL CANIN TOP TIPS FOR MANAGING YOUR DOG S WEIGHT
 SUPPORTED BY ROY AL CANIN FOR MANAGING YOUR DOG S WEIGHT 63% 1 of pet owners believe their pet is a healthy weight. But the reality couldn t be further from the truth, with over 65% of dogs 2 considered
Building Rapid Interventions to reduce antimicrobial resistance and overprescribing of antibiotics (BRIT)
") Greater Manchester Connected Health City (GM CHC) Building Rapid Interventions to reduce antimicrobial resistance and overprescribing of antibiotics (BRIT) BRIT Dashboard Manual Users: General Practitioners
Greater Manchester Connected Health City (GM CHC) Building Rapid Interventions to reduce antimicrobial resistance and overprescribing of antibiotics (BRIT) BRIT Dashboard Manual Users: General Practitioners
Overweight dogs exercise less frequently and for shorter periods: results of a large online survey of dog owners from the United Kingdom
 1 2 3 4 5 6 7 8 9 10 11 12 13 14 15 16 17 18 19 20 21 22 23 24 25 26 27 28 29 30 31 32 33 Overweight dogs exercise less frequently and for shorter periods: results of a large online survey of dog owners
Understanding your cat s WEIGHT MANAGEMENT
 Understanding your cat s WEIGHT MANAGEMENT Why is weight management so important? What are the signs of weight gain? You might have been surprised when your veterinary surgeon told you that your cat is
About 1/3 of UK dogs are overweight that s over 2.5 million dogs! Being overweight is associated with: Orthopaedic disease. e.g.
 Principal Investigator: Eleanor Raffan MRCVS, Institute of Metabolic Science, University of Cambridge, CB2 0QQ. Tel: 01223 336792. Email: er311@cam.ac.uk This is an introductory guide to the GOdogs project.
Pathogenesis and treatment of feline lower urinary tract disease
 Vet Times The website for the veterinary profession https://www.vettimes.co.uk Pathogenesis and treatment of feline lower urinary tract disease Author : Sarah Caney Categories : RVNs Date : May 1, 2011
JOURNAL OF NUTRITIONAL SCIENCE
 JNS JOURNAL OF NUTRITIONAL SCIENCE WALTHAM SUPPLEMENT A moderate fat, low-energy dry expanded diet reduces gain in body condition score when fed as part of a post neutering weight-control regimen in growing
Summary Report of the Anatolian Shepherd Dog Health Survey. Data collected by ASDCA in partnership with OFA from December 1, 2009 to September 5, 2011
 Data collected by ASDCA in partnership with OFA from December 1, 2009 to September 5, 2011 Report Authors: Jessica Voss, DVM, MRCVS, ASDCA Health Coordinator Robert Owen, Ph.D. May 31, 2012 General Data:
Understanding your pet s LIVER CONDITION
 Understanding your pet s LIVER CONDITION Why is the liver so important? What causes liver disease in dogs and cats? The liver is one of the largest organs in your pet s body, and it s vital for their good
PetSavers. Caring for your Elderly Pet Guide
 PetSavers Caring for your Elderly Pet Guide Introduction As your pet gets older, changes occur in all major organ systems and diseases start to develop. Some age-related changes are quite obvious, such
STAT170 Exam Preparation Workshop Semester
 Study Information STAT Exam Preparation Workshop Semester Our sample is a randomly selected group of American adults. They were measured on a number of physical characteristics (some measurements were
Copyright is owned by the Author of the thesis. Permission is given for a copy to be downloaded by an individual for the purpose of research and
 Copyright is owned by the Author of the thesis. Permission is given for a copy to be downloaded by an individual for the purpose of research and private study only. The thesis may not be reproduced elsewhere
Neutering Your Dog or Bitch
 Neutering Your Dog or Bitch We would like to advise you that the information contained in this document has been obtained from several different sources and is intended for information purposes only. No
INTRODUCTION TO ANIMAL AND VETERINARY SCIENCE CURRICULUM. Unit 1: Animals in Society/Global Perspective
 Chariho Regional School District - Science Curriculum September, 2016 INTRODUCTION TO ANIMAL AND VETERINARY SCIENCE CURRICULUM Unit 1: Animals in Society/Global Perspective Students will gain an understanding
AUSTRALIAN AND NEW ZEALAND COLLEGE OF VETERINARY SCIENTISTS. Sample Exam Questions. Veterinary Practice (Small Animal)
") AUSTRALIAN AND NEW ZEALAND COLLEGE OF VETERINARY SCIENTISTS Sample Exam Questions Veterinary Practice (Small Animal) Written Examination (Component 1) Written Paper 1 (two hours): Principles of Veterinary
AUSTRALIAN AND NEW ZEALAND COLLEGE OF VETERINARY SCIENTISTS Sample Exam Questions Veterinary Practice (Small Animal) Written Examination (Component 1) Written Paper 1 (two hours): Principles of Veterinary
Medical Conditions Questionnaire
 Medical Conditions Questionnaire (to be completed by the member) Member Full Name.Date of birth. Policy number or scheme name. Please complete the appropriate section(s) only after completing the Member
Københavns Universitet. Companion animal ethics Sandøe, Peter; Corr, Sandra; Palmer, Clare. Published in: Luentokokoelma Publication date: 2013
 university of copenhagen Københavns Universitet Companion animal ethics Sandøe, Peter; Corr, Sandra; Palmer, Clare Published in: Luentokokoelma 2013 Publication date: 2013 Citation for published version
Senior Pet Care and Early Disease Detection
 Senior Pet Care and Early Disease Detection Thanks to advances in veterinary medicine, pets are living longer than ever before. However, with this increased lifespan comes an increase in the types of ailments
Restore life and vitality in your dog. Feel the same results as an owner.
 Restore life and vitality in your dog. Feel the same results as an owner. Your dog, Cushing s syndrome and you This booklet has been designed to help answer questions that you may have about Cushing s
How Does Photostimulation Age Alter the Interaction Between Body Size and a Bonus Feeding Program During Sexual Maturation?
 16 How Does Photostimulation Age Alter the Interaction Between Body Size and a Bonus Feeding Program During Sexual Maturation? R A Renema*, F E Robinson*, and J A Proudman** *Alberta Poultry Research Centre,
Restore life and vitality in your dog. Feel the same results as an owner.
 Restore life and vitality in your dog. Feel the same results as an owner. Your dog, Cushing s syndrome and you This booklet has been designed to help answer questions that you may have about Cushing s
Economic Review of Transition Cow Management
 Economic Review of Transition Cow Management John Fetrow VMD, MBA, DSc (hon) Emeritus Professor of Dairy Production Medicine College of Veterinary Medicine University of Minnesota This presentation is
BSc, PhD, MBA, LLM, MSc (Med Sci), DAgVetPharm, FRPharmS, FCPP, FIPharmM, MPS (NZ), FNZCP, FFHom
, DAgVetPharm, FRPharmS, FCPP, FIPharmM, MPS (NZ), FNZCP, FFHom") Veterinary Pharmacy Edited by Steven B Kayne BSc, PhD, MBA, LLM, MSc (Med Sci), DAgVetPharm, FRPharmS, FCPP, FIPharmM, MPS (NZ), FNZCP, FFHom Independent Consultant Pharmacist and Visiting Lecturer, School
Veterinary Pharmacy Edited by Steven B Kayne BSc, PhD, MBA, LLM, MSc (Med Sci), DAgVetPharm, FRPharmS, FCPP, FIPharmM, MPS (NZ), FNZCP, FFHom Independent Consultant Pharmacist and Visiting Lecturer, School
Introduction. Primary objective. To Spay or Not to Spay That is the question. If to Spay When to spay. Do we know the answers?
 The Optimal Time for Spay / Neuter: An Analysis of Critical Spay Neuter Literature Phil Bushby, DVM, MS, ACVS Professor Emeritus Marcia Lane Endowed Chair of Humane Ethics and Animal Welfare College of
The complete guide to. Puppy Growth Charts. Puppy Growth Chart. Puppy Growth Chart. Dog s Name: Dog s Name: D.O.B. Dog s Name: Neuter Date:
 The complete guide to s 9 8.-9kg 99. th Centile. th Centile. th Centile. th Centile. nd Centile. th Centile WPGC - What are the WALTHAM s? WALTHAM s are a user-friendly clinical tool designed for veterinary
Correlation of. Animal Science Biology & Technology, 3/E, by Dr. Robert Mikesell/ MeeCee Baker, 2011, ISBN 10: ; ISBN 13:
 Correlation of Animal Science Biology & Technology, 3/E, by Dr. Robert Mikesell/ MeeCee Baker, 2011, ISBN 10: 1435486374; ISBN 13: 9781435486379 to Indiana s Agricultural Education Curriculum Standards
Companion Animal Management Student Activities
 Module 14 Companion Animal Management Questions 1. Humans keep companion, or pet animals, for social contact and pleasure. Identify and describe three of the most prevalent welfare problems that you will
ANNUAL STATISTICAL REPORT FOR ANIMALS USED IN IRELAND UNDER SCIENTIFIC ANIMAL PROTECTION LEGISLATION
 ANNUAL STATISTICAL REPORT FOR ANIMALS USED IN IRELAND UNDER SCIENTIFIC ANIMAL PROTECTION LEGISLATION 2015 CONTENTS 1. Introduction 2. Summary 3. Results 3.1 Species and numbers of naïve animals used in
Outline Animal Welfare Series Caring for the Senior Pet
 Outline Animal Welfare Series Caring for the Senior Pet Joshua Steinhaus Christie Wong Veterinary Specialty Hospital (VSH)- Hong Kong What is an older patient? Defining Age Defining Geriatric Medicine
Section A. Answer all questions. Answer each question in the space provided for that question. Use 90 and Over on page 2 of the Data Sheet.
 Section A 1 Answer all questions. Answer each question in the space provided for that question. Use 90 and Over on page 2 of the Data Sheet. (i) Calculate the percentage increase in the number of people
Report from the Kennel Club/ British Small Animal Veterinary Association Scientific Committee
 Report from the Kennel Club/ British Small Animal Veterinary Association Scientific Committee Summary results of the Purebred Dog Health Survey for Border Collies Warning: The results of this survey and
A-l. Students shall examine the circulatory and respiratory systems of animals.
 Animal Science A-l. Students shall examine the circulatory and respiratory systems of animals. 1. Discuss the pathway of blood through the heart and circulatory system. 2. Describe and compare the functions
Gastric Dilatation-Volvulus
 Gastric Dilatation-Volvulus The term "ACVS Diplomate" refers to a veterinarian who has been board certified in veterinary surgery. Only veterinarians who have successfully completed the certification requirements
Pilot study to identify risk factors for coprophagic behaviour in dogs
 Pilot study to identify risk factors for coprophagic behaviour in dogs Joanne A.M. van der Borg and Lisette Graat Wageningen University Introduction According to several training centres of guide dogs
Eliminate Pre-sterilization Litters by Spaying Before the First Estrus: Making the Case to your Veterinarian. Richard Speck, DVM
 Eliminate Pre-sterilization Litters by Spaying Before the First Estrus: Making the Case to your Veterinarian. Richard Speck, DVM Position Statements AVMA: The AVMA supports the concept of pediatric spay/neuter
University of Canberra. This thesis is available in print format from the University of Canberra Library.
 University of Canberra This thesis is available in print format from the University of Canberra Library. If you are the author of this thesis and wish to have the whole thesis loaded here, please contact
Dominance/Suppression Competitive Relationships in Loblolly Pine (Pinus taeda L.) Plantations
 Plantations") Dominance/Suppression Competitive Relationships in Loblolly Pine (Pinus taeda L.) Plantations by Michael E. Dyer Dissertation submitted to the Faculty of the Virginia Polytechnic Institute and Stand University
Dominance/Suppression Competitive Relationships in Loblolly Pine (Pinus taeda L.) Plantations by Michael E. Dyer Dissertation submitted to the Faculty of the Virginia Polytechnic Institute and Stand University
Understanding your cat s URINARY CONDITION
 Understanding your cat s URINARY CONDITION Understanding your cat's urinary condition. Common urinary crystals in cats. Finding out that your cat is suffering from a urinary condition can be very distressing,
ASSESSMENT Theory and knowledge are tested through assignments and examinations.
 Level 2 Diploma for Veterinary Nursing Assistants 600/9504/0 QUALIFICATION PURPOSE The Veterinary Nursing Assistant qualification aims to prepare and support students for a career as a veterinary nursing
Christie Ward - The Question of Cushings
 Many horse people are familiar with the classical symptom of advanced Cushing's disease in horses: a shaggy coat that refuses to shed out in the spring. But did you know that this hormonal disease can
A flexible, reversible alternative to surgical castration
 Vet Times The website for the veterinary profession https://www.vettimes.co.uk A flexible, reversible alternative to surgical castration Author : Virbac Categories : Canine, Companion animal, General,
Course Curriculum for Master Degree in Internal Medicine/ Faculty of Veterinary Medicine
 Course Curriculum for Master Degree in Internal Medicine/ Faculty of Veterinary Medicine The Master Degree in Internal Medicine/Faculty of Veterinary Medicine is awarded by the Faculty of Graduate Studies
Is Robenacoxib Superior to Meloxicam in Improving Patient Comfort in Dog Diagnosed With a Degenerative Joint Process?
 Is Robenacoxib Superior to Meloxicam in Improving Patient Comfort in Dog Diagnosed With a Degenerative Joint Process? A Knowledge Summary by Adam Swallow BVSc MRCVS 1* 1 University of Bristol * Corresponding
Samoyed Pedigree Breed Health Survey
 Samoyed Pedigree Breed Health Survey Forms were received representing 100 living dogs & 22 deceased dogs. Mortality results A total of 22 deaths were reported, representing 0.39% of all deaths reported
Senior Pet Care (FAQ)
") 1 of 7 8/4/2014 10:15 AM Senior Pet Care (FAQ) February 2009 Due to improved veterinary care and dietary habits, pets are living longer now than they ever have before. One consequence of this is that pets,
1 of 7 8/4/2014 10:15 AM Senior Pet Care (FAQ) February 2009 Due to improved veterinary care and dietary habits, pets are living longer now than they ever have before. One consequence of this is that pets,
EFFECTS OF SEASON AND RESTRICTED FEEDING DURING REARING AND LAYING ON PRODUCTIVE AND REPRODUCTIVE PERFORMANCE OF KOEKOEK CHICKENS IN LESOTHO
 EFFECTS OF SEASON AND RESTRICTED FEEDING DURING REARING AND LAYING ON PRODUCTIVE AND REPRODUCTIVE PERFORMANCE OF KOEKOEK CHICKENS IN LESOTHO By SETSUMI MOTŠOENE MOLAPO MSc (Animal Science) NUL Thesis submitted
DOG & CAT CARE & NUTRITION KNOWLEDGE AND RESPECT DOG AND CAT FIRST
 DOG & CAT CARE & NUTRITION KNOWLEDGE AND RESPECT DOG AND CAT FIRST Factors which determine palatability: SMELL 10 million Olfactory receptors (millions) Smell is dominant Factors which determine palatability:
Report from the Kennel Club/ British Small Animal Veterinary Association Scientific Committee
 Report from the Kennel Club/ British Small Animal Veterinary Association Scientific Committee Summary results of the Purebred Dog Health Survey for Welsh Springer Spaniels Warning: The results of this
Course Curriculum for Master Degree Theriogenology & Artificial Insemination/Faculty of Veterinary Medicine
 Course Curriculum for Master Degree Theriogenology & Artificial Insemination/Faculty of Veterinary Medicine The Master Degree in Theriogenology & Artificial Insemination /Faculty of Veterinary Medicine
Eliminate Pre-sterilization Litters by Spaying Before the First Estrus: Making the Case to your Veterinarian. Richard Speck, DVM
 Eliminate Pre-sterilization Litters by Spaying Before the First Estrus: Making the Case to your Veterinarian. Richard Speck, DVM AVMA: The AVMA supports the concept of pediatric spay/neuter in dogs and
Transition cows have decreased immune function. The transition period. Inflammation, Immune Function, and the Transition Cow.
 Overview Inflammation, Immune Function, and the Transition Cow Barry Bradford Kansas State University Herd Health & Nutrition Conferences April 2016 Immunity and inflammation in the transition cow Long
SCIENTIFIC REPORT. Analysis of the baseline survey on the prevalence of Salmonella in turkey flocks, in the EU,
 The EFSA Journal / EFSA Scientific Report (28) 198, 1-224 SCIENTIFIC REPORT Analysis of the baseline survey on the prevalence of Salmonella in turkey flocks, in the EU, 26-27 Part B: factors related to
BEHAVIOUR OF THE DOMESTIC DOG (Canis familiaris)
") THE INFLUENCE OF CEREBRAL LATERALISATION ON THE BEHAVIOUR OF THE DOMESTIC DOG (Canis familiaris) A thesis submitted for the Degree of DOCTOR OF PHILOSOPHY by Luke Aaron Schneider B. A. (Hons) School of
THE INFLUENCE OF CEREBRAL LATERALISATION ON THE BEHAVIOUR OF THE DOMESTIC DOG (Canis familiaris) A thesis submitted for the Degree of DOCTOR OF PHILOSOPHY by Luke Aaron Schneider B. A. (Hons) School of
BODY CONDITION SCORING IN CHEETAH (ACINONYX JUBATUS): ADVANCEMENTS IN METHODOLOGY AND VISUAL TOOLS FOR ASSESSMENT
: ADVANCEMENTS IN METHODOLOGY AND VISUAL TOOLS FOR ASSESSMENT") BODY CONDITION SCORING IN CHEETAH (ACINONYX JUBATUS): ADVANCEMENTS IN METHODOLOGY AND VISUAL TOOLS FOR ASSESSMENT Adam Reppert, MS, RD,* Kibby Treiber, PhD and Ann Ward, MS Department of Nutritional Services,
BODY CONDITION SCORING IN CHEETAH (ACINONYX JUBATUS): ADVANCEMENTS IN METHODOLOGY AND VISUAL TOOLS FOR ASSESSMENT Adam Reppert, MS, RD,* Kibby Treiber, PhD and Ann Ward, MS Department of Nutritional Services,
Q: When does a pet become "old"? A: It varies, but cats and small dogs are generally considered geriatric at the age of 7. Larger breed dogs tend to
 Due to improved veterinary care and dietary habits, pets are living longer now than they ever have before. One consequence of this is that pets, along with their owners and veterinarians, are faced with
SHEEP SIRE REFERENCING SCHEMES - NEW OPPORTUNITIES FOR PEDIGREE BREEDERS AND LAMB PRODUCERS a. G. Simm and N.R. Wray
 SHEEP SIRE REFERENCING SCHEMES - NEW OPPORTUNITIES FOR PEDIGREE BREEDERS AND LAMB PRODUCERS a G. Simm and N.R. Wray The Scottish Agricultural College Edinburgh, Scotland Summary Sire referencing schemes
Nestlé PURINA Scientific Update on Feline Nutrition. Urolithiasis in cats managing the risks
 Nestlé PURINA Scientific Update on Feline Nutrition Urolithiasis in cats managing the risks Urolithiasis in cats managing the risks Dr Andrew H Sparkes BVetMed PhD DipECVIM MRCVS Veterinary consultant
JMSCR Vol 05 Issue 03 Page March 2017
 www.jmscr.igmpublication.org Impact Factor 5.84 Index Copernicus Value: 83.27 ISSN (e)-2347-176x ISSN (p) 2455-0450 DOI: https://dx.doi.org/10.18535/jmscr/v5i3.219 Comparative Study of Adverse Effect of
FEEDING EWES BETTER FOR INCREASED PRODUCTION AND PROFIT. Dr. Dan Morrical Department of Animal Science Iowa State University, Ames, Iowa
 FEEDING EWES BETTER FOR INCREASED PRODUCTION AND PROFIT Dr. Dan Morrical Department of Animal Science Iowa State University, Ames, Iowa Introduction Sheep nutrition and feeding is extremely critical to
Report from the Kennel Club/ British Small Animal Veterinary Association Scientific Committee
 Report from the Kennel Club/ British Small Animal Veterinary Association Scientific Committee Summary results of the Purebred Dog Health Survey for the Saluki breed Warning: The results of this survey
Acutely Restricting Nutrition Causes Anovulation and Alters Endocrine Function in Beef Heifers
 Acutely Restricting Nutrition Causes Anovulation and Alters Endocrine Function in Beef Heifers F.J. White, L.N. Floyd, C.A. Lents, N.H. Ciccioli, L.J. Spicer, and R.P. Wettemann Story in Brief The effects
Feline lower urinary tract disease (FLUTD)
") Feline lower urinary tract disease (FLUTD) Feline lower urinary tract disease (FLUTD) is not a specific disease, but rather is the term used to describe conditions that can affect the urinary bladder and/or
Feline lower urinary tract disease (FLUTD) Feline lower urinary tract disease (FLUTD) is not a specific disease, but rather is the term used to describe conditions that can affect the urinary bladder and/or
Australian and New Zealand College of Veterinary Scientists. Membership Examination. Veterinary Epidemiology Paper 1
 Australian and New Zealand College of Veterinary Scientists Membership Examination June 2015 Veterinary Epidemiology Paper 1 Perusal time: Fifteen (15) minutes Time allowed: Two (2) hours after perusal
General Practice Service Willows Information Sheets. Cat nutrition
 General Practice Service Willows Information Sheets Cat nutrition Cat nutrition What is special about cat nutrition? As a balanced diet plays a vital role in maintaining your cat s health and vitality,
TECHNICAL BULLETIN Claude Toudic Broiler Specialist June 2006
 Evaluating uniformity in broilers factors affecting variation During a technical visit to a broiler farm the topic of uniformity is generally assessed visually and subjectively, as to do the job properly
DAIRY HERD HEALTH IN PRACTICE
 Vet Times The website for the veterinary profession https://www.vettimes.co.uk DAIRY HERD HEALTH IN PRACTICE Author : James Breen, Peter Down, Chris Hudson, Jon Huxley, Oli Maxwell, John Remnant Categories
Estimating the Cost of Disease in The Vital 90 TM Days
 Estimating the Cost of Disease in The Vital 90 TM Days KDDC Young Dairy Producers Meeting Bowling Green, KY February 21, 2017 Michael Overton, DVM, MPVM Elanco Knowledge Solutions Dairy moverton@elanco.com
Study population The target population for the model were hospitalised patients with cellulitis.
 Comparison of linezolid with oxacillin or vancomycin in the empiric treatment of cellulitis in US hospitals Vinken A G, Li J Z, Balan D A, Rittenhouse B E, Willke R J, Goodman C Record Status This is a
ADOPTING A SENIOR PET PLACING (REHOMING) A SENIOR PET SENIOR PET CARE. Animal Resource Center
 A SENIOR PET SENIOR PET CARE. Animal Resource Center") ADOPTING A SENIOR PET There are a lot of benefits to choosing an older pet: What you see is what you get - You don't have to guess how big they re going to get or what their personality will be like when
ADOPTING A SENIOR PET There are a lot of benefits to choosing an older pet: What you see is what you get - You don't have to guess how big they re going to get or what their personality will be like when
Report from the Kennel Club/ British Small Animal Veterinary Association Scientific Committee
 Report from the Kennel Club/ British Small Animal Veterinary Association Scientific Committee Summary results of the Purebred Dog Health Survey for American Cocker Spaniels Warning: The results of this
American Association of Feline Practitioners American Animal Hospital Association
 American Association of Feline Practitioners American Animal Hospital Association Basic Guidelines of Judicious Therapeutic Use of Antimicrobials August 1, 2006 Introduction The Basic Guidelines to Judicious
Report from the Kennel Club/ British Small Animal Veterinary Association Scientific Committee
 Report from the Kennel Club/ British Small Animal Veterinary Association Scientific Committee Summary results of the Purebred Dog Health Survey for Dobermanns Warning: The results of this survey and particularly
Managing winter illnesses without antibiotics
 CLINICAL AUDIT Managing winter illnesses without antibiotics Valid to June 2023 bpac nz better medicin e Background Over the winter months, thousands of people across New Zealand will present to primary
Higher National Unit specification: general information. Veterinary Nursing: Companion Animal Health and Welfare
 Higher National Unit specification: general information Unit code: H0YB 34 Superclass: SP Publication date: March 2012 Source: Scottish Qualifications Authority Version: 01 Unit purpose This Unit is designed
My cat has kidney problems and food hypersensitivity what do I do now?
 TROVET Renal (Venison), complete, easily digestible, hypoallergenic dietary food for adult cats with an impaired kidney function My cat has kidney problems and food hypersensitivity what do I do now? reliable
Feline Wellness Report
 Demo/Sample Clinic Feline Wellness Report 59 YOUR CAT'S AGE, IN HUMAN YEARS: Environment, genetics, nutrition and size are factors in determining a cat's age. Although this calculation is not exact, it
Overweight in dogs, but not in cats, is related to overweight in their owners
 Public Health Nutrition: 13(1), 102 106 doi:10.1017/s136898000999022x Overweight in dogs, but not in cats, is related to overweight in their owners Marieke L Nijland 1, Frank Stam 2 and Jacob C Seidell
Research Article Body Condition Scores and Evaluation of Feeding Habits of Dogs and Cats at a Low Cost Veterinary Clinic and a General Practice
 e Scientific World Journal Volume 2016, Article ID 1901679, 7 pages http://dx.doi.org/10.1155/2016/1901679 Research Article Body Condition Scores and Evaluation of Feeding Habits of Dogs and Cats at a
Australian and New Zealand College of Veterinary Scientists. Fellowship Examination. Small Animal Surgery Paper 1
 Australian and New Zealand College of Veterinary Scientists Fellowship Examination June 2016 Small Animal Surgery Paper 1 Perusal time: Twenty (20) minutes Time allowed: Three (3) hours after perusal Answer
Estimation of maintenance energy requirements in German shepherd and Labrador retriever dogs in Bangalore, India
 Received: 21 July 2016 Accepted: 10 February 2017 DOI: 10.1111/jpn.12709 ORIGINAL ARTICLE Estimation of maintenance energy requirements in German shepherd and Labrador retriever dogs in Bangalore, India
Spanish Water Dog Club. Annual Health Report 2017
 Spanish Water Dog Club Annual Health Report 2017 Content Questions following 2017 - Health Seminar Health Report 2017 (highlights) Introduction CHG and NAD Eye Testing / Gonioscopy (update) Free Resources
Copyright is owned by the Author of the thesis. Permission is given for a copy to be downloaded by an individual for the purpose of research and
 Copyright is owned by the Author of the thesis. Permission is given for a copy to be downloaded by an individual for the purpose of research and private study only. The thesis may not be reproduced elsewhere
Large Breed Puppies:...What is an appropriate Diet?...
 Large Breed Puppies:...What is an appropriate Diet?... by Chick Newman,PhD,DVM 1 Newman Veterinary Medical Services There is considerable controversy regarding the role of nutrition during the developmental
Report from the Kennel Club/ British Small Animal Veterinary Association Scientific Committee
 Report from the Kennel Club/ British Small Animal Veterinary Association Scientific Committee Summary results of the Purebred Dog Health Survey for the Newfoundland breed Warning: The results of this survey
BVetMed Programme Specification Applies to Cohort Commencing 2018
 BVetMed Programme Specification Applies to Cohort Commencing 2018 1. Awarding institution Royal Veterinary College 2. Teaching institution Royal Veterinary College 3. Programme accredited by Royal College
Female Persistency Post-Peak - Managing Fertility and Production
 May 2013 Female Persistency Post-Peak - Managing Fertility and Production Michael Longley, Global Technical Transfer Manager Summary Introduction Chick numbers are most often reduced during the period
Copyright is owned by the Author of the thesis. Permission is given for a copy to be downloaded by an individual for the purpose of research and
 Copyright is owned by the Author of the thesis. Permission is given for a copy to be downloaded by an individual for the purpose of research and private study only. The thesis may not be reproduced elsewhere
Feline Idiopathic Cystitis (icatcare)
") Kingsbrook Animal Hospital 5322 New Design Road, Frederick, MD, 21703 Phone: (301) 631-6900 Website: KingsbrookVet.com Feline idiopathic cystitis (FIC) [1] Feline Idiopathic Cystitis (icatcare) Feline
Kingsbrook Animal Hospital 5322 New Design Road, Frederick, MD, 21703 Phone: (301) 631-6900 Website: KingsbrookVet.com Feline idiopathic cystitis (FIC) [1] Feline Idiopathic Cystitis (icatcare) Feline
Synopsis. Takeda Pharmaceutical Company Limited Name of the finished product UNISIA Combination Tablets LD, UNISIA Combination Tablets
 Synopsis Name of the sponsor Takeda Pharmaceutical Company Limited Name of the finished product UNISIA Combination Tablets LD, UNISIA Combination Tablets Name of active ingredient Title of the study Study
Tibetan Terrier Pedigree Breed Health Survey
 Tibetan Terrier Pedigree Breed Health Survey Forms were received representing 402 living dogs & 29 deceased dogs. Mortality results A total of 29 deaths were reported, representing 0.52% of all deaths
Australian and New Zealand College of Veterinary Scientists. Membership Examination. Veterinary Epidemiology Paper 1
 Australian and New Zealand College of Veterinary Scientists Membership Examination June 2016 Veterinary Epidemiology Paper 1 Perusal time: Fifteen (15) minutes Time allowed: Two (2) hours after perusal
Indicated for the treatment of pruritus associated with allergic dermatitis and the clinical manifestations of atopic dermatitis in dogs.
 Zoetis UK Limited Telephone: 0845 300 8034 Website: www.zoetis.co.uk Email: customersupportuk@zoetis.com Apoquel film-coated for dogs Species: Therapeutic indication: Active ingredient: Product: Product
Jefferson County High School Course Syllabus
 A. Course Large Animal Science B. Department CTE- Agriculture C. Course Description Jefferson County High School Course Syllabus Large Animal Science is an applied course in veterinary and animal science
Report from the Kennel Club/ British Small Animal Veterinary Association Scientific Committee
 Report from the Kennel Club/ British Small Animal Veterinary Association Scientific Committee Summary results of the Purebred Dog Health Survey for Soft Coated Wheaten Terriers Warning: The results of
Feline Lower Urinary Tract Disease FLUTD
 Feline Lower Urinary Tract Disease FLUTD What is Feline Lower Urinary Tract Disease? Feline lower urinary tract disease (FLUTD) describes a collection of conditions in cats that can affect the bladder
Report from the Kennel Club/ British Small Animal Veterinary Association Scientific Committee
 Report from the Kennel Club/ British Small Animal Veterinary Association Scientific Committee Summary results of the Purebred Dog Health Survey for Dachshunds Warning: The results of this survey and particularly
Course Curriculum for Master Degree in Poultry Diseases/Veterinary Medicine
 Course Curriculum for Master Degree in Poultry Diseases/Veterinary Medicine The Master Degree in Poultry Diseases /Veterinary Medicine, is awarded by the Faculty of Graduate Studies at Jordan University
FACULTY OF VETERINARY MEDICINE
 FACULTY OF VETERINARY MEDICINE DEPARTMENT OF VETERINARY PARASITOLOGY AND ENTOMOLOGY M.Sc. AND Ph.D. DEGREE PROGRAMMES The postgraduate programmes of the Department of Veterinary Parasitology and Entomology