SCIENCE AND RESEARCH INTERNAL REPORT NO.58 YELLOW-EYED PENGUIN ON CAMPBELL ISLAND. Peter J. Moore and Roger D. Moffat
|
|
|
- Myles Paul
- 6 years ago
- Views:
Transcription
1 SCIENCE AND RESEARCH INTERNAL REPORT NO.58 YELLOW-EYED PENGUIN ON CAMPBELL ISLAND by Peter J. Moore and Roger D. Moffat This is an internal Department of Conservation report and must be cited as Science and Research Internal Report No.58. Permission or use of any of its contents must be obtained from the Director (Science & Research), Head Office, Department of Conservation. Head Office, Department of Conservation, P.O. Box Wellington, New Zealand March 1990 ISSN ISBN
2 CONTENTS SUMMARY 1 1. INTRODUCTION The species Research Distribution and population The need for information Aims of study Structure of report 5 2. POPULATION Background Aims Methods Census Counts at major landing sites Counts at Middle Bay study area Results Population size of yellow-eyed penguin in winter Distribution Numbers of penguins at Northwest Bay and Southeast Harbour Numbers of penguins at Middle Bay Daily movements at the landing site Numbers of Breeding Birds Discussion 3. BREEDING BIOLOGY Background Aims Methods Results Nesting habitat Breeding success Adult Discussion SIZE AND GROWTH Background Aims Methods Adult measurements Egg measurements Chick growth Results Adult Size Egg Size Chick Growth Discussion 60
3 5. CONCLUSIONS RECOMMENDATIONS 65 ACKNOWLEDGEMENTS 65 REFERENCES 66 APPENDICES 69
4 YELLOW-EYED PENGUIN ON CAMPBELL ISLAND by Peter J. Moore 1 and Roger D. Moffat 2 1 Science & Research Division, Department of Conservation, PO Box , Wellington. 2 2/40 Lancewood Drive, Christchurch 3. SUMMARY 1. The population of the yellow-eyed penguin (Megadyptes antipodes) on Campbell Island in was estimated as ( breeding pairs). This represents 35% of the estimated total population of birds. With the continuing decline of the species on the South Island, Campbell Island is probably now the most populous locality. However, more accurate population estimates are required for the Auckland and Stewart Island groups. 2. The main centres of population were Northwest Bay (448), Northeast Harbour Perseverance Harbour (261) and Southeast Harbour (260), which together comprised 79% of the penguins counted. 3. A total of 172 landing sites were found, with a mean count of 9.4 birds per site (range 1-143). Sixty-one percent of landing sites were at shingle / small boulder beaches and 39% were on rocky shores. 4. The highest counts of penguins at landing sites were in February (late in the chick rearing period) and May (post-moult). The proportion of breeding birds at the Middle Bay study area was 70-80%. During any individual count in winter approximately 80% of birds were seen because the remainder stayed ashore. 5. Daily movements of penguins related to the time of sunrise and sunset. In winter they departed for sea over a short period at dawn and returned at dusk. The movements were more spread out during the day in the breeding season because penguins took turns with their partners to go to sea, or they took two trips to sea, depending on the stage of the breeding cycle. 6. Nests were isolated and scattered amongst the coastal scrub-shrubland associations, dominated by Dracophyllum. The density of nests was approximately 1.5 pairs/ha in penguin habitat (3.8 in Northwest Bay), or 44 birds per accessible kilometre of coastline. Most nests were within 500m of the shore. At Middle Bay the mean distance from the sea was 236m (82-433m) and the mean inter-nest distance was 22m (5-49m). 7. Mean hatching date was 26 November, approximately one or two weeks later than the South Island. Chicks fledged on average 108 days after hatching. Mean departure date was 13 March. 1
5 8. Breeding pairs were very successful: 83% of eggs hatched and 70% fledged chicks; 76% of nests produced chicks, at an average of 1.4 chicks per nest; 85% of chicks fledged. Chicks that died did so at the beginning or end of the chick rearing period. This level of breeding success is comparable to mainland figures in good seasons, or in areas where predation is low. The success is higher than other penguin species which lay two eggs. 9. In February 141 chicks were banded and 12 were re-sighted as juveniles at landing sites during the year. 10. An estimate of adult survival at Middle Bay during the 12 month study was 74-85%. It may have been even lower because of the local effects of a predatory Hooker's sea lion (Neophoca hookeri). Predation by sea lions is apparently rare. 11. Ticks (Ixodes uriae) were found on adults and chicks. 12. The size of yellow-eyed penguins was similar to figures from one mainland study. The mean length of the adult head was 138.9mm and the foot (to the mid-toe pad) was 126.5mm. 13. Chicks grew at a similar rate to those on the mainland. The fledging weight of was 800g less than the mainland average but was within the normal range of annual variation. The foot was the first dimension to reach asymptotal length, after only 35 days of age. Other dimensions, such as head and bill lengths did not begin to level off in growth until after 85 days. 14. It is recommended that the Campbell Island population be monitored regularly to determine future changes. Censuses should be conducted on the Auckland and Stewart Island groups. 2
6 CHAPTER 1. INTRODUCTION The yellow-eyed penguin (Megadyptes antipodes), or hoiho, is one of the rarest of the world's 17 species of penguin. It is endemic to the southern New Zealand region, with an estimated population of about 5000 birds. 1.1 THE SPECIES The yellow-eyed penguin has been described as the most generalised penguin species (Muller-Schwarze 1984). It is the only member of the genus Megadyptes, based on morphological and plumage differences between it and other species. Its relationships are not clear, although Jouventin (1982) suggests on the basis of behavioural comparisons that it is most closely related to Eudyptes, the crested penguins. Adults are 72cm in length and weigh 5-6kg and are thus one of the largest species of penguin. This befits their scientific name Megadyptes antipodes, which in Greek means "large diver from the Antipodes" (Stonehouse 1970). Males are only slightly larger than females. Dorsal plumage is slate blue, ventral plumage white, and the feet are pink. They derive their common name from the yellow iris of the eye and the band of yellow feathers that passes from gape to gape through the eye and crest of the head. Immature birds do not obtain a yellow crest until the moult in their second year, and normally reach breeding condition at two to four years of age (Richdale 1957). Unlike many species of penguin which nest in densely populated colonies, the yelloweyed penguin is the only species where each pair nests separately, avoiding visual contact with their neighbours (Jouventin 1982). Hence, they nest in scattered aggregations in coastal forest and scrub. Solitary and secretive types of nesting behaviour are more prevalent in penguin species found north of latitudes degrees (Stonehouse 1970). Another unusual feature is that adult yellow-eyed penguins remain at or near their breeding grounds throughout the year. Studies on the mainland have shown the yellow-eyed penguin diet to include small (mostly less than 20cm) fish of several species which are known to dwell mainly in the upper portion of the water column, but also from the bottom (van Heezik 1988). Evidence for deep diving also comes from penguins being caught in fishing nets set between m in depth (J. Darby pers. comm.). 1.2 RESEARCH In his pioneering 18-year study, L.E. Richdale (1951, 1957) studied the breeding biology and population dynamics of yellow-eyed penguins on the Otago Peninsula. Because of the magnitude of this work the species received little further attention until 1980, when J.T. Darby began a long-term study to determine the population status and breeding ecology of the mainland penguins. Further research was stimulated, principally PhD studies at Otago University, on growth and diet (van Heezik 1988) and behaviour and nest site selection (Seddon 1988). Prior to there had been no detailed work on yellow-eyed penguins in the subantarctic. 3
7 1.3 DISTRIBUTION AND POPULATION In analysing the present distribution of yellow-eyed penguins, Smith (1987) found they inhabited coastline within close proximity of a reliable year-round food source. This related to the width of the continental shelf and the level of primary productivity of the ocean. The climate is also important because the species does not tolerate high temperatures on land, and therefore inhabits areas where mean summer temperatures are less than 16.5 o C (Smith 1987). The breeding distribution of the yellow-eyed penguin includes the south-east coastline of the South Island (from Slope Point to Oamaru, and Banks Peninsula), Stewart Island, Codfish Island, and in the subantarctic region, Auckland and Campbell Islands. Darby (pers. comm.) believes there were once pairs of yellow-eyed penguins on the mainland, breeding in the traditional South Island coastal podocarp/hardwood forests. With the gradual clearance of the coastal forest breeding habitat, predation by feral cats, ferrets and dogs, disturbance by stock and people, and occasional crashes of the food supply, there has been a population decline. Darby (1985) estimated that in areas of the Catlins, Southland, 60% of birds had disappeared since the 1940s. In 1984, Darby (1985) put the total population at breeding pairs, 550 of which were on the mainland. With improved censusing of the South Island, his estimate for the season (Darby in N.Z. Wildlife Service 1986) was pairs, 600 of which were mainland pairs. Based on Richdale's (1957) figure of 40% non-breeding birds this put the overall population at birds, and was considered at the time to be the world's rarest penguin. A major collapse in the food chain in 1987 is believed to have been caused by the El Nino southern oscillation weather pattern, and resulted in a further reduction in the breeding population of yellow-eyed penguins on the mainland (Darby pers. comm.). 1.4 THE NEED FOR INFORMATION Based on the categories designated by the Survival Service Commission of IUCN (King 1981), Bell (1986) defined the yellow-eyed penguin as rare (having a small world population that is at risk) and regionally threatened (likely to become endangered). Robertson and Bell (1984) identified the species as a top priority for population surveys and development of census methods. Similarly, Warham et al. (1986) stressed the need for base-line monitoring of penguins in the New Zealand region to understand the population trends and breeding ecology of each species. Apart from the need to instigate management practices to halt or reverse the decline on the mainland it has become desirable to study the yellow-eyed penguin in other parts of its range where its status is less well known. In this way more reliable population estimates and trends over the entire range will put the mainland situation in perspective. 4
8 1.5 AIMS OF STUDY In the past the main thrust of research on the yellow-eyed penguin has been on the mainland population. One of the main objectives of the Department of Conservation's expedition to Campbell Island in was to help redress this imbalance and determine the status of the species in this part of its subantarctic range. There were three main aims of the Campbell Island study: 1. Obtain a population estimate and monitor the seasonal change in penguin numbers; 2. Determine the level of nesting success; 3. Obtain measurements of adults and the growth rate of chicks. 1.6 STRUCTURE OF REPORT The report is divided into three main chapters: 2. Population 3. Breeding Biology 4. Size and Growth Each chapter is dealt with in terms of background, aims, methods, results and discussion. 5
9 CHAPTER 2. POPULATION 2.1 BACKGROUND Campbell Island lies about 660 km south of the mainland of New Zealand at latitude degrees South. It is over 11,000 ha in area with a coastline mainly of cliffs but with harbours dissecting the island, particularly in the east (Fig. 1). The island was first discovered in 1810 and received several visits from scientific expeditions later that century. Yellow-eyed penguins were first reported on the island during the 1840 visit by Sir James Clark Ross on the Erebus and Terror (Westerskov 1960). In 1874 the species was described as being fairly numerous (Filhol 1885). Sorensen was the first person on Campbell Island to observe yellow-eyed penguins in any detail. He was stationed on the island during the early 1940s as a coast-watcher for enemy ships, and later as officer in charge of the Meteorological Station. He identified the principal breeding areas as Perseverance Harbour, Southeast Harbour, Northeast Harbour, Rocky Bay, Northwest Bay (Bailey and Sorensen 1962) and Monument Harbour (Sorensen ). He noted that penguins were present year-round and usually spent the night ashore. Most yellow-eyed penguin sites occurred where gently sloping, scrubcovered land met the sea, but some penguins had to land among huge boulders or steep rock faces (Bailey and Sorensen 1962). Westerskov (1960) considered that Perseverance Harbour was the principal area, followed by Northwest Bay, and thought it unlikely that the population would exceed 200 pairs. Although this figure was not based on census data it was the only estimate available for Campbell Island and was used by Darby (1984, New Zealand Wildlife 1986) for his total population estimates. A further refinement of the recorded range of the penguin on Campbell Island came when penguins were found at Smoothwater Bay (Taylor 1986), Shag Point and Antarctic Bay on the south coast (G. Taylor pers. comm.). 2.2 AIMS In order to assess the status of yellow-eyed penguins on Campbell Island it was hoped to: 1. Census the population 2. Monitor seasonal trends in penguin numbers 3. Monitor the patterns of arrivals and departures of penguins to and from landing sites. 4. Estimate the proportion of breeding birds in the population. These base-line data would allow future monitoring studies to detect changes in the population (see Appendix 11 for guide to low intensity monitoring of key landing sites). 6
10 7
11 2.3 METHODS Census A survey of all the known yellow-eyed penguin areas on Campbell Island was conducted during the winter months of May to July 1988, and counts of penguins at all the landing sites were made to determine the total population size. Apart from some coastline in the south and west of the island, most of the accessible coastline was searched for penguin landing sites. The expression "landing site" used in this report refers to the part of a beach where penguins were seen arriving from or departing to sea. To a large extent these sites were favoured by penguins and were used every day. Depending on the number of penguins encountered, counts were usually of two to three hours duration in the morning or evening to cover the time of peak departures or arrivals. Vantage points were chosen close to a landing site, and where possible neighbouring landing sites were counted at the same time. A few areas with difficult access were counted from a distant vantage point using a telescope or viewed from a boat or canoe. At some minor landing sites penguin footprints in snow were used to obtain counts. Excluding counts at Middle Bay the winter survey took 43 days in total, with 111 separate counts and 244 hours of observation. The pain threshold for cold feet was exceeded for at least 184 hours of observation Counts at Major Landing Sites Penguins were counted at eight landing sites in Northwest Bay and three sites in Southeast Harbour on four occasions during the year (November, February, May and August). Excluding counts at Middle Bay and during the winter survey, the seasonal survey comprised 128 hours of observation on 10 days Counts at Middle Bay Study Area The Middle Bay penguin counts were undertaken to determine the pattern of arrivals and departures of penguins from the landing sites on a seasonal basis and as a guide for interpretation of counts made elsewhere on the island. Middle Bay (part of Northwest Bay) was selected for intensive study because of its good number of penguins, observation points and the close proximity of Northwest Bay Hut. The main landing site at the stream was monitored intensively, and a subsidiary site at a wave-cut platform 100m east of the stream was also monitored. On two days, usually in the middle of each month, penguins were counted as they departed and arrived at the landing site. These counts were conducted on November; 6, 8 December; 12, 13 January; 14, 16 February; 10, 15 March; 14, 15 April; 15, 16 May; 14, 15 June; 14, 15 July; 14, 15 August; 14, 15 September. Additional counts of morning departures or evening arrivals were made on 26 October (preliminary count), on March (to observe chicks departing), on 2, 3 May (to determine the stage of the moulting period), and on 29 September (final count). 8
12 The counts were shared between two observers from before dawn till after dusk to see the first departure and last arrival of penguins for the day. Because of the seasonal change in daylight hours, the daily period of observation varied from 19.5 hours in January to 11 hours in July. The observations were made from vantage points adjacent to the beach. Times of arrival and departure at the beach were recorded for each bird or group. Adult penguins were banded as part of the breeding study, and whenever possible, their band numbers were read with the aid of binoculars or telescope. The Middle Bay counts comprised 346 hours of observation on 30 days. Therefore, in total for the year, penguin counting took a cumulative 718 hours on 83 days. 2.4 RESULTS Population Size of Yellow-Eyed Penguin in Winter The census of yellow-eyed penguins on Campbell Island during May to July 1988 was 1625 individuals (Table 1). This total included 66 juveniles (4.1%). There were 172 landing sites identified, with a mean count of 9.4 birds per site, although 33 landing sites were where only one individual was seen. The penguins were found at most sheltered bays and harbours which allowed access to vegetation dominated by The mean density was approximately 44 birds per kilometre of accessible coastline. There are approximately 37 of such coastline, from an island circumference of about 120 km. TABLE 1: NUMBERS AND DISTRIBUTION OF YELLOW-EYED PENGUINS IN WINTER 1988 NO. COUNTED AREA Adult Juv. Total ESTIMATED POPULATION Northwest Bay Northeast Harbour Perseverance Harbour Southeast Harbour Monument Harbour Shag Point Antarctic Bay Smoothwater Bay Rocky Bay Key a: Counts of birds were increased by a factor, based on the proportion of banded birds seen at Middle Bay 9
13 A total population estimate can be made based on the proportion of banded birds that were seen during the counts at Middle Bay, compared with the original number banded and presumed to be still alive (see Chapter 2.4.6). The average percentage of banded birds seen during May, June and July 1988 was 79.4, 83.7 and 81.1 respectively (Appendix 8). It was also observed that not all penguins went to sea each day. It was therefore assumed that the same proportion of penguins were seen during the census elsewhere on the island, and the census for each area was adjusted accordingly (Table 1). Thus, the total population was estimated at 2000 birds. This represents breeding pairs, assuming 60-70% of the population are breeders (see Chapters 2.4.6, 2.5) Distribution The main population centre of yellow-eyed penguins was at Northwest Bay, where 448 birds were counted (Fig. 1, Table 1). The penguins at the four main areas of Northwest Bay, Northeast, Perseverance and Southeast Harbours comprised 79% of the total number counted. Northwest Bay also had the highest concentration at 249 birds per kilometre of accessible coastline (Table 2). The second highest concentration was at Shag Point (202/km). These two areas also had the highest mean counts per landing site of 26 and 40 birds respectively. The lowest concentrations were found at Perseverance Harbour and (14/km) and Rocky Bay (9/km). TABLE 2: DENSITY OF YELLOW-EYED PENGUINS No. landing sites Mean no. penguins per site S.D. Range Est. length of accessible coastline (km) Mean no. penguins per km Northwest Bay Northeast Harbour Perseverance Harbour Southeast Harbour Monument Harbour Shag Point Antarctic Bay Smoothwater Bay Rocky Bay Total Mean
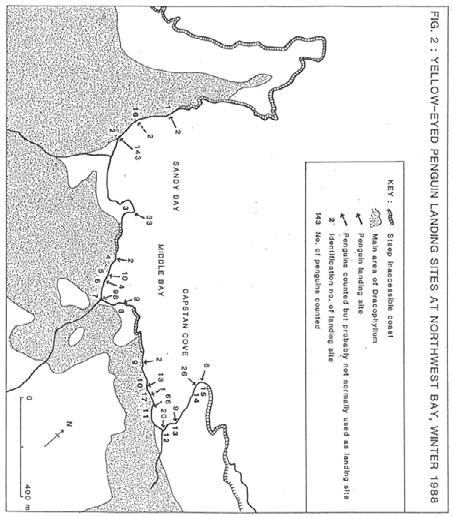
14 Most landing sites, particularly the major ones, were permanent features in the sense that penguins usually landed in the same place each day, although closely adjacent landing sites were probably used as alternatives. The presence of Hooker's sea lions (Neophoca hookeri) in the water or on land near the landing site frequently delayed penguin movements to or from shore, and sometimes caused them to land away from their usual site. The landing sites were generally in the most sheltered parts of bays where wave action, surges and kelp density were at a minimum, and where sea lion activity was low. The penguins landed on beaches of shingle or small boulders, rocky wave-cut platforms, ramps and promontories. Of the 172 landing sites, 61% were boulder beaches and 39% were rocky shores. Once on land the penguins usually walked directly inland on radiating and branching tracks. However, in rare cases, such as at Davis Point in Perseverance Harbour, penguins converged from a few adjacent landing sites to one track before heading inland. Tracks that had not been smoothed out by sea lions had obviously been used by penguins for a long time and had been worn down into small grooves in the soil. Most birds did not travel more than 500m inland or climb more than 60m above sea level. In some areas penguins roosted for the night on rocks close to the landing site. Generally, penguins arrived at landing sites from the sea singly or sometimes in small groups, whereas it was more common for larger groups to gather on the shore before leaving in the morning. When travelling at sea, the penguins frequently porpoised above the water, and their movements indicated that they usually moved to fishing grounds outside the harbours and bays. The areas where penguins were found (Fig. 1) are described below in anti-clockwise order around the island. NORTHWEST BAY (Fig. 2) Northwest Bay is sheltered from westerly weather by Complex Point. Three bays in the western half of the harbour are accessible to penguins and the shoreline is flanked by gentle slopes, mainly vegetated by mature Dracophyllum forest and scrub for up to a kilometre inland. The 448 penguins were counted at 17 sites, 15 of which were known to be used regularly. The most popular landing site on the whole island was at a boulder beach in Sandy Bay (143 birds). The other main landing sites were at the stream in Middle Bay (98) and at a wave-cut rock platform in western Capstan Cove (66). ROCKY BAY The smallest of five centres of population on the southern coast of the island was at Rocky Bay where there were three minor landing sites at the western end. The larger site where 11 birds landed was at a rock platform backed by a steep rock slope of about 8 metres in height which they scaled to reach their tracks. ANTARCTIC BAY One of the areas most exposed to open ocean swells is at Antarctic Bay, where 44 birds landed at a shallow notch in the rock of a peninsula. This was backed by cliffs so that only a small area of mega-herbs, fern and tussock was accessible to penguins. The area was counted from the top of the cliff by using a telescope. 11
15 12
16 MONUMENT HARBOUR The southern-most location of yellow-eyed penguins on the island was in Monument Harbour, where 136 birds were seen at six landing sites, giving a high average count of 23 per site. The main site (57 birds) was at a rocky promontory on the eastern side of the harbour. The vegetation in this area is dominated by Poa tussocks. SOUTHEAST HARBOUR (Fig. 3) The major centre for penguins on the south coast was Southeast Harbour which is flanked by a large expanse of Dracophyllum forest. The population of 260 birds was densely concentrated at 173 per kilometre of accessible coastline. Along the shingle and boulder beaches at the head of the harbour 15 penguin landing sites were identified, although most of the birds used 7 of these, particularly beside Southeast Stream (47) and near the eastern end of the beach (40). The main landing site (74) was further along the eastern side of the harbour, at a rock promontory below an old slip. SHAG POINT The bay in the lee of Shag Point is comprised of a short 600m stretch of rocky coastline which is exposed to open ocean swells. Almost all the 121 penguins landed at two sites on projections of the rock shelf where wave action was the least violent. This confined landing area thus had the highest average count per site (40) and second highest coastal density on the island (202/km). PERSEVERANCE HARBOUR (Fig. 4) The largest harbour on the island is Perseverance Harbour, extending about 9km inland from the eastern coast. The slopes are mainly cloaked by Dracophyllum scrub, although there are large areas of grasses and ferns on old slips on the southern side. As an area of importance for penguins on the island it ranked third with a count of 261. The birds were widely dispersed at 54 landing sites (4.8/site, 4/km) and only one individual was seen at ten of these sites. The main concentration of penguins on the southern side was 3-4km from the harbour entrance, where 92 birds were counted at six adjacent landing sites along a sloping rock shore. There were 33 penguins at the most popular landing site. The shore becomes increasingly inaccessible towards the harbour entrance, with steep rugged slopes and bluffs, and few penguins were seen. Despite the easy access for penguins there was no sign of landing sites beyond Shoal Point or at the head of the harbour. The penguins furthest from the open ocean (about 7km) were near Lookout Bay on the northern shore. The other concentrations were around Boyack Point, east of De la Vire Point and at Davis Point. SMOOTHWATER BAY A small number of penguins was counted at Smoothwater Bay. Most of the 23 birds were at two landing sites on rock promontories at the southern part of the bay. 13
17 14
18 15
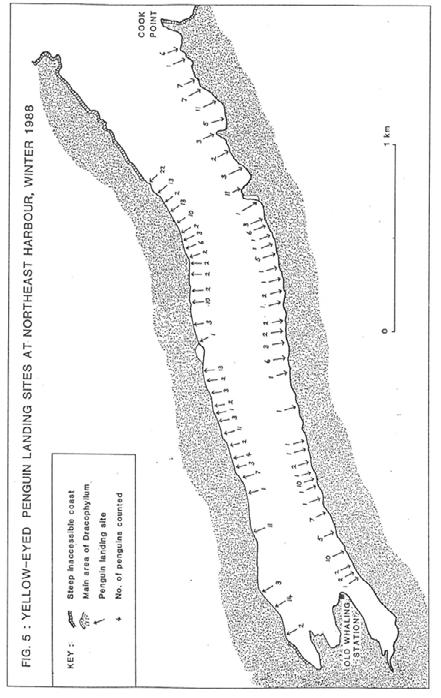
19 NORTHEAST HARBOUR (Fig. 5) As with Perseverance Harbour, Northeast Harbour extends inland from the east coast, but it is much smaller at only 3.5km in length. The coastal vegetation is largely a continuous cover of Dracophyllum scrub. Shingle beaches in the inner harbour gradually change to boulder beaches and then rock shelves for the final kilometre. The harbour supported the second largest population of penguins on the island (312), but they were well dispersed (41/km) at 68 landing sites. The harbour has the lowest average count (4.6/landing site), with 15 sites where only one individual was seen. The landing sites were spread the length of both shores except for the western 500m at the head of the harbour. More penguins were counted within 2km of the open ocean than further up the harbour Numbers of Penguins at Northwest Bay and Southeast Harbour The seasonal changes in numbers of yellow-eyed penguins at several landing sites at Northwest Bay and Southeast Harbour are shown in Fig. 6 (Appendices 1 and 2). The locations of these landing sites are shown in Figs. 2 and 3. Both harbours show similar trends in numbers, with lowest counts in November and highest counts in May. In November, the eight sites monitored in Northwest Bay yielded a count of 195 adults, which was 51% of the number counted six months later. This was a result of one bird of each breeding pair in November taking a trip to sea while the partner incubated the eggs. In February, the count of 369 adults was close to the maximum because chicks were left unguarded and most adults went to sea every day. The maximum count of 384 adults occurred in May, when all birds had finished moulting and were travelling to sea almost every day, presumably to recoup their body reserves. The August count of 250 adults was low, possibly as a result of less frequent trips to sea and disturbance to penguin behaviour by the predatory activity of at least one sea lion (see Chapter 2.4.4). At Southeast Harbour the minimum count of 63 adults was in November, followed by increases to 86 in February and 106 in May, and a subsequent decline again to 86 in August. Juveniles showed an opposite trend in numbers from the adults. At 12 landing sites in Northwest Bay in November 37 juveniles (14.1% of the total 262 penguins) were counted and in May only 7 (1.6%) juveniles were counted. The total number of juveniles counted around the whole island during winter was 66 (4.1%). Observations of banded juveniles in winter indicated a dispersal phase when they did not favour particular landing sites and sometimes landed away from the sites used by adults Numbers of Penguins at Middle Bay The seasonal pattern of numbers of yellow-eyed penguins at Middle Bay is shown in Fig. 7 and Appendix 3. Each monthly bar generally represents the average of four counts (two sets of departures and arrivals) at the main landing site (site 7, Fig. 2) during two complete days of observation (from before dawn till after dusk). The additional counts made in March, May and September were not for complete days but covered the main period of departures or arrivals. These counts are plotted to show the change in numbers around the moulting period and the beginning of the breeding season. 16
20 17
21 18
22 19
23 Also shown in Appendix 3 are counts of birds landing on rocks at the eastern end of the bay, 100m away from the main landing site (site 8, Fig. 2). A few birds used this site as an alternative, especially in winter. Until May the observations of birds using the eastern landing site were only in the evening because they could not be viewed easily from the observation point used in the morning. Subsequently they were monitored in the morning also. In November, when there was always one bird of each breeding pair at the nest, the mean count was 57 birds. This count represented about half the number of breeding birds and most of the non-breeding birds, 2-6 of these being juveniles. A maximum of six juveniles was seen at Middle Bay during the year. Once the chicks had hatched, the counts from December to mid-march reflected the fact that most adults of breeding pairs were both at sea each day. Thus, the counts in these months approach the highest for the year. In December (89 1 ) adults were taking alternate trips to sea on the same day, whereas by mid-january (91) many nests were at the end of the guard stage and both adults were at sea simultaneously. February (97) had the highest average count and the highest individual count of 105, however 4-8 of these birds were probably counted twice, as they made two trips to sea each day (this was confirmed for some of the banded adults). In mid-march (89) half the chicks had fledged while the remainder were still being fed by parents, 3-5 of which were making two trips each day. The moult began in March. A juvenile in the early stages of moult was found inland from Middle Bay on 6 March, and six were seen moulting on 16 March. By March the average count of penguins moving to or from the landing site had dropped (64), with non-breeders and failed breeders staying ashore to moult. The lowest counts of the year occurred in April (31) when most breeding adults were moulting and the recently moulted non-breeders and failed breeders were travelling to and from the sea again. Counts were increasing again in early May (74) because most adults had finished moulting, and by May (95) all had done so. The mid-may average count (95) was the highest for the winter months. The June (86) and July (67) counts were lower because 2-21 birds were landing on the rocks at the eastern end of Middle Bay and spending the night there. Prior to June, it was rare to see more than one or two birds land at the eastern landing site. The greater use seemed to be mainly a result of the increasing presence of sea lions, with up to 60 gathering on the sandy part of the beach, which made the penguins very wary of departing and arriving at the main landing site. From May to July the maximum number of birds seen at both landing sites was similar, at In August (45) numbers had continued to decline. This was at least due in part to disturbance by a sea lion which was observed preying on penguins at Middle Bay. It lay in ambush behind a rock in the shallows near the landing site and was seen killing at least two penguins and pursuing others as they came ashore. Several penguin skins were found washed ashore, which had not been observed in earlier months. In September (33) predation seemed to be continuing since several skeletons and pieces of penguin 1 Numbers in brackets in this Chapter section refer to mean counts at the landing site (Appendix 3). 20
24 skins were found on the beach. There were also penguins inland during the day courting and preparing to nest Daily Movements at the Landing Site The seasonal change in times of departures and arrivals of yellow-eyed penguins at the landing site at Middle Bay is shown in Fig. 8 (Appendix 4). The mean departure and arrival times follow a similar pattern to the seasonal change in sunrise and sunset times (Fig. 8), particularly from April to September when most penguins left for sea around dawn and returned at dusk. This relationship is less clear during the breeding season (November to March) because of the wide range in times that penguins used the landing site. The identification of banded birds in these months showed that there were actually two overlapping peaks of departures and corresponding arrival peaks each day (Appendix 4, also see Figs. 9-12), relating to breeding partners taking turns to feed at sea or making two trips a day. Hence the peak of first departures (OUT-1) and last arrivals (IN-2) for December to March relate more closely to the sunrise and sunset times (Appendix 5) than do the mean times depicted in Fig. 8. The earliest observed time of departure was 66 minutes before sunrise in January, and the latest arrival was 91 minutes after sunset in July. The difference between mean departure and arrival times relates to the length of time penguins spent at sea. This has been compared with the day-length in Table 3. In the breeding months of December to March the day-length declined from about 16.5 to 12.5 hours, and the penguins spent comparatively more of the daylight hours at sea, the difference declining from 8.5 to 1 hour less than the available daylight period. If the difference between OUT-1 and IN-2 is considered (right-hand columns, Table 3), the time at sea also becomes closer to the actual day-length. In December, which was the month of maximum day-length, the difference between the first penguin departure and second arrival peaks was 14 hours 16 minutes ( Hours NZ Standard Time) with a range of 18 hours 11 minutes ( Hours). In contrast, in the winter months of May to July when day-length decreased to around 8 hours, penguins their time at sea and spent up to 24 minutes longer, on average, than the day-length. For example, in June the mean time at sea was 8 hours 11 minutes ( Hours) with a range of 10 hours 3 minutes ( Hours). 21
25 22
26 TABLE 3: DAY-LENGTH AND MEAN TIME YELLOW-EYED PENGUINS SPENT AT SEA, MIDDLE BAY DAY- LENGTH DURATION (Hours:Minutes) MEAN a DIFFER- MAX c TIME AT ENCE b TIME AT SEA SEA DIFFER- ENCE b NOV 15:12 12:25-2: :15 DEC 16:13 7:56-8: :55 JAN 16:17 10:41-5: :02 FEB 14:26 12:19-2: MAR 12:44 11:37-1:07 APR 10:34 8:49-1:45 MAY 8:46 9: JUN 7:48 8: JUL 8:09 8: AUG 9:38 8:55-43 SEP 11:35 10:35-1:00 KEY a: Duration based on the interval between mean depature and mean arrival times (Appendices 4 & 5) b: Time difference between the time spent at sea and the day-length c: Time based on the interval between the first depature (OUT-1) and the second arrival (IN-2) peaks (Appendices 4 & 5) The above assumption that the difference between mean departures and arrivals relates to the time that the penguins spent at sea was born out by the direct observations of the band numbers of banded birds. These data have not been presented in detail because of low sample sizes for some months, particularly in winter when the light was often poor for reading band numbers with binoculars. They also tend to under-estimate the average time spent at sea because there is a higher chance of reading a band number of a bird which leaves late in the morning and then returns early in the evening. Nevertheless, the trends are shown. For example, in February the mean observed time that banded penguins spent at sea was 12 hours 47 minutes (S.D=121min. N=19). By June the time at sea was only 7 hours 12 minutes (S.D.=13min. N=5). The maximum observed trip at sea was an individual in February which was seen returning to the landing site 15 hours 50 minutes after it left in the morning. Figures 9-12 show the counts of yellow-eyed penguins at Middle Bay in more detail. These are hourly counts averaged for the two days of observation each month (Appendix 6). NOVEMBER (Fig. 9) During this month the pattern of movements showed the usual pattern of early morning peak departures and evening peak arrivals. 23
27 24
28 DECEMBER By December, chicks had hatched and there were adults crossing the beach throughout the day. These movements have been interpreted as four peaks (as discussed earlier) based on the positive identification of banded breeding birds that arrived at the beach during the middle of the day, travelled inland to relieve their partners at the nest, who then departed to sea. These birds returned at the end of the day with others which had spent the whole day at sea. JANUARY In January many chicks were left unguarded by their parents, which were at sea simultaneously. There was still a distinct second peak of departures (OUT-2 in Appendix 4) with some adults taking turns at sea with their partners. FEBRUARY In February the main departure and arrival peaks were more well defined than previous months. This was because all the chicks were left unattended and both parents fed at sea during the day. Two unidentified birds arrived at first light, presumably having spent the night at sea or away from their normal landing site. The few late departures were by about six birds which were making two trips a day to sea to collect food for their chicks. MARCH (Fig. 10) Penguin movements showed a similar pattern to February, although the peaks were further accentuated. Departures were largely over in one hour. At this stage half the chicks had fledged, so only a few parents were making two trips to sea and travelling outside the peak periods. APRIL The birds in April spent less time at sea than expected from the trends shown in Table 3. These penguins had completed their moult and may have had insufficient insulation for long trips to sea. One bird which had not completely replaced its feathers returned to the beach after only 15 minutes at sea. The peaks were low because many adults were still moulting. MAY TO SEPTEMBER (Figs ) The hourly counts in the winter months showed a similar pattern of sharp departure and arrival peaks with no birds travelling during the middle of the day Numbers of Breeding Birds Forty-two pairs of yellow-eyed penguins were known to have bred at Middle Bay (see Chapter 3). As the study area did not encompass all of the potential breeding area available to the penguins, the total number of breeding birds using the landing site was probably higher than 84. The evidence at Middle Bay is used below to estimate the proportion of breeding birds in the population. 25
29 26
30 27
31 28
32 The earliest count that was made at the Middle Bay landing sites during the breeding season was on 3 November, when 54 adults and 6 juveniles were seen (Appendix 8). The fact that this included 31 banded adults, and 62 birds had been banded by this date helped confirm that breeding birds were taking alternate trips to sea on different days from their partners. The proportion of non-breeding adults in the count of 54 adults was up to 12, because there were at least 42 breeding pairs. This gives an estimated total population at Middle Bay of 102, with 84 (82%) breeding birds, 12 (12%) non-breeding adults and 6 (6%) juveniles. During the December counts, most breeding birds were feeding chicks that were about two weeks old, and most partners were taking turns at sea on the same day. Therefore, the numbers of birds travelling in the first arrivals and second departures should have related to the number of nests. Of the original 39 nests with banded adults, 33 were successfully rearing chicks at the time of the counts at the landing site. About 29 banded adults were observed travelling outside peak times and about 7 unbanded birds were travelling at the same times. If it is assumed these were breeding adults also, the relationship of 29 banded adults from 39 nests can be used to extrapolate the 36 adults (29+7) to 48 nests. This means that there may have been 96 breeding individuals at the beginning of the breeding season. The average count in May of 95 (92-98) probably represented the winter population of adults at Middle Bay, however, the counts of banded birds represented only 79% of the number known to be still alive (Appendix 8, column D). Presumably 21% of adults were staying ashore each day since none were seen away from Middle Bay. If this was true for all the birds at Middle Bay, the count of 95 represented 118 adults living there. If this total is related to the estimated number of breeding birds earlier that season (84-96, see above), the percentage of breeding birds in the population was 71-81%. Another way of looking at the data is to consider the proportion of banded birds (i.e. known breeding adults) in each monthly count (column A, Appendix 8). From December to March the proportion was around 70% with a maximum of 77.8% for one March count. The September figures were around 60%, presumably a result of mortality of banded adults combined with an input of unbanded adults after the moulting period. A further indication of the proportion of breeders is that a figure of 80% is the most reliable factor to use to extrapolate back from counts made at Northwest Bay in May to those the previous November. The assumption here is that only half the number of breeding birds was counted in November, as one bird of each pair was at the nest. e.g. Northwest Bay (12 sites) May count x 0.80 = 350 breeding birds = 175 breeding pairs = 87 non-breeding birds November count 262 Estimate from May figures = =
33 In summary, a conservative estimate of the proportion of breeding birds at Middle Bay was at least 70%. Thus, the population of birds on Campbell Island in 1988 included about breeding pairs. 2.5 DISCUSSION The census of yellow-eyed penguins on Campbell Island during winter of 1988 revealed 1625 individuals. Although all major landing sites were found there may have been some minor sites in remote areas that were overlooked. For instance, the western coast below the cliffs of Mount Paris and Yvon Villarceau are accessible to rockhopper penguins, but visits by other workers have indicated that yellow-eyed penguins do not land there (P. Moors, D. Cunningham pers. comm.). Similarly, although lacking much suitable nesting habitat, there may be small areas available to penguins between Rocky Bay and Antarctic Bay or on the coastline north-east of Northwest Bay. Middle Bay data suggested that only 80% of birds at any landing site were counted because not all birds travelled to sea each day. Therefore it is estimated there were about 2000 birds in total. This is substantially more than the 200 pairs (or 600 individuals) that Westerskov (1960) considered to be the likely maximum based on his visits to the main penguin areas. However, Westerskov did no actual counting as he states "An estimate of their numbers was not attempted and would be a very time consuming although rewarding study. In censusing penguins on the mainland J. Darby (pers. comm.) finds a combination of a count in October (incubation phase) with one in December (chick guard stage) the most reliable method for determining the number of breeding pairs. Time and labour constraints did not allow a full census of Campbell Island in these months. Darby uses the assumption that the number of pairs with two chicks can be estimated from the number of birds going out to sea during the second departure period. Thus, if two-thirds of nests rear two chicks (Richdale 1957) then the original number of breeding pairs can be predicted (Darby pers. comm.). The above assumption was not valid for Campbell Island. When counts were made in December, 33 of the original 39 nests (with banded adults) had chicks, and 29 of these nests had two chicks while four had one chick. In all four of the one-chick nests, on both days of observation, one partner was identified arriving during the day followed by a departure of its mate. Thus, without the detailed information available the assumption that the birds travelling in the second departure peak represented two-thirds of breeding pairs would have overestimated the breeding population. Nevertheless, there is still a relationship between birds counted and number of nests, and the various ways of looking at the information available revealed that at least 70% of birds were breeders at Middle Bay in This is higher than the 60% figure of (1957). Recent studies on the mainland also suggest the proportion of breeding birds in most years is higher than 60%, however the data has not been analysed (Darby pers. comm.) 30
34 Table 4 gives an estimate of the total population of the yellow-eyed penguin throughout its range. This should be treated as provisional as more reliable figures for most areas are needed. A figure of 70% breeding birds has been used to obtain the total population estimate of If 60% is used the number of non-breeders increases the total to TABLE 4: YELLOW-EYED PENGUIN POPULATION ESTIMATE Figures other than for Campbell Island are from Darby (pers. comm.) Population Estimate Proportion of Total BREEDING PAIRS on South Island % Stewart Island % Codfish Island % Auckland Islands % Campbell Island % TOTAL BREEDING INDIVIDUALS NON-BREEDERS (30%) TOTAL INDIVIDUALS The available information suggests that the Campbell Island population represents a substantial proportion (an estimated 35%) of the world population of yellow-eyed penguins. The only other reliable figures are from the mainland South Island, although even there the situation is currently unclear. In after a dramatic disappearance of many breeding pairs the population on the mainland was thought to be only pairs. With the reappearance of many birds in the latest estimate is pairs (Darby pers. comm.). The Stewart Island figure was mainly from density estimates with some counting in , and the Codfish Island figure came from a partial census in 1983 (New Wildlife Service 1986). Some recent counts have also been conducted on Stewart and Codfish Islands. The Islands estimate was based mainly on a 1972 estimate by R. Russ of pairs (Darby 1984) and an estimate for Enderby Island of 140 pairs (Darby 1986). There may be few birds on the main Auckland Island because of pigs (Challies 1975). Casual observations can be very misleading, for example Bartle and Paulin (1986) state that the population on Enderby Island "must be many thousands", and actual counts are the only solution to the problem. On Campbell Island, the main centres of population were in the sheltered harbours which allowed easy access from the breeding grounds to the sea. Evidence from the prey items selected by yellow-eyed penguins off the mainland of New Zealand suggest the penguins travel away from the coast before beginning to feed over the continental shelf. This relates to a feeding range of less than 15 km offshore (van Heezik 1988). This probably explains why penguins were not found more than 7km up Perseverance Harbour, and why greater concentrations were found in the outer part of this harbour and Northeast Harbour. 31
35 Campbell Island lies at the southern end of the Campbell Plateau, a huge continental shelf less than 1000m below sea level. The bathymetry closer to the island shows a large expanse of shelf less than 200m deep and the 125m isobath is up to 9km offshore (Cullen 1971). Smith's (1987) analysis of yellow-eyed penguin distribution showed Campbell Island to be a very favourable area. The large area of continental shelf has very productive seas compared with other parts of the species' range. In addition, the requirements of a "cool" climate and suitable breeding habitat are well satisfied. These factors further confirm the importance of Campbell Island as a population centre for yellow-eyed penguins. Although often referred to as the world's rarest penguin (e.g. Darby 1985), at present the yellow-eyed penguin may be second in rarity to the Galapagos penguin (Spheniscus mendiculus). In 1985 its population was only birds (Valle 1986). At that time the population had recovered by 50% from 1984 levels (Valle and Coulter 1987), having suffered a severe decline after the El Nino Southern Oscillation weather phenomenon. Prior to that the population had been estimated at 6,000-12,000 birds (Valle 1986), so potentially the species could recover to that level and outnumber yellow-eyed penguins. The seasonal change in yellow-eyed penguin numbers on Campbell Island was presented in some detail in this report to allow interpretation of population estimates and provide base-line data for future work. It would appear that May-June was a good period to conduct a census, particularly May, as this was after the moult when adults were replenishing their body reserves by going to sea on most days. Thus, counts were close to the maximum for the year. This may be a consideration when plans to census areas such as the Auckland Islands are made. An indication of annual variation in penguin numbers is given by Table 5. The counts in 1987 and 1988 were very similar. The 1989 count at Sandy Bay was higher because more juveniles were seen. At Middle Bay in 1989 the count was less than half what it had been in previous years and in November 1988 only 6 birds were seen (P. Hatfield pers. comm.). It is probable that the sea lion predation and disturbance at the end of our study continued to affect the study area. TABLE 5: ANNUAL COUNTS OF YELLOW-EYED PENGUINS AT NORTHWEST BAY Area Landing site No. No. of penguins May-June May May Sandy Bay Middle Bay Capstan Cove Key 1: R. Moffat 2: this study 3: P. Hatfield (N.Z. Meteorological Service) 32
36 Jouventin (1982) suggested that the yellow-eyed penguin's high degree of wariness of humans compared with other penguin species has probably preserved it from extinction. This trait was thought to be a late adaptation, since A. Wright of the N.Z. Wildlife Service had reported that penguins on Campbell Island were much less afraid of people than in New Zealand. In contrast, during this study we found that although some individuals were unafraid of humans, they were usually wary, particularly at the beaches, in the open or if the people were moving. Most penguins, however, were quite approachable at the nest, just as they are on the mainland (Darby pers. comm.). 33
37 CHAPTER 3. BREEDING BIOLOGY 3.1 BACKGROUND The subantarctic members of the yellow-eyed penguin population have received little attention from scientists, apart from the recording of their presence and collection of specimens by various expeditions last century and early this century. This is partly because the penguins nest at low densities in dense vegetation, making study difficult and time consuming in comparison with colonial species. The only detailed observations of nesting yellow-eyed penguins on Campbell Island were made by J. Sorensen in the season. He followed the progress of one nest in particular in Perseverance Harbour, and found in general that nesting occurred one to two weeks later than on mainland New Eggs were laid from early to mid October and chicks fledged in mid to late March (Bailey and Sorensen 1962). Filhol (1885) found chicks on 15 November The only other references to nesting have been anecdotes by Westerskov (1960). 3.2 AIMS To determine the: 1. Timing of the breeding cycle 2. Nesting habitat 3. Level of breeding success. 3.3 METHODS Middle Bay of Northwest Bay was chosen as a study area to follow the breeding season of the yellow-eyed penguin on Campbell Island. Searches for nests were conducted inland from the landing site at the stream in Middle Bay. Care was taken not to search too far either side of the landing site to avoid encroaching on breeding areas associated with other landing sites. The main searching period was October and 12 November Nests were mapped in the study area by measuring distances and orientations between them. To aid the re-finding of nests, routes were marked of red trail tape. Nests were initially visited every few days to record their contents. At the peak of hatching, visits were every two days, and subsequently every five days until chicks fledged. From 23 October 1987 to 31 March visits were made to nests in the study area using a minimum walking/crawling circuit of 2.5 The progress of an additional eight nests elsewhere in Northwest Bay and one in Perseverance Harbour were monitored on a more irregular basis. Adults were flipper-banded at the nest. Movements of the adults to and from the nests were monitored at the landing site. Ectoparasitic ticks were collected for identification from penguins in the study area. 34
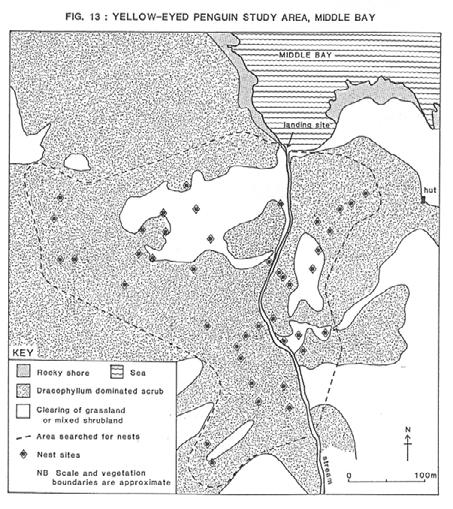
38 3.4 RESULTS Nesting Habitat During the main searching period of October 33 nests were found in the study area. Another six nests were found two weeks later, one more on 26 November, and two broods near their nests in early January, bringing the total of known nests in the area to 42. The study area (Fig. 13) was approximately 10.9ha in extent, being 400m at the widest point and extending 450m up the Middle Bay stream. The slopes of Menhir Peak flanked the western border of the area. The density of the 42 nests was 3.8 nests/ha. Table 6 shows that the average walking distance from the landing site at the beach to the nest was 236m. The furthest inland that a nest was found was 433m. Most nests were 20-60m above sea level. Generally, the nests were dispersed and isolated from their neighbours, on average 22m away from the closest neighbour (Table 6). TABLE 6: DISTANCE FROM SEA AND NEIGHBOURS OF YELLOW-EYED PENGUIN NESTS AT MIDDLE BAY DISTANCE (m) PROXIMITY TO MEAN S.D. MIN. MAX. N THE SEA NEIGHBOURS Vegetation in the study area ranged from stands of tall (up to 5m) mature Dracophyllum scrub (a mixture of D. longifolium and D. longifolium x scoparium hybrids), particularly near the coast, to shorter (203m) and denser pole stands of Dracophyllum scrub further inland. Scattered throughout the younger scrub and small clearings were divaricating shrubs (1-2m tall), mostly Myrsine divaricata, with some Coprosma cileata and C. cuneata. One large grassland clearing in the western part of the study area included Poa literosa and other grasses, Carex, Bulbinella rossii and Histiopteris incisa. The nesting habitat is broadly summarised in Table 7. Dracophyllum was the main plant cover for nests. Many nests were in areas of closed canopy but several were found close to the edge of clearings or under isolated plants in clearings. Nests were also found under Myrsine divaricata and the less common Coprosma shrubs. A few nests were under Poa tussocks or the fronds of ferns, mainly hardfern (Polystichum vestitum) or in one case Histiopteris incisa. 35
39 36
40 TABLE 7: NESTING COVER OF YELLOW-EYED PENGUIN AT MIDDLE BAY PRIMARY VEGETATION COVER OF NESTS NO. OF NESTS % Dracophyllum Myrsine Coprosma Poa 3 7 Fern The main factor in nest choice was probably shelter, since 58% of nests were built against a solid backing of some sort. These included banks up to 50cm tall or were formed by and roots at the base of Dracophyllums. Many nests were actually overhung by trunks and in some the nest site was virtually a hole. The remaining nests had either a dense backing of vegetation or close cover above the nest. In general, therefore, the nests were sheltered on three sides and above, leaving one side open as an entrance: Breeding Success The breeding success of the yellow-eyed penguin at Middle Bay is presented in Table 8. The 33 nest sample gives the best estimate of nesting success at the egg stage, and for overall success from egg to fledgling, since they were all found early in incubation. The 40 nest sample includes the same 33 nests and the additional 7 nests which were followed from hatching to fledging. This larger sample provides a better estimate of chick fledging success. 37
41 TABLE 8: BREEDING SUCCESS OF YELLOW-EYED PENGUIN AT MIDDLE BAY 33 NEST SAMPLE 40 NEST SAMPLE Nest no. % Egg/chick no. % Nest no. % Egg/chick no. % NESTS EGGS HATCHING SUCCESS 29 88% a 53 83% b 36 90% 66 85% CHICK SUCCESS For nests that hatched 25 86% 45 85% 32 89% c 56 85% d chicks For all nests 25 76% e 45 70% f 32 80% 56 72% OVERALL SUCCESS Chicks per nest 1.4 g 1.4 PRODUCTION h 2 chicks chick chicks Success Definitions a : Percent of nests that had chicks b : Percent of eggs that hatched c : Percent of nests with chicks that fledged chicks d : Percent of chicks that to fledge e : Percent of the original nests that fledged chicks f : Percent of the original eggs that fledged chicks g : Mean number of chicks per nest h : Percent of nests which produced two, one or no chicks EGGS Of the 33 nests that were found early in incubation, 31 (94%) had two egg clutches, while the other 2 (6%) had only one egg. Chicks were hatched successfully in 29 (88%) of the nests (Table 8). In three of the failed nests, one parent disappeared and the nest was abandoned by the remaining bird. The eggs at the fourth failed nest were incubated for more than two months before being abandoned. Also, one of the eggs failed to hatch in four of the successful nests, leaving 53 (83%) of the original 64 eggs to hatch successfully. CHICKS By the time of hatching in November there were 40 study nests, 36 of these having successfully hatched 66 chicks (Table 8). The mean hatch date was 26 November days), with a 14-day range of 20 November to 3 December. The hatching dates of 14 eggs from eight nests that were monitored outside the study area fell within this range except for one nest, which hatched on 12 December. Allowing for an incubation time of 43.5 days (Richdale 1957), the mean laying date for Middle Bay would have been 38
42 15 October (range 8-21 October). Therefore, most of the first 33 study nests were found at the early stages of incubation. The following season ( ) three nests were found with freshly laid single eggs on 29, 30 September and 3 October. The guard stage lasted for 46 days on average (N=32, SD=7.9, range=32-63), after which chicks were usually unattended during the day. Ten of the 34 broods at Middle Bay were regularly found with neighbouring chicks. These involved no more than three broods, although on one occasion 7 chicks were found together at Sandy Bay. CHICK SURVIVAL The survival of 66 chicks was followed. During the first 10 days after hatching six chicks died, causing the failure of four nests. Subsequently, there were no confirmed deaths until days 94 and 108, during the fledging period. However, there were two early disappearances of chicks on day 70 and 86, which were probably deaths. Their siblings departed 31 and 20 days later respectively. Thus, 56 (85%) of the original 66 chicks which hatched to leave the breeding area, and 32 (89%) of the 36 nests with chicks were successful (Table 8). The overall success of each nesting attempt was 76%, with 70% of all eggs leading to a fledged chick. The average number of chicks surviving per breeding pair was 1.4. Nearly two-thirds (61%) of nests produced two chicks, 15% produced one chick, while 24% failed completely. When a chick disappeared from the study area we assumed it had departed for sea. Although some may have died without being found, only two corpses were discovered during the fledging period. Two other chicks became very emaciated. One declined from 4.8kg on day 65 to 3.0kg on day 110 when it was last seen. The other chick was 3.5kg on 3.7kg on day 91. Their siblings were heavier, but still relatively light for their age, being respectively 4.0kg on day 100 and 3.8kg on day 81. Despite extensive searches no corpses of these chicks were found. If they had died before entering the sea the minimum fledging success for Middle Bay would have been 52 (79%) of 66 chicks hatched, 41 chicks (64%) of 64 eggs laid, 23 nests (70%) of 33 nesting attempts and 1.24 chicks per nest. Three of the four early nest failures occurred after the disappearance of one of the adults. Both the confirmed chick deaths late in the breeding season also coincided with an adult disappearing. At least one of the remaining adults was able to rear a single offspring as the chick was later seen as a juvenile. One of the broods which lost weight was also a result of the death of a parent. Therefore, of 10 broods that did poorly, six had apparently become single-parent nests. Most chicks had a few parasitic ticks on their heads or body. These were Ixodes uriae (pers. comm. A. Heath, Wallaceville Animal Research Centre, M.A.F. Upper Hutt). CHICK DEPARTURE The average age of chicks at departure to sea was approximately 108 days with a range of 97 to 119 days. Only two chicks could be assigned to an exact day of departure. The others were estimated on the basis of fresh sign and the interval between the last sighting and the next visit to the study area five days later. Therefore the error was +/- 2.5, if not more for some chicks which eluded observation with their increasing 39
43 mobility close to fledging. The difference in departure of siblings was approximately 3 days (S.D.=4.3), with a range of 0-13 days. The overall mean date of departure was 13 March (S.D.=7.9), with a range of 30 days from 28 February to 28 March. JUVENILE SIGHTINGS During mid-february, when chicks were approximately 80 days old, flipper bands were applied to 141 chicks. Banding totals were 63 chicks at Middle Bay, 65 elsewhere in Northwest Bay, 10 at Southeast Harbour and three at Perseverance Harbour. Twelve juveniles that were banded as chicks were seen between April and September. Three were seen twice, and another was seen six times during Middle Bay beach counts. Apart from five unidentified banded chicks leaving for their first swim at Middle Bay, there were only two sightings of unidentified banded juveniles. At Middle Bay, if 56 (94.1%) of 59 banded chicks fledged, we can assume that 133 of the 141 banded chicks entered the sea. Thus 12 sightings of juveniles represents 9.0% of the fledglings. Of the Middle Bay chicks 7 (12.5%) were later seen as juveniles. Most sightings of juveniles were in Northwest Bay, usually at or within 400m of their natal landing sites. One Perseverance Harbour juvenile was also near its natal area. The most distant records were of two Middle Bay juveniles at Southeast Harbour in June, a distance of 24km by sea from their natal area Adult Survival There was only one confirmed death of a banded adult during the study. This was found dead in February on the track leading to its nest. Its stomach was almost empty and at it was lkg lighter than it was in October. An estimate of adult survival (Fig. 14, Appendix 7 and 8 -column C) was attempted by reading the band numbers of birds moving to and from the beach at Middle Bay. From October to March this was supplemented by sightings at the nests, particularly in the first half of the breeding season before the guard stage ended. Therefore disappearances became readily apparent. Band records became less reliable after March as they only came from the two days of observation each month. April's records were particularly poor because most birds were inland moulting at the time. Subsequently, birds were positively identified each month. Banded birds were very faithful to the two Middle Bay landing sites and none were recorded elsewhere until August when sea lion disturbance caused some birds to land at other sites in Northwest Bay. These individuals were later recorded back at Middle Bay. During the year every banded bird was missed for at least one set of monthly counts as it was not possible to read the bands of all the birds (Appendix 7). Of the 78 adults banded, 33 were missed for only one month at a time, 20 for two consecutive months, 12 for three and 13 for four or more months (up to a maximum of 11 months). One estimate of is to assume that a bird missing for three or more consecutive months of counts was dead. Thus, at the end of the study, birds missing in July, August and September or in earlier months were dead. This gives an estimate for survival from October 1987 to September 1988 of 58 (74.4%) of the original 78 banded adults. 40
44 41
45 This is possibly an underestimate because during the year four birds were re-sighted after a three month gap and another after a four month gap, although all these incorporated April into their period out of the record, when few birds were identified anyway. A more conservative estimate of mortality would be up to June when 12 birds had disappeared and were not subsequently recorded. Thus 66 (84.6%) birds had survived 12 months. There is evidence, however, that the mortality rate may have accelerated from July to September because a sea lion was seen preying on penguins at Middle Bay in August and fresh remains were found in September. Thus, even the 74.4% survival estimate may actually be an overestimate for the year as it cannot account for mortality in August and September. The numbers of penguins at Middle Bay remained very low in 1989 (P. Hatfield pers. comm.). The top line in Fig. 14 illustrates the adult survival or disappearance rates that have been described above. The dashed line shows the proportion of the number originally banded (column B, Appendix 8). The trend downwards between the peaks in February-March and June is similar to the estimated survivorship curve. The low points occurred in November (half the birds were ashore incubating during any one count), April (most adults were ashore moulting) and September (adults were nest building and/or disturbed by sea lion activity). Two birds banded as chicks in February 1984 were recorded during the study. One bred successfully at Capstan Cove in and nested at the same site the following season. 3.5 DISCUSSION The former nesting habitat of the yellow-eyed penguin on the mainland of New Zealand was the cool coastal podocarp/hardwood forests (Seddon 1988). Forest clearance has led to a variety of alternative nesting habitats such as scrub or flax. These are possibly sub-optimal habitats because of higher levels of heat stress experienced by penguins (Darby pers. comm.). On Campbell Island there has never been a forest cover, and the main nesting habitat for yellow-eyed penguins is the coastal scrub associations, dominated by Dracophyllum. Heat stress is not a problem there because of the cool climate and density of the scrub. Because nesting yellow-eyed penguins require visual isolation from their neighbours (Seddon 1988), the density of nests is determined by the degree of concealment provided by the vegetation. Thus, the mean density of 1.6 pairs per hectare (Darby 1985) varies between 1/ha for unmodified forest to 4/ha for flax pasture/tussock (Darby pers. comm.). The Middle Bay density of 3.8 pairs/ha is at the high end of the mainland scale. Northwest Bay (including Middle Bay), at 249 birds per accessible kilometre of coastline, was the densest population on Campbell Island. Using the ratio between these two figures, other dense areas, such as Southeast Harbour and Shag Point would have accommodated 2.6 and 3.1 pairs/ha. The dispersed populations at Northeast and Perseverance Harbours would have been pairs/ha. Thus, the mean for the populated parts of the island may have been about 1.5 pairs/ha which is similar to the mainland figure. Seddon (1988) found nesting densities highest in scrub (mean internest distance 11.6m) and lowest in forest (31.8). The Middle Bay figure of 22 m between 42
46 nests falls between these two extremes, presumably because the Campbell Island scrub provided less lateral concealment between nests than the scrub in Seddon's study (i.e. it was more forest-like). Most penguins on Campbell Island nested within 500m of the shore, as they do on the mainland (Seddon 1988), although there are records of nests up to 1.6km inland (Darby pers. comm.). Seddon (1988) also found that over 90% of nests had some sort of solid back to them, and it was the form of the plant cover rather than the species that was important. The breeding season of yellow-eyed penguins on Campbell Island was similar in structure but one or two weeks later than on the mainland. The mean hatching date of 26 November compares with 9 November (Richdale 1957) or 18 November (van Heezik 1988). Allowing for an incubation period figure of 43.5 days (Richdale 1957), Campbell Is. laying dates would have ranged from 8-21 October. However, at the beginning of the season some eggs were laid as early as 29 September. Variation in dates is expected with the incubation period ranging from days (Seddon 1988). Also, mean laying dates on the mainland can vary between seasons by up to 10 days and range from 11 September to 22 October (Darby pers. comm.). The average Campbell Island chick departure day of 108 days was similar to mainland figures of 106 days (Richdale 1957) and 103 days (Darby pers. comm.). Breeding success on Campbell Island is compared with available figures from the mainland in Table 9. 43
47 TABLE 9: COMPARISON OF BREEDING SUCCESS OF YELLOW-EYED PENGUIN ON CAMPBELL ISLAND AND THE MAINLAND SUCCESS CATEGORY A B C D E F % NESTS WITH 2 EGGS % EGGS THAT HATCH % EGGS THAT FLEDGE CHICKS % CHICKS THAT FLEDGE % NESTS THAT FLEDGE CHICKS MEAN NO. CHICKS/NEST # Refs. A: Campbell Island, 1 season nests B: Richdale (1957), 16 seasons eggs C: Roberts and Roberts (1973) 1 season nests chick success up to 10 weeks only D: Lalas (1985) 2 seasons nests E: Darby (pers. comm.) 4 seasons nests F: Seddon (1988) 2 seasons nests Yellow-eyed penguins on Campbell Island in were relatively successful compared with most statistics available from the mainland. Comparable figures occurred in relatively good seasons, or in areas where predation was low. For example, was Richdale's most successful season, with 88% eggs hatching and 91 % of chicks being reared. In contrast, in % of eggs hatched but only 45% of chicks survived. Darby's (pers. comm.) figures from the early 1980's were also high and occurred at a time when predation levels were low. In following seasons in some of the same study areas Seddon (1988) found a lower level of breeding success. He attributed this to heavier grazing by stock favouring rabbits, which in turn allowed a population increase of their predators, particularly ferrets. As a consequence, predation on yellow-eyed penguin chicks increased. The Campbell Island figure of 1.4 chicks per nest probably reflects a lack of predation by cats, which are rare, or rats, which do not appear to be a problem. Although there was no evidence of predation at Middle Bay, one pair of birds at Sandy Bay was found incubating a decapitated corpse and the adjacent nest soon lost its chicks without trace. Richdale (1957) described chick mortality factors as crushing by parents in the first week, excessive rain, stoats and ferrets, dogs (in the post-guard stage) and food shortage. On Campbell Island most losses were probably a result of accidents at the nest, poor parenting, parental death or disappearances, and starvation. 44
48 The survivorship of Campbell Island chicks showed that 9% died in the first 10 days, none were lost up to 70 days and a final 6% were lost up to departure. Richdale (1957) found that 21% of chicks were lost in the first 7 weeks and the other 3% loss occurred after 11 weeks. Similarly Seddon (1988) found 43% of chicks died in the first 6 weeks and 2% died subsequently. The main difference on Campbell Island was the high survival rate of chicks during the guard stage. Chicks on the mainland are most vulnerable to predation during this period (Seddon 1988). Ten of the 34 broods at Middle Bay regularly gathered together with neighbouring chicks during the post-guard stage. These aggregations, or creches, are considered to be rare on the mainland (Darby pers. comm.). The yellow-eyed penguin's level of production of 1.4 chicks per breeding pair is high compared with other penguin species which normally have two eggs. For example, Adelie penguins produce 0.8 chicks per pair (Ainley et al. 1983), royals 0.5 (Carrick 1972), gentoo 0.7 (Croxall and Prince 1979) or 1.0 (Robertson 1986), and rockhoppers 0.5 (pers. obs season, Campbell Island). During the Campbell Island study estimated adult was 74-85%. Richdale's (1957) annual survival level was 87%, although in some years it was as low as 76%. In his particular study areas there was an increase in nests from 36 in 1938 to 82 in 1952, largely a result of a period of particularly high adult survival and breeding success (Richdale 1957). This may explain why survivorship was higher than a stable population of Adelie penguins, which had a 70% survivorship level (Ainley and DeMaster 1980). This low survivorship level of Adelies was partly a result of higher levels of predation than experienced by yellow-eyed penguins. Survival of adults at Middle Bay was probably low as a result of the local effects of a Hooker's sea lion (Neophoca hookeri) that had learnt to ambush penguins in the shallows as they came ashore. Chases by other sea lions were very rare and in all cases the penguins managed to avoid capture using greater manoeuvrability rather than speed. Previous reports of predation of yellow-eyed penguins by sea lions are very infrequent (Ainley and DeMaster 1980). The influence of parasitic ticks on yellow-eyed penguins is unknown. They have never been found on adults on the mainland but rarely the tick Ixodes eudyptidis is found on chicks where nests are close to other penguin species (Darby pers. comm.). In contrast, the tick I. uriae was commonly found on chicks and adults on Campbell Island. This species is found in the New Zealand subantarctic and has been recorded previously from yellow-eyed penguin hosts on Campbell Island (Dumbleton 1953). Potentially, ticks can spread viruses amongst birds (A. Heath pers. comm.) but there was no evidence of disease on Campbell Island in
49 CHAPTER 4. SIZE AND GROWTH 4.1 BACKGROUND Studies of yellow-eyed penguins on the mainland of New Zealand have involved collecting morphometric data of adults (Richdale 1951, Darby unpub. data) and growing chicks (Richdale 1957, van Heezik 1988). Male and female yellow-eyed penguins are similar in body size and therefore difficult to tell apart visually. Richdale (1951) found that the sex of yellow-eyed penguins could not be distinguished by plumage characteristics and the only certain way was to examine the vents of pairs during egg deposition. He described 11 criteria which were useful indications of sex, such as weights or nesting behaviour, depending on the time of the year. From the end of the incubation period to mid-winter small birds are usually females and large birds are males, but measurements and weights overlap. By analysing the measurements of dead penguins (sexed by dissection) Darby (pers. comm.) has found that the head length (from back of head to tip of bill) and foot length (from back of heel to tip of mid-toe pad) are reliable measurements for determining sex in the field. Males have significantly larger proportions than females although there is some overlap (Darby unpub. data). 4.2 AIMS Two aims of the study of yellow-eyed penguins on Campbell Island were to collect information on the size of adults to allow comparison with the mainland birds, and similarly, determine the rates and extent of chick growth. This information is of value in helping to determine the status and productivity of the population. 4.3 METHODS Adult Measurements Adults were captured at the nest and morphometric data collected using vernier calipers for: Bill length - length of upper mandible (culmen); Bill width -maximum width of culmen; Bill depth - depth of bill at the point of diversion of the two lower mandibular rami; Head length -length from bill tip to occipital condyle of skull; Foot length (to pad) -length of foot from back of heel to end of pad of middle toe (i.e. tarsus + middle toe); Foot length (to claw) -as above, to the end of the claw; Flipper length -length of extended flipper from the ball of the humerus to tip of wing, measured using a tape measure; 46
50 Additional measurements were taken of some birds but were discontinued to reduce disturbance of birds. These measurements were: Tarsus length - bottom of heel to proximal end of tarsus; Mid-toe length -length of toe to end of claw; Weight - measured with spring balance; Both adults of each breeding pair were measured, usually on separate visits to the nest Egg Measurements Maximum lengths and widths of eggs were measured for several clutches, but only at selected study nests to limit disturbance Chick Growth The growth of 25 chicks from 14 nests were monitored from the time of hatching to approximately 100 days of age. Measurements taken were bill length, width and depth, head length, flipper length, foot length (to claw) and weight. These data were collected every 5 days until about 80 days after hatching, and subsequently every 10 days. 4.4 RESULTS Adult Size The dimensions of 78 adult yellow-eyed penguins are shown in Table 10, Figs and Appendix 9. Observations early in the breeding season to identify the sex of each bird was not possible. Therefore it was assumed that of each breeding pair the bird with the larger dimensions was male, as is generally the case on the mainland (Darby pers. comm.). This gives an indication of the range of sizes and the degree of difference for each sex in the dimensions measured. 47
51 48
52 49
53 50
54 51
55 52
56 53
57 TABLE 10 : ADULT YELLOW-EYED PENGUIN MEASUREMENTS, MIDDLE BAY DIMENSIONS (mm) MALE * FEMALE* TOTAL MEASURE MEAN S.D. N MEAN S.D. N MEAN S.D. N Bill length Bill depth Bill width Head length Flipper length Foot length (pad) Foot length (claw) Tarsus length Toe length Weight (kg) Key * : sex assumed from the comparison of dimension between partners of a breeding pair, males having the larger dimensions. The data for the 39 males and 39 females were compared using two-tailed t-tests. For the seven main variables and the weight the sexes showed significant differences (p<0.001), did the toe (p<0.01) and tarsus (p<0.05) measurements. From data collected while studying chick growth, where nearly full-grown individuals were measured regularly, it was found that the least accurate measurements were the flipper and the foot. These needed to be extended fully for the measurement Egg Size Twenty-one eggs from 11 nests were measured on The mean dimensions were: length 75.0mm (S.D.= 1.72, range ); width 57.0mm (S.D.=1.48, range ); 54
58 4.4.3 Chick Growth Twenty-five chicks were chosen for the growth study. Twelve hatched on the same day and the other 13 hatched on a variety of days. In the analysis to produce the growth graphs (Figs ) the means represent data grouped into five day intervals (Appendix 10), except for the first data point which represents 0-2 days after hatching. Thus, the groupings are 3-7 (= day 5), 8-12 (= day 10), (day 15) etc. After day 80 the sample sizes become smaller than 25 because measurements were taken at 10 day intervals instead of five, some chicks fledged earlier than others, some died, disappeared, or were not located on a particular visit. Table 11 shows the mean values for the final measurements of all 25 chicks, irrespective of their age, to give an idea of weights and measures at fledging. These figures actually correspond closely to the means in Figs at day 100, which was close to the mean departure day. Table 11: FLEDGING MEASUREMENTS OF YELLOW-EYED PENGUIN CHICKS Final measurement of 25 chicks before fledging Dimension MEAN RANGE S.D. Bill length (mm) Bill depth (mm) Bill width (mm) Head length (mm) Flipper length (mm) Foot length (mm) Weight (kg) A comparison of the growth rates of four body dimensions of yellow-eyed penguin chicks is shown in Fig. 21. Foot length was first to reach an asymptote after 35 days. Flipper length began to slow in growth rate by 50 days, whereas head and bill lengths tended to grow at a more even rate, which slowed after 85 days. The bill measurements continued to increase in length up to fledging. BILL LENGTH (Fig. 22) The growth curve for bill length is a shallow sigmoidal curve. The most rapid period of exponential growth was between days 5-20, averaging 0.62mm/day. The curve shows a gradual slowing of the rate of growth and by day 80 the mean length of 48.7mm was approaching an asymptote. The mean final measurement for the 25 chick sample was 50.1 (Table 11), which compares with the mean adult measurement of 53.6 mm (Table 10). 55
59 56
60 57
61 58
62 59
63 BILL DEPTH (Fig. 23) Exponential growth in bill depth was up to day 20, with daily increments of from day 5. There was a gradual decrease in growth rate until fledging. Thus, by day 110 bill depth was 18.6mm and the final measure of (Table 11) compares with the adult average of 20.0mm. BILL WIDTH (Fig. 24) The increase in bill width was more linear than the other measures, and by 105 days the average was 8.8mm. The mean final measure of all 25 chicks was 8.7mm compared with the adult average of 9.2mm. HEAD LENGTH (Fig. 25) Rate of head growth was a classic sigmoid curve. The exponential growth between days 5-20 was 2.2mm/day. There was a consistent slowing in rate until 80 days, when was close to an asymptote. By day 100 the average length was and the final measure was 136.7, which compares with the mean adult value of 138.9mm. FLIPPER LENGTH (Fig. 26) The flipper was quite close to an asymptotal length of 204mm by day 50. The fastest growth period was between days when 5.6mm/day were incremented. There was only a small amount of growth in the last 50 days, with some variation in the five day means of towards the end of the fledging period. The mean final measure was 209mm, which was actually longer than the adult mean of 207mm. This was possibly a result of inaccurate measuring or a difference in the rigidity of the flippers between adults and chicks. Because of the problem of straightening out the flipper for measurement, some individual errors of up to 3mm occurred during the period of slow growth close to fledging. FOOT LENGTH (Fig. 27) The foot approached an asymptotal length of 128.2mm at only 35 days after hatching. The fastest growth of 4.0mm/day occurred from day In the next 65 days only 9mm or so was added, and was reached after 100 days. The mean final measure was 136.0mm (Table 11), which was longer than the average adult measure of 132.3mm, presumably because of lack of wear of chick claws. As with the flipper, the need to flatten out the foot carefully for measurement led to individual errors but generally they were only 1mm. WEIGHT (Fig. 28) The most variable measure taken was the weight as this depended on the time since feeding for any individual. Chicks were weighed in the same order at a similar time of day each visit to limit some of the potential variation. 60
64 As with most of the above measures, exponential growth occurred in the first 20 days, and the rate for days was 99g/day. From days weight gain slowed gradually (71g/day overall) to a mean weight of 3.3kg. This may have been caused by a period of poor feeding for the adults, since some chicks actually lost g over a five day interval. Over the next 15 days to day 60 there was accelerated growth of 103g/day to an asymptotal level of 4.9kg. From days mean weights fluctuated between kg. The range during the final period was from 3.0kg (on day 110 for a bird that declined from 4.8kg on day 65) to 6.15kg (for another individual on day 101). Although most individuals showed a decline from a peak weight at about day 65, before increasing in weight before fledging, some did not show this final increase. The mean final weight for all 25 chicks was 5.1kg (Table 11). 4.5 DISCUSSION A comparison of the available data of adult size is given in Table 12. The evidence for similarity, or otherwise, between birds on Campbell Island and mainland New Zealand is conflicting because of the variability of results between different studies. The head and feet measurements made by Darby (unpub. data) are very similar to the Campbell Island data of this study. So too are bill measurements made by A. Garrick (unpub. data) on Campbell Island in 1984, although his bill width measurements (not presented in Table 12) do differ. Other studies on the mainland present figures that are mostly longer than the results found in this study. If it is assumed that Darby's figures are the most reliable, because of his considerable experience in curating at Otago Museum, then the evidence suggests that there is no difference in adult size between Campbell Island and the mainland. The other differences may reflect variations in measuring technique between the observers. Although there seems to be no morphometric separation, there is recent evidence that the Campbell Island yellow-eyed penguin population is genetically distinct from both the Auckland Islands and the mainland populations (Triggs and Darby 1989). They showed that there are very low migration rates between the subantarctic and the mainland. This has important management implications when considering the population decline on the mainland. Because the sub-populations are essentially isolated from each other, the mainland will not be "topped up" with birds from the subantarctic. The relationship of Stewart Island and Codfish Island yellow-eyed penguin populations is yet to be tested (Triggs and Darby 1989). Patterns of growth of chicks on Campbell Island were similar to that found by Richdale (1957) and van Heezik (1988). Van Heezik found that the speed of development was fastest for the foot, followed by the flipper, head, bill and weight in descending order. Although van Heezik's data for foot+claw length (mean=137.7mm, S.D.=4.4) and bill depth (18.0mm, S.D.=0.7) were very similar to the Campbell Island results (Table 11), bill length (53.8mm, S.D.=1.7) and head length (142.9mm, S.D.=40) were significantly longer. Flipper lengths were also much longer but probably because her measurements were taken from the body rather than from the proximal bulge of the humerus. 61
65 TABLE 12: COMPARISON OF RESULTS OF YELLOW-EYED PENGUIN MORPHOMETRIC STUDIES ADULT MEASUREMENT (mm) Campbell Island South Island Reference A B C D E F BILL LENGTH Male * S.D N Female ** S.D N Total *** S.D N BILL DEPTH Total ** S.D N HEAD LENGTH Male *** S.D N Female S.D N Total *** S.D N FOOT LENGTH Male (to pad) S.D N Female S.D N Total S.D N FOOT LENGTH Total *** (+ claw) S.D N Key: * significantly different (p<0.05) from Campbell Island results ** (p<0.01) *** (p<0.001) References A: this study B: Garrick (unpub. data, 1984) C: Richdale (1951) D: Darby (unpub. data) E: van Heezik (1988) F: Seddon (1988) 62
66 The graphs of chick growth presented in this study should provide reliable estimates of chick ages for future workers on Campbell Island. Comparisons of weights at these ages would also be possible because van Heezik (1988) found that the growth rates of morphometric parameters varied very little between seasons, even when there were large variations in average weights. On the mainland there was no difference in growth rates between siblings or between one and two-chick broods (van Heezik 1988). This seems to be the case on Campbell Island also, although there were only three single chicks in the 25 chick sample studied. Van Heezik (1988) suggested that the yellow-eyed penguin has adapted to a predictable and abundant food supply. This is shown by the fact that in years of poor food supply the rates of chick growth do not change and broods are still mostly of two chicks rather than one. Therefore, yellow-eyed penguins cannot compensate for the occasional collapse of their food supply, which has apparently occurred more frequently in recent years. Recovery in subsequent seasons is inhibited by other pressures on the dwindling mainland population. Although the fledging success of Campbell Island chicks was relatively high compared with the mainland (Chapter 3), the mean departure weight of 5.1kg (range kg) was significantly less (p<0.05) than the mainland average of 5.9kg ( , S.D.=0.7, N=73) (Darby unpub. data). Richdale's (1957) study also found a fledging weight for "normal" chicks of 5.9kg ( , N=24). There are variations between seasons though, for example, in three seasons of study on the mainland average fledging weights declined from 6.1 to 4.4kg (van Heezik 1988). The proportion of juveniles seen the next season also declined, and survivors of the second season had fledged at a higher average weight than chicks that were not seen again. This lead van Heezik to suggest that chicks that fledge at less than 4.0kg are unlikely to survive, although she could not prove a threshold weight existed. In contrast to these results, in (the same season as this study) on the mainland, there was a low fledging weight of 4.8kg (S.D.=0.7) but higher than usual juvenile survival of about 50% (Darby unpub. Data). It is possible that low fledging weights maybe a feature of the subantarctic. For example, Darby (pers. comm.) found low chick weights on the Auckland Islands in However, in February 1984 on Campbell Island A. Garrick (pers. comm.) found chicks which were about 1 kg heavier than those at a comparable stage in These data and the earlier discussion indicate that the fledging weights on Campbell Island were part of the normal annual variation. They may have been low enough to affect juvenile survival if other factors such as a poor winter food supply occurred. 63
67 CHAPTER 5. CONCLUSIONS The Campbell Island population of yellow-eyed penguins would appear to be in a healthy state, although data from one year of study can only provide a basis for comparison with future work. The estimated population of birds is substantially more than previously predicted for the island. With the decline and instability of the South Island population, the Campbell Island component has become very important and represents about 35% of the estimated total population. Breeding success of the penguins was relatively high compared with the mainland, probably as a result of low levels of predation. Adult measurements and patterns of chick growth were similar to that found on the mainland. 64
68 6.1. POPULATION TRENDS CHAPTER 6. RECOMMENDATIONS Campbell Island yellow-eyed penguin population trends need to be monitored. Counts of key landing sites should be made regularly, preferably in November and May, to compare with results from Small-scale monitoring could be achieved by keen, reliable Meteorological Station staff (see Appendix 10 for guidelines). More intensive counting should be conducted every few years to gauge changes in the population BREEDING SUCCESS Further monitoring of penguin breeding success would show any annual variation. Banding of chicks would give information on recruitment, survival and possible movements to other parts of the species range. Survivorship of birds banded in should be monitored DIETARY ANALYSIS No diet studies were conducted in There is a need to determine the foods of Campbell Island birds to see if they differ from that eaten in the South Island and if there is any potential competition with rockhopper penguins or other birds POPULATION MONITORING IN OTHER PARTS OF RANGE More complete surveys of Auckland, Stewart and Codfish islands are essential to determine the overall population and breeding status of the species. It is important have good baseline data to detect population changes and to determine the extent of the decline that is occurring on the mainland. ACKNOWLEDGEMENTS We would like to thank the Meteorological Service team of Scott Freeman, Karl Anderson, Robyn Pope, Wendy Strid, Rob Crawley and Neil Gunn for their occasional field assistance, company and patience with our frequent comings and goings from "home". We are also grateful to the Ministry of Transport for use of the Beeman Cove hostel facilities. Thanks are extended for the moral, advisory and logistical support from our Department of Conservation colleagues, particularly Duncan Cunningham, Phil Moors (Science and Research Directorate), Lou Sanson and Andy Cox (Mirihiku District). Special thanks go to John Darby (Otago Museum) for his interest, information and ideas for the study, and to the penguins themselves for their cooperation. We also thank Andy Associates, Rotorua) for use of unpublished data. Drafts of this report were commented on by Phil Moors, Duncan Cunningham, Ralph Powlesland, Chris Robertson, Don Newman, Murray Williams and Richard Sadleir. 65
69 REFERENCES AINLEY, D.G.; DEMASTER, D.P., 1980: and mortality in a population of Adelie Penguins. Ecology 61(3): AINLEY, D.G.; LERESCHE, R.E.; SLADEN, J.L. 1983: Breeding biology of the Adelie penguin. University of California Press. Berkeley, Los Angeles, London. 240p. BAILEY, A.M.; SORENSEN, J.H., 1962: Subantarctic Campbell Island. Proceedings No. 10, Denver Museum of Natural History. 305p. BARTLE, J.A.; PAULIN, C.D., 1986: Bird observations, Auckland Island, December In: A Penniket, A Garrick, E. Breese (Compilers); Preliminary reports of expeditions to the Auckland Islands Nature Reserve Department of Lands and Survey, New Zealand. Reserve series No. ISSN : BELL, B.D., 1986: The conservation status of New Zealand Wildlife. New Zealand Wildlife Service Occasional Publication No p. CARRICK, R., 1972: Population ecology of the Australian black-backed magpie, royal penguin, and silver gull. In: Population Ecology of Migratory Birds. United States Department of the Interior, Wildlife Research Report 2: CHALLIES, C.N., 1975: Feral pigs (Sus scofa) on Auckland Island: status, and effects on vegetation and nesting sea birds. New Zealand Journal of Zoology 2(4): CROXALL, J.P.; PRINCE, P.A., 1979: Antarctic seabird and seal monitoring studies. Polar Record 19(123): CULLEN, D.J., 1971: Campbell Island, provisional bathymetry. N.Z. Oceanographic Institute Chart Series 1:200,000. DARBY, J.T., 1984: Interim report on the status, distribution and conservation of the yellow-eyed penguin Megadyptes antipodes in New Zealand together with a detailed summary of population numbers and distribution on the South-east Otago and Southland coasts. Unpublished report, Otago Museum, Dunedin. DARBY, J.T., 1985: The great yellow-eyed penguin count. Forest and Bird 16(2): DARBY, J.T., 1986: Report on yellow-eyed penguin research: 31 March 1985 to 31 March Unpublished report. DUMBLETON, L.J., 1953: The ticks (Ixodoidea) of the New Zealand sub-region. Cape Expedition Series Bulletin No. 14. DSIR. Wellington. FALLA, R.A.; SIBSON, R.B.; TURBOTT, E.G., 1978: The new guide to the birds of New Zelanad. Collins, Auckland and London. 66
70 FILHOL, H., 1885: Oiseaux. Mission de l Ile Campbell, passage de Venus sur le soleil tome III Ile partie, Academie des Sciences, Paris: JOUVENTIN, P.,: Visual and vocal signals in penguins; their evolution and adaptive characters. Verlag Paul Parey. Berlin and Hamburg. KING, W.B., 1981: Endangered birds of the world. The ICBP Red Data Book. Smithsonian Institution Press. LALAS, C., 1985: Management Strategy for the conservation of yellow-eyed penguins in Otago Reserves. Draft report, Department of Lands and Survey, Dunedin. 196p. MULLER-SCHWARZE, D., 1984: The behaviour of penguins adapted to ice and tropics. State University of New York Press, Albany. 193p. NEW ZEALAND WILDLIFE SERVICE 1986: Yellow-eyed penguin Megadyptes antipodes. Draft Species Recovery Plan. Department of Internal Affairs, Dunedin. 115p. RICHDALE, L.E., 1951: Sexual behaviour in penguins. University of Kansas Press, Lawrence, Kansas. 316p. RICHDALE, L.E., 1957: A population study of penguins. Clarendon Press, Oxford. 195p. ROBERTS, C.L.; ROBERTS, S.L., 1973: Survival rate of yellow-eyed penguin eggs and chicks on the Otago peninsula. Notornis 20: 1-5. ROBERTSON, G., 1986: Population size and breeding success of the gentoo penguin, Pygoscelis papua, at Macquarie Island. Australian Wildlife Research 13: ROBERTSON, C.J.R.; BELL, B.D., 1984: Seabird status and conservation in the New Zealand region. In: J.P. Croxall, P.G.H. Evans, R.W. Schreiber (eds); Status and conservation of the world's seabirds. ICBP Technical Publication No p. SEDDON, P.J., 1988: Patterns of behaviour and nest site selection in the yellow-eyed penguin (Megadyptes antipodes). Unpublished PhD thesis, University of Otago, Dunedin. 148p. SMITH, R.A., 1987: Biogeography of a rare species -the yellow-eyed penguin (Megadyptes antipodes). Unpublished BSc (Honours) dissertation, University of Otago, Dunedin. 148p. SORENSEN, J.H., Unpublished personal diaries, Nos. 1-3 and general notes. Department of Conservation library, Wellington. STONEHOUSE, B., 1970: Adaptation in polar and subpolar penguins (Spheniscidae). In: Holgate, M.W. (ed.) Antarctic Ecology Vol. 1: Academic Press, London. 67
71 TAYLOR, G.A., 1986: The ecology of Norway rats on Campbell Island, Vol. 2. Unpublished report, Ecology Division, D.S.I.R., Nelson. TRIGGS, S; DARBY, J., 1989: Genetics and conservation of yellow-eyed penguin: an interim report. Science and Research Internal Report No. 43, Department of Conservation. VALLE, C.A., 1986: Status of the Galapagos penguin and flightless cormorant populations in Noticias de Galapagos 43: VALLE, C.A.; COULTER, M.C., 1987: Present status of the flightless cormorant, Galapagos penguin and greater flamingo populations in the Galapagos Islands, Equador, after the El Nino. The Condor 89: VAN HEEZIK, Y., 1988: The growth and diet of the yellow-eyed penguin Megadyptes antipodes. Unpublished PhD thesis, University of Otago, Dunedin. 179p. WARHAM, J.; SPURR, E.B.; CLARK, W.C., 1986: Research on penguins in New Zealand. Wildlife Research Liaison Group Research Review No p. WESTERSKOV, Birds of Campbell Island. Wildlife Publication No. 61. New Zealand Department of Internal Affairs. 83p. 68
72 APPENDICES APPENDIX 1: NUMBERS OF YELLOW-EYED PENGUINS AT NORTHWEST BAY COUNTS OF PENGUINS LANDING NOV FEB MAY AUG SITE Ad J Tot Ad J Tot Ad J Tot Ad J Tot NW NW-2 * NW-3 * NW NW NW NW-7 * NW-8 * NW NW-10 * NW-11 * NW-12 * NW-13 * NW NW NW NW SUB-TOTAL TOTAL (all sites) KEY Sub-total * : sites (*) that were counted four times during year Total : all the landing sites in May Ad : Adult J : Juvenile NW-11 : Landing site identification number (Fig. 2) 69
73 APPENDIX 2: NUMBERS OF YELLOW-EYED PENGUINS AT SOUTHEAST HARBOUR COUNTS OF PENGUINS LANDING NOV FEB MAY AUG SITE Ad J Tot Ad J Tot Ad J Tot Ad J Tot SE SE SE SE SE-5 * SE SE SE SE SE SE-11 * SE-12 * SE SE SE SE SUB-TOTAL TOTAL (all sites) KEY Sub-total * : sites (*) that were counted four times during year Total : all the landing sites in May Ad : Adult J : Juvenile NW-11 : Landing site identification number (Fig. 2) 70
74 APPENDIX 3: YELLOW-EYED PENGUIN COUNTS AT MIDDLE BAY COUNTS AT MAIN LANDING SITE EAST ROCKS COMBINED TOTALS BOTH SITES DATE ADULT JUV TOT MEAN ADULT TOT MEAN OUT IN OUT IN OUT IN OUT IN OUT IN OUT IN OUT IN OUT IN OUT IN OUT OUT IN OUT IN OUT OUT IN OUT IN IN OUT OUT IN OUT IN
75 APPENDIX 3 continued COUNTS AT MAIN LANDING SITE EAST ROCKS COMBINED TOTALS BOTH SITES DATE ADULT JUV TOT MEAN ADULT JUV TOT MEAN OUT IN OUT IN OUT IN OUT IN OUT IN OUT IN OUT IN OUT IN IN
76 APPENDIX 4: DAILY MOVEMENTS OF YELLOW-EYED PENGUINS DEPARTURES ARRIVALS MEAN TIME AT SEA Mean Time Mean Time (Hour: Minute) Std Dev Std Dev OUT-1 OUT-2 OUT-3 OUT-T N N to to to to IN-1 IN-2 IN-3 IN-T OUT-1 OUT-2 OUT-T IN-1 IN-2 IN-T NOV : DEC :18 5:35 14:16 17: JAN :31 2:43 13:22 10: FEB :38 2:43 13:24 12: MAR :59 2:18 12:12 11: APR : MAY : JUN : JUL : AUG : SEP : KEY : OUT-1 = Main departure of penguins OUT-2 = Second departure OUT-T = Mean departure IN-1 = First arrival IN-2 = Main arrival IN-T = Mean arrival time TIME = Hours New Zealand Standard Time Std Dev = Standard Deviation N = Sample size over two days of observation The departure and arrival times in bold type are those graphed in Fig
77 APPENDIX 5: SUNRISE AND SUNSET TIMES COMPARED WITH YELLOW- EYED PENGUIN DEPARTURE AND ARRIVAL TIMES SUN- RISE TIME MEAN TIME OUT DEV. FIRST TIME OUT DEV. SUN- SET TIME MEAN TIME IN DEV. LAST TIME IN DEV. NOV DEC JAN FEB MAR APR MAY JUN JUL AUG SEP KEY Time : NZ Standard Time SUNRISE/SUNSET TIMES : provided by Carter Observatory, Wellington MEAN TIME OUT/IN: times of penguin departure and arrivals for December to March are means for OUT-1 and IN-2 (Appendix 4). All other months refer to OUT-T. FIRST TIME OUT : the earliest observed departure LAST TIME IN : the latest arrival for each month. DEV : The deviation in penguin departures and arrivals from sunrise and sunset times, expressed in minutes. 74
78 APPENDIX 6: HOURLY TOTALS OF YELLOW-EYED PENGUINS AT MIDDLE BAY NOVEMBER 1987 DECEMBER 1987 Time Mean Mean (NZST) OUT IN OUT IN OUT IN OUT IN OUT IN OUT IN TOTAL JANUARY 1987 FEBRUARY 1988 Time Mean Mean (NZST) OUT IN OUT IN OUT IN OUT IN OUT IN OUT IN TOTAL
79 MARCH 1988 APRIL 1988 Time Mean Mean (NZST) OUT IN OUT IN OUT IN OUT IN OUT IN OUT IN TOTAL MAY 1988 JUNE 1988 Time Mean Mean (NZST) OUT IN OUT IN OUT IN OUT IN OUT IN OUT IN TOTAL
80 JULY 1988 AUGUST 1988 Time Mean Mean (NZST) OUT IN OUT IN OUT IN OUT IN OUT IN OUT IN TOTAL SEPTEMBER 1988 Time Mean (NZST) OUT IN OUT IN OUT IN TOTAL
81 APPENDIX 7: BAND RECORDS OF YELLOW-EYED PENGUINS AT MIDDLE BAY
82 APPENDIX 7: ctd 79
83 APPENDIX 8: PROPORTION OF BANDED YELLOW-EYED PENGUINS AT 80
84 81
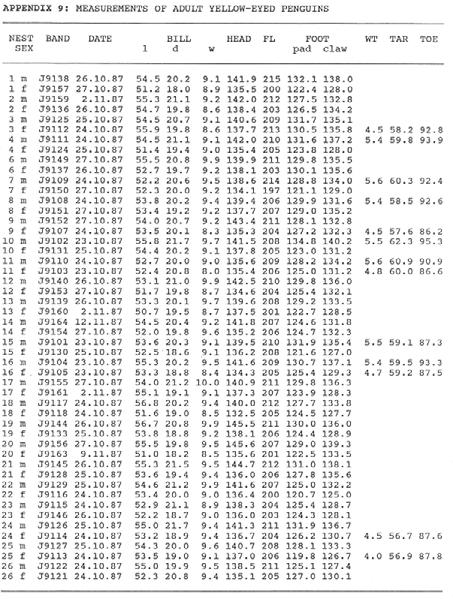
85 82
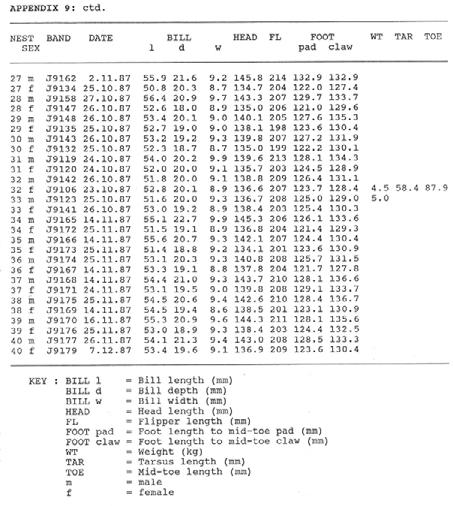
86 83
THE BLUE PENGUIN (Eudyptula minor) AT TAIAROA HEAD, OTAGO,
 AT TAIAROA HEAD, OTAGO,") SCIENCE & RESEARCH SERIES NO.86 THE BLUE PENGUIN (Eudyptula minor) AT TAIAROA HEAD, OTAGO, 1992-1993 by Lyndon Perriman and Bruce McKinlay Published by Head Office, Department of Conservation, P 0 Box
SCIENCE & RESEARCH SERIES NO.86 THE BLUE PENGUIN (Eudyptula minor) AT TAIAROA HEAD, OTAGO, 1992-1993 by Lyndon Perriman and Bruce McKinlay Published by Head Office, Department of Conservation, P 0 Box
Blue penguins (Eudyptula minor) at Taiaroa Head and the Otago Peninsula,
 at Taiaroa Head and the Otago Peninsula,") Blue penguins (Eudyptula minor) at Taiaroa Head and the Otago Peninsula, 1993 95 SCIENCE FOR CONSERVATION: 59 Lyndon Perriman Published by Department of Conservation P.O. Box 10-420 Wellington, New Zealand
Blue penguins (Eudyptula minor) at Taiaroa Head and the Otago Peninsula, 1993 95 SCIENCE FOR CONSERVATION: 59 Lyndon Perriman Published by Department of Conservation P.O. Box 10-420 Wellington, New Zealand
EXERCISE 14 Marine Birds at Sea World Name
 EXERCISE 14 Marine Birds at Sea World Name Section Polar and Equatorial Penguins Penguins Penguins are flightless birds that are mainly concentrated in the Southern Hemisphere. They were first discovered
Breeding Activity Peak Period Range Duration (days) Laying May May 2 to 26. Incubation Early May to mid June Early May to mid June 30 to 34
 Laying May May 2 to 26. Incubation Early May to mid June Early May to mid June 30 to 34") Snowy Owl Bubo scandiacus 1. INTRODUCTION s have a circumpolar distribution, breeding in Fennoscandia, Arctic Russia, Alaska, northern Canada and northeast Greenland. They are highly nomadic and may migrate
Snowy Owl Bubo scandiacus 1. INTRODUCTION s have a circumpolar distribution, breeding in Fennoscandia, Arctic Russia, Alaska, northern Canada and northeast Greenland. They are highly nomadic and may migrate
ISSN Department of Conservation. Reference to material in this report should be cited thus:
 ISSN 1171-9834 1993 Department of Conservation Reference to material in this report should be cited thus: Robertson, C.J.R., 1993. Timing of egg laying in the Royal Albatross (Diomedea epomophora) at Taiaroa
PROTECTING MANLY S PENGUINS
 PROTECTING MANLY S PENGUINS NATIONAL PARKS AND WILDLIFE SERVICES VOLUNTARY PENGUIN WARDEN PROGRAM CONFERENCE PRESENTATION WEDNESDAY JULY 23 RD 2008 BACKGROUND: LITTLE PENGUINS EUDYPTULA MINOR o Manly s
Pup 61 within seconds of being born in South Haven, 22 September 2012
 Pup 61 within seconds of being born in South Haven, 22 September 212 SUMMARY 182 pups were born on Skomer in 212, the highest total ever recorded, 18 in 1993 being the previous best. 31 pups were born
Tristan Darwin Project. Monitoring Guide. A Guide to Monitoring Albatross, Penguin and Seal Plots on Tristan and Nightingale
 Tristan Darwin Project Monitoring Guide A Guide to Monitoring Albatross, Penguin and Seal Plots on Tristan and Nightingale Atlantic Yellow-nosed albatross Biology The yellow-nosed albatross or molly lays
Fun Penguin Facts. Instructions. All About Reading Extension Ideas: All About Spelling Extension Ideas:
 There are many different species of penguins from small to large. Explore sixteen different penguins with your child as you make your own penguin fact booklet. Instructions 1. Cut out the penguin fact
What is the date at which most chicks would have been expected to fledge?
 CURLEW FAQs FACTS AND FIGURES AND ADVICE FOR THOSE WANTING TO HELP SUPPORT NESTING CURLEW ON THEIR LAND The Eurasian Curlew or, Numenius arquata, spends much of the year on coasts or estuaries, but migrates
12 The Pest Status and Biology of the Red-billed Quelea in the Bergville-Winterton Area of South Africa
 Workshop on Research Priorities for Migrant Pests of Agriculture in Southern Africa, Plant Protection Research Institute, Pretoria, South Africa, 24 26 March 1999. R. A. Cheke, L. J. Rosenberg and M. E.
FINAL Preliminary Report for CSP Project New Zealand sea lion monitoring at the Auckland Islands 2017/18
 FINAL Preliminary Report for CSP Project New Zealand sea lion monitoring at the Auckland Islands 2017/18 BPM-18-FINAL-Preliminary Report for CSP Project NZSL Auckland Island monitoring 2017-18 v1.1 26/01/2018
Conserving Birds in North America
 Conserving Birds in North America BY ALINA TUGEND Sanderlings Andrew Smith November 2017 www.aza.org 27 Throughout the country, from California to Maryland, zoos and aquariums are quietly working behind
A brief report on the 2016/17 monitoring of marine turtles on the São Sebastião peninsula, Mozambique
 A brief report on the 2016/17 monitoring of marine turtles on the São Sebastião peninsula, Mozambique 23 June 2017 Executive summary The Sanctuary successfully concluded its 8 th year of marine turtle
Exploring Penguins through a research based information project. Includes information, writing pages, matrix for project.
 Exploring Penguins through a research based information project. Includes information, writing pages, matrix for project. In this PowerPoint you will see: information and facts about each type of penguin.
NOTES ON THE NORTH ISLAND BREEDING COLONIES OF SPOTTED SHAGS Stictocarbo punctatus punctatus, Sparrman (1786) by P. R. Millener* ABSTRACT
 by P. R. Millener* ABSTRACT") Tone (1970) 16:97-103. 97 NOTES ON THE NORTH ISLAND BREEDING COLONIES OF SPOTTED SHAGS Stictocarbo punctatus punctatus, Sparrman (1786) by P. R. Millener* ABSTRACT The present distribution of the spotted
Tone (1970) 16:97-103. 97 NOTES ON THE NORTH ISLAND BREEDING COLONIES OF SPOTTED SHAGS Stictocarbo punctatus punctatus, Sparrman (1786) by P. R. Millener* ABSTRACT The present distribution of the spotted
Fun Penguin Facts. a reading and spelling review activity
 Fun Penguin Facts a reading and spelling review activity s There are many different species of penguins from small to large. Explore sixteen different penguins with your child as you make your own penguin
1. Adélie Penguins can mate for life or at least try to find the same mate every year.
 Banding Did You Know? 1. Adélie Penguins can mate for life or at least try to find the same mate every year. 2. Some Adélie Penguin colonies are increasing in size at a rate that cannot be due to just
Hooded Plover Environmental Protection and Biodiversity Conservation Act Nomination
 Hooded Plover Environmental Protection and Biodiversity Conservation Act Nomination The Director Marine and Freshwater Species Conservation Section Wildlife, Heritage and Marine Division Department of
Mauritania. 1 May 25 October Desert Locust Information Service FAO, Rome outbreak
 Mauritania 1 May 25 October 2016 outbreak Desert Locust Information Service FAO, Rome www.fao.org/ag/locusts Keith Cressman (Senior Locust Forecasting Officer) updated: 26 Oct 2016 Zouerate oases May 2016
Intraspecific relationships extra questions and answers (Extension material for Level 3 Biology Study Guide, ISBN , page 153)
") i Intraspecific relationships extra questions and answers (Extension material for Level 3 Biology Study Guide, ISBN 978-1-927194-58-4, page 153) Activity 9: Intraspecific relationships extra questions
i Intraspecific relationships extra questions and answers (Extension material for Level 3 Biology Study Guide, ISBN 978-1-927194-58-4, page 153) Activity 9: Intraspecific relationships extra questions
Elwyn s Dream Teacher Notes by Raymond Huber
 Elwyn s Dream Teacher Notes by Raymond Huber Before Reading What is he holding on the cover? What do you know about the takahe? What do you think Elwyn s dream is? What decade might this story be set?
Chatham Island Mollymawk research on Te Tara Koi Koia: November 2016
 Chatham Island Mollymawk research on Te Tara Koi Koia: November 2016 1 Chatham Island Mollymawk research on Te Tara Koi Koia: November 2016 Mike Bell, Dave Bell and Dave Boyle Wildlife Management International
Demography and breeding success of Falklands skua at Sea Lion Island, Falkland Islands
 Filippo Galimberti and Simona Sanvito Elephant Seal Research Group Demography and breeding success of Falklands skua at Sea Lion Island, Falkland Islands Field work report - Update 2018/2019 25/03/2019
COASTAL OTAGO HOIHO MONITORING 2017/18
 COASTAL OTAGO HOIHO MONITORING 2017/18 Acknowledgements DOC Oamaru staff Pip Agnew and the OBP team Penguin Rescue YEPT staff Winsome White and Jim Caldwell Aramoana Conservation Trust DOC Dunedin staff
ROYAL SWAN UPPING The Queen ueen s Diamond Jubilee Edition
 ROYAL SWAN UPPING The Queen s Diamond Jubilee Edition The History of Swan Upping Historically, the reigning King or Queen was entitled to claim ownership of any unmarked mute swans swimming in open water
The Recent Nesting History of the Bald Eagle in Rondeau Provincial Park, Ontario.
 The Recent Nesting History of the Bald Eagle in Rondeau Provincial Park, Ontario. by P. Allen Woodliffe 101 The Bald Eagle (Haliaeetus leucocephalus) has long been known as a breeding species along the
BROOD REDUCTION IN THE CURVE-BILLED THRASHER By ROBERTE.RICKLEFS
 Nov., 1965 505 BROOD REDUCTION IN THE CURVE-BILLED THRASHER By ROBERTE.RICKLEFS Lack ( 1954; 40-41) has pointed out that in species of birds which have asynchronous hatching, brood size may be adjusted
Assessing the effectiveness of temporarily excluding tourists from a Yellow-Eyed Penguin (Megadyptes antipodes) breeding beach
 breeding beach") Assessing the effectiveness of temporarily excluding tourists from a Yellow-Eyed Penguin (Megadyptes antipodes) breeding beach Matt Conley A report submitted in partial fulfilment of the Post-graduate
Assessing the effectiveness of temporarily excluding tourists from a Yellow-Eyed Penguin (Megadyptes antipodes) breeding beach Matt Conley A report submitted in partial fulfilment of the Post-graduate
Seven Nests of Rufescent Tiger-Heron (Tigrisoma lineatum)
") Seven Nests of Rufescent Tiger-Heron (Tigrisoma lineatum) Steven Furino and Mario Garcia Quesada Little is known about the nesting or breeding behaviour of Rufescent Tiger-Heron (Tigrisoma lineatum). Observations
Seven Nests of Rufescent Tiger-Heron (Tigrisoma lineatum) Steven Furino and Mario Garcia Quesada Little is known about the nesting or breeding behaviour of Rufescent Tiger-Heron (Tigrisoma lineatum). Observations
Removal of Alaskan Bald Eagles for Translocation to Other States Michael J. Jacobson U.S Fish and Wildlife Service, Juneau, AK
 Removal of Alaskan Bald Eagles for Translocation to Other States Michael J. Jacobson U.S Fish and Wildlife Service, Juneau, AK Bald Eagles (Haliaeetus leucocephalus) were first captured and relocated from
BLACK OYSTERCATCHER NEST MONITORING PROTOCOL
 BLACK OYSTERCATCHER NEST MONITORING PROTOCOL In addition to the mid-late May population survey (see Black Oystercatcher abundance survey protocol) we will attempt to continue monitoring at least 25 nests
Summary of 2017 Field Season
 Summary of 2017 Field Season Figure 1. The 2017 crew: L to R, Mark Baran, Collette Lauzau, Mark Dodds A stable and abundant food source throughout the chick provisioning period allowed for a successful
Rockhopper penguin (Eudyptes chrysocome filholi) foraging at Antipodes Islands
 foraging at Antipodes Islands") Notornis, 2005, Vol. 52, Part 2: 75-80 0029-4470 The Ornithological Society of New Zealand, Inc. 2005 75 Rockhopper penguin (Eudyptes chrysocome filholi) foraging at Antipodes Islands P.M. SAGAR National
Notornis, 2005, Vol. 52, Part 2: 75-80 0029-4470 The Ornithological Society of New Zealand, Inc. 2005 75 Rockhopper penguin (Eudyptes chrysocome filholi) foraging at Antipodes Islands P.M. SAGAR National
Fact Sheet: African Penguin Spheniscus demersus
 Fact Sheet: African Penguin Spheniscus demersus Description: Size: 24-28 in (52-71 cm) Weight: 5-9 lbs Coloration: o Black feathers on their back and white feathers with black markings on their chest and
Summary of 2016 Field Season
 Summary of 2016 Field Season (The first year of the transfer of responsibility for MSI seabird work from Tony Diamond to Heather Major) Figure 1. The 2016 crew: L to R, Angelika Aleksieva, Marla Koberstein,
Identification of predators of Royal Albatross chicks at Taiaroa Head in February 1994
 Identification of predators of Royal Albatross chicks at Taiaroa Head in February 1994 Hiltrun Ratz and Henrik Moller Zoology Department University of Otago PO Box 56 Dunedin Published by Department of
Rufous hare-wallaby Lagorchestes hirsutus
 Rufous hare-wallaby Lagorchestes hirsutus Wild populations of the rufous hare-wallaby remain only on Bernier and Dorre islands in Shark Bay. There is also a translocated population of the central Australian
Short Report Key-site monitoring on Hornøya in Rob Barrett & Kjell Einar Erikstad
 Short Report 3-2011 Key-site monitoring on Hornøya in 2010 Rob Barrett & Kjell Einar Erikstad SEAPOP 2011 Key-site monitoring on Hornøya in 2010 Apart from the weather which was unusually wet, the 2010
Bald Eagles in the Yukon. Wildlife in our backyard
 Bald Eagles in the Yukon Wildlife in our backyard The Bald Eagle at a glance Both male and female adult Bald Eagles have a dark brown body and wings with a white head, neck and tail. They have a yellow
Parameter: Productivity (black-legged and red-legged kittiwakes); populations (marine mammals)
; populations (marine mammals)") Wildlife Inventory Plan Alaska Maritime National Wildlife Refuge Protocol #27 Version 1.2 Parameter: Productivity (black-legged and red-legged kittiwakes); populations (marine mammals) Species: Black-legged
Wildlife Inventory Plan Alaska Maritime National Wildlife Refuge Protocol #27 Version 1.2 Parameter: Productivity (black-legged and red-legged kittiwakes); populations (marine mammals) Species: Black-legged
AGE AT FIRST BREEDING AND CHANGE IN PLUMAGE OF KELP GULLS LARUS DOMINICANUS IN SOUTH AFRICA. R. J. M. CRAWFORD*, B. M. DYER* and L.
 S. Afr. J. mar. Sci. 22: 27 32 2000 27 AGE AT FIRST BREEDING AND CHANGE IN PLUMAGE OF KELP GULLS LARUS DOMINICANUS IN SOUTH AFRICA R. J. M. CRAWFORD*, B. M. DYER* and L. UPFOLD* In South Africa, kelp gulls
Pikas. Pikas, who live in rocky mountaintops, are not known to move across non-rocky areas or to
 Pikas, who live in rocky mountaintops, are not known to move across non-rocky areas or to A pika. move long distances. Many of the rocky areas where they live are not close to other rocky areas. This means
Subject: Preliminary Draft Technical Memorandum Number Silver Lake Waterfowl Survey
 12 July 2002 Planning and Resource Management for Our Communities and the Environment Scott E. Shewbridge, Ph.D., P.E., G.E. Senior Engineer - Hydroelectric Eldorado Irrigation District 2890 Mosquito Road
Motuora island reptile monitoring report for common & Pacific gecko 2016
 Motuora island reptile monitoring report for common & Pacific gecko 6 Prepared by Su Sinclair August 7 Work on this monitoring project was carried out under a Wildlife Act Authority issued by the Department
BREEDING ECOLOGY OF THE LITTLE TERN, STERNA ALBIFRONS PALLAS, 1764 IN SINGAPORE
 NATURE IN SINGAPORE 2008 1: 69 73 Date of Publication: 10 September 2008 National University of Singapore BREEDING ECOLOGY OF THE LITTLE TERN, STERNA ALBIFRONS PALLAS, 1764 IN SINGAPORE J. W. K. Cheah*
Red Crowned Parakeet (Cyanoramphus novaezelandiae) health, disease and nesting study on Tiritiri Matangi 2014/2015. Emma Wells on behalf of
 health, disease and nesting study on Tiritiri Matangi 2014/2015. Emma Wells on behalf of") Red Crowned Parakeet (Cyanoramphus novaezelandiae) health, disease and nesting study on Tiritiri Matangi 2014/2015 John Sibley Emma Wells on behalf of Auckland Zoo, Supporters of Tiritiri Matangi, Massey
Red Crowned Parakeet (Cyanoramphus novaezelandiae) health, disease and nesting study on Tiritiri Matangi 2014/2015 John Sibley Emma Wells on behalf of Auckland Zoo, Supporters of Tiritiri Matangi, Massey
Ernst Rupp and Esteban Garrido Grupo Jaragua El Vergel #33, Santo Domingo Dominican Republic
 Summary of Black-capped Petrel (Pterodroma hasitata) Nesting Activity during the 2011/2012 Nesting Season at Loma del Toro and Morne Vincent, Hispaniola Introduction and Methods Ernst Rupp and Esteban
You may use the information and images contained in this document for non-commercial, personal, or educational purposes only, provided that you (1)
") You may use the information and images contained in this document for non-commercial, personal, or educational purposes only, provided that you (1) do not modify such information and (2) include proper
You may use the information and images contained in this document for non-commercial, personal, or educational purposes only, provided that you (1) do not modify such information and (2) include proper
3. Chicks weigh 86 grams when they hatch and gain 100 grams a day until they are about 50 days old when they are ready to take care of itself.
 Did You Know? Direct Observation 1. The average nest has 200 rocks. 2. It takes between 30-35 days for an Adélie Penguin egg to hatch. 3. Chicks weigh 86 grams when they hatch and gain 100 grams a day
For further information on the biology and ecology of this species, Clarke (1995) provides a comprehensive account.
 provides a comprehensive account.") Circus aeruginosus 1. INTRODUCTION The marsh harrier (western marsh harrier) is increasing as a breeding species in Great Britain (Gibbons et al., 1993; Underhill-Day, 1998; Holling & RBBP, 2008) with
Circus aeruginosus 1. INTRODUCTION The marsh harrier (western marsh harrier) is increasing as a breeding species in Great Britain (Gibbons et al., 1993; Underhill-Day, 1998; Holling & RBBP, 2008) with
Disappearing Marine Iguanas: A Case of Population Collapse
 WLHS/Marine Biology/Oppelt Name Disappearing Marine Iguanas: A Case of Population Collapse Directions: Read the following scenarios and answer the corresponding questions Part 1: Disappearing Marine Iguanas
The story of Solo the Turnbull National Wildlife Refuge Male Swan
 The story of Solo the Turnbull National Wildlife Refuge Male Swan (taken from Turnbull NWR website): https://www.fws.gov/refuge/turnbull/wildlife_and_habitat/trumpeter_swan.html Photographs by Carlene
MAGELLANIC PENGUIN (Spheniscus magellanicus) TALKING POINTS
 TALKING POINTS") MAGELLANIC PENGUIN (Spheniscus magellanicus) TALKING POINTS The following items should be in the bag, if they are not let someone in education know. If you discover a new problem with any biofact (broken
MAGELLANIC PENGUIN (Spheniscus magellanicus) TALKING POINTS The following items should be in the bag, if they are not let someone in education know. If you discover a new problem with any biofact (broken
Breeding White Storks( Ciconia ciconia at Chessington World of Adventures Paul Wexler
 Breeding White Storks(Ciconia ciconia) at Chessington World of Adventures Paul Wexler The White Stork belongs to the genus Ciconia of which there are seven other species incorporated predominantly throughout
GNARALOO TURTLE CONSERVATION PROGRAM 2011/12 GNARALOO CAPE FARQUHAR ROOKERY REPORT ON SECOND RECONNAISSANCE SURVEY (21 23 JANUARY 2012)
") GNARALOO TURTLE CONSERVATION PROGRAM 2011/12 GNARALOO CAPE FARQUHAR ROOKERY REPORT ON SECOND RECONNAISSANCE SURVEY (21 23 JANUARY 2012) By Karen Hattingh, Kimmie Riskas, Robert Edman and Fiona Morgan 1.
GNARALOO TURTLE CONSERVATION PROGRAM 2011/12 GNARALOO CAPE FARQUHAR ROOKERY REPORT ON SECOND RECONNAISSANCE SURVEY (21 23 JANUARY 2012) By Karen Hattingh, Kimmie Riskas, Robert Edman and Fiona Morgan 1.
Copyright is owned by the Author of the thesis. Permission is given for a copy to be downloaded by an individual for the purpose of research and
 Copyright is owned by the Author of the thesis. Permission is given for a copy to be downloaded by an individual for the purpose of research and private study only. The thesis may not be reproduced elsewhere
EIDER JOURNEY It s Summer Time for Eiders On the Breeding Ground
 The only location where Steller s eiders are still known to regularly nest in North America is in the vicinity of Barrow, Alaska (Figure 1). Figure 1. Current and historic Steller s eider nesting habitat.
Evaluation of large-scale baiting programs more surprises from Central West Queensland
 Issue 6 February 2000 Department of Natural Resources Issue 15 September 2006 Department of Natural Resources and Water QNRM006261 A co-operative A co-operative project project between between producers
THE DESIGN AND USE OF A NEST BOX FOR YELLOW-EYED PENGUINS MEGADYPTES ANTIPODES A RESPONSE TO A CONSERVATION NEED
 1999 Lalas et al.: Design and use of a nest box for Yellow-eyed Penguins 199 THE DESIGN AND USE OF A NEST BOX FOR YELLOW-EYED PENGUINS MEGADYPTES ANTIPODES A RESPONSE TO A CONSERVATION NEED C. LALAS 1,
An Evaluation of Environmental Windows on Dredging Projects in Florida, USA
 An Evaluation of Environmental Windows on Dredging Projects in Florida, USA Terri Jordan-Sellers and Aubree Hershorin, Ph.D. Coastal Section, Environmental Branch Florida Shore and Beach Technical Meeting
The behaviour of a pair of House Sparrows while rearing young
 The behaviour of a pair of House Sparrows while rearing young By David C. Seel INTRODUCTION IN 1959 OBSERVATIONS were made on the behaviour of a pair of House Sparrows (Passer domesticus) rearing their
SOME PHOTOGRAPHIC STUDIES OF THE PINK-FOOTED GOOSE
 SOME PHOTOGRAPHIC STUDIES OF THE PINK-FOOTED GOOSE Photographed by ARNOLD BENINGTON, NIALL RANKIN and G. K. YEATES (Plates 9-16) THE Pink-footed Goose (Anser brachyrhynchus) breeds in east Greenland {between
American Bison (Bison bison)
") American Bison (Bison bison) The American Bison's recovery from near extinction parallels what happened to the European Bison, Bison bonasus. Once abundant and widespread in northern latitudes, their decline
American Bison (Bison bison) The American Bison's recovery from near extinction parallels what happened to the European Bison, Bison bonasus. Once abundant and widespread in northern latitudes, their decline
Project Update: December Sea Turtle Nesting Monitoring. High North National Park, Carriacou, Grenada, West Indies 1.
 Project Update: December 2013 Sea Turtle Nesting Monitoring High North National Park, Carriacou, Grenada, West Indies 1. INTRODUCTION The Critically Endangered Hawksbill (Eretmochelys imbricata) and leatherback
ANSER BRACHYRHYNCHUS AN D G REYLAG A. ANSER
 ROOST SELECTION BY PINK-FOOTED ANSER BRACHYRHYNCHUS AN D G REYLAG A. ANSER GEESE IN EAST CENTRAL SCOTLAND M V BELL,A V NEWTON and S F NEWTON Central Scotland Goose Group, clo 48 Newton Crescent, Dunblane,
Key concepts of Article 7(4): Version 2008
: Version 2008") Species no. 62: Yellow-legged Gull Larus cachinnans Distribution: The Yellow-legged Gull inhabits the Mediterranean and Black Sea regions, the Atlantic coasts of the Iberian Peninsula and South Western
Species no. 62: Yellow-legged Gull Larus cachinnans Distribution: The Yellow-legged Gull inhabits the Mediterranean and Black Sea regions, the Atlantic coasts of the Iberian Peninsula and South Western
What I learned from Limpus, Carter. Quantifying a Nesting Season. and Hamann (2001) and. Sussing out. Identifying
 and. Sussing out. Identifying") What I learned from Limpus, Carter and Hamann (2001) and Quantifying a Nesting Season Identifying Sussing out Michael Guinea School of Environment Charles Darwin University Darwin 0909 Whole of season
What I learned from Limpus, Carter and Hamann (2001) and Quantifying a Nesting Season Identifying Sussing out Michael Guinea School of Environment Charles Darwin University Darwin 0909 Whole of season
Coastal Birds of Haida Heritage Sites and Important Bird Areas.
 Coastal Birds of Haida Heritage Sites and Important Bird Areas www.ibacanada.ca Taadll Skaa anda Pacific Loon Photo : Tim Bowman, USFWS pale grey head, white vertical lines on neck, when in breeding plumage
Great Blue Heron Chick Development. Through the Stages
 Great Blue Heron Chick Development Through the Stages The slender, poised profiles of foraging herons and egrets are distinctive features of wetland and shoreline ecosystems. To many observers, these conspicuous
NEST-SITE SELECTION BY YELLOW-EYED PENGUINS MEGADYPTES ANTIPODES ON GRAZED FARMLAND
 1999 McKay et al.: Nest-site selection by Yellow-eyed Penguins 29 NEST-SITE SELECTION BY YELLOW-EYED PENGUINS MEGADYPTES ANTIPODES ON GRAZED FARMLAND ROD MCKAY 1, CHRIS LALAS 2, DAVID MCKAY 1 & SHAUN MCCONKEY
Situation update of dengue in the SEA Region, 2010
 Situation update of dengue in the SEA Region, 21 The global situation of Dengue It is estimated that nearly 5 million dengue infections occur annually in the world. Although dengue has a global distribution,
Lizard Surveying and Monitoring in Biodiversity Sanctuaries
 Lizard Surveying and Monitoring in Biodiversity Sanctuaries Trent Bell (EcoGecko Consultants) Alison Pickett (DOC North Island Skink Recovery Group) First things first I am profoundly deaf I have a Deaf
Kori Bustard Husbandry. Sara Hallager, Biologist, Smithsonian National Zoological Park
 Kori Bustard Husbandry Sara Hallager, Biologist, Smithsonian National Zoological Park Ardeotis kori 2 subspecies [?] Africa s largest flying bird Captive males: 12-19kg Seasonal weight gain up to 4kg Captive
OBSERVATIONS OF HAWAIIAN
 - - - - ------ - - - - - OBSERVATIONS OF HAWAIIAN HAWKACTIV ltv Spring 1985 Jack Jeffries P. O. Box 518 Volcano, HI 96785 .. INTRODUCTION This report is part of a continuing study to provide baseline data
Since 1963, Department of Fisheries (DOF) has taken up a project to breed and protect sea Turtles on Thameehla island.
 has taken up a project to breed and protect sea Turtles on Thameehla island.") Thameehla (Diamond) Island Marine Turtle Conservation and Management Station, Ayeyawady Region, Myanmar Background Thameehla Island is situated between the Bay of Bengal and the Gulf of Mottama (Gulf of
Thameehla (Diamond) Island Marine Turtle Conservation and Management Station, Ayeyawady Region, Myanmar Background Thameehla Island is situated between the Bay of Bengal and the Gulf of Mottama (Gulf of
Naturalised Goose 2000
 Naturalised Goose 2000 Title Naturalised Goose 2000 Description and Summary of Results The Canada Goose Branta canadensis was first introduced into Britain to the waterfowl collection of Charles II in
Response to SERO sea turtle density analysis from 2007 aerial surveys of the eastern Gulf of Mexico: June 9, 2009
 Response to SERO sea turtle density analysis from 27 aerial surveys of the eastern Gulf of Mexico: June 9, 29 Lance P. Garrison Protected Species and Biodiversity Division Southeast Fisheries Science Center
(199) THE HATCHING AND FLEDGING OF SOME COOT
 THE HATCHING AND FLEDGING OF SOME COOT") (199) THE HATCHING AND FLEDGING OF SOME COOT BY RONALD ALLEY AND HUGH BOYD. SUCCESS INTRODUCTION. THE following data were obtained during the summer of 196, from observations carried out at Blagdon Reservoir,
(199) THE HATCHING AND FLEDGING OF SOME COOT BY RONALD ALLEY AND HUGH BOYD. SUCCESS INTRODUCTION. THE following data were obtained during the summer of 196, from observations carried out at Blagdon Reservoir,
Falkland Island Seabird Monitoring Programme Annual Report 2007/2008
 FALKLAND ISLANDS SEABIRD MONITORING PROGRAMME SMP 15 Falkland Island Seabird Monitoring Programme Annual Report 2007/2008 By Nic Huin July 2008 FALKLANDS CONSERVATION PO Box 26 Stanley SUMMARY Overall
Disappearing Marine Iguanas: A Case of Population Collapse
 Disappearing Marine Iguanas: A Case of Population Collapse by Conrad Toepfer Division of Math and Natural Sciences Brescia University, Owensboro, KY Part I Disappearing Marine Iguanas Liz sat at a table
For further information on the biology and ecology of this species, Chapman (1999) provides a comprehensive account.
 provides a comprehensive account.") Falco subbuteo 1. INTRODUCTION The main breeding range of the hobby (Eurasian hobby) in Britain and Ireland lies in England, south of the Mersey/Humber line and extending into the borders of Wales. The
Falco subbuteo 1. INTRODUCTION The main breeding range of the hobby (Eurasian hobby) in Britain and Ireland lies in England, south of the Mersey/Humber line and extending into the borders of Wales. The
1995 Activities Summary
 Marine Turtle Tagging Program Tagging Data for Nesting Turtles and Netted & Released Turtles 199 Activities Summary Submitted to: NMFS - Miami Lab Cooperative Marine Turtle Tagging Program 7 Virginia Beach
Field report to Belize Marine Program, Wildlife Conservation Society
 Field report to Belize Marine Program, Wildlife Conservation Society Cathi L. Campbell, Ph.D. Nicaragua Sea Turtle Conservation Program, Wildlife Conservation Society May 2007 Principal Objective Establish
Best Practice in the Breeder House
 Best Practice in the Breeder House Preventing Floor Eggs Best Practice in the Breeder House Preventing Floor Eggs Why are floor eggs a problem? Eggs laid on the floor (floor eggs) have a significantly
Internship Report: Raptor Conservation in Bulgaria
 Internship Report: Raptor Conservation in Bulgaria All photos credited Natasha Peters, David Izquierdo, or Vladimir Dobrev reintroduction programme in Bulgaria Life History Size: 47-55 cm / 105-129 cm
A Sea Turtle's. by Laurence Pringle illustrated by Diane Blasius
 A Sea Turtle's by Laurence Pringle illustrated by Diane Blasius It was a summer night on a Florida beach. A big, dark shape rose out of the ocean and moved onto the shore. It was Caretta, a loggerhead
FALL 2015 BLACK-FOOTED FERRET SURVEY LOGAN COUNTY, KANSAS DAN MULHERN; U.S. FISH AND WILDLIFE SERVICE
 INTRODUCTION FALL 2015 BLACK-FOOTED FERRET SURVEY LOGAN COUNTY, KANSAS DAN MULHERN; U.S. FISH AND WILDLIFE SERVICE As part of ongoing efforts to monitor the status of reintroduced endangered black-footed
ABSTRACT. Ashmore Reef
 ABSTRACT The life cycle of sea turtles is complex and is not yet fully understood. For most species, it involves at least three habitats: the pelagic, the demersal foraging and the nesting habitats. This
THE production of turkey hatching
 The Use of Artificial Lights for Turkeys* H. L. WlLCKE Iowa Agricultural Experiment Station, Ames, Iowa (Presented at Annual Meeting, August 1938; received for publication September 22, 1938) THE production
Anhinga anhinga (Anhinga or Snake-bird)
") Anhinga anhinga (Anhinga or Snake-bird) Family Anhingidae (Anhingas and Darters) Order: Pelecaniformes (Pelicans and Allied Waterbirds) Class: Aves (Birds) Fig. 1. Anhinga, Anhinga anhinga. [http://animaldiversity.ummz.umich.edu/accounts/anhinga_anhinga/,
Anhinga anhinga (Anhinga or Snake-bird) Family Anhingidae (Anhingas and Darters) Order: Pelecaniformes (Pelicans and Allied Waterbirds) Class: Aves (Birds) Fig. 1. Anhinga, Anhinga anhinga. [http://animaldiversity.ummz.umich.edu/accounts/anhinga_anhinga/,
DO DIFFERENT CLUTCH SIZES OF THE TREE SWALLOW (Tachycineta bicolor)
") DO DIFFERENT CLUTCH SIZES OF THE TREE SWALLOW (Tachycineta bicolor) HAVE VARYING FLEDGLING SUCCESS? Cassandra Walker August 25 th, 2017 Abstract Tachycineta bicolor (Tree Swallow) were surveyed over a
DO DIFFERENT CLUTCH SIZES OF THE TREE SWALLOW (Tachycineta bicolor) HAVE VARYING FLEDGLING SUCCESS? Cassandra Walker August 25 th, 2017 Abstract Tachycineta bicolor (Tree Swallow) were surveyed over a
Monitoring of marine turtle reproductive activity in Juan de Nova using daily track counting
 Monitoring of marine turtle reproductive activity in Juan de Nova using daily track counting Marie Lauret-Stepler 1, Stéphane Ciccione 1, Jérôme Bourjea 2 1 CEDTM Kélonia, 46 rue du Général de Gaulle,
The Oysterbed Site Image Log
 Sunday, 23 May 2010. The Black-headed Gulls were still bringing nesting material to South Island. The Oystercatchers are changing over on incubation duty. The bird on the right is relieving its partner
*SwanUpping 7 18/12/06 14:25 Page 2 Swan Upping
 Swan Upping Incubation by the female does not begin until the clutch is complete and so the young hatch together.when they are very small, the cygnets often ride on their mother s back. O N E THE HISTORY
by A.P. Ballance c/- 7 Florida Place, Auckland 5. ABSTRACT
 PARYPHANTA AT PAWAKATUTU by A.P. Ballance c/- 7 Florida Place, Auckland 5. ABSTRACT During a 2 day collection in a stand of 26 year old pines in the Waipoua Forest, Northland, 18 live Paryphanta busbyi
By Hans Frey ¹ ² & Alex Llopis ²
 1/7 By Hans Frey ¹ ² & Alex Llopis ² ¹ Verein EGS-Eulen und Greifvogelschutz, Untere Hauptstraße 34, 2286 Haringsee, Austria. Phone number +43 2214 84014 h.frey@4vultures.org ² Vulture Conservation Foundation
Andros Iguana Education Kit Checklist
 Andros Iguana Education Kit Checklist Activity A: Where Have All the Iguanas Gone? Activity Sheets Envelope Activity Instructions Sheet Iguana Habitat Master Copy Threat Coverage 30%/70% Master Copy Threat
A Case Study of the Effectiveness of TNR on a Feral Cat Colony
 Compiled and Written By: Triple R Pets PO Box 86, Western Springs, IL 60558 708.738.1438 phone 630.214.3603 fax www.triplerpets.org QUESTION Does a TNR trap/neuter/return program stabilize or reduce the
Egyptian vulture (Neophron percnopterus) research & monitoring Breeding Season Report- Beypazarı, Turkey
 research & monitoring Breeding Season Report- Beypazarı, Turkey") Egyptian vulture (Neophron percnopterus) research & monitoring - 2011 Breeding Season Report- Beypazarı, Turkey October 2011 1 Cover photograph: Egyptian vulture landing in Beypazarı dump site, photographed
Egyptian vulture (Neophron percnopterus) research & monitoring - 2011 Breeding Season Report- Beypazarı, Turkey October 2011 1 Cover photograph: Egyptian vulture landing in Beypazarı dump site, photographed