The Ecology of the Burrowing Owl in California: A Synthesis of Demographic and Space Use Studies
|
|
|
- Giles Clark
- 5 years ago
- Views:
Transcription


1 The Ecology of the Burrowing Owl in California: A Synthesis of Demographic and Space Use Studies

2 Funded by the Bureau of Land Management and the National Fish and Wildlife Foundation This project synthesizes data from the California Burrowing Owl Research and Education Program Principal Investigators: Daniel K. Rosenberg and Jennifer A. Gervais Department of Fisheries and Wildlife Oregon State University Corvallis, Oregon and Lynne Trulio Department of Environmental Studies San Jose State University San Jose, CA Authors of Report and Recommended Citation: Rosenberg, D.K., L. A. Trulio, D. Catlin, D. Chromczack, J. A. Gervais, N. Ronan, and K. A. Haley The ecology of the Burrowing Owl in California. Unpubl. report to Bureau of Land Management. 2
3 Acknowledgements Through this project, we were given a great opportunity to synthesize almost a decade of working and thinking about a most charismatic species. This opportunity was made possible through the dedication and creative work of Amy Kuritsubo at the Bakersfield Field Office of the Bureau of Land Management. Amy worked diligently to secure funding for this project, which ultimately was made possible by the California State Office of the Bureau of Land Management and the National Fish and Wildlife Foundation. We thank these two groups profusely for providing funds to put together this work. Matching funds were generously provided by Barrett Biological, who is involved in conservation of Burrowing Owls in the Imperial Valley. We are very grateful to the many folks who provided in-kind contributions that facilitated the completion of the project. Finally, the senior principal investigators of the research program wish to acknowledge the exceptional work of the graduate students and field site leader involved in this project, all of whom are authors on this report: Dan Catlin, Debra Chromczak, Jennifer Gervais, Kate Haley, and Noelle Ronan. It was ultimately their work that resulted in this synthesis and many of the chapters include much of their thesis work. Additional thanks go to David DeSante, executive director of The Institute for Bird Populations, for his unflagging support especially at the inception of the Burrowing Owl Research Project and who motivated our interest in Burrowing Owl research and conservation. The Institute for Bird Populations very kindly administered our banding permits under their master permit. We also thank Nate Chelgren and Betsy Glenn for their generous help with GIS and statistical issues. We are very grateful to Clair and Sue de Beauvoir for their generosity in allowing us use of their photos of Burrowing Owls. Most importantly, this project would of course not have been possible if it were not for the excellent field assistance, logistical, and financial support we received at each of the study areas. South San Francisco Bay We thank NASA Ames Research Center, San Jose State University, and the California Department of Fish and Game for funding. We thank the Institute for Bird Populations who administered our banding permits under their master permit. Thanks also to the cities of Palo Alto, Mountain View, Sunnyvale, and Santa Clara for permission to band on their public lands. We appreciate the consistent support of Sandra Olliges, Chief, Environmental Services Office, NASA Ames Research Center. We thank our NASA coordinator and field researcher, Chris Alderete. We also want to thank our tireless field crew including Jun Bando, Suzanne Behrenfeld, Harold Fukuma, Tim Gasser, Kate Latham, Michele Shockey, Shannon Stout, and Lois Yuen. Lemoore Naval Air Station This research owes its beginnings to the enthusiasm of Mr. John Crane of Environmental Management Division, Naval Air Station Lemoore, and the work could not have been carried out without his unflagging support. We also thank Mr. Gerrit Buma for his advice and 3
4 encouragement. Financial support was generously provided by U. S. Navy Engineering Field Office West, National Fish and Wildlife Foundation, and California Department of Fish and Game. We thank the dedicated field assistance by Marcy Abright, Melinda Andermann, Craig Bailey, James Barry, Monica Bond, Paul Brandy, Christine Dalton, Vince Franke, Tawna Lanman, Cathy McGlynn, Holly Ober, Jennifer Podulka, and Sherwyn Solomon. Carrizo Plain National Monument We gratefully acknowledge Amy Kuritsubo and the BLM for the enthusiastic support for planning and executing this work from 1996 through the completion of this synthesis. Kathy Sharum, BLM, generously and enthusiastically facilitated our work in the Carrizo Plain and provided invaluable advice for ensuring research success in the Carrizo. This work was supported by grants from the BLM Bakersfield Field and State Office, National Fish and Wildlife Foundation, the USGS Cooperative Research Units, and California Department of Fish and Game. Scott Anderson, Monica Bond, Craig Bailey, Vince Franke, Tawna Lanman, Jennifer Podulka, Elise Raymond, and Zachary Sturges provided dedicated and skilled field assistance. We are especially grateful to Holly Ober, who established much of the initial field set-up and protocols, and who led the field crew at Carrizo in 1997; Jeff Rosier who led the telemetry work in 2000 and also generously provided experienced assistance in relocating owls in 2003, and Kim Tice who led the dispersal project in We thank Gary Schales (CDFG), for skilled telemetry flights and CDFG for making these flights happen. Imperial Valley and the Sonny Bono Salton Sea National Wildlife Refuge We thank the National Fish and Wildlife Foundation, U. S. Fish and Wildlife Service (Non-Game Bird Program), U.S. Geological Survey, citizens of California (tax-check off funds through California Department of Fish and Game), CalEnergy, Southern Gas, and the Imperial Irrigation District for financial support. We are especially thankful to the Salton Sea National Wildlife Refuge for providing housing and vehicles, and the California Department of Fish and Game and Esther Burkett for arranging and providing telemetry flights. This work would not have been possible without the dedicated field assistance of Ramona Balzer, Dave and Kristin LaFever, Christina Faustino, Angie Felty, Katie Hughes, Rebecca Jansen, Dave Mitchell, Patricia Phelps, Lacy Robinson, and Melissa York, and the skilled telemetry flights that Tom Evans conducted (CDFG). We thank Jihada Govan (USFWS) for her very helpful assistance with the logistics involved in the research and Al Kalin, of Kalin Farms, for his continued generosity in facilitating the research which was conducted, in part, on his property. We are also very grateful to Ken Sturm (USFWS) with whom we worked closely in the initiation of this project at this site. Ken always provided help and encouragement, and he also ended up marrying one of our field assistants. We thank Mike Remington and the Imperial Irrigation District for providing permission to work on drains and canals under their care. 4
5 Table of Contents Acknowledgements... 3 Part 1: Background I. Introduction Natural History of Burrowing Owls Motivation for This Study II. Study Areas Urban Environment: Silicon Valley Urban sites Parkland sites Fragmented Landscape: Naval Air Station Lemoore Large Grasslands: Carrizo Plain National Monument Intensive Agricultural Regions: The Imperial Valley III. Nest Locations Summary Urban Environment: Silicon Valley Nest Locations Nest Locations Nest Locations Nest Locations Nest Locations Fragmented Landscape: Naval Air Station Lemoore Nest Locations Nest Locations Nest Locations Nest Locations Nest Locations (note: survey effort was not complete) Large Non-Fragmented Grasslands: Carrizo Plain National Nest Locations Nest Locations Nest Locations Nest Locations Intensive Agricultural Regions: The Imperial Valley Nest Locations Nest Locations Nest Locations Nest Locations Nest Locations IV. Field Methods Summary Locating Nests Call-Broadcast Surveys Walk Transects Road Surveys
6 Criteria for Identifying a Nest Site-Specific Details of Locating Nests Fragmented Grassland Agricultural Detection Probability Evaluation Capture and Handling Trap Types Bow Nets One-way Door Trap Tomahawk Trap Two-way Trap Trapping Protocols Banding, Measurements, and Re-observation Radio Tracking Application of Radio Transmitters Tracking Fragmented Site Agricultural Site Study Period Study Period Grassland Site Study Period Study Period Study Period Reproductive Rates Urban Fragmented Grassland Agricultural Diet Habitat Initial Study Detailed Study in the Grassland Site Paired Burrows Unpaired Burrows Part 2: Research Findings V. Reproduction Summary Number of Nests in Study Sites Sample Sizes for Analyses Nest Success Nest Productivity Spatial Distribution of Reproductive Success Spatial Patterns of Nest Success in the Urban Study Area
7 Spatial Patterns of Nest Success in the Grassland Study Area Spatial Patterns of Nest Success in the Fragmented Study Area Spatial Patterns of Nest Success in the Agricultural Study Area VI. Patterns of Density Summary Methods Location of Nests Estimation of Detection Probabilities and Density Estimation of Habitat Area Results Study area size and nest habitat Detection Probability Fragmented Study Area Agricultural Study Area Grassland Study Area Abundance and Density Urban Fragmented Grassland Agriculture Nearest Neighbor Distances VII. Estimation of Survival from Mark-Resight: Summary Methods Capture, Mark, and Resight Criteria for Inclusion in Analysis Analytical Methods Distribution among Age Classes Apparent Survival Results Number of Owls Marked and Resighted Distribution among Age Classes Estimates of Apparent Survival Rate VIII. Estimation of Movements and Survival from Radio Telemetry Monitoring Summary General Field Methods Sample Periods Tracking Fragmented Site Grassland Site Study Period Study Period Study Period Agricultural Site Study Period
8 Study Period Juvenile Movements Adult Movements Within the Breeding Season Comparison of Movements Within the Breeding Season: Survival Analyse Fragmented Grassland Estimation of Emigration Results Fragmented Site Grassland Breeding Season Annual Study Period Agricultural Site Juveniles Sibling Behavior Adults Within Breeding Season Comparison of Adult Movement Patterns: Grassland vs Agricultural Sites Geometric Model IX. Estimation of Natal and Breeding Dispersal: Summary General Field Methods Statistical Methods Results Movements Outside Study Areas X. Nest Habitat Selection at the Grassland Study Area Summary Field and Statistical Methods Nest Site Characteristics Point Results Nest Site Characteristics Paired Burrows Unpaired Burrows Point and Buffer Analysis with GIS Vegetation Data Discussion XI. Population Dynamics Summary Methods
9 Results Future Directions XII. Literature Cited
10 Part 1: Background 10


11 I. Introduction Natural History of Burrowing Owls Burrowing Owls (Athene cunicularia) are engaging little birds well-known for their habit of perching prominently at the entrance of their burrow during daylight hours. The Zuni people s priest of the prairie dogs (Haug et al. 1993) is unique among North American owls in its tolerance of humans, adaptability to modified environments, and the densities nesting owls may achieve. Despite these characteristics, there has been growing concern over the fate of this species within North America. The Burrowing Owl is now listed as endangered in Canada, and is a listed species in a number of states in the United States (Haug et al. 1993, DeSante et al. in press). The fate of the Burrowing Owl is linked to the fate of grassland habitats in general but also to the willingness of their human neighbors to accommodate them. Burrowing owls occur throughout western North America (Fig. 1-1), Central and South America, in Florida, and islands in the Carribean (Haug et al. 1993). Although numerous subspecies are currently recognized (Haug et al. 1993), only A. cunicularia hypugaea, is found in California and throughout western North America. Consistent with the general characteristics of a flexible life history, A. cunicularia hypugaea populations are made up of both migratory and year-round resident individuals. There is no evidence that there is much genetic structuring between migratory and resident populations, suggesting that relatively frequent genetic mixing occurs (Korfanta et al. 2005). This conclusion has been supported also with stable isotope work (Duxbury 2004). The few data that exist suggest that owls living the furthest north migrate the furthest south for the winter (James 1992). The cues that prompt some owls to migrate while others FIGURE 1-1. Range map of the Burrowing Owl in North and Central America (from Haug et al. 1993). remain for the winter are not known. One reason for Canada s Burrowing Owl populations precipitous decline may be that 11

12 owls decide not to leave their wintering areas, or short stop along the journey north in the spring. There is currently little evidence with which to test this hypothesis, but stable isotope analysis and detailed genetic analyses may soon provide some much-needed information on this topic. One of the challenges to conservation is the difficulty in defining suitable habitat. The one universal characteristic of burrowing owl habitat is the presence of a burrow. This is typically not created by the owls, although if the soil is loose enough, burrowing owls will willingly dig (Gervais et al. in press). They are more likely to take up residence in burrows originally excavated by ground squirrels, badgers, coyotes, and other fossorial mammals. In severely altered environments they have also been found nesting in culverts, pipes, buried junk, and concrete rubble piles (J. A. Gervais, personal observation). Burrowing Owls have also been documented roosting in a scrap lumber pile (Grier 1997), and even in a Florida house (Zambrano 1998). Not surprisingly, burrowing owls take readily to artificial burrows, and this presents important management implications for their conservation. Owls use burrows year-round, for not only do they nest underground, they also roost in burrows throughout much of the year (LaFever et al. in press). The major exception is during the breeding season, when the male is frequently seen outside the burrow. During the nonbreeding season, an occupied burrow is far less obvious, as it will lack the decoration typical of the nesting season and the owl may spend little time at the entrance. Non-breeders can also be very cryptic even at the height of the breeding season, as they appear to spend much of their nonhunting time below ground and they seem to use multiple roosting locations (J. A. Gervais unpublished data). Burrowing Owls are extremely versatile in their diet. They are known to take small mammals including bats and rodents, amphibians, reptiles, insects, and other invertebrates such as centipedes and scorpions. They will also scavenge carrion. Although it appears that rodents are the most important component of their diet by weight in some regions (Green et al. 1993, Gervais and Anthony 2003), in other regions their diet is predominately made up of invertebrate prey (York et al. 2002). Owls will shift dietary selection based on availability (Jaksic et al. 1997, Gervais and Anthony 2003). They have also been seen taking advantage of novel food concentrations, such as foraging on insects attracted to parking lot lights at night (J. A. Gervais and D. A. Chromczak, personal observations). Food clearly plays a major role in reproductive success (Wellicome 2000, Haley 2002), which is not surprising given the very large clutch sizes of this species (a maximum of 12 to 14 eggs, Haug et al. 1993, Todd and Skilnick 2002). Foraging behavior includes a range of strategies, including hawking, pursuing prey on foot, and plunge and grab maneuvers from perches (Haug et al. 1993, J. A. Gervais personal observation). Burrowing Owls carry only one prey item at a time back to the nest, and not surprisingly distance to nest was found to be a major determinant in habitat selection while foraging (Gervais et al. 2003, Rosenberg and Haley 2004). Owls were observed bringing rodents back from distances of 700 m from their nests, whereas invertebrates were carried back to the nest only within 100 m (Green and Anthony 1989). During the breeding season, owls were found to forage within 2.7 km of their nest burrow (Haug and Oliphant 1990, Gervais et al. 2003, 12
13 Rosenberg and Haley 2004). In the southern San Joaquin and Imperial Valleys, owls concentrated roughly 80% of their foraging trips within 600 m of their nests (Gervais et al. 2003, Rosenberg and Haley 2004). Although distance to nest was the most important variable separating foraging locations from random sites in two studies of foraging habitat selection in an agricultural matrix (Gervais et al. 2003, Rosenberg and Haley 2004), other work has indicated that cropland is generally less favored than grass-forb habitat or other habitat types (Haug and Oliphant 1990, Sissons et al. 2001). These last two studies did not account for distance to the nest in the analysis and thus their results cannot be directly compared to the others. In any case, owls will readily use a wide variety of habitat types, provided that vegetation is generally low and open. Burrowing Owls begin breeding in California in March and the breeding season generally lasts until August, although clutches initiated as early as February (J. A. Gervais, unpublished data) and as late as November (Rosenberg and Haley 2004) have been found. Owls will readily replace clutches lost during incubation, although replacement clutches tend to decrease in size (Catlin 2004). Western Burrowing Owls will occasionally raise second broods, although this appears to be quite rare (Gervais and Rosenberg 1999), and may only occur in years when food is unusually abundant. We have observed site-specific differences in breeding behavior have been noted, including wariness of human intruders, startle responses to sudden noises or novel stimuli, and response to potential nest predation in the form of a burrow probe. It appears that owls raised in urban or agricultural environments develop a high tolerance for human activity, whereas their counterparts in more remote settings remain extremely wary. Although at least one city owl is known to have recruited into a country owl site (Rosenberg et al. unpublished data), the importance of this cultural conditioning on the subsequent habitat selection by dispersing juveniles, and their breeding success, is unknown. It does suggest that relocation or release of captive birds should be done with extreme caution, and only under very limited circumstances if at all. California supports Burrowing Owls in many of its low-lying areas, particularly in the broad valleys and coastal regions (DeSante et al. 1997a, 1997b, in press). Historically, they were present throughout much of the state in grassland habitats, including along the central and south coasts, the San Francisco Bay Area, the region around San Diego, and inland throughout the Central Valley. They also occurred in eastern and southeastern California although populations appear to have been sparse. The question of how many owls occurred where, and of how to characterize current trends, has been one of considerable controversy (Center for Biological Diversity 2003, CA Dept. Fish and Game 2003, Miller 2003). Despite the extensive land development that has occurred in California over the past century, the burrowing owl s range within the state remains much the same as at the time of European settlement (Gervais et al. in press). However, there are three major trends in the distribution of this species. First, declines and local extirpations appear to be particularly concentrated along the central and south coasts, regions that have also seen substantial human population growth. Second, densities of owls in the Central and Imperial Valleys are far greater than they were likely to have been historically, due to the advent of irrigated agriculture (Molina and Shuford 2004, DeSante et al. in press) and to the draining of extensive wetlands within the Central Valley. Third, it is likely that the vast majority of the owls in California live on private land (DeSante et al. in press). 13
14 In recent years, populations of owls clearly have declined in areas of rapid urbanization, most notably in the Bay Area and around San Diego; population losses in the San Francisco Bay area are estimated at 4-6% annually (DeSante et al. in press). Extirpation of breeding populations has occurred in the coastal counties of Marin, Napa, San Francisco, Santa Cruz, and Ventura Counties, and very few were located in Orange, Sonoma, Santa Barbara, and San Mateo Counties (DeSante et al. 1997a). Although many of these populations may never have been large, anecdotal observations of Burrowing Owls in historical accounts suggest that a sizeable number of owls once lived in the San Diego region. There are certainly far fewer there currently, although previously unknown clusters of breeding pairs continue to be found. State-wide surveys performed in the early 1990's failed to find owls at 89 locations where owl groups (defined as nesting pairs within 3 km of each other) had occurred in the 1980's but those surveys also located 76 new breeding clusters (DeSante et al. in press). Breeding Bird Survey data suggest increases in breeding populations but it seems that much of that overall trend may be due to the dramatic increases along a very small number of routes within the Imperial Valley (DeSante et al. in press). Substantial numbers of owls do persist in the Imperial Valley and Central Valley, and large grasslands may harbor sizeable populations as well (DeSante et al. in press, Ronan 2002, Gervais and Anthony 2003, Rosier et al. 2006). Overall the information available suggests that owls have been extirpated in many areas by increasing development, and that the distribution of remaining populations reflects the degree to which land conversion and development has occurred (Gervais et al. in press). However, the species has clearly adapted to human-altered environments provided that burrows and food sources still remain; populations persist in urban settings in sites such as airports and community college campuses (e.g., Thomsen 1971, Trulio 1997, Gervais et al. 2003, reviewed in Gervais et al. in press). Burrowing Owls have also clearly adapted to agricultural landscapes, attaining the greatest densities ever recorded for the species in the Imperial Valley (Rosenberg and Haley 2004). Interestingly, it is doubtful that this area supported many owls at all prior to the advent of irrigated agriculture. Burrowing Owls persist in the agricultural lands within the Central Valley, although they appear to be less concentrated along irrigation canals and more dependent on fallow lands for burrow locations (Gervais et al. 2003, DeSante et al. in press, J. A. Gervais unpublished data). Although Burrowing Owls appear to freely dig their own burrows in the soft soils that line the irrigation ditches in the Imperial Valley, their occurrence in the Central Valley appears to be much more tied to the presence of ground squirrels, likely due to the very different soils there (DeSante et al. in press, Gervais et al. in press). Disappearance of burrowing rodents is of considerable concern in Burrowing Owl conservation (Haug et al. 1993, Desmond et al. 2000). Owls in agricultural lands utilize croplands extensively during their foraging activities, and make use of a wide variety of prey in these altered habitats (Gervais et al. 2000, York et al. 2002). Although agricultural pesticides have been suspected to have detrimental effects on burrowing owls (e.g., James and Fox 1987, Gervais et al. 2000), it appears that the risk is more complex, tied to habitat use, foraging patterns, and diet (Gervais et al. 2003, Gervais et al. 2006). However, it is very likely that owls suffer mortality occasionally due to pesticide exposure. Other hazards of agricultural areas in California include automobiles, barbed-wire fences, and electric fences (Gervais et al. in press). Burrowing Owls also persist in rangelands and grasslands throughout the state, such as in the Carrizo Plains National Monument and on private lands. Their biology and distribution are 14
15 generally far less well characterized in these more remote locations, although we can infer a great deal from the many studies that have been carried out to date. Motivation for This Study California supports one of the largest year-round resident and winter migrant populations of Burrowing Owls within North America. The distribution of Burrowing Owls has changed considerably since the introduction of industrial agriculture and increased urbanization, reflecting both losses and gains in local populations. The native grasslands of California, probably the habitat of most importance historically to the Burrowing Owl in California, were greatly altered as a result of European contact in the 1700s, reducing grasslands from 8.9 million hectares to 800,000 hectares (Stromberg and Kephart 1996). Surveys conducted during in areas west of the Great Basin and desert areas, but including Coachella and Imperial counties, reported >9,000 breeding pairs (DeSante et al. 1997a). Most owls occurred within the Central (24%) and Imperial Valleys (71%), primarily in agricultural areas. Burrowing Owls have disappeared or severely declined in several southern California and San Francisco Bay counties and in coastal areas (DeSante et al. 1997a; DeSante et al. 1997b, Trulio 1997). Changes in agricultural practices, particularly water conveyance, and continued high rates of urbanization have the potential to quickly affect California s Burrowing Owl population. Evaluation of the ecology and in particular the survival and reproductive rates of burrowing owls in the primary habitats it now occupies is imperative to properly assess the species viability in California and to allow the development of appropriate conservation strategies. Despite the extremely adaptable nature of their life history, burrowing owls face substantial threats to their persistence in California. The state s human population continues to grow, and development is an increasing threat to agricultural lands within the Central and Imperial Valleys (Fig. 1-2). In addition, coastal regions also are undergoing sustained development. Understanding the demographic characteristics of this species within the habitat matrix currently utilized by burrowing owls will be a necessary step in developing regional strategies that both recognize the importance of local populations and their connectedness to other populations, wherever those occur. 15

16 FIGURE 1-2. Illustration of the overlap of threatened farmland and the range of the Burrowing Owl in California. From American Farmland Trust. Burrowing Owl surveys conducted in the early 1990s (DeSante et al. 1997a, b) identified landscapes with high owl population densities and recent population declines: (1) urban environments, (2) small grassland patches surrounded by intensive agriculture, (3) irrigation ditches and canals within agricultural areas, and (4) large, non-fragmented grasslands. To compare Burrowing Owl population dynamics among these different landscape types, we selected four representative areas in California to conduct intensive demographic studies (Fig. 1-3), which we initiated in Our northern-most study area, the Silicon Valley, located in the south San Francisco Bay region, represents our urban environment in which Burrowing Owl abundance has rapidly declined (Trulio 1997, 2003; DeSante et al. 1997a, b). Approximately 125 pairs of owls exist around the south edge of the Bay (L. A. Trulio unpublished data), of which approximately 50 pairs were within the study area. We located the second study area at Naval Air Station Lemoore, within the largely agricultural Central Valley. This site was chosen because of the presence of a Burrowing Owl population occupying small grassland patches that are surrounded by intensively managed agriculture. Approximately 65 pairs nest at this site (Gervais 2002). The largest concentrations of Burrowing Owls in California, and perhaps in the species range, numbering over 5600 pairs in an area of approximately 2810 km 2, reside in the Imperial Valley in southeastern California (DeSante et al. 2004, Rosenberg and Haley 2004). We selected a small portion (11.7 km 2 ) of this intensively agricultural region for our third study site. This site includes privately managed lands and public lands within the Sonny Bono Salton Sea National Wildlife Refuge; approximately 100 pairs occupy this small study site. Finally, we located our fourth study site in what is now designated as the Carrizo Plain National Monument, located in southwest California. This area consists of extensive, dry grasslands, and represents the best example of the desert grasslands in which Burrowing Owls were historically most abundant. We regularly located over 35 pairs of owls within the Carrizo Plain (Ronan 2002). 16

17 The purpose of this report is to summarize the findings of a demographic and space-use study that we conducted within California from 1997 to Four large populations were intensively studied to determine their ecology and demographics. The populations represented the major habitat types utilized by Burrowing Owls in California (Fig. 1-3): urban fringe (the south Bay Area), intensive agriculture (Imperial Valley), patchy agricultural (Central Valley), and extensive grassland (Carrizo Plain). Although much of the work completed for each site has been published (see Literature Cited, Chapter XII), this report represents the synthesis of the demographic investigation over all sites and years. FIGURE 1-3. Location of the four Burrowing Owl study areas in California. 17
. The boundaries of the area surveyed for owls encompassed 4.")
18 II. Study Areas Urban Environment: Silicon Valley Field work was conducted in the southern region of San Francisco Bay, Santa Clara County, California (hereafter, referred to as the Urban site), located about 64 km southeast of the city of San Francisco (37 25 N W). The boundaries of the area surveyed for owls encompassed 4.9 km 2, located north of US Highway 101 and south of the salt ponds at the edge of the San Francisco Bay (Fig. 3). The site is bordered by San Francisquito Creek to the west and the Guadalupe River to the east. A resident population of approximately 50 nesting pairs of owls exist within a larger regional population of pairs (Trulio 1997, 2003). The entire study area is dominated by the urbanized landscape of Silicon Valley; closed landfills, golf courses, and open space lands border the south end of the Bay and urban development with some open fields covers the rest of the area. Burrowing owl habitat is confined to fragmented sections of grassland habitat within and adjacent to the urbanized region, resulting in a clustered distribution of nests. Based on the clustered nature of the distribution of nests, we pre-stratified the study area into strata of high (hereafter Urban ) and low (hereafter Parkland ) levels of urbanization. Owls nesting in the Urban stratum utilized vacant parking lots, landscaping, athletic fields, golf courses, embankments along sidewalks and roads, and an airfield. Owls nesting in the Parkland stratum utilized embankments, larger open lots on closed landfills, a golf course, and city parks. The Urban area consisted of 4 sub-study areas (Moffett, Mission, Tasman, and Agnews) and the Parkland strata consisted of 3 substudy areas (Byxbee, Shoreline, and Sunnyvale). Areas outside of the substudy areas but within the FIGURE 2-1. The Urban study area was located in the Silicon Valley, and included seven sub-study areas considered as highly urban or as parkland. study area were classified as Urban (Fig. 2-1). Of the 4900 ha of the overall study area, approximately 1580 ha (32%) were included within the sub-study areas. All of the nests were observed within the sub-study areas except one nest located along the embankment adjacent to the boundary of the Sunnyvale site, which we included in the estimates for that site. 18
 is a 795 ha parcel that includes an airfield with two runways, an 18-hole golf course, and an industrial complex.")

19 Figure 2-2. The Urban study area showing the three habitat classes; the class shadow indicates cells that we were unable to classify. Urban sites Moffett Field (Moffett) is a 795 ha parcel that includes an airfield with two runways, an 18-hole golf course, and an industrial complex. Moffett is a federal facility administered by NASA and is bordered by Stevens Creek to the west, wetlands to the north, Lockheed Martin Company to the east, and US-101 to the south. Burrowing owl habitat is restricted to the golf course, fragmented fields, roadside embankments, airfield edges, and landscaping. Mission College (Mission) is a community college campus within the City of Santa Clara. At about 114 ha, Mission is surrounded by commercial and industrial buildings to the west, north, and east and is bordered by US-101 to the south. Mission provides owl nesting sites in athletic fields, parking lots, roadside embankments, and landscaping. 19
20 Tasman Drive (Tasman) is a corridor along a segment of the Light Rail Transit system in a highly urbanized section of the City of Santa Clara. Tasman, an area of approximately 120 ha, contains vacant lots, the San Francisco 49er s football training camp, the Santa Clara Golf & Tennis Club, and an electrical power plant. This site is adjacent to San Tomas Aquino Creek and Great America Theme Park to the west, SR-237 to the north, and residential areas to the east and south. The majority of owl nests are found in roadside embankments, under sidewalks, and on the 18-hole golf course. Agnews Developmental Center-West Facility (Agnews), a previously state-owned facility, covers approximately 136 ha, approximately 50% of which has been developed into an industrial complex and residential housing. Bordering Agnews to the west is a segment of the Light Rail Transit system running parallel to Lafayette Street with Montague Expressway to the south. Agnews is surrounded on all sides by residential and commercial property. Nests are located in large open lots around the perimeter and under sidewalk embankments. Burrowing Owls were not observed here in the 2001, 2002, and 2003 field seasons. Parkland sites Shoreline at Mountain View Park (Shoreline) is a 295 ha wildlife and recreation area operated and maintained by the City of Mountain View. Shoreline contains an 18-hole golf course, boating lake, and nature trails that are built upon a closed landfill. Wetlands border the park to the north, to the east are wetlands and Moffett, and Shoreline Amphitheater and commercial buildings sprawl to the south and west. Owl nesting sites are located on the golf course, in artificial mounds, roadside embankments, and on large open lots. Sunnyvale Baylands Park (Sunnyvale) is a 105 ha facility owned by the County of Santa Clara and operated by the City of Sunnyvale. Sunnyvale includes a park with nature trails, playgrounds, picnic tables, and a sports complex adjacent to the park. This site also includes the Sunnyvale Landfill and the Water Pollution Control Plant, a city-owned landfill and water treatment plant covering another 77 ha west of the park. Sloughs drain the wetlands to the north, Calabazas Creek creates the eastern border, SR-237 and Caribbean Drive to the south, and Lockheed Martin Company to the west. Sunnyvale s primary nesting sites are found on artificial mounds, sculpted embankments, and large open lots. Byxbee Park (Byxbee) is a city park operated and maintained by the City of Palo Alto. Byxbee is a small (18 ha) park that is built upon a landfill designed with several series of manmade mounds and nature trails. Surrounding the park to the west is the Harold May Regional Water Quality Control Plant, north and east is the Palo Alto Baylands Nature Preserve (wetlands), and south of the park is the Palo Alto Landfill. Nesting sites are located on closed sections of the Palo Alto landfill and mounds and berms within the park. 20

21 Fragmented Landscape: Naval Air Station Lemoore Lemoore Naval Air Station provided an excellent opportunity to investigate the ecology of Burrowing Owls in a patchy environment small grassland parcels surrounded by intensive agriculture, a typical environment for Burrowing Owls in the Central Valley of California. NAS Lemoore is located 50 km southwest of Fresno, California (36 18' N, 'W, Fig. 2-3). The site supports a population of breeding pairs of Burrowing Owls (Gervais 2002). The site is located in the center of the San Joaquin Valley, an area of intense and highly productive agriculture (Griggs 1992). Major crops include cotton, alfalfa, tomatoes, and corn. FIGURE 2-3. Location of Lemoore Naval Air Station in the southern San Joaquin Valley. This site represents fragmented grassland habitat, typical of the region. 21
 Agriculture (Fig. 2-4). Approximately 75% of the land is allocated to agricultural production (6,418 ha), the primary use of land in the San Joaquin Valley during this study period.")
22 The Lemoore site, hereafter referred to as the fragmented site, includes 8,538 ha allocated to five principle uses: (1) Air Operations, (2) Administration, (3) Housing, (4) Recreational and Wildlife, and (5) Agriculture (Fig. 2-4). Approximately 75% of the land is allocated to agricultural production (6,418 ha), the primary use of land in the San Joaquin Valley during this study period. Cotton is the principal crop at the fragmented site, covering approximately 4,201 ha (1998 crop data, J. Crane, Lemoore, NAS Lemoore), representing 65% of the area in agricultural production. Much of the Air Operation s buffer strips and the uncultivated land in the receiver and transmitter areas provide potential nesting habitat to Burrowing Owls, and consist of mowed non-native grasses. In addition, a capped, re-vegetated landfill provides approximately 23 ha of grassland habitat although the seeded native forbs and grasses have given way to mostly exotic vegetation. Areas dedicated to wildlife habitat include approximately 185 ha, which includes both grasslands (91 ha) and wetlands (94 ha). In addition, there are a total of approximately 385 ha in unimproved grasslands. From the estimates of total grass coverage in 1997 (J. Crane, personal communication), a total of 486 ha was suitable as nesting habitat, not including the small patches of grass separating runways, taxiways, and buildings in Air Operations (Rosenberg et al. 1998). Crop fields, runways, taxiways, and roads are also used for foraging (Gervais et al. 2003). Thus, most of the base provides habitat for either nesting or foraging. Nesting occurred in burrows excavated by California ground squirrels (Spermophilus beecheyi) and occasionally coyote (Canis latrans), in cable housings, culverts, holes excavated under concrete slabs, and constructed nest boxes. Nests were distributed throughout air operations, runway easements and designated wildlife areas. The grasslands at NAS Lemoore are typical of grasslands throughout the San Joaquin Valley, and fall into the category of Non-Native Grasslands by the California Native Plant Society and Natural Diversity Data Base. Within NAS Lemoore, Tumble Weed Park (39 ha) has perhaps the best remaining examples of native species; however, introduced species predominate and include red bromes (Bromus madritensis spp. rubens), Mediterranean barley (Hordeum murinum, a foxtail), prickly lettuce (Lactuca serriola), and Mediterranean grass (Schismus arabicus) (Lemoore Naval Air Station 1990). Native species that predominate include saltgrass (Dictichlis spicata). Outside of Tumble Weed Park, the grasslands are much more dense and homogeneous, and dominated by only a few species, such as wild oats (Avena spp.), foxtail (Hordium murinum), and bromes (Bromus spp.). 22

23 The high water table created by the subsurface geology of the region and exacerbated by irrigation (Lemoore Naval Air Station 1990) is at least partly responsible for the proliferation of the exotic grasses at NAS Lemoore. During wet years plant biomass reaches its highest levels. The vegetation in the grasslands surrounding the Air Operations area is currently mowed several times annually to reduce fire risk (Rosenberg et al. 1998). Figure 2-4. Distribution of habitat types within Lemoore Naval Air Station, showing the fragmented nature of the patches of grass habitat and the similarity of agricultural production areas within and outside of the study area. 23

24 Large Grasslands: Carrizo Plain National Monument We investigated the ecology of Burrowing Owls in the Carrizo Plain National Monument to understand the owl s demography and space use within extensive grasslands, probably the predominant type of habitat occupied by this species prior to European settlement. The Carrizo Plain (later refered to as the Grassland site) is located on the eastern edge of the Coast Range approximately 80 km southwest of Bakersfield, California (35E11' N, 119E52' W; Fig. 7). Carrizo is jointly managed by the Bureau of Land Management (BLM), California Department of Fish and Game, and The Nature Conservancy. Within the Carrizo Plain boundaries are 100,000 ha of undeveloped, semidesert grassland, which represent the largest remnant in the San Joaquin Valley (Schiffman 2000). The Southern San Joaquin Valley was, and even more so today, an important component of California s desert grasslands. Prior to the expansive growth of industrial agriculture following the construction of the California Aqueduct, the San Joaquin Valley was a productive area of arid grassland vegetation. Current land use practices have further reduced California*s native grasslands. The largest remaining block of this vegetation type is within the Carrizo Plain. The historic type of vegetation that dominated what are commonly called grasslands in the San Joaquin Valley is debated, but increasingly a view of a desert grassland/scrub community is emerging (L. Saslaw, BLM, personal commun.). The Carrizo and Elkhorn Plains are located in the southern portion of San Joaquin Valley, an area now designated the Carrizo Plain National Monument. The monument proclamation extended the Carrizo over the Caliente Range to highway 166 in January 2001 (Fig. 7). Our study was largely conducted prior to the proclamation of the Monument and thus our description of habitat and management is restricted to the original boundaries of the Carrizo Plain Natural Area. 24

25 Figure 2-5. Carrizo Plain study area and surrounding area. The yellow outline shows the boundary of the Carrizo Plain Natural Area, the portion of Carrizo Plain National Monument included in the Burrowing Owl demographic study. The shaded portion of the figure identifies the 20 km region beyond the demographic study area was included in aerial searches of radio-collared individuals. Carrizo includes a broad valley plain and parts of the bordering Temblor Mountains to the northeast and the Caliente Range to the southwest. The study was confined to areas less than 800 m in elevation, the predominant limit of Burrowing Owls within Carrizo. To investigate patterns of dispersal of radio-tagged owls, we expanded the study area in 2000 and during to include an area of approximately 20 km beyond the study area. In this area, we searched for radiotagged Burrowing Owls via aerial telemetry (Fig. 2-5). We regularly located over 30 pairs of Burrowing Owls, whose nests were largely located within burrows constructed by California ground squirrels, but also include those made by coyote and badger (Taxidea taxus; Ronan 2002). The varied topography and the region's cool climate with moist winters and hot, dry summers (average annual rainfall of 15 cm; Williams1992) have contributed to the distribution of the diverse plant communities (Fig. 8). The Carrizo is composed of Valley sink scrub, Valley salt-bush scrub, upper Sonoran sub-shrub scrub, non-native grassland, juniper-oak cismontane woodland, and cismontane juniper woodland and scrub (Fig. 2-6; BLM 2005). Non-native grasses, such as foxtail (Vulpia sp.), bromes (Bromus sp.), filaree (Erodium cicutarium), and oats (Avena sp.) are the dominant vegetation in the lowlands where Burrowing Owls are most common, though some native plant species are common, including common saltbush (Atriplex polycarpa), spiny saltbush (Atriplex spinifera), nodding needlegrass (Nasella cernua), blue grass (Poa secunda sp. secunda), lupine (Lupinus sp.), goldfields (Lasthenia sp.), red maids (Calandrinia ciliata) and owl's clover (Castilleja sp.) (Butterworth and Chadwick 1995). Fallow 25

26 fields that were last cultivated in 1989 have been invaded by non-native grasses (BLM 2005). Non-native grasslands comprise approximately 39,000 ha, almost 45% of the study area. Historically, Carrizo was manipulated extensively for dry-land grain farming and cattle and sheep ranching which has contributed to the invasion of non-native vegetation. Though farming no longer occurs within the boundaries of Carrizo, grazing is used as a management tool to enhance and support native species and communities by controlling exotic vegetation and to maintain low, open vegetative structure that many species prefer or even require (Germano et al. 2001). Although there has been limited management through prescribed burning, the predominant form of vegetation management during our study was cattle and sheep rest-rotation grazing on a portion of the pastures. Grazing typically occurs in two of three pastures, one of which is grazed from approximately December 1- February 14, and the other from February 15 through 1 April (BLM 2005). In addition to time restrictions, grazing is constrained by the amount of residual dry matter, with a minimum of 500 lbs/acre (103 kg/ha) and a minimum of approximately 5 cm of active green growth (BLM 2005). Density of livestock has varied among years as has residual dry matter, which varied from lbs/ac in earlier years ( ; BLM 2005). FIGURE 2-6. Vegetation types within the study area and within 500 m of roads included in the owl surveys (shaded portion). Vegetation types include a mixture of grass, forbs, and shrubs in a complex of plant communities. Description of each and pooling regimes we used in the analyses are reported in METHODS. 26

, 40 km north of El Centro, California, and centered within the Sony Bono Salton Sea National Wildlife Refuge (Fig.2-7).")
27 Intensive Agricultural Regions: The Imperial Valley The majority of the Burrowing Owls in California are thought to occur in agricultural areas, and in particular within the intensive production area of the Imperial Valley. We established our southernmost study area within this valley. The study area was located on the Sonny Bono Salton Sea National Wildlife Refuge and adjacent land in southeastern California (33 1'N 'W), 40 km north of El Centro, California, and centered within the Sony Bono Salton Sea National Wildlife Refuge (Fig.2-7). The study area was characterized by agricultural fields, framed by a system of concrete water-delivery ditches, canals, and earthen drains, maintained by private landowners and the Imperial Irrigation District. Drains were deep (up to 8-9 m), dredged waterways. Within this agricultural matrix, Burrowing Owls nested almost entirely within or along drains, ditches, and canals (Rosenberg and Haley 2004). Nest burrows were often initiated by small mammals such as gophers (Thomomys bottae), muskrats (Ondatra zibethicus) and round-tailed ground squirrels (Citellus tereticaudus) and enlarged or entirely made by Burrowing Owls. The loose and mounded soil along banks and canals facilitates the owls ability to make their own burrows. Fields were intensively managed for year-round production of produce (vegetables and melons), cotton, cut flowers, and cattle feed. Primary crops were sudan grass (Sorghum bicolor), Bermuda grass 27
28 (Cynodon dactylon), alfalfa (Medicago sativa), onions (Allium cepa), carrots (Daucus carota) and corn (Zea mays). We divided the study area into several sub-areas. We captured and marked Burrowing Owls only in the Intensive Study Area (ISA), which totaled 1175 ha (Fig. 2-8). The second subarea (Area B; Fig. 2-8) extended 0.8 km beyond the ISA. Together, these two areas represented the Demography Study Area (DSA). The third sub-area (Area C; Fig. 2-8) extended 0.8 km (1999) or 1.6 km (2000) beyond the DSA. Most (81%) of the ISA consisted of privately owned agricultural fields. The remainder encompassed a segment of the Sonny Bono Salton Sea National Wildlife Refuge. The Refuge maintained a set of 35 nest boxes situated between roads and fields. In addition, in 2002, we constructed 24 nest boxes on private lands within the DSA. Nest box design was similar to those described by Trulio (1995) Kilometers FIGURE 2-7. Intensive demographic study area and the expanded area searched for radio-tagged Burrowing Owls in the Imperial Valley. The predominately agricultural matrix contrasts with the non-irrigated desert to the west and northeast. 28
, providing")

, which included parts of the")
.")
29 C Refuge ISA C B B C B C C C To evaluate patterns of dispersal, we expanded the study area in to include approximately 225,000 ha (Catlin 2004), providing a maximum detection distance of ca. 25 km (Fig. 2-8). This area was largely similar to the ISA; however, it included large areas of non-irrigated desert and several urban and suburban areas. N km FIGURE 2-8. Owls were marked within the intensive study area (ISA), which included parts of the Sonny Bono Salton Sea NWR. The ISA, together with Area B, represented the Demography Study Area (DSA). Area C extended 0.8 km (1999) or 1.6 km (2000) beyond the DSA and was surveyed to located marked owls. 29
30 III. Nest Locations Summary We located nests at each study using a variety of methods (See Chapter IV, Methods). Our goal was to identify nests to evaluate hypotheses on nest site selection and to locate nests to estimate demographic performance and space-use patterns through color banding and attachment of radio transmitters. In this section, we illustrate the distribution of nests for each year and study site. In interpreting these figures, its important to recognize several sampling issues. First, nest locations in the Grassland study area represent simply a sample from within the study area. The probability of locating a nest was largely dependent on the distance of nests from the survey road (see Chapter VI, Patterns of Density), with those closer to the road more likely detected. Second, the Agricultural study area included areas of different detection areas. Only the Intensive Study Area (including the Refuge) had an effort that resulted in nearly certain detection of nests. Surveys conducted outside the ISA were for the sole purpose of documenting movements of owls. Finally, the figures of the nest locations are at a scale that do not show nest locations that are extremely close to one another, and thus underestimate nest densities at a very local scale. The graphs depict the general distribution of nests that were included in this report. 30

31 Urban Environment: Silicon Valley 1998 Nest Locations 31
32 1999 Nest Locations 2000 Nest Locations 32
33 2001 Nest Locations 33
34 Fragmented Landscape: Naval Air Station Lemoore 1997 Nest Locations 34

35 1998 Nest Locations 35
36 1999 Nest Locations 36
37 2000 Nest Locations 37
38 2001 Nest Locations (note: survey effort was not complete) 38
39 Large Non-Fragmented Grasslands: Carrizo Plain National Monument 1997 Nest Locations 39

40 1998 Nest Locations 40
41 1999 Nest Locations 41
42 2000 Nest Locations 42
43 Intensive Agricultural Regions: The Imperial Valley (note: nest locations are shown only in the Intensive Stud Area (ISA), which includes the Refuge) 1998 Nest Locations 43
44 1999 Nest Locations 44
45 2000 Nest Locations 45
46 2001 Nest Locations 46
47 2002 Nest Locations 47


48 IV. Field Methods Summary During the 8 years of fieldwork, many methods were developed and refined. These took into account variations in study goals and logistics and characteristics unique to each study site. The extent and duration of the application of these methods allowed us to maximize sampling efficiency and information collected while minimizing disturbance to Burrowing Owls. The next section, Analytical Methods, integrates the questions our research has addressed with the field methods described in this section. We conducted this study to compare the demography and space use of Burrowing Owls in four distinct habitats in California. Using a combined experimental and comparative approach, we studied the demography and space use of these populations in an effort to understand the mechanisms responsible for the different patterns we observed. In this section, we describe the field methods that allowed us to estimate and compare density of breeding pairs of Burrowing Owls, reproductive rates, survival rates, and patterns of movement, including both habitat selection and dispersal. The methods at each study site varied to accommodate the differences in the owl s behavior and the logistics of each site, such as access to nest sites. In all cases, however, methods were conducted in a manner that allowed us to estimate the same parameters, making comparisons robust. The field study was initiated as a pilot study in 1996 at the Fragmented site, and expanded in 1997 at three study areas, and by 1998 the study was fully implemented at all four areas. These studies continued uninterrupted through 2000, and continued at the Urban, Grassland, and Agricultural sites through We developed methods to combine safe handling of owls with minimization of harassment while guaranteeing data of sufficient quality for estimation. Each season, nests were located at each site early in the nesting cycle. Adults at each nest were identified and banded if they were not already marked, and reproductive rates were monitored following hatching and emergence of the young. Young owls were also banded. In addition, site-specific questions were addressed with data collection designed specifically for that site and study. In the course of the eight years of research, we feel that we have developed protocols that perform well in terms of data quality, and that minimize risk and stress to the Burrowing Owls. 48

49 Locating Nests LOCATING owls was a vital part of all research, and we emphasized the development of these techniques at the beginning of the research program at each site. Finding owls is a site-specific enterprise, so a combination of call-broadcast surveys, line transect surveys conducted on foot, and surveys conducted from vehicles were used at one or more of the study areas. Call surveys are most effective in large grasslands whereas line transects are most effective in smaller habitat patches. Roadside surveys were effective in the Imperial Valley, where most of the owls nested along drains, canals, and ditches, all of which run parallel to roads. We thus took advantage of the most effective method at each site and estimated detection probabilities with each of these methods, allowing densities to be compared among sites. Call-Broadcast Surveys We frequently located Burrowing Owl nests using call surveys (Haug and Didiuk 1993) coupled with line transects. We broadcast the territorial coo coo call of the Burrowing Owl from April - June between 1830 and 0230 h from a loop tape (Cornell Laboratory of Natural Sounds, Ithaca, NY) played through a portable cassette player and a megaphone preset to broadcast at decibels at a 1m distance (Ronan 2002). The recorded calls were spaced 10 seconds apart. Surveys were not conducted when wind speed exceeded 12 km/hr, which was approximated using a hand-held wind meter for each transect and repeated at hourly intervals. We established call stations every 0.3 km along vehicle-accessible roads. At each station, the observer got out of the vehicle and listened for one minute for Burrowing Owls already vocalizing and then played one call in each cardinal direction. The observer listened for four additional minutes after the final call was broadcast. When owls responded, a compass bearing to the owl was estimated. To identify the most likely location of nests, we used biangulations of bearings taken on owls responding to the broadcast call (program LOCATE II; Nams 1990). We conducted a search with a radius of approximately 100 m around the estimated location of the nest in daylight and on foot. If the nest was not found, we conducted surveys along transects (hereafter referred to as walk transects) to locate the nest. We established walk transects within a square area of 0.5 x 0.5 km, centered on the assumed location of the nest. 49

50 Walk Transects Transect surveys conducted by observers on foot were used to determine the precise location of potentially active owl nests at the Urban, Fragmented, and Grassland sites. Transects consisted of diurnal searches for owls and potential nest sites with observers walking approximately 7-20 m apart, depending upon vegetation height and density. Transects covered the entire length of the area of interest. In the Urban and Fragmented site, all areas of potential owl habitat were surveyed in this manner (see Site-Specific Details of Locating Nests, below for criteria of owl habitat). In the Grassland site, the location estimated from the call surveys became the center of a 0.5 km square in which line transects were surveyed. During surveys, all potential burrows used by owls as determined by the presence of single owls, pellets, or prey remains and whitewash were identified and GPS coordinates taken. Possible nests were identified using criteria listed below, and were marked with tags or poles. Road Surveys We conducted road surveys only at the Agricultural site. We surveyed all watercourses (drains, canals, and delivery ditches) that bordered agricultural fields by vehicle twice and once on foot in 1998, and similarly in the December surveys of 2001 and We conducted surveys at vehicle speeds of 10 km h -1 with 2 observers during the morning (30 min before sunrise to 4 hrs after) and evening (3 hrs before sunset until sunset) when wind speeds were < 15 km/hr. Occasionally, one observer would drive and the second observer would walk simultaneously along opposite sides of wide drains to ensure adequate coverage. In our experience, wind speeds in excess of the cutoff value greatly reduced the likelihood that owls would be above ground, making nest burrows much less easy to identify. Criteria for Identifying a Nest The underground nests of Burrowing Owls can be challenging to identify. We used both behavioral and physical evidence of nesting to determine if a pair had initiated nesting in a given burrow (e.g., Millsap and Bear 1997). A burrow was identified as potentially active within that season if owls were observed at a burrow or if evidence of use such as pellets, prey, feathers, whitewash, or decoration existed. Once burrows with signs of owl use were located, their status as active nests was determined using a list of predetermined criteria. A burrow was classified as an active nest if one or more of the following was observed: a pair of owls was seen at the 50

51 burrow more than once; nest decoration was present; owl behavior that indicated probable nesting including alarm calls, defensive behavior, retreating into the burrow, and reluctance to flush; eggshells observed at the burrow entrance; or chicks observed at the burrow. Burrows that were occupied by owls but whose status was unclear were rechecked every one to two weeks throughout the breeding season. This increased the likelihood of identifying an active nest. Over-estimation of nest success will result if nests that failed were not included in the sample of nests. Therefore, it was important to carefully consider the criteria for identifying a burrow as a nest independent of finding evidence of nest contents, such as eggs or chicks. Site-Specific Details of Locating Nests Urban -- In both the Urban and Parkland strata (see Study Area, Chapter II), we systematically searched Burrowing Owl habitat for owls and nests with the walk transect methods described above. All suitable Burrowing Owl habitat (fields, mounds, landscaping, and embankments; Trulio [1997]) was examined during walk transect surveys. Surveys performed on golf courses were carried out only along paved pathways and between fairways because nest burrows did not occur elsewhere due to golf course maintenance activities. We revisited any burrow that contained evidence of owl activity up to four times to determine if owls occupied the site. All burrows occupied in previous years were visited at least once throughout the breeding season to check for occupancy and occurrence of newly occupied burrows. Because of the high detection probability of nest burrows and marked owls (see Results, Chapter VI), and based on results of a test of similar methods performed at the Fragmented site (see Detection Probability Evaluation, below), we assume that we found all nests. In 1998, we marked nests with metal tags attached to large nails embedded in the soil. Due to substantial losses of metal tags, in subsequent years we marked nests with 2-ft wooden stakes. We used a Global Positioning System unit (GPS; Garmin 45XL, Garmin International, Inc., Olathe, KS) to identify the universal transverse mercator (UTM) to the nearest meter, using NAD83 as the map datum. Fragmented-- Call surveys were conducted along vehicle-accessible roads and transect surveys were conducted in all potential owl habitat in 1997 as an initial broad-based survey (Rosenberg et al. 1998). Call survey routes were located on farm roads along the perimeter of all grassy areas and adjacent to canals, drainage ditches, and runways. Surveys were conducted between 0300 and 0600 or between 2000 and Call surveys were not successful in identifying nests due to background noise, which made detection difficult. In addition, it was clear that many owls known to be present at active nests were not responding to the taped calls, perhaps due to the high density of nesting pairs and apparently small area of defended territory for each nest. In following years, from , we used only walk transects surveys within all potential owl 51
52 habitat. Suitable habitat included uncultivated areas that were not adjacent to residential development, wetland, or areas predominantly brush-covered. In addition, each year we checked all known nest sites we located in previous years. We marked nest burrows with metal tags attached to large nails ((20 cm) embedded in the soil near the burrow entrance. In all areas outside of the Air Operations, nests were additionally marked by a 2.5 cm diameter PVC pole 1 m in height. These were painted orange at the top and some were additionally marked with reflective tape. All poles were marked with the nest number using a black permanent marker. We used a Global Positioning System unit (GPS; Garmin 12XL, Garmin International, Inc., Olathe, KS) to identify the universal transverse mercator (UTM) to the nearest meter, using NAD27 as the map datum. Grassland-- Burrowing owl nests were located using three methods. Call surveys were conducted to determine presence of owls and estimate nest locations. We found nests using the walk transect method. Each year, we also found nests in the course of related fieldwork. The extent of each of these survey methods depended upon the objectives of the study in each year. We used consistent methods from for the comparative demographic study. Call surveys were conducted along predetermined stations on vehicle-accessible roads (Fig. 8) beginning early April to mid-june between 1930 and 0230 during If an owl was detected at only one station, stations located approximately 1 km around the initial station the owl was detected was surveyed again on a separate night to attempt to obtain a biangulation. In 2000 and 2002, a more limited call survey was conducted; call surveys were focused on areas of approx. 1.6 km around historic nest sites that no longer demonstrated signs of occupancy. During these years, we conducted call surveys along transect routes on vehicle-accessible roads beginning April 8 through May 14 between 1930 and 0045 hours. Each year, from , we checked active nests from the previous year for occupancy. If an active nest was not found, we surveyed within 100 m of the previous year s nest for owls via the walk transect method during April and May. In 2002, we did a similar survey on nests that were active in 2000, conducted from April 10-April 25; two nests were excluded due to their distance from the road and time constraints. We marked nest burrows with numbered pin flags and metal tags attached to large nails ((20 cm) and embedded in the soil. We used a Global Positioning System unit (GPS; Garmin 12XL, Garmin International, Inc., Olathe, KS) to identify the universal transverse mercator (UTM) to the nearest meter, using NAD27 as the map datum. Agricultural-- Within the Intensive Study Area (ISA, Fig. 2-8), we attempted to locate all nests via road surveys. Each year, from 1998 to 2003, we conducted the road surveys as described above (see Road Surveys). Surveys were performed along all of the roadways and waterways within the ISA, Refuge, and area B, 0.8 km beyond the ISA. The two surveys occurred at the beginning of 52
53 the breeding season and were augmented with incidental findings throughout the breeding season. We also performed a single road survey 0.8 km (1999) and 1.6 km ( ) beyond area B during the breeding season. Additional nests were found opportunistically throughout the study. We determined the location of nests in UTM coordinates using two different approaches. In the first approach, we identified road intersections with a GPS unit in the map datum NAD27, which we later converted to NAD83. For each nest, we then measured its distance from the nearest road intersection with a distance wheel and calculated the UTM for the nest location based on the road intersection UTM. We utilized a second approach from A Garmin 12XL (Garmin International, Inc., Olathe, KS) identified the UTM to the nearest meter, using NAD83 as the map datum. We marked nests with numbered pin flags each year and only marked the nest boxes with numbered metal tags. Detection Probability Evaluation We evaluated the likelihood of detecting an active Burrowing Owl nest for each method. Evaluations were done for Call Surveys (Grassland site), Road Surveys (Agricultural site), and Walk Transect Surveys (Fragmented site). To evaluate the nest search transect method at the Fragmented site, we surveyed Tumbleweed Park, an area of approx. 50 ha, with observers unfamiliar with nest locations. In 1998, observers followed the walk transect protocol and noted all burrows that they found. Their results were compared to known burrow occurrences based on extensive previous fieldwork. This allowed the detection probability to be calculated. We evaluated the road survey method at the Agricultural site by estimating the probability of detecting nesting pairs of Burrowing Owls within the ISA. We divided the study area into approximately m blocks, and surveyed each alternating block outside of the Refuge (N = 7) from 14 to 30 April We followed the protocols for road surveys as described previously. Detection from call surveys followed by the transect surveys were evaluated at the Grassland site from the initial survey in 1997 using distance-based population estimation approaches (Buckland et al. 1993). Capture and Handling We attempted to capture and mark a large segment of the population at each study area once nests had been located using the methods described above. At each nest, we used one or more methods for capturing adult and juvenile owls. We captured adult owls using bow nets (spring-loaded nets) baited with a caged mouse (Rosenberg and Haley 2004), Tomahawk traps, and one- and two-way burrow traps (e.g., Bothelo and Arrowwood 1995). We captured young with a one-way trap, modified from that described in Banuelos (1997). We removed young from nest boxes by hand. 53
54 Trap Types Bow Nets We first used this method in 1998, and it proved highly successful, particularly for male owls that were otherwise difficult to capture. A caged mouse served as bait for a mesh-covered, spring-loaded hoop that flipped over the owl once it pounced on the mouse cage. One-way Door Trap This trap was made of a tube of 10 cm dryer duct lined with astroturf, and equipped at one end with plexiglass flaps that allowed owls to leave, but not enter, the tube. This trap was placed in the burrow mouth, and the entrance covered with a plastic mesh bubble to hold the owl once it left the burrow. This trap was particularly effective for juvenile owls. Tomahawk Trap This wire mesh, treadle-triggered box trap, designed for capture of rodents, was usually combined with a one-way door trap, and placed facing out of the bubble to catch owls attempting to enter the nest. Occasionally the Tomahawk trap was used alone, either facing into or out of a burrow. Two-way Trap These consisted of PVC pipe 15 cm in diameter, and outfitted at each end with cardboard, plexiglass, or wire flaps that open into the tube, but do not allow the owl to leave it. The twoway traps were placed in the burrow mouth, and used primarily on natural burrows. Gaps between burrow walls and the traps were stuffed with rags. The PVC pipe rapidly gained heat from the ground, making them unsuitable for use where late afternoon sun exposure had heated the burrow entrance to high temperatures. We discontinued use of these traps at the Agricultural site following the deaths of two owls in the same trap from heat exposure. We replaced this trap with a similarly operating trap, but one made of wire mesh. Trapping Protocols Specific protocols were followed in the use of traps. Spring traps were laid near burrow entrances, or in areas such as roadways where owls were observed foraging. The traps were typically illuminated by a small battery-powered lantern, and either watched continuously or checked every minutes, depending on the occurrence of potential predators in the area. Spring traps were not considered invasive, since they do not prevent free access to the nest burrow. Therefore we did not set any restrictions on the frequency of their use or on the duration of time they were left set. Owls captured in spring traps were later sighted to verify their nest, as foraging birds sometimes were caught in traps set at neighboring nests. Burrow traps were considered invasive and disruptive to the owls normal behavior. We therefore limited the use of these traps to no more than 3 sessions for adults and 3 for chicks per breeding season, and all trapping sessions were followed by a minimum of 3 nights without 54
 were excavated to capture and band the chicks when observations indicated that they were at least 14 d old, our minimum age for banding")

55 disturbance. Traps were left set for 6-8 hours, and we checked traps every 1-2 hours. We remained in the vicinity of all set traps. Artificial burrows (Fragmented and Agricultural study areas) were excavated to capture and band the chicks when observations indicated that they were at least 14 d old, our minimum age for banding (see below). A few adult owls were also captured by excavation in the course of collecting eggs for toxicological sampling. Otherwise, we did not attempt to trap adults at artificial burrows as nearly all individuals were previously banded and resighting efforts were successful without the need to capture the birds. Banding, Measurements, and Re-observation Brood patch of incubating female Wing measurement We marked young and adult Burrowing Owls with an aluminum alphanumeric color band (Acraft Sign and Nameplate Co., Ltd., Edmonton, Alberta, Canada) and a non-locking No. 4 U.S. Fish and Wildlife Service band during at one or more sites (Table 4-1). There was no evidence of band loss based on recaptures or re-sightings of previously banded owls. We measured mass to the nearest 0.1 g and tarsus and wing chord length to the nearest 0.1 mm. We assigned gender to adults based on presence of a brood patch, plumage coloration, and behavioral observations (Haug et al. 1993). We collected blood and feather samples from the Fragmented, Grassland, and Agricultural sites for a collaborative study on the genetic structure (Korfanta et al. 2005) and migration mapping (Duxbury 2004) of Burrowing Owls. In 2002, as part of the dispersal study, we collected blood samples from chicks at the Grassland and Agricultural sites to determine gender. Owls were handled and banded during different years depending on the site. Within the Urban site, we captured and banded owls from 1998 through 2003 and recaptured or resighted banded owls from We decreased the effort to band owls during 2002 and 2003; capture methods during these last two years were used primarily to identify owls that were difficult to resight. At the Fragmented site, we banded a few young and adult owls in 1996 as part of a toxicological study (Gervais et al. 2000). From , we captured and banded a large proportion of the owls. In 2000, we primarily resighted banded owls. Within the Grassland site, we captured and banded owls from for estimation of survival and movement rates, and in 2002 as part of the dispersal study. We resighted banded owls from At the Agricultural site, we captured and banded owls from 1997 (pilot study) 2002, and resighted individuals from We also marked newly hatched chicks during 2000 and 2001 (Haley 2002) with elastic thread or plastic-coated wire. We clipped a nail on each nestling to identify it from the other nestlings in the nest. Once the tarsi were sufficiently long (approx days post-hatch), we banded nestlings permanently. 55
, supplemented with additional observations to enable us to identity banded")

56 An important aspect of our research was to identify color-banded individuals each year. After the initial year of the study, we identified individuals through the methods described for locating nests (above), supplemented with additional observations to enable us to identity banded adult owls from nests observed during the surveys. We used spotting scopes and binoculars to read the bands and identify individuals. We repeatedly returned to nests until we verified the identity of the owls. In some cases, bands were unreadable; we then attempted to capture the owl. We had a very high success rates in identifying previously banded owls. Only in the Agricultural site did our search for banded owls depart from that described above. In the Agricultural site, we searched for banded owls in Area C, 0.8 (1999) or 1.6 km ( ) beyond where we surveyed for nests (Fig. 2-8; see Site-Specific Details For Locating Nests, above). We conducted a single vehicular survey for marked owls in this area. Because of the lower effort and presumably lower re-sighting rates, we did not include observations of marked owls from this outer area for survival estimation but included these data for estimation of movement patterns and emigration rates. Radio Tracking Application of Radio Transmitters We conducted radio-telemetry at the Fragmented, Grassland, and Agricultural sites during one or more years in and at the Grassland and Agricultural sites in (Table 4-1). Selection of owls to be radio tagged varied by site and year. At the Fragmented site, all adult male owls that had initiated nesting were targeted for radio collars, with particular effort made to trap and mark owls from all parts of the study area and which were associated with nests sampled for toxicological work (Gervais and Anthony 2003, Gervais et al. 2003). With 2 exceptions, a single juvenile owl was randomly chosen from among all those caught at a nest which were >120 g or whose wing chords were >120 cm and were > 3 weeks of age. This ensured that owlets were strong enough and coordinated enough to avoid entanglement in the radio collar. At the Grassland site we sampled adults and juveniles from throughout the study area. At the Agricultural site in 1998, we selected adult males based on the central location of their nest within the study area (Rosenberg and Haley 2004). In 2002, we selected adult males and females from nest boxes within an 11.7 km 2 central area of the study area (Catlin 2002). We selected juveniles from nests within the same area and that weighed >120 g; more than one individual per nest was included in the sample. 56
, and consisted of a necklace-like collar with a 20 cm antenna (photo, right). Battery life varied from 14-24 weeks, with a corresponding range in mass from 3.6 to 4.5 g.")

 were mounted as backpacks with loops of tubular Teflon ribbon (3/16 th inch; Bally Ribbon Mills, Bally, PA) encircling the")
, and had an approximately 400-day battery life (Catlin 2004).")
 was focused on estimating space-use patterns within the home range (Gervais et al.")
57 We used two different transmitter-mounting systems of varying mass. The first type was specifically designed for Burrowing Owls (Model PD-2C, Holohil Systems Ltd., Ontario, Canada), and consisted of a necklace-like collar with a 20 cm antenna (photo, right). Battery life varied from weeks, with a corresponding range in mass from 3.6 to 4.5 g. This represented % of adult body mass. We used these necklace collars during 1998 and 1999 at the Fragmented, Grassland, and Agricultural sites. The second type of transmitter mounting system was used at the Grassland and Agricultural sites in This study required much greater battery life and range due to the study s duration and need to locate dispersing individuals. These larger radios (American Wildlife Enterprises, Monticello, FL, USA) were mounted as backpacks with loops of tubular Teflon ribbon (3/16 th inch; Bally Ribbon Mills, Bally, PA) encircling the wings and fastened together at the breast (photo, above left). The ribbon was fixed in place by a half-cut brass connecter sleeve that was crimped down on the ribbon using linesman pliers. The total package weighed an average of 5.1 g (SE = 0.02 g, n = 36, range = g), and had an approximately 400-day battery life (Catlin 2004). Tracking We conducted radio telemetry at the Fragmented, Grassland, and Agricultural sites during at least two years (Table 4-1). Our earlier work ( ) was focused on estimating space-use patterns within the home range (Gervais et al. 2003, Rosenberg and Haley 2004), whereas the later work ( ) was conducted to estimate dispersal patterns (Catlin 2004; Rosier et al. 2006). Our general approach was to establish stations in a grid (Fragmented and Agricultural site) or along roads (Grassland site), with stations approximately m apart. Distances between stations represented the best compromise between radio signal range and the time needed to drive to another station for biangulation readings. This grid-based method allowed a formal search method to negate the potential bias of observers returning to known sites of occurrence, such as nests (Rosenberg and McKelvey 1999). However, difficulty in obtaining locations often resulted in our departing from a strictlygrid based approach and attempt to locate an individual, often at its nest, and follow it for the remainder of the night. Once the signal was lost, we searched for the owl using the grid system and knowledge of the individual s previous locations. The vehicle-based method consisted of a receiving antenna that was constructed with two H-configured antennae (Telonics, Mesa, AZ) during the 1998 studies or two 4-element Yagi antennae during the later studies (Cushcraft Corp., Manchester, New Hampshire), separated by a cross boom and connected to a null combiner, mounted to a 2-m rotating tower with a fixed compass. The tower was secured in the bed of a truck, making the antennae height approximately 57
58 3 m above ground (Gervais et al. 2003). H-configured antennae were also used during all years of the studies when searching for owls on foot with handheld equipment. We searched for owls that could not be located using ground searches with aerial surveys from a fixed wing aircraft. We did this at the Fragmented site during 1999 opportunistically, but regularly in 2000 at the Grassland site and at the Grassland and Agricultural sites. Methods for locating owls varied depending on the study and the study site. We quantified radio telemetry error by placing radios in known locations and estimated those locations using observers who were unaware of the true locations. Radios were placed to mimic actual owl positions while perching or foraging, although the test radios remained in fixed positions. Fragmented Site We radio-tagged and tracked adult male and juvenile owls in 1998 and 1999 (Gervais et al. 2003). We collected location data from 15 May to 1 September 1998 and 1 May to 15 September We used a dual antenna receiving system with a null combiner (Telonics, Inc., Mesa, AZ) mounted in a vehicle. In 1998, we used H antennas for the array, and obtained a maximum reception distance of 0.8 km. In 1999, we used 4-element Yagi antennas, which increased the reception range to 1.0 km. Observers worked independently in separate vehicles to obtain sequential bearings at predetermined stations along a grid work of farm roads that covered the study area. All bearings included in the analyses were taken <5 min apart. Due to the size of this site and the number of radios deployed, we divided the station into several regions. One observer covered one or two regions per night. All owls potentially present (those nesting within 4 km) were scanned for at each telemetry station. Occasionally, a single radio was followed if it was the only remaining functioning radio in the area, or if few locations had been recorded for that individual owl. Frequent owl movements while foraging made obtaining more than two sequential bearings on a single owl location difficult. Because Burrowing Owls appear to move frequently while foraging, we recorded signal quality as well as the time, station location and bearing angle. Signals were classified as either: 1, strong with obvious null; 2, strongest direction of a signal without a null (the bird was either moving, underground, or vegetation and micro-topography were interfering with signal transmission); or 3, we detected only a broken signal. This last scenario frequently occurred if owls were foraging in ditches or farm field furrows. Even limited topographic relief was enough to cause substantial signal interference. Efforts were made to search areas > 1 km from the nest site to avoid biasing observations near the nest. Location attempts on the same owl were made $15 min apart. Each owl was tracked at least 2 nights a week, and several locations were obtained per night. We tracked owls from dusk to 0300 (Gervais et al. 2003). Initially, chicks were located once every three days to determine survival rates; once chicks fledged, they were tracked at night along with adult owls. As much as possible, we determined the fates of all radio-tagged owls by the end of the fieldwork in late August (radio dead, owl dead, owl missing, or owl alive). We also attempted to estimate dispersal distance by locating chicks that emigrated from the study area by using aerial telemetry. In 1999, two aerial flights in August and one in late September were conducted. 58

59 Agricultural Site 1998 Study Period In May 1998, we radio-tracked male owls to determine space-use patterns (Rosenberg and Haley 2004). The telemetry equipment and set-up was identical to that described above for the Fragmented site. We captured owls that nested within a 0.4 X 0.8 km area along the edge of the road and fields within the Refuge. We attempted to track owls each night from 2000 to 0400 hrs from 5 June-13 July. We established a grid system of stations at approximately 400 m intervals to obtain biangulation data. We attempted to obtain locations of a given owl every 15 min. Only locations computed from estimates of the angle of the owl from two stations within 5 min were included in analyses. We omitted all observations that led to locations greater than 1 km from the telemetry stations because of their greater expected error (Gervais et al. 2003) Study Period We radio tracked owls as part of a dispersal study that was conducted from April May 2003 (Catlin 2004). Ground telemetry searches, conducted weekly, from vehicles started at the last known location of each owl, but if we were unable to find a radio-tagged owl at this location, we covered a 1 km diameter circle, checking at 500-m increments in each of the four cardinal directions around the last known location. After we located an owl via radio-telemetry, we attempted to confirm the owl s status (alive, dead, renesting). In the case of owls that were found in the nest burrow, we used an infrared probe (Sandpiper Technologies, Inc., Manteco, CA.). The burrow scope consisted of an infrared video camera attached to the end of a 3 m long sturdy cable. The camera attaches to a small television or eye-glass monitor for viewing. We confirmed the status at each weekly interval. If we did not find owls via the ground survey, we searched from a fixed wing airplane, which we used to search for missing owls approximately every two weeks. We used an H- antennae and flew at m altitude. We consistently searched an area of ca km 2, providing a maximum area of detection of ca km from the central study-area. The same North-South aerial transects with 5 km spacing was performed approximately every two weeks after the 2002 breeding season (no searches in September; October 3, 31; November 18, 25, December 9, 24; January 15, 26; February 26; March 19; April 9, 16, 26). The locations of all owls were known by the end of the breeding season and only 3 owls were missing by the end of the study in Grassland Site Study Period We radio-tracked the nocturnal movements of selected male owls in an effort to estimate home range and habitat use. We used the telemetry equipment and set-up as described for the Fragmented site during We collected biangulation data on radio-tagged owls between the hours of 2030 and 0330 from June 10 to July 6. The survey area included pre-determined telemetry stations on vehicle-accessible roads placed 500m apart in a 4km-radius circle centered on the nest. One owl was followed per night. Once the owl was located, a bearing to the owl was taken on the signal and the station, time, angle, and quality of signal were recorded. The observer would then immediately proceed to the next station to obtain another bearing. If the owl was 59
60 located and a biangulation obtained, the observer would continue taking bearings on the signal at a station approximately every 15 minutes. If the owl began moving, the observer would proceed to appropriate stations in an effort to remain in contact as much as possible Study Period We searched for radio-collared owls to estimate adult dispersal (Rosier et al. 2006) and survival within the breeding season. We conducted ground searches every 7-9 days from May through July 2000 using a hand held H antenna and a truck-mounted Yagi antenna system. We searched for owls not detected from ground searches with biweekly flights of fixed-wing aircraft using a broad transect pattern (approximately 1.0 km apart) at an elevation of m above ground to cover large areas of suitable habitat. Additionally, we searched areas of suitable habitat adjacent to the Carrizo. The search area, which was covered at least once during the season, included all of the grasslands and foothills of the Carrizo and the surrounding area, with a total search area of approximately 3500 km 2. When an owl was relocated during a flight, we initiated a ground search following the flight to confirm the location and status of the owl. Status categories were alive, dead, or re-nesting events Study Period To estimate within-breeding-season and between-year dispersal patterns of adults and young, we attempted to relocate all radio tagged owls once each week from May 2002-April 2003 (Catlin 2004). Because most nests were not located adjacent to roads at the Grassland site, searches were often performed with a hand-held H-antenna. The ground surveys started at the last known location of the owls, but if we were unable to locate radio-tagged owls we searched a 100-m radius surrounding the nest. If the owl was not located in this initial search, we returned within the next two days to check again for the owl. If still no signal was found, we conducted a search of an area of a 1-km radius surrounding the nest. If the nest was located near roads, we searched for the owl at 250 m intervals along four 1 km transects radiating out from the nest with the truck-mounted Yagi system. If the nest was not located near roads, the four transects were surveyed on foot using the H-antennas. Because of time constraints, these transects were approximately 600 m in length. The detection distance of the H-antennas used should have made the effective area covered approximately one kilometer. Once an owl s signal was found, we determined its location. If the owl was within 100 meters of its nest, we recorded its location as its nest. If the owl was greater than 100 m from its nest, the UTM coordinates for its location (within 20 m) were recorded. Once the owl was found, it was noted if the owl was alive, dead or in a burrow. In some cases, the owl may not have been seen, but its signal moved, and its location was approximated. If the owl was in a burrow, we returned to the burrow at a later date to determine if the owl had moved. If the owl had not moved, the burrow was checked with the infrared scope to determine the owl s status. If we were unable to observe the owl using the probe, and it continued to be found in the same burrow, and if other evidence such as spider webs blocking the burrow were found, we classified the owl as dead. For owls that could not be located during ground checks, fixed-wing aircraft surveys were scheduled approximately every two weeks beginning mid-may; May 16, June 5, June 20, July 18, August 1, August 15, and August 29. Once an owl was missing for two weeks or more, we no longer searched for it on the ground. We searched for it by plane until we could relocate 60
61 it. To find multiple owls during the plane surveys, a core area covering approximately 20 km from every nest was surveyed using transects set 5 km apart. The plane was flown at approximately m altitude, depending on weather conditions. Flights lasted from two to three hours, and if additional time was available, areas outside the core area were surveyed. If an owl s signal was found during a plane survey, ground verification was conducted as soon as possible to determine the owl s exact location and status. We attempted to relocate the remaining missing (n = 19) and known living owls (n = 21) 8 times from ground surveys following the breeding season: 13 September, 27 September, 14 October, 21 October, 8 November, 7 December 2002, 20 January, and 11 April During 2 of these periods, 5 flights were performed (2 in December/January of and 3 in April of 2003). Reproductive Rates We examined Burrowing Owl reproductive biology by observation of natural nests and by examining nest boxes in the Fragmented and Agricultural study areas. To estimate productivity of owl pairs, we used a 2-stage sampling scheme. First, we estimated nest success among known owl pairs. Success was defined as observing 1 chick at approximately days of age during weekly observations of approximately 15 minutes each. We aged young via visual techniques described by Haug et al. (1993) and Priest (1997). We assumed that we detected failed and successful nests with equal probability; that is, our detection rates for each of these nest types were equal and resulted in an unbiased estimate of nest success. Based on our intensive field observations, this assumption is reasonable although further work is needed for identifying a probabilistic approach for detecting nests. 61

62 The second stage of estimating reproductive rates was the estimation of the number of young per successful nest. We defined productivity as the maximum number of approximately day-old young observed simultaneously at a nest over a series of 15-min observation periods. For nests that we identified as successful from the observations, we estimated the number of young during a series of 5 30-min watches, each separated by at least 6 hr ( productivity watches ; Gorman et al. 2003). This allocation of total effort reflected our goal of providing a logistically feasible method when a large number of nests are under study. We restricted the observations to a narrow range of age of young so that any confounding of mortality with comparisons of reproductive rates would be minimal. Also, at this nestling stage young are most easily counted because they are active above ground but remain close to the nest burrow (Haug et al. 1993). Observations were typically made from a distance of m using either binoculars or X spotting scopes during the morning or evening, within approx. 3 hr of sunrise or sunset. We conducted productivity watches for a longer extent (between 0545 and 2000) at the Grassland site due to both logistics and cooler weather conditions. All observations at a nest were completed within 7 days of initial observation. Detailed aspects of the reproductive biology of Burrowing Owls were examined from nest boxes in the Fragmented and the Agricultural sites, and from natural nests in the Grassland site. We estimated dates of clutch initiation, re-nesting probability, nest survival, clutch size, and nestling survival rates from one or more of these sites. Urban We estimated nest success and productivity during at all sub-study areas and at 3 sub-study areas (Parkland: Shoreline and Sunnyvale; Urban: Moffett) in 2002 and All nests located prior to May 15 were included in the sample each year. Fragmented We included all nests that were sampled for eggs for a concurrent toxicology study (Gervais et al. 2003, Gervais and Anthony 2003) to estimate reproductive rates during In addition, in 1997 we estimated reproductive rates using a single count from a 2.5-hour observation period. Our sample protocols resulted in a large sample of nests throughout the study area, and we assumed that this was equivalent to a random sample. Nests that were excluded were typically the few that were very difficult to access the nest burrow for egg removal, typically due to security concerns or safety issues associated with Naval Air Station operations. In 2000, an additional 13 nests were added to the productivity watches by randomly selecting them from a list of active nests that were not sampled for contaminants (Gervais and Anthony 2003). 62


63 Grassland We included all nests located within this study area for estimation of reproductive rates in In addition, in 1997 we estimated reproductive rates using a single count from a 2.5-hour observation period, as we did in the Fragmented site. In 1999 and 2002, we also investigated nest contents and estimated the initiation date, size, and survival of clutches using the infrared burrow scope. In 2002, as part of the dispersal study, all nests found during the field season were viewed through the infrared camera as soon as possible after they were found in order to determine nesting stage. Some burrows could not be navigated with the infrared scope due to tunnels that were too small in size or sharp turns. For burrows that could not be navigated, nest observations were performed once a week for at least half an hour beginning at the end of May. To minimize disturbance, typical checks lasted less than fifteen minutes. We recorded behaviors of the nesting pair, the presence of decoration in the nest tunnels, any prey cached inside the burrow, the number of eggs present, and the number and approximate age of chicks found. Active nests were checked with the infrared scope every 3 to 5 days; potentially active nests were viewed once a week. We discontinued this once nest failure was confirmed, or the young could no longer be observed by underground viewing because they had moved from the nest chamber. We conducted 30-min nest observations at all the nests we found to estimate nest success; watches were initiated when the expected age of chicks, based on observations of nest contents, was approximately 14 days old. If chicks were not seen during the initial nest watch, watches were performed every day for 3-5 days. If chicks were never seen outside of the nest burrow, the nest was assumed to have failed. Productivity estimation, using the five 30 min observation periods, was not conducted. Agricultural We randomly selected nests to estimate productivity from privately owned agricultural land within the ISA and all occupied nest boxes within the Refuge not subject to experimental feeding or predation from a concurrent study (Haley 2002, Catlin 2004) within the Refuge. Nests for which we could not estimate productivity due to limited visibility of nests or an inability to determine whether or not the nest was successful were excluded from analyses. In 1998 and 2002, only owls that were first observed nesting in nest boxes were included in the sample. In nest boxes within the Refuge and the Refuge Headquarters, and along property owned by Kalin Farms, we examined detailed aspects of the reproductive biology. In 1999 and 2000, we evaluated date of first laying, clutch completion, and hatching, and measured clutch size and nest success. We also examined clutch size in

64 In 2002, we evaluated re-nesting probability and subsequent clutch size following experimental nest predation (Catlin 2004). We monitored all nest boxes with evidence of owl use weekly until eggs were seen. During each visit, we used the infrared probe to observe nest contents. Once eggs were seen, we visited nests at 3 to 4 day intervals to estimate clutch completion dates. Diet We estimated the diet composition of Burrowing Owls from regurgitated pellets and from fresh prey items left at the mouth of the burrow. We collected pellets from nests that were selected for estimation of reproductive rates (see Reproductive Rates, above). We collected regurgitated pellets of indigestible prey remains and recorded prey remains from each nest approximately every 2 weeks throughout the breeding season. We identified invertebrates in pellets to order or family when possible, and vertebrates were identified to genus or species. Pellets were collected in most years and sites (Table 4-1). Fresh prey items were collected at nests during nocturnal trapping on an occasional basis. Habitat Initial Study To quantify which physical characteristics of nest sites at the Fragmented and the Grassland site may influence nest success, we took measurements of vegetation around the burrows. Biomass samples were collected from every burrow at the Fragmented and Grassland sites in At locations 0.5 and 2.0 meters out from each burrow in four directions differing by 90 o all the vegetation within a 10x10cm block was clipped down to the soil. These samples were dried and weighed in the laboratory. Detailed Study in the Grassland Site A thorough investigation of nest site characteristics and their influence on site fidelity and reproductive rates was conducted in the Grassland site in 1999 and The following describes the methods used in that effort, taken from Ronan (2002). Paired Burrows-- A paired comparison approach was used to examine habitat character between nests and unoccupied burrows nearby, allowing us to examine nest habitat selection within an otherwise similar environment. Habitat characteristics at nests and at unoccupied burrows were measured between June 5 and July 6, Vegetation samples reflected conditions at the nest after the growing season was complete and after cattle were removed from pastures. 64
65 Unoccupied burrows were located based on the criteria that they be the closest intact, unoccupied burrow with an opening of at least 10 cm diameter, that lay beyond a 100 m radius of the nest burrow. The 100 m radius is the area within which nesting owls utilize satellite burrows (Green and Anthony 1989, Desmond and Savidge 1999, Ronan 2002). We used the first suitable burrow found along a random compass bearing. We measured habitat characteristics that may influence burrowing owl foraging efficiency and predation risk, and thus influence habitat selection. To examine whether vegetation characteristics differed with distance from the nest burrow, we measured vegetation along 4 20-m transects radiating from the nest and unoccupied burrow. The compass bearing of the first transect was randomly chosen with each transect thereafter being 90 degrees apart (Green and Anthony 1989). At 5 m and 20 m along each transect, vegetation density and effective height measurements were taken (Ronan 2002). Mulch density was estimated by noting its thickness on a vertical rod. Vegetation density was estimated by counting the number of vegetation contacts on the vertical rod using categories of 10 cm-gradations from 0-70 cm. Effective height was measured using a white board marked with centimeter gradations. The height at which 90% of the board was obscured by vegetation, as viewed from a distance of 10 m away and 1 m above the ground, was recorded (Green and Anthony 1989). We recorded the number of perches and potential satellite burrows (diameter $10 cm) within 50 m of the nest and unoccupied burrow. Nests located within 20 m of a road (the length of the sampling transect) were excluded. Unpaired Burrows-- To understand habitat factors associated with a nest site at a scale larger than the immediate area, we measured habitat characteristics at Burrowing Owl nests and unoccupied, random burrow locations within the study area between June 20 and July 21, We followed the same habitat measurement protocol as discussed above. To locate random burrows, we generated a list of random points that were within 500 m of either side of call survey transect roads (roads surveyed since 1998) using the geographic information system (GIS) and coverage data for Carrizo (California Energy Commission 1991) and navigated in the field with a Global Positioning System (GPS; Garmin 12XL, Garmin International, Inc., Olathe, KS). Because the probability of owl detections decreased with distance from the call survey transect (see Patterns of Density, Chapter VI), 500 m on either side of the transect road represented an area in which most (0 = 80%, ) owl nests were detected. We located the nearest intact burrow with a diameter of $10 cm within 50 m from the random point and measured habitat characteristics as described previously. If a burrow was not found then habitat characteristics were not measured. 65
66 Table 4-1. Summary of fieldwork conducted at each of the four study sites. Study Areas Density Reproductive Rates* Urban Mark- Resight Radio Telemetry Diet (pellet analysis) None Fragmented Grassland ,2000, Agriculture ** , , * Years we conducted nest watches using the method described in Gorman et al. (2003). Additional estimates of reproductive rates were made within part or all of several study areas in additional years (see text). ** Only nest boxes were included in the sample in 1998 and 2002 in the Agricultural site. 66


67 Part 2: Research Findings 67

68 V. Reproduction Summary In this chapter, we attempt to understand the reproductive biology of the Burrowing Owl, and in particular, assess individual, spatial, and temporal variation of nest success and the number of young. Burrowing Owls are particularly difficult to assess the number of young because of their underground nesting habits. To address this issue, we developed specific protocols to facilitate comparisons across individuals, years, and study areas. We include data from , but we only collected reproductive data at a subset of these years at any particular study area. Both nest success (nests producing 1 young) and number of young per successful nests varied greatly among individuals, sites and years. Some sites were more variable than others, and we attributed this variation to food supply. Nest success ranged from as low as 26% in some sites and years, to approximately 90%. The Urban study area had the lowest average nest success, which did not vary greatly among years. The Grassland site was the most variable. The Fragmented and the Agricultural study sites had the greatest nest success. Nest success varied less than the number of young per successful nest. The Fragmented study area had the greatest number of young per successful nest; owls within this study area also demonstrated high variability among nests. Number of young was greatest in the year that we observed a very high number of California voles. The high variability among nests within a site and year, demonstrates potential for identifying factors that can be managed to increase Burrowing Owl productivity. One of the primary goals of our study is to understand the reproductive biology of Burrowing Owls in four distinct environments that owls occupy in California, and that are similar to environments they inhabit throughout their range. As described in Chapter IV, Field Methods, we investigated the owls reproductive biology by observation of natural nests and by examining nest boxes. We applied similar methods to each study site and year. However, to accommodate logistical differences among study areas and to incorporate improved methods, we modified methods during some years and study sites. Further, in several years we conducted experiments that affected reproduction (Haley 2002, Ronan 2002, Catlin 2004). We excluded nests that we considered affected by our experiments from the comparative analyses presented here. Specifically, this excluded nests, primarily but not exclusively nest boxes, that received supplemental feeding in 1999 and 2000 and nests for which adults were radio-harnessed at the Agricultural site. Nests included in an experimental study of satellite burrows (Ronan 2002) were not excluded because of the limited effect on reproductive performance. In this chapter, we report on what we consider to be our best estimates of reproductive success and productivity to allow rigorous comparisons among individuals and populations and 68

69 to provide input values for computing projection-based estimates of population growth. Through these analyses, our goal is to provide insight into factors affecting the reproductive biology of Burrowing Owls and ultimately their population dynamics. To allow unbiased comparisons, our best estimates of nest success included all nests that we observed sufficiently to be confident of an accurate assessment of nest success. However, there are challenges with determining what constitutes a nest, when the nest was initiated, and whether or not adults from a failed nest subsequently renested but without our knowledge, making estimates of nest survival difficult. We assumed that our nests in the sample for nest success were representative of all nests and were located independent of whether or not they would eventually be successful as defined by at least 1 young reaching 14 days of age. Estimates of the number of young in Burrowing Owl nests are made difficult by their underground nesting and thus the challenge of detecting young. For comparisons of the number of young, we report on estimates from the nests we included in our sample for repeated nest observations using methods we described in Chapter IV, Field Methods and formalized in Gorman et al. (2003). During the first year of the study, 1997, we used slightly different methods than we used in the remaining years of the study, as described in Chapter IV, Field Methods. We know that our counts are negatively biased, but they may offer the most reliable estimates for comparisons among sites, years, and individuals, particularly when the probability of detection can be incorporated into analyses. In 2002, we modified methods at the Grassland site to facilitate dispersal studies. These methods were similar to the methods we used in earlier years, except that we used more frequent but less intensive nest observations, as described in Chapter IV. We consider these methods sufficiently similar to our earlier methods to include these data in the comparative analyses presented here. Adults at these nests may have had increased mortality due to radio harnesses (Gervais et al. 2006). For our best estimates of the actual number of young, we used the maximum number of young ever observed during the study for the nests selected for the formal nest observation, regardless of the frequency or duration of observations. We include the maximum number of young observed from the artificial nests at the Agricultural site that were not included in the formal nest observations. Our estimates of the maximum number of young included both failed and successful nests, as this quantity is relevant for estimation of population growth rates. A summary of estimates from each study site and year is provided in Table 5-1. Number of Nests in Study Sites We identified and marked burrowing owl nests during four or more years at the four study areas during Due to our sampling methods, we assume we located all nests in the Urban, Fragmented, and Agricultural study areas, but only a proportion of the nests in the Grassland site (See Chapter VI, Patterns of Density). Number of nests varied from 31 to 122 during the study (Figure 5-1), with a total of 1193 nests during the study, including all sites and years regardless of their inclusion in particular analyses. This sample allowed estimation of reproductive success and productivity from a large number of nests. 69
70 TABLE 5-1. Summary of reproductive metrics estimated during each year and at each study area. Study Areas Urban Nest success on accessible nests Fragmented Grassland Nest success from all accessible nests, and productivity from selected nests for three 2- hr obs. Nest success from randomly selected nests; productivity from these nests and all other nests obs. with chicks using three 2 hr obs. Agriculture Nest success and productivity from nest boxes using number known in nest Nest success on accessible nests and productivity observations from most successful nests using five 30-min counts Nest success and productivity from selected nests using five 30 min counts Nest success and productivity from randomly selected nests using five 30-min counts Nest success and productivity estimated from randomly selected natural nests and all nest boxes not subject to feeding trials. Includes counts using five 30-min watches and number known in nest boxes. Nest success and productivity from all nests using a combination of underground viewing and nest observations
71 125 Number of Nests Urban Grassland Fragmented Agriculture Study Site FIGURE 5-1. Number of nests located within each study area during Number of nests within the Grassland study area represents only a sub-sample of nests within that site (see Patterns of Density, CHAPTER VI).
72 Sample Sizes for Analyses We included a large proportion of the nests we located in our sample for estimating nest success, which we defined as a nest that raised at least one young of at least 14 days old. All nests that we visited frequently were observed for young during nest watches of at least 15 min. At the Urban site, almost all of the nests were included in the sample for nest success; access to a few was restricted and these were excluded from analyses. At the Grassland site, we only included the random sample from all nests that were to be observed for nest productivity except in 2002 where we included all nests located for inclusion in the study of dispersal (Chapter VII, Estimation of Movement and Survival). At the Fragmented study area in 1997, we included all nests for which we had frequent access. In all other years at this site we included only nests that were to be included in the sample for the estimation of nest productivity (see below). Because of the very large sample of nests at the Agricultural study area, we included only those nests used in the estimation of productivity and all the nest boxes other than the nest boxes subjected to the feeding experiment in 1999 and 2000 (Haley 2002). We did not do productivity watches in 2002 at the Agricultural site and because all boxes were used in the experiment, we do not include this year in our analyses of nest success. Our methods thus resulted in a varying number of nests for estimation of nest success across years and study areas (Figure 5-2.). 70 Number of Nests Urban Grassland Fragmented Agriculture Study Site FIGURE 5-2. Number of nests included in the analyses of nest success. 72
73 Our sample sizes were smaller for analyses of nest productivity, defined as the number of young days of age (Gorman et al. 2003) per female per year. We were concerned with potential biases of comparing counts without a formal protocol based on nest observations because of the incomplete and uncertain detectability of young at any single observation. Our field methods were developed with this in mind and our evaluations of this protocol (Gorman et al. 2003) supported our methods. We thus included only nests for which we included 3 nest observations of 2 hours each (1997) or 5 observations of 30 min each ( ), including nest boxes. For some analyses and to include a larger sample, we used estimates based on the maximum number of young days of age counted during all observations regardless of the number of observations or whether or not it was a nest observation based on the protocol described above. This includes the number of young observed within nest boxes at the Agricultural site, representing the actual number of young. We compare these counts to those from the formal nest watch protocol. For analyses, we use the appropriate estimate based on the question asked. In particular, the maximum number (i.e., beyond the 5 observations if more exists) of young represents the best metric for estimation of population growth rate with projection-based matrix methods, unless the proportion of young not counted can be estimated. We thus include in our summary statistics the number of young from the nest observations and the maximum number of young known based on all observations of young, and from nest boxes this includes the true number of young. Sample sizes varied among sites and years and ranged from nests (Table 5-2). TABLE 5-2. Number of nests used in analyses of productivity in successful and failed nests at each of the four study sites. Study Areas Urban Fragmented Grassland 19* Agriculture** 0(13) 26(3) 30 (7) 25 (14) *. There were an additional 14 nests included in nest observations of successful nests. **. Number of nest boxes in the Imperial Valley that were included in the maximum number of young counted but not included in the counts from nest observations is indicated by ( ). Note that some nest boxes were included in counts from nest observations and these are included in the values without ( ). 73
74 Nest Success The percent of nests that were successful in rearing at least one chick days of age was highly variable, both among study areas, years, and individuals from one year to the next. Among the years we investigated, the Urban site had the lowest nest success (48.2 " 2.4%), ranging from % among years (Figure 5-3, A). The Grassland site was more cyclic with alternate years as low as 26.3% and high years reaching 56.6% nest success (Figure 5-3 B), which resulted in this site having the highest variability (CV = 33.9%). The Fragmented (76.5 " 5.0%) and the Agricultural (74.8 " 4.8%) study areas had the highest percent of nest success with low years never less than 66% and high years approaching 90% (Figure 5-3, C and D). The Agricultural site had similar variation among years (CV=9.7%) as the Urban (12.1%) and Fragmented (13.0%) study areas. 74
75 A. Urban Number of Nests Success Failed PctSUC Percent Successful Year 0 30 B. Grassland 100 Number of Nests Percent Successful Year 0 FIGURE 5-3. Number of failed and successful nests and the percent of successful nests for the (A) Urban and (B) Grassland study sites. The vertical bars shows the number of nests and the line is the percent of nests that were successful ( 1 young). 75
76 C. Fragmented Number of Nests Success Failed PctSUC Percent Successful Year D. Agricultural Number of Nests Percent Successful Year 0 FIGURE 5-3 (continued). Number of failed and successful nests and the percent of successful nests for the (C) Fragmented and (D) Agricultural study sites. The vertical bars shows the number of nests and the line is the percent of nests that were successful ( 1 young). 76
77 Nest Productivity The large number of nests that failed was the primary determinant of nest productivity as demonstrated by the difference between productivity of successful nests (Figure 5-4) versus all nests (Figure 5-5). There were a total of 297 successful nests for which we estimated productivity through formal nest observations. On average, using the grand mean estimate of the annual means from each study area, productivity of successful nests was approximately 10-20% lower in the Urban site (3.2 " 0.2 young/nest) than the Grassland (3.6 " 0.6 young/nest) and the Fragmented (3.8 " 0.6 young/nest) sites, and slightly higher than the Agricultural site, which, on average, had the lowest productivity of successful nests (2.9 " 0.3 young/nest). Variation among years was moderate at the Urban (CV = 9.4%) and the Agricultural (16.4%), but relatively high at the Grassland (36.9%) and Fragmented (34.2%) study sites. (Fig. 5-4). Productivity was particularly high in 1999 at two sites, with an average of 5.4 and 5.5 young/nest at the Grassland and Fragmented study areas, respectively (Fig. 5-4). Within years, there was considerable variability among nests of the number of young estimated in successful nests. This was particularly the case in the Grassland and Fragmented study areas. In any given good or poor year, there were outliers (Fig. 5-4). The Agricultural site was most consistent, with narrow ranges for the 75 th percentile distribution (Fig. 5-5, D). Our next set of analyses will be presented in the Addendum and will thoroughly evaluate factors associated with the high within-year variability, exploring nearest neighbor distances, previous nest history, adult mass, diet, and geographic location. Patterns were quite different when we examined productivity from all nests (n=534 nests) regardless of whether or not they were successful (Fig. 5-5), which was due to combining the high variability of nest success and the variability of productivity per successful nest. The Urban site had the lowest variability (CV=16.3%) coupled with a low productivity (1.5 " 0.1 young/nest). The low productivity was similar to the Grassland site (1.5 " 0.4 young/nest), but this site had much greater variability (CV=63.6%; Fig. 5-5, A and B). Indeed, the average productivity varied only from young/nest among years at the Urban site, whereas the Grassland site varied from almost complete nest failure (0.6 young/nest) to relatively high productivity (3.0 young/nest; Fig. 5-5). The Fragmented site had, on average, the highest annual rate (2.7 " 0.7 young/nest), approximately 20% higher than the Agricultural site (2.1 " 0.5 young/nest). The Agricultural site was more consistent (CV=37.5%) than the Fragmented site (56.0%), which exhibited much greater levels of both annual and within-year levels of productivity (Fig 5-5, C and D). 77
78 12 A. Urban Number of Young Year B. Grassland 12 Number of Young Year FIGURE 5-4. Number of young from formal nest watches in successful nests for the (A) Urban and (B) Grassland study sites. Number of nests are shown under the box plots. The median (solid line through the box), mean (dotted line through the box), 25 th 75 th percentile (shaded box) and the 10 th -90 th percentile (bars), and outliers are illustrated on each box. 78
79 12 C. Fragmented Number of Young Year 12 D. Agricultural Number of Young Year FIGURE 5-4 (continued). Number of young from formal nest watches in successful nests for the (C) Fragmented and (D) Agricultural study sites. Number of nests are shown under the box plots. The median (solid line through the box), mean (dotted line through the box), 25 th 75 th percentile (shaded box) and the 10 th -90 th percentile (bars), and outliers are illustrated on each box. 79
80 12 A. Urban Number of Young B. Grassland Year Number of Young Year FIGURE 5-5. Number of young estimated from failed and successful nests for the (A) Urban and (B) Grassland study sites. Number of nests are shown under the box plots. The median (solid line through the box), mean (dotted line through the box), 25 th 75 th percentile (shaded box) and the 10 th -90 th percentile (bars), and outliers are illustrated on each box. 80
81 12 C. Fragmented Number of Young Year 12 D. Agricultural Number of Young Year FIGURE 5-5 (continued). Number of young estimated from failed and successful nests for the (C) Fragmented and (D) Agricultural study sites. Number of nests are shown under the box plots. The median (solid line through the box), mean (dotted line through the box), 25 th 75 th percentile (shaded box) and the 10 th -90 th percentile (bars), and outliers are illustrated on each box. 81
. There are three fundamentally different ways to deal with this when the actual number of young is desired, such as is needed for population projection models.")

82 Counts from the formal nest observations were known to be negatively biased, based on work we conducted comparing known number of young to various methods of estimating the number of young (Gorman et al. 2003). There are three fundamentally different ways to deal with this when the actual number of young is desired, such as is needed for population projection models. The first way is to estimate the number undetected through markrecapture methods. Although theoretically appealing, in practice this is very difficult with Burrowing Owl young because of the difficulties associated with reliable resighting marked owlets. Another approach is to incorporate the distribution of the number of young not counted at nests from a subset where the number is known, such as reported in Gorman et al. (2003); this is then used to partially correct the estimates, as Chelgren et al. (unpubl. ms) reported. Finally, a less theoretically strong method but one that is simple in practice is to augment counts from the formal nest observations with additional counts, i.e., greater than the 5 formal nest observations we conducted. Without question, this could still result in a potential negative bias, that is, some young likely remain undetected from counts. However, using these augmented counts should reduce the negative bias. We report on those estimates here and compare them to the estimates of young from the formal nest observations. We obtained similar results of productivity based on the formal nest observations and that using all nest observations when we compared the number of young from nest boxes within the Agricultural study area at which formal nest observations were conducted (Figure 5-6). Counts were slightly higher, but in some cases they were identical due to the lack of additional observations. It is also possible, and surely occurred in some cases, that counts were complete, that is, all young were observed in some nests, as reported by Gorman et al. (2003). In support of our ability to detect true patterns, patterns of annual changes in productivity from known number of young in nest boxes at the Agricultural site (Fig. 5-7) were very similar to those from our estimates (Fig. 5-5, D; Fig. 5-6, D). 82
83 12 A. Urban Number of Young B. Grassland Year Number of Young Year FIGURE 5-6. Number of young estimated from maximum number of young counted in nests selected for formal nest observations, including successful and failed nests for the (A) Urban and (B) Grassland study sites. These estimates include observations beyond the five required under the nest observation protocol. Number of nests are shown under the box plot. The median (solid line through the box), mean (dotted line through the box), 25 th 75 th percentile (shaded box) and the 10 th -90 th percentile (bars), and outliers are illustrated on each box. 83
84 12 C. Fragmented Number of Young Year D. Agricultural Number of Young Year FIGURE 5-6 (continued). Number of young estimated from maximum number of young counted in nests selected for formal nest observations, including successful and failed nests for the (C) Fragmented and (D) Agricultural study sites. These estimates include observations beyond the five required under the nest observation protocol. NUMBER of nests are shown under the box plot. The median (solid line through the box), mean (dotted line through the box), 25 th 75 th percentile (shaded box) and the 10 th - 90 th percentile (bars), and outliers are illustrated on each box. 84
85 8 Number of Young Year FIGURE 5-7. Number of young from counts of the maximum number observed in only nest boxes within the Agricultural study site. Numbers of nests are shown under the box plots. The median (solid line through the box), mean (dotted line through the box), 25 th 75 th percentile (shaded box) and the 10 th -90 th percentile (bars), and outliers are illustrated on each box. 85
86 Spatial Distribution of Reproductive Success Another aspect of our analyses is to evaluate spatial patterns of nest success and productivity. These analyses will be presented in our next report. Here, we graphically illustrate the spatial pattern of nest success at each study area and year. Analyses of these patterns to explain variation of nest success and productivity among sites, years, and individuals will be described in the Addendum to this report. 86
87 Spatial Patterns of Nest Success in the Urban Study Area Blue=Success, Black=Failed 87
88 88

89 89

90 Spatial Patterns of Nest Success in the Grassland Study Area Magenta=Success, Black=Failed 90


91 91

92 92


93 Spatial Patterns of Nest Success in the Fragmented Study Area Red=Success, White=Failed

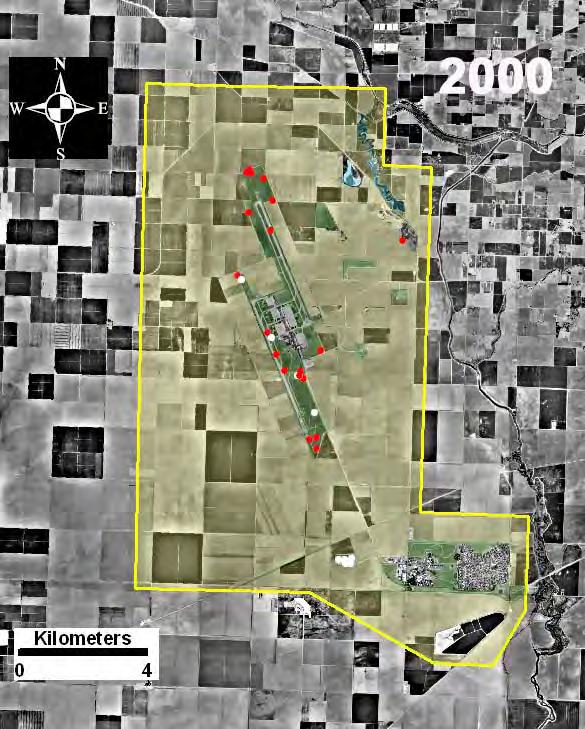
94

95 Spatial Patterns of Nest Success in the Agricultural Study Area Blue=Success, Black=Failed 95
96 96
97 VI. Patterns of Density Summary In this chapter we estimate and compare density of Burrowing Owl nests, as a surrogate for the number of breeding pairs, across the four demographic study areas in California. We consider two forms of density: crude density, defined as the number of nests/km 2 over the entire study area, and nest habitat density, defined as the density of nests within areas considered to be potential nest habitat. To accommodate the different study areas, we used several methods for locating nests, estimating detection probability, and estimation of density. At the Grassland site, we estimated a crude density of 1.0 nests/km 2 and a nest habitat density of 1.4 nests/ km 2 during 1997, the first year of the study and the year that allowed the most accurate estimates of density. Assuming equal detection rates across years, we estimated similar densities on average: crude density as 1.0 ± 0.08 nests/ km 2 and a nest habitat density of 1.4 ± 0.1 nests/ km 2. We demonstrated that we had very high detection rates at the other 3 study areas, approaching 1.0, suggesting that we found all of the nests within the study areas. Densities were highest at the Agricultural study area (crude: 6.5 ± 0.3 nests/km 2 ; nest habitat: ± 35.6 nests/km 2 ), exceedingly greater than either the Fragmented (crude: 0.9 ± 0.1nests/ km 2 ; nest habitat: 15.0 ± 1.5 nests/ km 2 ) or Urban site (crude: 1.8 ± 0.1 nests/km 2 ; nest habitat: 2.9 ± 0.2 nests/km 2 ). Within the Urban study area, there was much greater spatial variation than temporal variation, due largely to one of the seven sub-study sites that contained almost one-third the nests. A decline in the number of Burrowing Owl nests within the Urban area was largely due to declines within two of the sub-study sites. Methods In this section, we estimate densities of nesting pairs of Burrowing Owls. We base our findings on location of nests as the metric for estimating densities and thus only consider owls during the breeding season. Single owls that frequently move are largely ignored by this method; we found few single owls that remained near a single burrow or cluster of burrows and those that were identified are ignored here. We provide sufficient details in this chapter for the reader to understand our approach and findings. Some of the methods described here were first described in Chapter IV, where more detailed descriptions are available. Location of Nests We found that the most efficient methods for locating Burrowing Owl nests were sitespecific. We used a combination of call-broadcast surveys, line transect surveys that were conducted on foot, and surveys conducted from vehicles. Call surveys for Burrowing Owls are most effective in large grasslands (Haug and Didiuk 1993, Ronan 2002, Conway and Simon 97
 whereas line transects were effective in smaller habitat patches (Gervais 2002).")
98 FIGURE 6-1. Grassland study area with the boundaries of the Carrizo Plain Natural Area shown in yellow and the road network used in the surveys. Vegetation type is shown within the sampled area, defined as within 500-m of the survey road. 2003) whereas line transects were effective in smaller habitat patches (Gervais 2002). Roadside surveys were effective in the Imperial Valley, where most of the owls nested along drains, canals, and ditches, all of which run parallel to roads (Rosenberg and Haley 2004). We thus took advantage of the most effective method at each site and estimated detection probabilities with each of these methods, allowing densities to be compared among sites. At the Grassland site, we used call surveys coupled with line transects. Call surveys were conducted along vehicleaccessible roads 800m elevation (Fig. 6-1) during We broadcast the territorial coo coo call of the Burrowing Owl from April - June between 1830 and 0230 h from a loop tape (Cornell Laboratory of Natural Sounds, Ithaca, NY) played through a portable cassette player and a megaphone preset to broadcast at decibels at a 1m distance (Ronan 2002). The recorded calls were spaced 10 seconds apart. Surveys were not conducted when wind speed exceeded 12 km/hr, which we approximated using a hand-held wind meter and repeated at hourly intervals. We established call stations every 0.3 km along vehicle-accessible roads. At each station, the observer got out of the vehicle and listened for one minute for Burrowing Owls already vocalizing and then played one call in each cardinal direction. The observer listened for four additional minutes after the final call was broadcast. When owls responded, a compass bearing to the owl was estimated. To identify the most likely location of nests, we used biangulations of bearings taken on owls responding to the broadcast call (program LOCATE II; Nams 1990). We conducted a search with a radius of approximately 100 m around the estimated location of the nest in daylight and on foot. If the nest was not found, we conducted surveys along transects to locate the nest. We established transect surveys within an area of 0.5 km sides, centered on the assumed location of the nest. Transect surveys were also used at the Urban and Fragmented study areas within all potential nesting habitat. We used transect surveys conducted by observers on foot to determine the precise location of potentially active owl nests at the Urban, Fragmented, and Grassland sites. Transects consisted of diurnal searches for owls and potential nest sites with observers walking approximately 98
 were surveyed in this manner.")
99 7-20 m apart, depending upon vegetation height and density. Transects covered the entire length of the area of interest. In the Urban and Fragmented site, all areas of potential owl habitat (described below) were surveyed in this manner. During surveys, all potential burrows used by owls as determined by the presence of single owls, pellets, or prey remains and whitewash were identified and GPS coordinates taken. Possible nests were identified using criteria listed below, and were marked with tags or poles. This was the first step in determining whether a burrow was a nest burrow. We pre-stratified the Urban study area into strata of high (hereafter Urban ) and low (hereafter Parkland ) levels of urbanization (Table 6-3). We focused only on large, relatively discrete patches with two basic land management practices: Parkland sub-study areas were not slated for development and were managed for public access and wildlife conservation; Urban sub-study areas were open grassland areas partially developed that were available to future development. Owls nesting in the Urban stratum utilized vacant lots and parking lots, landscaping, athletic fields, golf courses, embankments along sidewalks and roads, and an airfield margin. Owls nesting in the Parkland stratum utilized embankments, closed landfills, a golf course, and city parks. The Urban area consisted of 4 sub-study areas (Moffett, Mission, Tasman, and Agnews) and the Parkland strata consisted of 3 sub-study areas (Byxbee, Shoreline, and Sunnyvale; Table 6-3). All but one nest were observed within the sub-study areas). There are a few areas outside of sub-study areas where owls may have nested, but most of the area outside the sub-study areas were paved surfaces, housing, commercial buildings, landscaped lawns (with ground squirrel control). Most of it is private property and inaccessible. We did not try to follow or locate owls within this highly developed matrix but we would likely have been notified if owls were seen in these frequently visited locations. We conducted road surveys only at the Agricultural site. We surveyed all watercourses (drains, canals, and delivery ditches) that bordered agricultural fields by vehicle two times and, in 1998, once on foot. Surveys were performed along all of the roadways and waterways within the ISA and Refuge from 1998 to 2002 (Fig. 6-2). We drove on both sides of drains, and if appropriate for viewing the drain, we left the vehicle and viewed the specific area by foot. We only surveyed middle strips through fields if it appeared that owls could be living there. Some were too disturbed for burrows. We conducted surveys at vehicle speeds of 10 FIGURE 6-2. Agricultural study area in the Imperial Valley. Surveys used in the density estimates were conducted within the REFUGE (NW portion) and the ISA (rectangle). Canals (green), drains (brown), and delivery ditches (lining fields) form the irrigation infrastructure that comprises nest habitat. km h -1 with two observers during the morning (30 min before sunrise to 4 hrs after) and evening (3 hrs before sunset until sunset) when wind speeds were < 15 km/hr. Occasionally, one observer would drive and the second observer would walk 99
100 simultaneously along opposite sides of wide drains to ensure adequate coverage. These surveys resulted in locating nests, but at the time of the survey we were not certain as to their status as active nests. This is particularly difficult at the Agricultural site because of the high density of Burrowing Owls and many burrows that could serve for purposes other than as nest sites, including non-used, satellite, or roost burrows. Throughout the breeding season, burrows were checked for status as active nests. The underground nests of Burrowing Owls provide a challenge in determining whether or not a particular burrow contains a nest. We used both behavioral and physical evidence of nesting to determine if a pair had initiated nesting in a given burrow (e.g., Millsap and Bear 1997). A burrow was identified as potentially active if owls were observed at a burrow or if evidence of use such as pellets, prey, feathers, whitewash, or decoration existed. Once burrows with signs of owl use were located, their status as active nests was determined using a list of predetermined criteria: 1.) Pair of owls seen at burrow 2.) Nest decorations present 3.) Egg shells present at burrow entrance 4.) Chicks seen 5.) Owls behavior at burrow during disturbance a) Alarm call given upon human approach b) Owl reluctant to flush, allows close approach c) Behaves defensively (aggression toward human) d) Owl retreats into burrow Burrows that were occupied by owls but whose status was unclear were rechecked every one to two weeks throughout the breeding season. This increased the likelihood of identifying an active nest. Indeed, the fact that nests are underground and that Burrowing Owls often nest in close proximity (Rosenberg and Haley 2004) and renest in a different location after nest failure (Catlin et al. 2005, Catlin 2004), makes the determination of a burrow as a nest site difficult and challenges current methods for estimating detection probabilities of nests, which has often been used for estimating density of breeding pairs of Burrowing Owls. Estimation of Detection Probabilities and Density We evaluated the likelihood of detecting an active Burrowing Owl nest for each survey method. Evaluations were done for Call Surveys (Grassland site), Road Surveys (Agricultural site), and Walk Transect Surveys (Fragmented site). Although we did not separately estimate detection probability at the Urban site, we used similar methods in similar environments to those at the Fragmented site and assumed detection probabilities were equivalent. To evaluate the nest search transect method at the Fragmented site, we surveyed Tumbleweed Park, an area of approx. 50 ha, with observers unfamiliar with nest locations. In 1998, observers followed the walk transect protocol and noted all burrows that indicated an active nest. Their results were compared to known nest occurrences based on extensive previous fieldwork, similar to double survey methods (Williams et al. 2002) which has been applied to estimating number of nests in other bird species (e.g., bald eagles (Haliaeetus leucocephalus, Anthony et al. 1999) and is similar to other methods assuming a closed population and mark-recapture methods (e.g., 100
101 Nichols et al. [1986] for estimation of the number of white-winged dove (Aenaida asiatica) nests). Our approach differed from that described by Nichols et al. (1986) in that we used a set of nests that we discreetly marked and that were searched by a team of observers, identical in protocol to our field methods (Chapter IV) rather than an estimate of population size (of nests) as the basis for computation of detection probability. We estimated detection probability as n/m, where n was the number of marked nests found and M was the number of marked nests; this results in a similar estimator as the double-survey technique used by Anthony et al. (1999). We used two approaches at the Agricultural site to estimate detection probabilities. In 1998, similar to the Fragmented site, we estimated detection probabilities of nests in an area approximately 10 km from the study area, where observers had no knowledge of nest locations. This stretch of road included a delivery ditch and a drain. We discreetly marked nests and then the surveys were conducted by naïve observers, unaware of the location of the marked nests, identical to the method applied at the Fragmented study area. We conducted this work on April 14-15, We applied the removal model of Zippen (1958) as our second method for estimating detection probability of Burrowing Owl nests. This model estimates population size as a function of the number of new individuals, or nests as in this study, that are encountered on each survey (Otis et al. 1978:28). We applied this estimator to Burrowing Owl nests within the Density Study Area (Fig. 6-2). We divided the ISA (area outside of the Refuge) into 18 approximately 800-m (quarter sections) blocks, and surveyed each alternating block outside of the Refuge from April We followed the protocols for road surveys as described previously. Detection from the combination of call surveys and transect surveys were evaluated at the Grassland site from the initial survey in 1997 using distance-based population estimation approaches (Buckland et al. 1993). We computed the nearest distance of all nests from the road network used in the call surveys (described above) and use these distances to compute a detection probability based on a declining detection probability with distance from the road (Buckland et al. 1993). We consider our 1997 data as least biased because all nests were found through the call survey/transects whereas nests included those found during searches for nests found in the previous year. We report density estimates for all years using the detection probability estimated in Estimation of Habitat Area We estimated two types of densities: crude density, the number of nests divided by the total area of the study site, and nest habitat density, the number of nests divided by the area of habitat that potentially could be used for nesting. The latter estimate of density is made difficult by the challenge of defining habitat suitable for nests of the Burrowing Owl because of their very broad selection and their use of human modified environments (Chapter I). However, estimates of nest habitat density provide a relevant metric for understanding potential population size of owls within managed systems and for understanding how vegetation management may affect owl numbers and density. Further, the very distinct clumped nature of Burrowing Owl nests suggests that nesting density may be ecologically more relevant than simply the density within a defined study area, of whose boundaries are at least somewhat ecologically arbitrary. 101
102 In the Urban study area, we collapsed all IKONOS habitat classified satellite imagery generated in 2000 to characterize land cover. A cover type map was developed in Erdas from a radiometrically rectified IKONOS image with 4 m resolution. We pooled the cover types into 5 classes: urban, grass, wetland, shadow, and unclassified that simplified the habitat types into those that we believed were most relevant for Burrowing Owls and should minimize error rates among similar types. URBAN included those habitat types initially classified as building, street, parking areas, or a combination of these types. PARKLAND included irrigated and non-irrigated cover types that were nonurban and areas classified as bare ground. Wetland sites included those initially classified as one of several types of wetlands or other areas of water. Owls likely forage in most of these habitats to some extent, but primarily nest in the FIGURE 6-3. Urban study area showing sub-sites that were classified as either Urban (U) or Parkland (P). habitat defined as GRASS. Indeed, not all of these GRASS habitats provide suitable nest habitat, and they vary considerably in use from vacant lot to golf course, and in some cases are grassy areas with tree cover. This was our best estimate, however, of suitable nesting habitat. Because of the highly variable nature of habitats classified as simply Grass, we acknowledge this provides an overestimate of nest habitat. In the Fragmented study area, we pooled previously classified cover types into 3 general categories: GRASS, CROPLAND, and OTHER (Fig. 6-4). GRASS included all runway easements, grassland patches, and fallow fields. CROPLAND included all fields in active production, including alfalfa hay. OTHER included ditches, industrial areas, ramps, taxiways, runways, parking lots, and wetlands. Fallow fields were categorized as GRASS cover because they typically were not disturbed by tilling or pesticide applications during the growing season. We considered GRASS as suitable nest habitat because the owls frequently nest adjacent to runways and taxiways (Gervais et al. 2003), which comprise a large proportion of the GRASS areas. FIGURE 6-4. Fragmented study area, showing the small patches of grass habitat surrounded by an agricultural matrix. 102
103 The Grassland vegetation map was created from a ground survey of the remaining natural lands of the southern San Joaquin Valley during (California Energy Commision 1991). Vegetation sampling was conducted in each ¼ by ¼ section walk-over survey. Areas were mapped using vegetation types described in California Energy Commision 1991: Appendix A). We pooled these vegetation types into three classes: Grassland, Woodland, Scrub. We also included Soda Lake and areas classified as not sampled (Fig. 6-1). Based on our findings of almost all nests in Grassland, we considered only this type as suitable nest habitat for estimation of nesting densities. 103
104 TABLE 6-1. Vegetation cover class pooling regime used at Grassland study site. Original Class Pooled Class Ha (within CPNM) Description DSA SCRUB Diablan sage scrub ICR SCRUB Interior coast range saltbush scrub SS SCRUB Spiny-saltbush UPS SCRUB Upper sonoran sub-shrub scrub VSI SCRUB Valley sink scrub VSS SCRUB Valley saltbush scrub FALLOW GRASSLAND Fallow fields now non-native grass NNG GRASSLAND Non-native grass TILLED GRASSLAND Now fallow, non-native grass JOW WOODLAND Juniper-Oak woodland JWD WOODLAND Juniper woodland LAKE LAKE Soda Lake UNLABLED NOT SAMPLED No information NS NOT SAMPLED No information The Agricultural site is unique in the linear nature of the nests (Chapter II) and the challenge in quantifying nesting habitat. Almost all Burrowing Owl nests within the agricultural matrix are located within or along the water delivery infrastructure, consisting of drains, canals, and delivery ditches (Rosenberg and Haley 2004; Fig. 6-2). We assumed a 1-m wide area of nest habitat within or adjacent to both sides of water delivery infrastructure, including delivery ditches, drains, and canals. Drains and Canals are found primarily along the N-S roads in our study area (Fig. 6-2), whereas delivery ditches line the ½ x ½ mile fields and thus are found on both sides of the E-W roads. We found few owls nesting alongside ditches within fields; ditches are temporary in these areas and not conducive to Burrowing Owl nests. Therefore, we did not include mid-field ditches in the computation of nest habitat. We estimated 17.5 km of both drains and canals, and 39.1 km of delivery ditches in our computation of area available for nests. Slight corrections will be made to these estimates in the Addendum to this Final Report. 104
105 Results Study area size and nest habitat In order to estimate density, we computed crude density as the number of nesting owl pairs/area of study site and estimated ecological density as the number of owl pairs/area of nest habitat; we refer to this latter density as nest habitat density. Study areas varied greatly in the amount and proportion of nest habitat (Table 6-2). We used the values in Table 6-2 to compute owl densities at each study area. We similarly estimated total area of each sub-study site within the Urban study area and used these values for computation of owl densities (Table 6-3). TABLE 6-2. Study site size, amount, and proportion of nest habitat used in estimation of Burrowing Owl nest densities. Study site size (ha) Nest habitat (ha) Percent nest habitat Urban Fragmented Grassland 1 (sampled) Grassland 1 (CPNA) Agriculture ,605 18,283 80, ,912 40, Estimates of suitable habitat in the Grassland site are for two scales: sampled includes an area defined as within 500-m of the survey roads and CPNA includes the entire region within the Carrizo Plain Natural Area. 2 An estimate of potential nesting area within the Density Study Area (ISA and Refuge), given an assumption of a 1-m area of suitable nesting habitat on either side of ditches, canals, and drains. 105
106 TABLE 6-3. Sub-study site area, and amount and proportion of nest habitat used in estimation of Burrowing Owl nest densities in the Urban study area. Total Area Amount Nest Habitat Percent Nest Habitat Parkland Urban Byxbee Shoreline Sunnyvale Moffett Mission Tasman Agnews Detection Probability Fragmented Study Area From our detection probability assessment conducted in Tumbleweed Park during 1997, we estimated a detection probability of 1.0 all discreetly marked nests were relocated by the survey team. Agricultural Study Area-- Based on the number of new nests found in the three surveys (83, 11, 1; Table 6-4) from 18 blocks (see Chapter IV, Field Methods), we estimated a detection probability of 0.88 per survey (i.e., for each survey) under the Zippen model from the ISA study area in The Zippen model assumes that all survey events have equal detection probabilities as do individual nests within the sampled area. Given the very high detection probabilites (see below), we clearly meet these assumptions adequately such that violation of these assumptions would not appreciably affect our findings. Our results indicated that the 2 drive surveys were sufficient for detecting almost all of the nests at a given point in time. This very high detection rate results in counting most (98 %) of the Burrowing Owl nests within the study area from 2 surveys. Our survey method, however, does require additional effort to determine the status of each located potential nest. Our estimate of detection probability from an adjacent study area, using marked nests, also demonstrated a detection probability of near certainty, approximately 1.0. Thus, our estimates of density based on counts should have negligible bias (Rosenberg and Haley 2004). We assumed there were no annual differences in detection probability during the course of the study,
107 TABLE 6-4. Number of burrows located in the density survey blocks that were used for the estimation of detection rates. No new nests were located during the walk survey, which followed the drive surveys. Density Study Block Number On Drive 1 # New On Drive 2 Total Number O * Q W Y EE GG II F N P R V X 6 1 7* Z DD 6 0 7** FF HH 5 0 5* JJ * Includes potentially active burrows which could not be verified as active during time of density surveys. In block X we found two such burrows and in block O and HH we found one such burrow. ** One new burrow was found during the final (3 rd ) survey, conducted on foot. 107
108 Grassland Study Area Based on the method of call surveys from a limited network of roads over a very large extent of suitable Burrowing Owl habitat, we anticipated relatively low detection rates, and rates that diminished with distance from the road. Our results from 1997 confirmed this (Fig. 6-5), and demonstrate that most of the owls we detected through calls and later located via transect surveys were located within several hundred meters of the road network used in the call surveys. Indeed, few owls were located beyond 500 m (Fig. 6-5). We investigated several forms of the detection function and found the negative exponential with polynomial adjustment model provided the most reasonable model based on AIC values. From this model (Fig. 6-5), we estimated an average detection probability of 0.21, which declined rapidly with distance from the road from which surveys were conducted. FIGURE 6-5. Estimated detection function (red line) of locating Burrowing Owl nests from a combination of call surveys and transect surveys within the Grassland study site. Data are from The histogram show the relative number of owls detected at each distance interval. 108
109 Abundance and Density Number of Nests Urban Grassland Fragmented Agricultural Year FIGURE 6-6. Number of nests located within each study area during ). Urban-- We located 316 nests during within the 7 sub-study areas. In addition, there were three nests at which the female owl died and was replaced by another female. These data were used in the estimation of nest success (Chapter V) because those estimates were femalebased. For estimates of nest density, we counted these nests only once because at any one point in time, there was only a single nest at these particular locations. Hence, sample sizes differed slightly between those reported here for density and those reported earlier for nest success and productivity. We assumed that our estimated detection probability of 1.0 using transect counts at the Fragmented site would also apply to the Urban site. Therefore, the number of owl nests at the Urban site averaged 52.7 ± 3.4 during the 6 years of the study (Fig. 6-6), and varied by sub-study area (Fig. 6-7). Numbers per sub-study area varied widely with only 1 nest located in Agnews in 1 year of the study (none otherwise) and up to 30 nests in Moffett. Moffett consistently had the largest number of nests and on average contained over one-third of all nests located within the Urban study area. Across the entire study area, crude density averaged 1.8 ± 0.1 nests/km 2 (Fig. 6-8) and nest habitat density averaged 2.9 ± 0.2 nests/km 2 (Fig. 6-9) during Temporal patterns of number of nests, crude density, and nest habitat density were similar. There was a decline in density during the study period (Fig. 6-8 and 6-9), which was driven by the Mission and Moffett substudy areas (Fig. 6-10, 6-11). Densities varied most by substudy areas. On average, there was a higher density of nests in the Urban sub-study sites (5.3 ± 2.8) than the Parkland sites (2.7 ± 0.3), again, largely due to a few sub-study areas rather than a systematic difference across types, as the large standard error for Urban sites demonstrates. Mission had very high densities of Burrowing Owl nests, and this was most apparent when comparing nest habitat densities, due in part to the lower amounts of habitat classified as nest habitat (Table 6-3). 109
110 35 Agnews (Urban) Mission (Urban) Moffett (Urban) Tasman (Urban) Byxbee (Parkland) Shoreline (Parkland) Sunnyvale (Parkland) 30 Number of Nests Year FIGURE 6-7. Number of nests located within each sub-study area within the Urban site during Urban Grassland Fragmented Agriculture Crude Density (Nests/km 2 ) Year FIGURE 6-8. Crude density (number of nests/total area of study site) at each study area during
111 Fragmented-- We located 266 nests during Nests were located in grass patches associated with the runways and taxiways, small grass areas that were associated with structures such as communication towers, and a dedicated wildlife area (Fig. 1-6). Although there were no trends in abundance, the number of owls varied annually (Fig. 6-6), with a clear peak in On average, 66.5 ± 6.6 nests were located each year. Using the estimates for total area and area of nest habitat (Table 6-2), we estimated an average crude density of 0.9 nests/ km 2 (Fig. 6-8) and a nest density of 15.0 nests/ km 2 (Fig. 6-9). This large difference between crude and nest habitat density demonstrates the few nesting areas and clumped distribution of Burrowing Owls: suitable nesting areas had very high densities. Grassland-- We located a total of 154 nests during The number of nests located, which reflects both the number of nests within the study area and our ability to detect them (see above), varied among years, ranging from 31 to 45. On average, we located 38.5 ± 2.9 nests per year. The most reliable estimate of density is from 1997 when all nests were located via the call survey method. Almost all (35of 38 nests; 92 %) were located within 500 m of the call survey routes (Fig. 6-5). Based on the areas covered by our call surveys (Fig. 6-1), we estimated a crude density of 1.0 nests/ km 2 and a nest habitat density of 1.4 nests/km 2. Applying the same detection probability to all years, we estimated an average crude density of 1.0 ± 0.08 nests/ km 2 and a nest habitat density of 1.4 ± 0.1 nests/ km 2. The Grassland site had one of the lowest densities of all sites. Crude density was similar to the Fragmented site, but because of the much greater proportion of nest habitat, nest habitat density was the lowest among all sites, and substantially less than the Fragmented and Agricultural sites. Agriculture-- We located a total of 518 nests during In each year, we located an average of ± 5.3 nests (Fig. 6-6). From these counts and an estimated detection probability near 1.0, we estimated an average crude density of 6.5 ± 0.3 nests/km 2 (Fig. 6-8) and an average linear occurrence of 2.6 ± 0.1 nests/km along the 39.1 km of road that includes one or more irrigation structures including drains, canals, and/or delivery ditches. Based on our assumption of 1 m wide nesting habitat on either side of drains, canals, and delivery ditches, we estimated an average nest habitat density of ± 35.6 nests/km 2 during the study, approximately two orders of magnitude greater than the other study areas (Fig.6-9). Although crude density was very high, the difference between crude and nest habitat density demonstrates the exceptionally high densities of Burrowing Owl nests in areas outside the cropped fields. 111
112 Nest Habitat Density (Nests/km 2 ) Urban Grassland Fragmented Agriculture Year FIGURE 6-9. Nest habitat density (number of nests/area of nesting habitat) at each study area during See text for description of nest habitat for each study area. FIGURE Crude density (number of nests/total area of substudy site) at the Urban study area from
113 FIGURE Nest habitat density (number of nests/area of nesting habitat) at each sub-study site from See text for description of nest habitat. 113

. Although estimates at the Grassland site are biased high because we did not locate all nests (Fig.")

114 Nearest Neighbor Distances Our results support the general finding that Burrowing Owls often nest very close to one another, often in an arrangement that at least is consistent with the notion of a colonial nester. However, our results demonstrate that distances between nests vary considerably both within a site and among sites (Fig. 6-12), and are likely a response to availability of nest burrows and prey. We observed very high variation, particularly among sites. We found active nests as close together as 2.2 m in the Agricultural site and as far away as 9.2 km at the Grassland site (Fig. 6-12). Although estimates at the Grassland site are biased high because we did not locate all nests (Fig. 6-5), nests at the other sites ranged up to 3.0 km (Urban) and 3.6 km (Fragmented). Most of the variation was due to site and almost no variation among years. The ANOVA model of site and year as explanatory factors explained 26.9% of the variation, and of this explained variation 99% was attributed to site, and only 1% for yearly variation. However, it was clear that the Grassland site was the primary source of the variation, and this is inflated because only a proportion of all nests were located. With the Grassland site removed from the analysis, the model of site + year only explained 2.0% of the variation, and of this explained variation, 65.9% was due to site and 34.1% due to year. With the Grassland site removed from the model, the major source of variation was individual variation in distances among nests, with most nests within 200 m of their nearest neighbors, but some nests very far away (Fig. 6-12). 114
115 A. Urban B. Fragmented FIGURE Nearest neighbor distances from active nests for the (A) Urban and (B) Fragmented study sites. The median (solid line through the box), mean (dotted line through the box), 25 th 75 th percentile (shaded box) and the 10 th -90 th percentile (bars), and points beyond the 90% percentile are illustrated on each box. Not shown are several points that exceeded 2km (Urban: xxx; Fragmented: ) 115
116 C. Grassland D. Agricultural FIGURE 6-12 (continued ). Nearest neighbor distances from active nests at the (C) Grassland and (D) Agricultural study sites. The median (solid line through the box), mean (dotted line through the box), 25 th 75 th percentile (shaded box) and the 10 th -90 th percentile (bars), and points beyond the 90% percentile are illustrated on each box. 116


117 Summary VII. Estimation of Survival from Mark-Resight: Study Site, Gender, and Age Effects In this chapter we estimate and compare survival of juvenile and adult Burrowing Owls across the four demographic study areas in California. Here, we report apparent survival rates, which is the probability that a burrowing owl is alive and within the study area in a given year. Later, we estimate emigration rate, and incorporate emigration into apparent survival rates to estimate true survival, that is, the probability that a burrowing owl survives a given year. Estimates are for the interval between our surveys during the breeding season (April- July) in successive years. Of 1867 Burrowing Owls marked in this study and met the criteria for inclusion in the survival analysis, 1020 were banded as chicks and 847 as adults. Of the chicks, 19.2% were re-observed as adults. The Urban site had the highest recruitment of chicks (34.1%) among our four study areas. The number of young reobserved as adults in the Carrizo was only 3.0%, most likely due to longer movements and less access to detect owls that move from their natal nest. Despite relatively large sample sizes, precision of survival estimates was moderate, and allowed us to detect yearly differences only at the Fragmented site, where survival was highly variable due to one year where survival rates plummeted, apparently in response to a crash in vole numbers. Weighted estimates of survival from consideration of all the models we examined ranged from for first year survival (chicks to adult stage) and for adults. Burrowing Owls are relatively short-lived, with very few of our banded owls reobserved 3-5 years after we first banded them. Methods In this section, we estimate apparent annual survival of juvenile and adult Burrowing Owls using a mark-resight/recapture approach. In the Addendum to the Final Report, we will augment the survival estimates reported here through inclusion of radio-telemetry based estimates of emigration and survival. We provide sufficient details in this chapter for the reader to understand our approach and findings. Some of the methods described here were first described in Chapter IV, where more detailed descriptions are available. Capture, Mark, and Resight We used nest sites at the four study areas as the basis for capturing and re-sighting Burrowing Owl chicks and adults. As 117
118 described in Chapter VI, we found that the most efficient methods for locating Burrowing Owl nests, and thus capture and re-observation of banded owls, were site-specific. We used a combination of call-broadcast surveys, line-transect surveys that were conducted on foot, and surveys conducted from vehicles. We initiated surveys at each study site during late March or early April. During surveys, we attempted to determine if the resident owls occupying presumed nest burrows were banded or not. If this was not determined during the initial visit of the presumed nest, we returned to the nest location repeatedly. If adult owls were present but not banded, then we initiated trapping of owls (see Chapter IV for trapping methods), which was initiated in early April at each site. For owls that were previously banded, we determined identification through repeated visits to the nest site. Efforts to identify individuals continued throughout the field season. As described in detail in Chapter IV, we marked chicks and adult Burrowing Owls with a non-locking No. 4 U.S. Fish and Wildlife Service band and either a plastic color band (during ) or an aluminum alphanumeric color band (Acraft Sign and Nameplate Co., Ltd., Edmonton, Alberta, Canada, ). We measured mass to the nearest 0.1 g and tarsus and wing chord length to the nearest 0.1 mm. We assigned gender of adults based on presence of a brood patch, plumage coloration, and behavioral observations (Haug et al. 1993). The gender was unknown for chicks that were not recaptured as adults, except for owls captured in 2002 for which we determined gender of chicks through DNA analysis. Owls were captured and banded during different years depending on the site. Within the Urban site, we captured and banded owls from 1998 through 2003 and recaptured or re-sighted banded owls from We decreased the effort to band owls during 2002 and 2003; capture methods during these last two years were used primarily to identify owls that were difficult to re-sight. Re-sighting efforts during these last two years were similar to earlier years. At the Fragmented site, we banded a few young and adult owls in 1996 as part of a toxicological study (Gervais et al. 2000). From , we captured and banded a large proportion of the owls. In 2000, we conducted the re-sighting effort throughout the study area, and only captured owls for identification purposes not for further banding. On April , we conducted limited nest searches. These searches were limited to visiting accessible historic nests for an ongoing toxicology study (Gervais et al. 2000, Gervais and Anthony 2003, Gervais et al. 2006). Limited resighting and trapping was conducted to identify females associated with nests from which eggs had been collected. Because of the very limited effort in that year, we exclude 2001 data from the mark-recapture analysis. We do include these data, however, in our assessment of longevity. Within the Grassland site, we captured and banded owls using consistent methods from for estimation of survival and movement rates. In 2000, we conducted limited call surveys at the Grassland site; call surveys were focused on areas of approx. 1.6 km around historic nest sites that no longer demonstrated signs of occupancy. Owls were captured and banded in 2002 as part of a dispersal study (Catlin 2004); these data are not included within this chapter because there was no attempt to re-sight owls banded in 2002 at the Grassland site. At the Agricultural site, we captured and banded a few owls in 1997 as part of a pilot study and conducted the demographic study that included the surveys throughout the study area from Data from are included in the analyses of survival. Within the Intensive Study Area of the Agricultural study area (ISA, Fig. 4-10), we attempted to locate all nests with marked owls via road surveys from 1998 to Surveys were performed along all of the roadways and waterways within the ISA, Refuge, and area B, 0.8 km beyond the ISA. Owls 118
119 located during the single road survey 0.8 km (1999) and 1.6 km ( ) beyond area B during the breeding season were not included in the analyses of apparent survival rates presented here because of the lower probability of re-sighting owls during these more limited surveys. These owls will be included in the estimation of emigration, which will be used to adjust the apparent survival rates we estimate in this chapter to estimates of true survival. 119
120 Criteria for Inclusion in Analysis We included only owls that were banded and re-sighted within our study areas during our surveys conducted during March through July. Observations reported to us by other observers are not included in the mark-resight analysis because this would have complicated the estimation of recapture probabilities and in most cases not affected estimates because reports from others were infrequent and these owls were usually reported during our surveys. Only observations during the primary study period during the breeding season, March through July, are included in the analyses reported here. Owls that died from trapping (N=3, Agricultural site) are included in the analyses but the probability of recapture after their death was noted as equal to 0, following standard procedures in Program MARK. Owls that were located as carcasses during our survey activities were included in the analysis only if there was strong evidence the owls died during the field season; most carcasses were very dried and often were only leg bones with bands. We considered these owls to have died prior to our field season. In the Agricultural study area, owls were only banded within the core area (ISA, Fig. 2-8) and primary surveys were conducted within the ISA and Area B. The outer perimeter within the Agricultural study area (Area C, Fig. 2-8) was surveyed to locate owls that otherwise emigrated from the ISA; data from surveys in Area C were used to estimate movement patterns of banded owls (Chapter IX) and to estimate emigration that will facilitate untangling emigration from estimates of apparent survival rates. Because of the unequal survey effort, owls located within the outer area of the Agricultural site are not included in the analyses reported in this chapter. We also set an age criteria of approximately 14 days old as the minimum age for including banded chicks in the analysis of juvenile survival. This age was the approximate age, based on age-size relationships (Haley 2002) of chicks that we banded from natural nests but not nest boxes. We used a minimum mass of 60 g and a minimum tarsus of 30 mm. Thus, to keep survival estimates for juveniles restricted to a narrow age range, we omitted observations of banded chicks until they were 60 g and a tarsus length of 30 mm. This was the minimum size of owls banded at the Grassland site, all from natural nests. Other banded owls were omitted from the survival analyses because of unknown gender or because the owls were removed from the population. There was only 1 owl first captured as an adult for whom we were unable to determine gender; we omitted this owl from survival analyses. There were a total of 8 adult owls first captured as chicks and re-sighted as adults but whose gender remained unknown (4 at the Agricultural site, and 2 at each of Urban and Fragmented sites). We omitted these owls from survival analyses. We assumed that because of the very few adult owls for which gender was unknown, their omission would not bias the estimates in any appreciable manner. We retained chicks with unknown gender in the analysis (see Statistical Methods, below). Thus, all adults included in analyses have known gender. Three chicks at the Agricultural study area were noted with talon deformities. These owls were collected by U.S. FWS personnel and sent for tissue analyses. They were omitted from survival analyses. Two owls were brought to a rehabilitation center at year of first capture at the Agricultural study area and one owl was brought to the rehab center following removal of an entrapped owl from road grading (see below). Observations of these owls from the year they were brought to the rehab center onward were omitted and thus these owls were treated as if they were never seen again; they were treated as if they had died. 120
121 Owls equipped with radio transmitters were included in the survival analyses, but survival rates were separated through inclusion of a parameter for the radio attachment. Furthermore, relocations of radio-equipped owls made through aerial telemetry are not included here but will be included in the estimation of movement patterns and emigration rates (Chapter IX). Previously, we published estimates of survival of owls with radio transmitters (Gervais et al. 2006). Sample sizes here differ slightly from those published because we included all radiotagged owls regardless of gender, included each year for those owls carrying radio transmitters in 2 successive years (Fragmented study area), included the 3 adult owls buried in the Agricultural study area (Catlin and Rosenberg 2006), included the 1 owl that had its radio collar removed, and included the 1 chick with subcutaneous emphysema whereas we omitted these owls in the published account. One of the buried owls survived and was brought to a rehabilitation center. Records for this owl were omitted after day of burial as if it had died. Analytical Methods Distribution among Age Classes-- We were unable to determine age of Burrowing Owls other than young-of-the-year and those that were at least 1 year old and thus sexually mature. Here, we estimate the distribution of age classes by following a particular cohort of owls banded as chicks and those banded as adults. This provides an estimate of the proportion of owls in each age class and an estimate of life-span. Later, we use our estimate of survival rates to estimate model-based life-span. By using the number of owls observed in each year of the study from an initial banded cohort, we make the assumption that all owls were observed. We found that the probability of re-observation was very high (see Estimates of Apparent Survival, below) so this is not an unreasonable assumption, but it will bias estimates of life-span negatively (that is, our estimates will be low). At the Grassland site, very few owls (adults: 16 of 102 [15.7%]; chicks: 4 of 132 [3.0%]) were observed in two successive years, which was a result of low probability of re-observation at this site, higher mortality, and the high frequency of long-distance dispersal within the breeding-season (Rosier et al. 2006). We thus did not estimate distribution among age classes from the Grassland site. We report age distribution in 2 ways. First, we report on the cumulative distribution, showing the number and percent of owls that entered into each age class for owls first captured as chicks (and thus are of known age) and those first captured as adults, and are thus at least 1 year old. Second, we report the distribution of the oldest age class each owl entered, for those banded initially as chicks or adults. Apparent Survival-- In this chapter, we explore survival rates among age class (juvenile vs adult), gender, study areas, and years. We will explore factors associated with sub-study areas (Urban site), reproductive effort, distance to neighboring owls, condition (mass-size relationships), and variation among individuals, in the final chapter of the Results section. We used mark-recapture analysis to estimate apparent survival rates of Burrowing Owls. Apparent survival does not account for emigration so it is an underestimate if emigration actually does occur. We fitted modified Jolly-Seber-Cormack models to the mark-recapture data using 121
122 Program MARK (White and Burnham 1999). We developed 13 a priori models to estimate survival rates. Radio-transmitter effects were year-specific and were included in all the survival models from the Fragmented and Agricultural study areas; we did not attach radio transmitters to owls in the Urban study area. We did not include radio-transmitter parameters in the recapture probabilities because recapture rates should have been independent of whether or not radios were attached because of our survey methods. The most complex (global) model that we considered was a model with time effects for each gender and a parameter for each age class (chick or adult); we did this for both survival and recapture parameters. We then considered 3 models with simpler recapture parameters that we then associated with 4 survival models, each with a parameter for age as this was known a priori to have strong effects in bird species as well as with Burrowing Owls. The apparent first-year survival of chicks is low due to age-specific survival patterns and greater emigration rates, which are confounded with survival in mark-recapture analyses from a single site (Lebreton et al. 1992). We thus considered a total of 13 models (Table 7-1). We used Akaike s Information Criteria (AIC) selection methods, as described by Burnham and Anderson (2002). We used QAICc weights (w) to compare the relative likelihood of each model. We used these weights to estimate an average survival rate from all models considered. Model averaging allows inference to be based on all models considered, thus increasing the inferential validity over that of a single model approach (Burnham and Anderson 2002). We assessed goodness-of-fit (GOF) for the global model using 1000 bootstrap simulations to evaluate the likelihood of the observed deviance (White and Burnham 1999). Our estimates of goodness-of-fit, presented in this chapter, are preliminary and further work on assessing model GOF will be incorporated into the Addendum of this Final Report. Chicks with unknown gender were assigned a random gender to facilitate analyses. Thus, the gender effect for survival of chicks to 1 year adults was not included in models. We will revisit this approach in the Addendum to the Final Report. 122
123 TABLE 7-1. Description of models of apparent survival considered for the Urban, Fragmented, and Agricultural study areas. All survival models include parameters for the year-specific radio effects, if radios were deployed. Model Designation S(a),P(.) S(a),P(g) S(a),P(a+g) S(a+g),P(.) S(a+g),P(g) S(a+g),P(a+g) S(a+t),P(.) S(a+t),P(g) S(a+t),P(a+g) S(a+t*g),P(.) S(a+t*g),P(g) S(a+t*g),P(a+g) S(a+t*g),P(a+t*g) Model Description Survival varies only by age-class (chick, adult); re-observation probability is constant Survival varies only by age-class (chick, adult); re-observation probability varies by gender Survival varies only by age-class (chick, adult); re-observation probability varies by age-class and gender. Survival varies by age-class (chick, adult) and gender; reobservation probability is constant Survival varies by age-class (chick, adult) and gender; reobservation probability varies by gender Survival varies by age-class (chick, adult) and gender; reobservation probability varies by age and gender Survival varies by age-class (chick, adult) and time (year); reobservation probability is constant Survival varies by age-class (chick, adult) and time (year); reobservation probability varies by gender Survival varies by age-class (chick, adult) and time (year); reobservation probability varies by age-class and gender Survival varies by age-class (chick, adult) and gender effects that are time-specific (for adults only); re-observation probability is constant Survival varies by age-class (chick, adult) and gender effects that are time-specific (for adults only); re-observation probability varies by gender Survival varies by age-class (chick, adult) and gender effects that are time-specific (for adults only); re-observation probability varies by age and gender Global model. Survival and recapture probability varies by ageclass (chick, adult) and gender effects that are time-specific 123
124 Results Number of Owls Marked and Resighted We captured and banded a total of 1867 Burrowing Owls that met our criteria for inclusion in the analysis. Of these, 1020 were banded as chicks and 847 were banded as adults. There were 797 chicks (Urban: 127; Fragmented 308; Grassland 127; Agricultural 235) that were of unknown gender, largely because they were never captured as adults. Of the 1020 chicks, 1016 were captured prior to the last year of re-observation, and thus were available for reobservation as adults. Of these 1016, 195 (19.2%) were re-observed as adults, and represents our estimate of recruitment rate based on non-modeled estimates. There was considerable variation in recruitment rate among study areas. The highest rate was in the Urban (63 of 185 young; 34.1 %, followed by the Agricultural (65 of 329 young; 19.8%), Fragmented (63 of 370 young; 17.0%), and with exceptionally low rates at the Grassland site (4 of 132 young; 3.0 %). The number of owls captured and banded varied by study area and year. Almost 50% of the adults were captured at the Agricultural site (355; 42.0%), followed by the Urban (218, 25.7%), Fragmented (172, 20.3%), and the Grassland site (102, 12.0%). More chicks were captured at the Fragmented site (370, 36.3%), than the Agricultural (329, 32.3%), Urban (189, 18.5%), and the Grassland (132, 12.9%) sites. Note that these counts include those from the Fragmented study area during 2001, the year of only a partial re-sight effort, and that these records will not be included in the analyses of survival. Seven adult owls were either recaptured or resighted in that year, modifying the number of owls presented above only slightly. During the initial few years of the study, we emphasized capture and banding, which often diminished in subsequent years as the proportion of the banded population increased (Fig. 7-1). The number of chicks banded varied considerably by year, largely due to annual variation in reproductive rates, but also because of the number of observers in the field. Although the number of adult owls that we banded each year often declined after the first few years of the study (Fig. 7-1), the number of banded owls within each of the study areas was fairly constant during the study (Fig. 7-2), particularly for the years intended for estimation of survival (See Capture, Mark, and Resight [above]). We consistently had approximately banded adults in the Agricultural study area, which considerably exceeded the other study areas. The Urban and Fragmented study areas had similar numbers of banded adults in each year, typically around 80 marked adults from 1998 onward (Fig. 7-2). We radio-tagged a total of 217 owls in the Fragmented (111) and Agricultural (106) study areas. These owls were included in the estimation of survival rates but the effects of the radios are estimated as a radio-effects parameter for each year radios were deployed, and thus do not affect the survival rates of study area, gender, and year comparisons. Because we do not include analyses of survival for owls in the Grassland study area due to the low detection probabilities once the owls moved from their initial point of capture (see above), we ignore the effects of radios at the Grassland site in this chapter. 124
125 FIGURE 7-1. Number of Burrowing Owls banded as chicks and adults in the (A) Urban and (B) Grassland study areas and that met our criteria for inclusion in the analysis of apparent survival. 125
126 FIGURE 7-1 (continued.). Number of Burrowing Owls banded as chicks and adults in the (C) Fragmented and (D) Agricultural study areas and that met our criteria for inclusion in the analysis of apparent survival. 126
127 Distribution among Age Classes In general, recruitment of young owls into their natal population was low but adult retention was relatively high, resulting in a relatively bi-modal age-distribution. The percent of the chicks banded that were re-observed as breeding adults the following year was highest at the Urban site (34.1%) compared to the Fragmented (16.8%) and the Agricultural (19.6%) study areas (Fig. 7-3). Few chicks thus entered the adult age-class and remained on site (Fig. 7-3; 7-4). There was a steady decline in the proportion that made it to subsequent age-classes. From the limited years of our study, and using the first primary year of the study as the cohort from which to estimate life-span (Urban: 1998, Fragmented: 1997, Agricultural: 1998) we were limited to documenting a life-span of 5 (Fragmented) and 6 years (Urban and Agricultural). Few made it to this age (Fig. 7-4); the oldest known owl was 6 years old. We observed 1 (1.0 %) and 10 (6.0%) owls as 6 year olds at the Urban and Agricultural study areas, respectively. The lack of a precipitous drop from one age to the other (Fig. 7-3) suggests that there were no strong effects of age on survival rates. In other words, senescence did not seem to be apparent. Rather, the number of owls in each age class declined roughly as expected given a time specific, but not age specific, survival rate. FIGURE 7-2. Number of banded adult owls in the four study areas for each year. Owls first banded as chicks are included here when they were observed as adults. 127
128 128 FIGURE 7-3. Number and percent of Burrowing Owls that were observed at each age-class from the cohort of the first primary year of the demography study. Age class, chicks or adults, is the age class at first capture. Owls captured as adults were assumed to be 1 year old at time of captured. The (A) Urban site was based on the 1998 cohort, and the (B) Fragmented site was for the 1997 cohort. 128
129 129 FIGURE 7-3, continued Number and percent of Burrowing Owls that were observed at each age-class from the cohort of the first primary year of the demography study. Age class, chicks or adults, is the age class at first capture. Owls captured as adults were assumed to be 1 year old at time of captured. The (C) Agricultural site was based on the 1998 cohort. 129
130 130 FIGURE 7-4. Number and percent of Burrowing Owls that were last observed for a given age-class from the cohort of the first primary year of the demography study. Age class, chicks or adults, is the age class at first capture. Owls captured as adults were assumed to be 1 year old at time of captured. The (A) Urban site was based on the 1998 cohort, and the (B) Fragmented site was for the 1997 cohort. 130
131 131 FIGURE 7-4, continued. Number and percent of Burrowing Owls that were last observed for a given age-class from the cohort of the first primary year of the demography study. Age class, chicks or adults, is the age class at first capture. Owls captured as adults were assumed to be 1 year old at time of captured. The (C) Agricultural site was based on the 1998 cohort. 131
132 Estimates of Apparent Survival Rate 132 We explored 13 models of apparent survival rates at the Urban, Fragmented, and Agricultural study areas. The global model (Phi: g*t + a (and associated radio effects for each year radios were deployed; P: g*t + a) provided a reasonable fit to the data (P 0.05) at all study areas. The over-dispersion parameter (c^) for the global model was small to moderate at each study area (Urban: 1.04; Fragmented 1.78, Agricultural 1.95), based on a value of 1.0 representing data that was not over-dispersed. We included these estimates of c^ in our model selection process, using QAICc and model weight as our metric for comparison. The selected models, based on model weight, varied among study areas. Both the Urban and the Agricultural study area showed little evidence of time effects, whereas the Fragmented study area showed strong time effects, allowing the time model with a larger number of parameters to be the most likely model (Table 7-2). Indeed, at the Fragmented study area, all of the models with any reasonable weighting had time effects that is, survival varied among years. This is clearly shown from the estimates of survival under a model that allowed age and time effects in survival, and differences in recapture probability, Model (Phi A+T, P: G; Fig. 7-5). FIGURE 7-5. Estimated apparent survival among years and study areas. The year shown is the initial year of the annual interval estimated. 132
133 133 TABLE 7-2. Comparison of model selection results 1 for models of apparent survival for the Urban, Fragmented, and Agricultural study areas. Urban Study Area Fragmented Study Area Agricultural Study Area Model 2 K QAICc QAICc Weight K QAICc QAICc Weight K QAICc QAICc Weight S(a),P(.) S(a),P(g) S(a),P(a+g) S(a+g),P(.) S(a+g),P(g) S(a+g),P(a+g) S(a+t),P(.) S(a+t),P(g) S(a+t),P(a+g) S(a+t*g),P(.) S(a+t*g),P(g) S(a+t*g),P(a+g) S(a+t*g),P(a+t*g) Model comparison metrics include: K (number of estimable parameters), QAICc (difference in the small-sample adjusted AIC values for each model from the model with the lowest AICc), and QAICc Weight (a measure of the relative likelihood of a given model being the most appropriate). 2 We also included survival parameters for owls with radio-transmitters for each of the years that the transmitters were placed on the owls (Fragmented: 1998, 1999; Agricultural: 1998, 2002). 133
134 134 Gender and age effects varied among study areas as well. Gender effects on survival were strongest at the Agricultural study area (Table 7-2), where males had higher estimated survival rates than females (Fig. 7-6). Males and female survival rates were otherwise remarkably similar, and hence the low weighting on models with gender effects on survival. Age was included in all of the survival models because of the strong expectation of lower survival rates and greater dispersal distances (and hence, emigration) of chicks, and indeed, our results support much lower apparent survival for chicks than adults at each study area. Note that the differences of chick survival compared to adults and across study areas may be largely dependent on relative emigration from the study area; this is addressed in Chapter VIII, Estimation of Movements and Survival. FIGURE 7-6. Estimated apparent survival for each gender and age class under the model (Phi: a+g, P:g) among years and study areas. See Table 7-1 for model descriptions. 134
135 135 Survival rates varied among models, particularly for adults because of the inclusion of time and gender effects on adults, but not on chicks. When considering all models, estimates of survival ranged from for chicks, for adult males, and for adult females (Table 7-3). Only at the Fragmented site did the time models have important effects on the modeled-averaged estimates, and thus rates were very similar among years for adult owls at the other study areas. Survival rates were appreciably lower when radiotransmitters were deployed; the parameters for radios were added to remove bias associated with this effect for the other parameters. We have previously reported on the effects of radios (Gervais et al. 2006), and will not consider it further in estimation of survival. Recapture rates were generally very high. Recapture rates were highest at the Agricultural study area (0.90 (females) (males)) and lowest at the Fragmented study area (0.69 (females) 0.73 (males; Table 7-3). Recapture rates tended to be gender-specific, with strong support at the Urban and Agricultural study areas for males having higher recapture rates than females. This is not surprising given that surveys were conducted during the nesting season, when males are most detectable above ground. Recapture rates at the Fragmented site were more similar between males and females, but males tended to have higher rates (Table 7-3). The models explored here represent the basic models that we included in this preliminary analysis. Further exploration will be considered in the Addendum to the Final Report where we consider other factors affecting survival, and incorporate factors that have appeared in other chapters, such as reproduction and density. 135
136 TABLE 7-3. Estimated apparent survival and re-observation probabilities of Burrowing Owls from the modeled average estimates of all 13 models considered. Year is the initial year of the annual interval. 136 Effect Urban Fragmented Agricultural Estimate SE Estimate SE Estimate SE Chick Male Female Male Female Male Female Male Female Male Female Male Female Male Female Radio Radio Radio Male Reobs. Prob Female Reobs. Prob
137 VIII. Estimation of Movements and Survival from Radio Telemetry Monitoring 137 Summary We used radio telemetry to estimate movement patterns and survival rates of Burrowing Owls within the Fragmented, Grassland, and Agricultural study areas. Initially, during , our efforts were focused on estimating space use patterns, including home range and habitat use. During 2000, and we examined dispersal patterns at the Grassland and Agricultural study areas and specifically tested hypotheses on differential movement patterns at these two sites. In this chapter, we summarize and synthesize our research on movement patterns and survival using radio telemetry methods. Our primary results demonstrate that Burrowing Owls have a broad range of dispersal patterns, with very strong site fidelity in areas with few vacant burrow opportunities but that harbor nearby owl neighbors, to low fidelity rates and reasonably long-distance movements (over 50 km) in areas with numerous burrows but low owl densities. Our results extend the dispersal range typically considered likely for Burrowing Owls and demonstrate the site-specific nature of dispersal distributions. To estimate patterns of space use and dispersal, we equipped Burrowing Owls with radio transmitters at three study sites: Fragmented, Grassland, and Agricultural. Through this effort, our secondary objective was to estimate survival rates, particularly for the Grassland site where mark-reobservation with color-banded owls was difficult. As discussed earlier (Chapter VII), estimation of movement rates will also allow us to correct apparent survival rates, estimated through mark-reobservation We have previously reported patterns of space-use in relation to habitat selection based on this radio telemetry research (Gervais et al. 2003, Rosenberg and Haley 2004). In this chapter, we report on movement rates (within- and between-season dispersal) and survival. We have previously reported on within-year movement patterns for a subset of the data at the Grassland site using radio telemetry methods (Rosier et al. 2006) and investigated between year movements with band data at the Agricultural site (Catlin et al. 2005). Catlin (2004) summarized movement of adults during at both the Agricultural and Grassland study sites. Here we expand on this earlier work, including the entire dataset. We installed a total of 301 radios on a total of 187 adult and 114 juvenile owls. At the Fragmented site we equipped juvenile and adult owls with radios during 1998 and 1999, and followed their fates regularly during the breeding season. At the Grassland site, we equipped adult male owls with radios during 1998, on adults of both genders in 2000, and on adults and juveniles during At the Agricultural site, we equipped adult male owls with radios in 1998 and juvenile and adults with radios in
138 General Field Methods 138 We report here on the general field methods for our work using radio telemetry. Chapter IV includes a more complete description of the methods we employed. We used 2 different transmitter-mounting systems of varying mass. The first type was specifically designed for Burrowing Owls (Model PD-2C, Holohil Systems Ltd., Ontario, Canada), and consisted of a necklace-like collar with a 20 cm antenna (photo, right). Battery life varied from weeks, with a corresponding range in mass from 3.6 to 4.5 g. This represented % of adult body mass. We used these necklace collars at the Fragmented (1998 and 1999), Grassland (1998 and 2000), and Agricultural (1998) sites. The second type of transmitter mounting system was used at the Grassland and Agricultural sites in This study required much greater battery life and range due to the study s duration and need to locate dispersing individuals. These larger radios (American Wildlife Enterprises, Monticello, FL, USA) were mounted as backpacks with loops of tubular Teflon ribbon (3/16 th inch; Bally Ribbon Mills, Bally, PA) encircling the wings and fastened together at the breast (photo, above left). The ribbon was fixed in place by a half-cut brass connecter sleeve that was crimped down on the ribbon using linesman pliers. The total package weighed an average of 5.1 g (SE = 0.02 g, n = 36, range = g), and had an approximately 400-day battery life (Catlin 2004). At the time of capture, we recorded the mass and wing-chord length of each owl to the nearest gram and millimeter, respectively. Only owls with a mass 120 g received radiotransmitters; owls generally have a mass of g (King and Belthoff 2001) and wing lengths that range from mm (Landry 1979) at the time of fledging. We attempted to capture owls that were approx days old. This ensured that owlets were strong enough and coordinated enough to avoid entanglement in the radio collar. Therefore, the number of weeks since tagging represents the number of weeks since fledging (hereafter weeks since fledging ). In 2002, we collected feather samples from chicks that were radio-tagged to determine gender through genetic analysis (tests conducted by Avian Biotech International, Tallahassee, Florida, USA). Sample Periods We conducted radio-telemetry at the Fragmented, Grassland, and Agricultural sites during one or more years in and at the Grassland and Agricultural sites in (Table 8-1). Selection of owls to be radio tagged varied by site and year. At the Fragmented site, all adult male owls that had initiated nesting were targeted for radio collars, with particular effort made to trap and mark owls from nests that had been sampled for toxicological work (Gervais and Anthony 2003, Gervais et al. 2003). A single juvenile owl was randomly chosen from among all those caught at a nest which were >120 g or whose wing chords were >120 cm and were > 3 weeks of age; the 2 exceptions were young owls that weighed <120 g, before this threshold was chosen to ensure that the owlets would avoid entanglement in the collar. At the Grassland site we sampled adults and juveniles throughout the study area. At the Agricultural site in 1998, we selected adult males based on the central location of their nest within the study area (Rosenberg and Haley 2004). In 2002, we selected owls from nest boxes within an
139 km 2 central area of the study area (Catlin 2004). More than one chick per nest was included in this sample. 139 Tracking Our general approach was to establish stations in a grid along farm field roads (Fragmented and Agricultural site) or along other roads (Grassland site), with stations approximately m apart. Distances between stations represented the best compromise between radio signal range and the time needed to drive to another station for biangulation readings. This grid-based method allowed a formal search method to negate the potential bias of observers returning to known sites of occurrence, such as nests (Rosenberg and McKelvey 1999). However, difficulty in obtaining locations often resulted in our departing from a strictly grid-based approach in some sites. We attempted to locate an individual, often at its nest, and follow it for the remainder of the night at the Grassland and Agricultural sites. Once the signal was lost, we searched for the owl using the grid system and knowledge of the individual s previous locations. The Fragmented site had so many radios deployed in close proximity to each other that observers worked down the list of radio frequencies while moving along the station grid, obtained a location for any owls detected, then moved to the next radio frequency on the list once a biangulation on the detected owl had been achieved. If no owls were detected, the observer continued searching along the grid. We searched for owls that could not be located using ground searches with aerial surveys from a fixed wing aircraft. We did this at the Fragmented site opportunistically twice during 1999, but regularly in 2000 at the Grassland site and at the Grassland and Agricultural sites. Methods for locating owls varied depending on the nature of the study and the study site. The vehicle-based method consisted of a receiving antenna that was constructed with two H-configured antennae (Telonics, Mesa, AZ) during the 1998 studies or two 4-element Yagi antennae during the later studies (Cushcraft Corp., Manchester, New Hampshire), separated by a cross boom and connected to a null combiner and mounted to a 2-m rotating tower with a fixed compass. The tower was secured in the bed of a truck, making the antennae height approximately 3 m above ground (Gervais et al. 2003). H-configured antennae were also used during all years of the studies when searching for owls by foot travel. Frequent owl movements while foraging made obtaining more than 2 sequential bearings on a single owl location difficult, so we recorded signal quality as well as bearing angle and station. Signals of quality 1 were strong, steady signals with a an obvious null, quality 2 signals were strong and steady but lacked the null, presumably because the radio was moving as the owl foraged, and signal quality 3 referred to signals that were broken. Transmission was often compromised because the owls were underground, in ditches, or even on the ground, where micro-topography could interfere with signal transmission. Efforts were made to search areas > 1 km from the nest site to avoid biasing observations near the nest. Location attempts on the same owl were made $15 min apart. We attempted to obtain locations of a given owl every 15 minutes if only one owl was being tracked. Only locations computed from estimates of the angle of the owl from 2 stations within 5 min were included in analyses that included specific location data. We omitted all observations that led to locations greater than 1 km from the telemetry stations because of their greater expected error (Gervais et al. 2003). 139
140 We quantified radio telemetry error by placing radios in known locations and estimated those locations using observers who were unaware of the true locations. Radios were placed to mimic actual owl positions while perching or foraging, although the test radios remained in fixed positions. These data were then used to estimate the severity of possible bias in estimated locations and its influence on apparent habitat selection patterns in the Fragmented site (Gervais et al. 2003); we assumed similar error rates at the other sites. Fragmented Site-- We collected location data from 14 May to 11 September 1998 and 2 May to 26 August Each owl was tracked at least 2 nights per week, and several locations were obtained during each night of tracking. We tracked owls from dusk to Observers worked independently in separate vehicles to obtain sequential bearings at predetermined stations along a grid work of farm roads that covered the study area. All owls potentially present (those nesting within 2 km) were scanned for at each telemetry station. As fledgling owls were radio-tagged, their radio frequencies were added to the nightly tracking sessions. Radio-tagged juvenile owls in 1998 were also located during daytime surveys around their natal burrows to verify that the owls were alive. We attempted searching the entire study area during daylight hours for missing juveniles in 1998, but failed to locate a single missing owl using this method. This is likely due to the fact that radio signal transmission from underground is poor, and the truck-based receiving system could not detect the signals when using the lesspowerful H antenna array. In 1999, we did not attempt to perform regular searches during daylight hours for missing owls, but continued to scan for those frequencies during nightly tracking sessions. Owlets detected well away from their natal nests were then searched for during the day in the vicinity of the nocturnal detection to locate the roost burrow. In this way, we located several young owls that had begun moving away from their natal burrows but that had not yet left the study area. We attempted to detect longer-distance movements of chicks and adults that emigrated from the study area by using aerial telemetry in collaboration with California Department of Fish and Game in Two tracking flights in small planes were coordinated with California Department of Fish and Game in August and September, each for a duration of approximately 2 hours and conducted between 1030 and 1220 hours. The pilot flew approximately 1.5 km wide transects and covered the area within the Naval Air Station and approximately km beyond the study area. Observers scanned the frequencies of radio-tagged owls that had not been detected on station for several days. Data were also examined for evidence of within-season movements of both adults and juveniles. Records of sightings of radio tagged owls at their nest burrows allow some inference regarding movements during the breeding season. The record is not complete, because of the substantial failure rate of the radios, but anecdotal information does provide some information on within-season dispersal movements at this site
141 Grassland Site Study Period Observers followed a single owl all night due to logistical constraints imposed by this study area. Owls were tracked between the hours of 2030 and 0330 from June 10 to July 6. Once the owl was detected, estimated locations were obtained approximately every 15 minutes. Data taken for each observation included station number, date, time, angle of compass bearing to the radio signal, and signal quality. If the owl began moving, the observer would proceed to the appropriate telemetry stations in an effort to remain in contact as much as possible. Stations were set up 500 m apart on vehicle-accessible roads within a 4 km radio circle centered on the nest Study Period In response to the difficulty we encountered with ground searches and the low recapture probabilities from band data, we attempted to locate tagged owls via both ground and aerial searches in We conducted ground searches every 7-9 days from May through July 2000 using a hand held H antenna and a truck-mounted Yagi antenna system. We searched for owls not detected from ground searches with biweekly flights of fixed-wing aircraft using a broad transect pattern (approximately 1.0 km apart) at an elevation of m above ground to cover large areas of suitable habitat. Additionally, we searched areas of suitable habitat adjacent to the Carrizo. We conducted flight surveys with California Department of Fish and Game in May 4, 19, and 30, June 14 and 30, and July 18 and 26. The search area, which was covered at least once during the season, included all of the grasslands and foothills of the Carrizo and the surrounding area, with a total search area of approximately 3500 km 2. When an owl was relocated during a flight, we initiated a ground search following the flight to confirm the location and status of the owl Study Period We coordinated this study with a similar effort at the Agricultural site to investigate dispersal patterns, and in particular to evaluate hypotheses on causes of the longer-distance movements at the Grassland than the Agricultural study site. Five breast feathers were collected from every chick to be sent to a lab for determination of gender using DNA. We also placed a backpack-style radio transmitter on every adult owl captured, and on all chicks weighing 119 g or more. Starting April 30, we attempted to relocate all radio tagged owls every 6-8 days using hand-held H-antennas. We returned to the owls nest site, and searched a 100 m radius surrounding the nest. If the owl was not located in this initial search, we returned within the next two days to check again for the owl. If still no signal was found, then we performed a search of an area of one kilometer radius surrounding the nest. If the nest was located near roads, we searched for the owl along 4 transects radiating out from the nest. We searched for the owl with a Yagi antenna system in the back of a pick-up truck every 250 m for up to 1 kilometer. If the nest was not located near roads, the 4 transects were surveyed on foot using the H-antennas. Because of time constraints, walking transects were only approximately 600 m in length. The detection distance of the H-antennas used should have made the effective area covered approximately one square kilometer. 141
142 142 Once a signal was found for an owl, we determined its location. If the owl was within 100 meters of its nest, we recorded its location as its nest. If the owl was greater than 100 m from its nest, the UTM coordinates for its location (within 20 m) were recorded. Once the owl was found, it was noted if the owl was alive, dead or in a burrow. In some cases, the owl may not have been seen, but its signal moved, and its location was approximated. If the owl was in a burrow, we returned to the burrow at a later date to determine if the owl had moved. If the owl had not moved, the burrow was peeped to determine the owl s status. If the burrow could not be peeped, the burrow was checked again on the regular schedule. If the owl moved, it was alive. If the owl continued to be found in the same burrow with no evidence of movement either during or between visits, and if other evidence such as spider webs blocking the burrow were found, we classified the owl as dead. For owls that could not be located during ground checks, plane surveys were scheduled approximately every 2 weeks beginning in the first week of May. Once an owl was missing for 2 weeks or more, we no longer searched for it on the ground. It remained on the flight list until we could relocate it. Aerial surveys took place on May 16, June 5, June 20, July 18, August 1, August 15, and August 29. To find multiple owls during the aerial surveys, a core area covering approximately 20 km from every nest was surveyed using transects set 5 km apart. The aircraft was flown at approximately feet, depending on weather conditions. Flights lasted from 2 to 3 hours, and if additional time was available, areas outside the core area were surveyed. If an owl s signal was found during an aerial survey, ground verification was conducted as soon as possible to determine owl s exact location and status. We attempted to relocate the remaining missing (n = 19) and known living owls (n = 21) 8 times following the breeding season: ca. 13 September, 27 September, 14 October, 21 October, 8 November, 7 December 2002, 20 January, and 11 April 2003 (Table 1). During 2 of these periods, 5 flights were performed (2 in December/January of and 3 in April of 2003). In two cases, the last location of the owl was via aerial telemetry but the individual was located on private lands that we were unable to access. In these cases, we used the last location where the owl was confirmed via ground checks. Agricultural Site 1998 Study Period We radio-tracked male owls to gain quantitative insight into the owls space-use patterns (Rosenberg and Haley 2004). We captured owls that nested within a 0.4 by 0.8 km area along the edge of the road and fields within the Refuge of the ISA (Fig. 2-8). We attempted to track owls each night from 2000 to 0400 hrs from 5 June-13 July. We established a grid system of stations at approximately 400 m intervals to obtain biangulation data Study Period We radio tracked owls as part of a dispersal study that was conducted from April May 2003 (Catlin 2004). Ground telemetry searches, conducted weekly, from vehicles started at the last known location of each owl, but if we were unable to find a radio-tagged owl at this location, we covered a 1 km diameter circle, checking at 500-m increments in each of the four cardinal directions around the last known location. If we did not find owls via the ground 142
143 143 survey, we searched from a fixed wing aircraft, which we used to search for missing owls approximately every 2 weeks. We used H antennae and flew at m altitude. We consistently searched an area of roughly 2250 km 2, providing a maximum area of detection of km from the central study area. The locations of all owls were known by the end of the breeding season and only 3 owls were missing by the end of the study in We used ground and aerial surveys to locate radio-tagged owls from June 2002 to April Ground surveys were performed weekly (June-August, 2002) or biweekly (September 2002 to April 2003). There were no radio searches performed between 29 August and 21 September We consistently searched an area of approximately 2250 km 2, providing a maximum area of detection of km from the central study-area. The same north-south aerial transects with 5 km spacing were performed 16 times in search of missing juvenile owls during the study period. In addition to the weekly checks, ground and aerial follow-up searches, we searched the core study area for the remaining missing owls in the last week of the study. Searches were performed during daylight hours with 2 passes of each of the north-south roads with the Yagi antennas held in a fixed position on the back of the truck. The same procedure was performed at night but we extended our search 1.6 km beyond the study area. Juvenile Movements We defined juveniles as independent once they were located >100 m away from the natal nest regardless of the potential association with the parents. We classified an owl s location as at the natal nest ( 100 m) or away from the natal nest (> 100 m). Owls that were not located on any visit were considered > 100 m from their natal nest because it was rare to find an owl 100 m from its natal nest after failing to locate the owl initially. One hundred meters was approximately the median nearest neighbor distance for active Burrowing Owl nest sites at our study area (Rosenberg and Haley 2004) and contains the area around a nest that includes satellite burrows for juveniles and the breeding pair (Desmond and Savidge 1999, Ronan 2002) as well as a critical distance for competition between neighboring breeding pairs (Green and Anthony 1989). We calculated the proportion of owls that were away from the nest at weekly (1 10 weeks post-fledging), and biweekly intervals (11 34 weeks post-fledging), as well as a final single period (35 44 weeks post-fledging) period. All analyses and figures use these periodic breakdowns. The increasing duration of the periods reflects the reduced search effort and a reduced number of owls due to mortality. The final period encompasses approximately the final 2 months of the study (March and April 2003) and coincides with the initiation of the breeding season (Rosenberg and Haley 2004). We considered an owl independent if it was located away from the natal burrow (> 100 m) at any point during a given period. The proportion of individuals that were away from their natal burrow was calculated separately for male and female owls, as well as for owls that fledged early and late in the season. The a priori models that we used to represent our hypotheses examined the relationship between the proportion of owls located away from their natal burrow during each time period and the number of weeks since fledging, gender, early or late fledge period, and the interaction between weeks since fledging and gender or fledging period. We used an arcsine square root transformation on the response variable, proportion of owls located away from their nests. Weeks since fledging was log transformed, and the gender and fledgling period were treated as indicator variables. 143
144 144 We used weighted multiple regression (PROC REG, SAS 2001) to evaluate each of the hypotheses associated with this model. The number of owls used to calculate the proportion was included as the weight for the regression. Because we used the proportion at each interval, we were not concerned with non-independence associated with siblings. To evaluate how gender and the timing of fledging affected distance of post-fledging dispersal, we examined the maximum distance a juvenile owl was known to have been away from its natal nest during our weekly intervals. Given that an owl was located during a specific interval and was > 100 m from the natal nest, the owl was assigned the maximum distance it had been seen from the natal burrow. We calculated the average of the maximum distances for each owl. We used the same explanatory variables as were used when modeling independence, but the response variable was the log-transformed average maximum distance for a given weekly period. We made an a priori assumption that sibling behavior was somewhat related, given that siblings share genetic, environmental, and geographic circumstances. Our goal, therefore, was to quantify the association in terms of weeks since fledging and the type of sibling relationship (i.e. male-male, female-female, or mixed gender). Instead of independence and distance from the natal burrow, we investigated independence and distance from siblings. We calculated the proportion of siblings that were 100 m from one another during each time interval and the average distance between siblings at each interval given that they were > 100m from one another. We used a model that related the arcsine square-root transformation of the proportion (response variable) to these explanatory variables: the number of weeks since fledging (log transformed), an indicator variable for the type of sibling relationship (such sister-sister, etc.), and an interaction between log weeks since fledging and the sibling relationship indicator. The model for distance between siblings related the same explanatory variables to the natural log transformation of the distance (response variable). We used visual methods similar to Todd (2001) to examine the pattern of post-fledging dispersal. We graphed the maximum distance achieved for each of the owls for comparison to three modes of dispersal: nest-centered, single roost, and multiple roost (Todd 2001). For nestcentered dispersal, an owl remained at or very near to its natal burrow until dispersal or migration. For single roost dispersal, an owl dispersed to a distinct roost other than the natal burrow and remained there until dispersal or migration. Multiple roost dispersal was defined as dispersal to several roosts that were increasingly distant from the natal burrow prior to dispersal or migration (Todd 2001). We examined the pattern at 2 time scales. The first covered time from first fledging to roughly 2.5 months post-fledging, a time scale similar to that reported for migratory populations before migration (King and Belthoff 2001, Todd 2001). The second time scale covered an entire year. The two time scales were examined to see what, if any, differences there might be between the scales and between our resident population of owls and migratory populations reported in the literature. 144
145 Adult Movements Within the Breeding Season 145 For this analysis, we used radio-tagged owls that were in the process of or had finished laying clutches of eggs, and used tracking data from April to August The material in this section is taken or modified from Catlin (2004). The experimental results of nest depredation are reported in Catlin and Rosenberg (unpubl. ms) and are not analyzed as such here. Rather, we include nests that we experimentally depredated and those that were naturally depredated, as well as the nests that were not depredated, in the analyses reported here. Details of the experimental protocol for nest depredation are reported in Catlin and Rosenberg (unpubl. ms) and Catlin (2004). Each of the potential nests was checked weekly using an infrared probe (Sandpiper Technologies, Manteca, California); the final designation as a nest was based on observing eggs. Because of the potential for subjective determination of what constitutes dispersal during the breeding season, we defined dispersal using Catlin s (2004) criteria. An owl dispersed if it was found > 100 m from its nest for 3 weeks and observed <100 m from its new nest during the next 3 weekly checks. If an owl was > 100 m from its nest for 3 weeks and did not settle at a new nest within the breeding season (prior to the last week in August) or prior to death, the owl was classified as a wanderer. If the location of an owl was unknown and the owl had not settled at a new nest prior to the end of the breeding season, we classified the owl as missing. We excluded owls from the analyses that we classified as missing, wanderers, or those that did not survive or retain a working transmitter for 28 days. We used a minimum of 3 weeks as a criterion for dispersal because the mean number of days between clutch collection and clutch completion for experimental renesting attempts was ca. 21 days (Catlin 2004) We divided dispersal into dispersal probability and distance. These events are likely separate decisions by the owls and could be related to different factors (Forero et al. 1999). For the observational data, dispersal probability was examined using logistic regression, and we used multiple linear regression to examine the relationship between log dispersal distance and the explanatory variables (PROC GENMOD, SAS 2001). Maximum rescaled r-squared (Nagelkerke 1991, Allison 1999) and r-squared values are presented for each of the analyses best models for dispersal probability and dispersal distance, respectively. We used an information theoretic approach rather than null-hypothesis testing for analyses of observational data. We calculated model averaged parameter estimates using the model weights from the AICc values and unconditional standard errors (Burnham and Anderson 2002). Factors included in models of dispersal probability included owl gender, nesting success, whether or not the nest was depredated (natural or experimental), loss of a current mate to death or dispersal, a previous year s experience with a mate, a previous year s experience at a nest site (< 100 m away), and days with transmitter. We separated nest depredation into three categories: successful ( 1 chick survived to days), depredated (where eggs or chicks were depredated), and other failures (mostly abandonment). Nesting success referred to the first nesting attempt for a given owl. The parameter days with transmitter was added to the analysis to estimate and control for the potential effect of mortality associated with radio-tagging (Gervais et al. 2006) on dispersal probability and controlled for mortality decreasing dispersal probability. The variables used for dispersal distance were the same as those for probability to disperse except that the analysis that included the loss of a current mate included owls from the grassland area. We did not perform separate analyses for each gender because 23 % of the 145
146 146 total sample for the analyses came from owls whose mates were also in the set, and we were particularly interested in the biological question of differences in dispersal behavior between the genders. Consequently, the standard errors we report are approximate standard errors. For the analyses of dispersal distance, 1 pair were included in the analyses where both the male and female owl were used in the analysis, thus we expect little effect on our estimates of standard error. The suites of models containing nest depredation, the loss of a current mate, same mate as previous year, and same nest as previous year each had to be analyzed separately because of sample size limitations for these variables; this amounted to 5 separate analyses for dispersal probability and 5 separate analyses for dispersal distance. The results for these variables are presented separately to emphasize the different analyses. We did not include interaction terms in our models because of small sample sizes. Summary statistics for dispersal probability, dispersal distance, and timing of dispersal are presented. The timing of dispersal represented the number of days following experimental depredation before an owl dispersed. The date of dispersal was calculated as the midpoint between the last date an owl was located at its initial nest and the date of the subsequent search when the owl was not found, found between nesting sites, or found at its new nesting site. Comparison of Movements Within the Breeding Season: Grassland vs Agricultural Sites One of the primary reasons for conducting the movement studies at the Grassland and Agricultural study areas using almost identical methods was to compare movements at these 2 very different systems. We previously noted much greater movements at the Grassland site (Rosenberg and Haley 2004, Rosier et al. 2006) but we lacked similar methods for a rigorous comparison. The comparison reported here was largely taken or modified from Catlin (2004). We used the same modeling approach as described above for the Agricultural study site for the analyses of movements within the breeding season. Because we did not have detailed data on nest predation from the Grassland site, we only included study area, gender, and whether or not the nest was successful, using the same definitions for success as described for similar analyses at the Agricultural study area. We used a geometric model to explain the pattern of dispersal distances as a simple alternative to highly parameterized linear regression models and to determine if a geometric model was an adequate fit for dispersal distributions (Waser 1985, Buechner 1987, Porter and Dooley 1993). These models express the distribution of dispersal distances in terms of a single parameter and are appropriate when an animal disperses no farther than is necessary to avoid competition (Waser 1985). We fitted the observed distances dispersed, separated by study area and by gender, to a geometric distribution, calculating the probability parameter (g) upon which the distribution is based (PROC NLIN, SAS 2001). The geometric distribution that the data were fitted to was g(y) = g(1-g) (y-1), where each y integer, y = 1, 2,, n, represents a multiple of 400 m, and the data consisted of the number of birds that dispersed a distance within the 400 m interval. The mean (µ) and variance (σ 2 ) of the geometric distribution are given by, µ = 1/g, and σ 2 = (1-g)/g 2. Lower values for g are associated with larger estimated mean values for dispersal. 146
147 147 Survival Analyses In this section, we only include owls that were radio-collared and not radio-harnessed because of the strong and clear association of mortality with the harness method (Gervais et al. 2006). Because the radio collars had a battery life of approximately 3-6 months, we were limited to estimation of within-breeding season survival rates, and at only those sites and years where we had at least a minimally sufficient sample size (>10). We thus include here only the studies conducted at the Grassland (2000) and Fragmented sites (1998 and 1999). Fragmented We created a data base consisting of weekly time intervals throughout the tracking season, and each juvenile owl s records were examined to determine whether it had been detected during each time interval. Only juveniles were used for this analysis, because issues such as radio failure and emigration following nest failure rendered the data unreliable for adults. Due to heterogeneity in the initiation of successful nests, however, emigration could not be separated from mortality in most cases. Data were summarized in terms of number of owlets known to be alive and present on site per week, and cumulative number known to be dead per week. Grassland-- We estimated survival using modified Cormack-Jolly-Seber mark-recapture models (program MARK; White and Burnham 1999). We used these models rather than known-fate models because the probability of relocation was <1.0. The approximately 3 month study was divided into 11 7-day intervals for which each owl was indicated as observed or not observed. Because of the small sample size of radio-collared owls (n = 18), we limited the complexity of our model set and did not evaluate differences in survival rates between males and females. Survival was similar for male and female Burrowing Owls in other regions (Lutz and Plumpton 1997, Millsap and Bear 1997, Rosenberg and Haley 2004) so bias associated with pooling data across sexes should be negligible. We developed 5 a priori survivorship models which allowed survival (φ) and probability of relocation (ρ) to vary among time periods and nesting stages (Table 1). Model [φ(stage) ρ(.)] allowed survival to vary between two nesting stages (pre-hatching and post-hatching) while probability of relocation remained constant. We used the date that 90% of the observed nests had chicks as the criteria to differentiate between the 2 nesting stages. We estimated hatch dates from observations of the developmental stage of chicks from (1) nest contents with the infrared probe, and (2) chick emergence, following the aging criteria in Priest (1997). We used an information-theoretic approach to rank models and provide a means of assessing the strength of evidence for one model over another (Burnham and Anderson 2002). We used Akaike s Information Criterion, with a correction factor for small sample size (AICc), to select the most parsimonious model (the model with the lowest AICc value; Burnham and Anderson 2002). Models were ranked and compared using AICc differences ( AICc). To account for competing models, we used model averaging whereby the average of a parameter is computed and inference 147
148 is based on all models (Burnham and Anderson 2002). We report survival estimates as φ ± 1 SE and the 95% confidence interval. Estimation of Emigration Emigration from the study area is important to estimate in order to correct estimates of apparent survival rates (Chapter VII). Thus, estimates of movement patterns, ideally from each study area, allow for assessing the likelihood that an individual left the study area. Although emigration rates for each year and study site are required to properly correct apparent annual survival estimates, in practice this is difficult due to the difficulty in conducting telemetry studies (see Burnham et al. 1996). Here, we provide results of the number of individuals that emigrated from the Fragmented, Grassland, and Agricultural study areas based on movement of owls to outside of the study area. These results combined with movement patterns from those within the study area observed through telemetry and mark-resight observations, provides the foundation for correcting survival estimates, which we will report in the Addendum. All estimates of emigration reported in this chapter are based on aerial telemetry searches of owls missing during ground searches (see General Field Methods, this chapter)
149 Results 149 From 1998 through 2002 we deployed a total of 301 radio transmitters at the Fragmented, Grassland, and Agricultural study sites, using a combination of collars and harnesses. We considered some years and sites as a pilot study with only small numbers of transmitters deployed (Table 8-1). During , efforts were concentrated to allow estimation of home range and habitat use (Gervais et al. 2003, Rosenberg and Haley 2004); we do not report those results here. During this period and in our later efforts in 2000 and 2002 (dispersal only), we were able to estimate within breeding-season dispersal and/or survival rates, and we estimated natal and breeding dispersal (between-year) from spring 2002 to spring TABLE 8-1. Number of radio transmitters deployed (Total) and used in the analysis for movements (M) and survival (S) analyses in this chapter. Numbers used for analysis of home range in previous analyses (footnote indicating source) are indicated parenthetically. Site Total M S Total M S Total M S Total M Frag 26 A 28 C (11 1 ) A 32 C (22 1 ) 2 0 Grass 7 A A A 15 C Ag 8 A (6 2 ) 0 64 A 36 C 35A 34 C 1 Gervais et al Rosenberg and Haley 2004 Fragmented Site We tagged 54 and 58 burrowing owls during 1998 and 1999, respectively, with slightly more chicks tagged than adults (Table 8-1). A total of 11 and 22 adult males in 1998 and 1999, respectively, had adequate coverage for analysis of home range size and shape (Gervais et al. 2003). Radio failure severely limited data collection, and although modifications to the radio collar design led to greater durability and reduced likelihood of antennae being removed in 1999, the modifications did not prevent owls from damaging antennae or removing collars altogether. These problems were far more pronounced with the adult owls. Young birds appeared to accept 149
150 150 the transmitters with much less difficulty, and failure for juveniles appeared to have been due to faulty batteries. Out of 26 radios deployed on adult owls in 1998, 16 failed before the end of the season. One adult male with a failed radio, and 2 with functional radios, were found dead within the breeding season. Seventeen owls were last heard before July 1. Of the remaining 9, all disappeared before the end of July, probably due to the combined issues of battery failure and movements of owls away from nest burrows at the conclusion of the breeding season. Nests that failed were often abandoned, such that the male was detected there only occasionally or not at all for the remainder of the season. As these individuals were no longer of primary interest for the study, relocating them was not a priority. In 14 cases, owls were known to be alive at least 10 days following the recording of the last detected radio signal. Two owls moved nesting burrows following trapping, in both cases the new location was within 100 m of the old burrow, which is within the distance we consider the same nesting area in which satellite burrows exist (see Chapter IX). Although we did not detect some failed breeders at their previous nest site, we were unable to relocate them largely due to our research efforts oriented towards estimation of home range patterns (Gervais et al. 2003). The 28 juvenile owls radio collared in 1998 were far less likely to destroy the radios. Only 2 radios were known to have failed, and two radio-collared owlets were found dead. Five owlets were detected at burrows on the site following departure and sustained absence from their natal burrows. In one instance, the young bird was observed for several nights territorial calling at a burrow occupied by an adult male all season; the male had fledged young of its own. The adult male was not detected at the burrow during the time period that the young owl was observed there. The juvenile owls moved an average of 1800 m from their natal burrows (n = 5, SD = 2100 m; range = m) during the 1998 study period. These owls were detected at the post-fledging burrows from June 10 to September 10, suggesting a rather drawn-out period of initiation for post-fledging dispersal. Nests frequently failed at the egg stage in 1998 due to unusually wet weather, and many of the nests succeeded on the second attempt. This led to considerable heterogeneity in the calendar date of fledging. Movements of adult owls among nesting burrows at the Fragmented Site are less wellcharacterized within the breeding season, as radio-tagged males were not tracked following nest failure or if the radios malfunctioned. However, some information on movements can be gleaned from the data. This site is characterized by a low density of ground squirrels and apparently limited nesting opportunities due to a lack of burrows in many of the fallow areas or along roadways. No movements within the study site were noted for adult owls in 1998 with one exception, when an active nest relocated approximately 100 m following the death of the male. An additional nest fledged one young following the disappearance of the male, and the female remained at the nest and fledged a second brood with a new male later that season (Gervais and Rosenberg 1999). Three radio tagged male owls were associated with failed nests, but the locations of these owls following nest failure (and discontinuation of regular tracking) were unknown. Radio improvements increased the longevity of the radio collars in 1999 when they were deployed on adults, but 7 of the 26 radios still failed. Only 8 owls were last detected before July, and of these, 5 had failed radios and the other 3 were found dead. Still, 24 owls had at least one 150
151 151 estimated location, and 22 were used in the home range analysis. In only 2 cases were owls known to be alive more than 10 days following the last recorded radio signal, suggesting that radio failure was much reduced even at the end of the breeding season. Although data quality was much improved over that of 1998, issues of detectability and emigration following nest failure precluded formal within-season survival analysis. One adult male owl relocated 215 m from the burrow at which he began the nesting season in We had better success in tracking juvenile owls in Juvenile owls in 1999 included only 1 radio failure. Eight owlets were known to have died, and only one owl was seen more than 5 days after the last telemetry signal was recorded. Two owlets were found at non-natal burrows at the end of the breeding season. A total of 27 juveniles in 1999 had at least one radiotelemetry location. Although radio performance was generally excellent, few juveniles were detected on station once dispersal movements were initiated. Only 1 was detected away from its natal nest, and the new location was only 150 m away. We detected this juvenile during our nocturnal tracking. Disappearances of radio-tagged juveniles were not associated with known mortality. Initiation of post-natal dispersal was between early July and mid-august. Within-season movements of adults were largely undocumented; a few males associated with failed nests were occasionally detected at those nests in the weeks following failure, but not consistently so. Two additional successful nests relocated less than 100 m away following trapping, and one male owl moved 215 m between burrows. Neither of the burrows appeared to be successful nests. Several other nests appeared to have failed but the movements of the adults following failure are not known. Only the flight on August 16, 1999, resulted in owls located via the aerial flights. There were a total of 18 owls that were not located via ground search and for which we searched for via aerial telemetry. Three of these were located and subsequently located through ground searches. One of these was within the study area and the other 2, both juveniles, were located approx. 3.5 and 8.0 km from the study area, and 6.7 and 11.1 km from their nest site, respectively (Fig. 8-1).. 151
152 152 FIGURE 8-1. Locations of two chicks located via aerial telemetry during the 1999 breeding season that emigrated from the study area at the Fragmented Study site. Grassland 1998 Seven male owls at nests near roads were radio collared and tracked. Typically, the owls began making foraging excursions after dusk and returned to the nest periodically throughout the nightly tracking session. Some owls never ventured far from the nest area during tracking sessions while other owls moved beyond detection range for long periods of time. Several owls frequently were located hunting over or near Soda Lake. We did not estimate movement patterns due to the large proportion of time the owls were not detected and the clear bias of detecting them only near their nest site. The likely longer-distance foraging movements at this site than the other, and the limited road network resulted in sparse data. In addition, the short duration of the tracking period (< 30 days) resulted in limited data, and thus also limits interpretation of potential dispersal movements and survival rates We captured and radio-collared 19 Burrowing Owls from 17 nests, of which 5 (26%) females and 14 (74%) were males. One female was never seen again after deployment of the radio collar; she was removed from the analyses, leaving a total of 18 radio-equipped owls from 16 nests. Of these, 3 (17%) transmitters failed. Two of these were assumed to be due to battery failure and one collar had its antenna removed by the owl. These owls were treated as censored from the point of detected failure. We found 4 (22%; 3 males, 1 female) of the radio-marked owls dead during the study, confirmed 6 (33%; 4 males and 2 females) owls alive, and 5 (28%) were of an unknown status at the end of the study (July 6). Male owls that died were recovered from 0.5 to 1.6 km (mean = 0.9 km) from their nest. The only female recovered dead during the study was exhumed from a satellite burrow approximately 5 m from the nest burrow, apparently from natural collapse of the burrow. Causes of death included 1 mammalian predation event, 1 avian predation event, 1 burrow collapse, and 1 unknown cause. We used data from 17 owls to estimate survival. Two owls were omitted from the analysis due to immediate radio failure in one case and the owl was never seen again after initial tagging in the second case. Model φ(stage) ρ(.) had the lowest AICc, though the constant 152
153 153 survival model (Model [φ(.) ρ(.)]) was very similar in it s likelihood (Table 8-2). The weighted average apparent survival rate was 0.97 ± 0.02 (CI = ) per week prior to chick hatch and 0.93 ± 0.04 (CI = ) per week after hatch date. When applied to the 11 intervals (three months) of the study, we estimated an apparent survival rate of If this rate is applied throughout the year, annual survival rates are very low. We used data from 15 owls from 13 nests for analyses of movements; we excluded 4 owls from 4 nests due to radio failure and 1 owl that disappeared following initial tagging. Breeding dispersal was strongly influenced by nest success; we observed breeding dispersal only after nest failure. Of the 16 nests in our sample, 12 (75%) failed. After nest failure, 8 (44%; n = 6 males and 2 females from 7 nests) owls dispersed and were relocated at least once during the study (Fig. 8-2). Using aerial telemetry searches, we relocated 3 owls after they had dispersed. The remaining 5 owls that had dispersed were relocated using ground telemetry searches. Breeding dispersal distance ranged from 0.2 km to 53.1 km and averaged 14.9 ± 8.3 km, with a median of 3.1 km (Fig. 8-3). We confirmed re-nesting at the second burrow location for 3 of the owls. These results were previously summarized in Rosier et al. (2006). TABLE 8-2. Model description and results of survival analyses of adult Burrowing Owls on the Carrizo Plain, CA from May-July Model Description k a AICc b AICc Weight c Φ(stage) ρ(.) φ(.) ρ(.) φ(t) ρ(.) φ(.) ρ(t) φ(t) ρ(t) 2-staged survival estimate based on average hatch dates, and constant probability of relocation Constant survival and probability of relocation Survival varied with time and constant probability of relocation Constant survival, probability of relocation varied with time Survival and probability of relocation varied with time a Number of parameters in the model b Difference in small-sample size corrected AIC from the model with the lowest AICc c An estimate of the likelihood of the model within the set of models considered (Burnham and Anderson 2002) 153
154 154 FIGURE 8-2. Maximum dispersal distances of Burrowing Owls during the breeding season, Grassland study area, Shown are owls that moved at least 100 m from their initial nest to the last known burrow or nest location. The red oval depicts the approximate perimeter of the aerial surveys Number of Burrowing Owls Distance moved (km) FIGURE 8-3. Frequency distributions of breeding dispersal distances for Burrowing Owls at the Grassland study area from May-July Zero distance moved indicates that the owl remained at the first nesting site. Three owls were excluded because they dispersed but were not relocated. From Rosier et al. (2006). 154
155 We fitted 55 Burrowing Owls with radio transmitters at the Grassland site during the breeding season of 2002 (Table 8-1). These were composed of 23 adult males, 17 adult females, 9 juvenile females, and 6 juvenile males. Here, we report on movements during the breeding season from April 30- August 27, and the distances moved from the initial location to that last observed during the study period, from April 2002-April Of the 55 owls radio-tagged, 21 individuals (38%; 19 adults, 2 chicks) survived until the end of the season. Fifteen individuals (27%; 6 adults, 9 chicks) died during the course of the season, and the fate of 19 individuals (35%; 15 adults, 4 chicks) remained unknown at the end of the field season (Fig. 8-4). Breeding Season-- During the breeding season, both young and adult owls were observed relocating from their initial nest to a new nest or day roost location. Chicks moved the shortest distances, with a maximum of 1.9 km from their natal nest to the last location during the breeding season. Adult female and males moved a maximum of 6.0 and 19.8 km, respectively (Table 8-4). Several owls moved repeatedly to more than one location during the breeding season. Of the adult owls that survived until the end of the breeding season or whose ultimate fate was unknown, 8 individuals (24%) moved after nest failure, 2 (6%) renested within approximately 100 m after nest failure and then later moved after their renesting attempts failed, 1 (3%) left the nest even though it was still active and chicks were young, 19 (56%) left the nest after the chicks had fledged, 3 (9%) remained near their nest burrows until the end of the season, and 1 radioed owl (3%) never initiated a nest based on burrow observations with the infrared scope. Eight of the radioed owls (53%; 3 adults, 5 chicks) were found dead in their burrows and were discovered with the burrow scope. In 5 cases (33%; 2 adults, 3 chicks), we only located the owl s radio and some feathers, most likely indicating that the owl was killed by a raptor. In 2 cases (13%; 1 adult, 1 chick), the radio appeared to be buried or partially buried, and death most likely resulted from a canid kill. For those owls found dead in burrows, cause of death is unknown. Unfortunately, none of the bodies could be retrieved for examination as they were too far underground. Annual Study Period-- Better telemetry equipment allowed us to fly well beyond the 20 km flight area during the post-breeding season. A higher quality receiver as well as Yagi antennae on the aircraft increased our detection distance and allowed us to more frequently extend our flights beyond the Carrizo Plain study area. These flights (3 of 5) were flown approximately 800 m above ground level and covered the Carrizo Plain as well as the Cuyama Valley (SW boundary as shown in Fig. 8-2). The other 2 flights used methods similar to those described for the breeding season. Ultimately, 5 owls (9%) were found alive at the end of the 12-month period (3 male, 2 female, all adults) and 14 owls (25%) were still missing. One owl was located outside of the breeding season flight area, but we were unable to confirm its status because the signal was coming from private land that we were unable to access. Radio signals of 3 owls were located via aerial telemetry for which we could not confirm its location via ground checks; these locations were excluded from that reported here. 155
156 156 As expected, we observed greater movements over the entire study period than during the breeding season alone. There was a decline in the number of owls radio-tracked because of both mortality and loss of radio signals, and hence the distances we report do not necessarily reflect movements within the annual period. There was very high variability in the distances owls moved during the study period (Fig. 8-5A). Both adult male and females moved greater than 20 km, and chicks were observed to have moved a maximum of 13.6 and 1.9 km for female and males, respectively (Table 8-4). We observed 14 owls that moved at least 2 km, with most sightings within the Study area (Fig. 8-5B). The 5 owls that were known to have survived through the year (13 month study period) were all adult owls and were found 754 ± 160 m (range: m) from their previous breeding sites (Fig. 8-6). Of the 5 owls, 2 (40%) were found at what appeared to be nest burrows, although we did not attempt to confirm the breeding status of the surviving birds. The 14 owls that were not relocated by the end of the study (18 April 2003) were 2598 ± 1086 m (range: m) from their original location at the last Number of Owls KNOWN ALIVE IN BURROW (NO CONFIRMATION) FOUND DEAD MISSING Check Interval FIGURE 8-4. Status of owls during each of the intervals in which we search for owls. The dates of the intervals are defined in Table 8-3. location. The average date of disappearance was 16 September 2002 ± 21 days (range: 5 June 12 December 2002). The 36 owls that were found dead were found 3440 ± 929 m (range: m) from their original burrows. Fifteen of the 36 owls that died (42%) were found dead during the breeding season. The average date that owls were found dead was 27 October 2002 ± 20 days (range: 30 April April
157 157 FIGURE 8-5 (A). Maximum distances moved for owls in the Grassland study area that we observed at least 100 m between their initial nest in spring 2002 to their last known burrow location by April The purple point represents their initial location. There were a total of 42 owls that moved 100m, some originating from the same nest and thus represented by the same initial point. FIGURE 8-5 (B). Maximum distances moved for owls in the Grassland study area that we observed at least 2 km (n=14) between their initial nest in spring 2002 to their last known burrow location by April
158 158 FIGURE 8-6. Path and distance of movements for 5 owls that were known to be alive at the end of the 2003 field season in the Grassland study area. The information in the parentheses is the owl s transmitter number and unique identifier. 158
159 TABLE 8-3. Dates of search intervals for juvenile and adult radio-tagged owls at the Carrizo Plain National Monument, California. The breeding season encompasses intervals through 18. The number found dead reflects both search effort and mortality within the particular interval. CHECK INTERVAL INTERVAL DATE NOT LOCATED IN BURROW KNOWN ALIVE FOUND DEAD CUMULATIVE DEAD 1 04/30/ /06/ /13/ /20/ /27/ /03/ /10/ /17/ /24/ /01/ /08/ /15/ /22/ /29/ /05/ /13/ /20/ /27/ /13/ /27/ /14/ /21/ /08/ /07/ /20/ /11/
160 . TABLE 8-4. Distance (m) of Burrowing Owls from their initial nest site to their last known location (found alive or dead) of the individual. Grassland study area, during the (A) breeding season and (B) annually, April A. Breeding season B. Entire study period Adult (n = 17) Female Chick (n = 9) Adult (n = 23) Male Chick (n = 6) Mean SE Min Median Max Mean SE Min Median Max Agricultural Site Of the 8 radios deployed on adult male owls (Table 8-1), 4 functioned for the entire study period (June 5 July 13). Three of the failed collars were the result of owls removing their antennae, a behavior that prompted redesign of radio collars in 1999 at the Fragmented study area. One of the owls abandoned its nest and apparently left the study area; we never reobserved the owl or detected the radio s signal. We used the radio tracking data for estimation of breeding season home range size and habitat use, which was report in Rosenberg and Haley (2004). The small sample size and limited duration precluded our inclusion of these owls in our analysis of dispersal Although we initially radio-tagged a total of 100 Burrowing Owls, we excluded a number of owls from analyses due to mortality caused by the radio harnesses (Gervais et al. 2006). We initially radio-tagged 64 adult Burrowing Owls and 36 juveniles during 2002 in the Agricultural study area. Ultimately, we tracked 34 chicks and 35 adults sufficiently for estimation of movement patterns. Details of the reduction of the sample size from that initially tagged are 160
161 provided in the respective RESULTS sections, below, for Juveniles and Adults. The results of the analyses of the movement of adults are modified from Catlin (2004). 161 Juveniles-- From 9 June to 20 July 2002 we captured and radio-tagged 36 Burrowing Owl chicks. Two of these were later collected by USFWS for an analysis of talon deformities. Thus, we examined movement patterns of a total of 34 chicks, 22 female and 12 males (Table 8-1). Variation in body-size was small for juvenile owls that received radio-transmitters. The average mass of juvenile owls was 133 ± 9 g (mean ± 1SD, range: g, n = 34), and the average wing-chord length was 147 ± 13 mm (mean ± 1SD, range: mm, n = 34). A variable number of owls were missing at any single visit, but only three owls (9%) were unaccounted for by the final week of the 13 month study. Due to the relatively large sample size in a single year, the duration of the study, and the large probability of detection of the owls in this study area, particularly with the aerial telemetry support, these data allowed us to conduct the most detailed analysis of any of our data of juvenile movement patterns. The primary limitation of these data, and one that negatively affects movement distance over the annual period, is the high mortality that we observed, and that we later identified as an effect of the radio harnesses (Gervais et al. 2006). Independence (see Juvenile Movements under General Field Methods for definition) was most affected by weeks since fledging, and, to a lesser degree, by gender and the timing of fledging. The average date that male chicks were last seen within 100 m of their natal burrow was 21 July, 2002 ± 7 days (range: 20 June, 2002 to 25 Aug., 2002, n = 11); this was equivalent to 3.4 ± 0.8 weeks (range:1 8 weeks) post-fledging. Females tended to leave their natal area later than male owls; the average date was 10 Sept ± 19 days (range: 12 June 2002 to 8 Apr. 2003), equivalent to 11.8 ± 2.6 weeks (range: 1 40 weeks) post-fledging. The average difference in departure date between genders was due largely to the few females that stayed until the breeding season of the following year. As predicted, independence increased with increasing weeks since fledging (β = % CI: , P < 0.001). Birds that fledged early in the season showed less independence at the mean number of weeks (β = % CI: , P = 0.01) than those that fledged later, but their independence increased more rapidly than those that fledged late in the season (β = % CI: , P = 0.03) contrary to our prediction. There was a high degree of variability of independence for birds that fledged late in the season (Fig. 8-7). There was little evidence that male and female owls differed in independence at the mean number of weeks (β = % CI: , P = 0.60), but female owls increased their independence more slowly than that for male owls (β = % CI: , P = 0.02, Fig. 8-7). Because no male chicks lived longer than 13 weeks (See Discussion), interpretation of these parameters is limited to that early period. 161
162 Proportion Female, Early Fledge Female, Late Fledge Male, Early Fledge Male, Late Fledge Time Period Since Fledging FIGURE 8-7. Proportion of juvenile owls found > 100 m from their natal burrow during each period in the Imperial Valley, California. Period lengths on the x-axis vary from weekly (1-10), biweekly (11-22), and a final ten-week period that coincides with the initiation of the breeding season (23). The points are shifted to the right between integers for clarity. The timing of fledging and weeks since fledging appeared to have the greatest effect on the maximum distance juvenile owls were detected away from their natal nests. Maximum distances from the natal burrow, like independence, showed a great deal of variability, ranging from < 100 m to 11.7 km. Of the 29 chicks that were seen > 100 m from their natal burrow, males (397 ± 124 m, n = 8) tended to have shorter maximum distances than females (1762 ± 630, n = 21), but this discrepancy was probably a result of a difference in longevity between genders and thus the time since fledging. Owls that fledged earlier in the season were closer to their natal burrows at the average number of weeks (β = -0.51, 95% CI , P = 0.01) and increased their maximum distance more slowly (β = -0.51, 95% CI , P = 0.04) than birds that fledged later in the season (Fig. 8-8). As the number of weeks since fledging increased, the average maximum distance away from the natal burrow tended to increase, but the results were inconclusive (β = 0.57, 95% CI , P = 0.16). 162
163 Average Distance (m) Female, Early Fledge Female, Late Fledge Male, Early, Fledge Male, Late Fledge Time Period Since Fledging FIGURE 8-8. Average maximum distance (> 100 m) for juvenile owls in the Imperial Valley, California. Period lengths on the x-axis vary from weekly (1-10), biweekly (11-22), and a final ten-week period that coincides with the initiation of the breeding season (23). The points are shifted to the right between integers for clarity. 163
164 Sibling Behavior 164 The probability that siblings were within 100 m of one another decreased throughout the year as we had predicted. The 34 owls that were fitted with transmitters came from 16 nests; we tagged multiple juveniles at 10 of these nests. At 5 nests, we radio harnessed 2 owlets, at 3 nests we radio tagged 3 owlets, and at one nest each we radio tagged 4 and 5 sibling owlets. Female siblings were less likely to be within 100 m of one another through time (β = % CI: , P = 0.01). The probability that male siblings were within 100 m of one another may have decreased more rapidly than for female siblings, but the broad confidence intervals as a result of small sample size resulted in lack of significant differences (β = % CI: , P = 0.29). This likelihood for siblings of mixed gender, however, decreased more rapidly than for female siblings as the owls aged (β = %CI: , P = 0.03). The distance among siblings was not related to the type of sibling relationship, only to the time since fledging. Overall, as the number of weeks since fledging increased, the distance between siblings also increased (β = % CI: , P = 0.004). Neither male siblings (β = % CI: , P = 0.97) nor mixed gender pairs (β = % CI: , P = 0.96) differed from female siblings in the distance between them at the mean number of weeks. In addition, the change in distance between male siblings (β = % CI: , P = 0.97) and between mixed gender pairs (β = % CI: , P = 0.49) was not different from that of female siblings. Juveniles displayed natal-nest-centered, single-roost, and multiple roost post-fledging dispersal behavior at both the short time scale and throughout the year. There was a great deal of variation about these themes, however (Fig. 8-9, A and B). The longer distance movements that we observed occurred near or before 10 weeks post-fledging, but some owls did remain at or near their natal burrow even until the following breeding season (Fig. 8-9B). In particular, two female siblings remained at their natal burrow until the following breeding season; their parents moved m to a pair of secondary burrows and remained there until April the following year. 164
165 A Maximum Distance (m) B. Time Period Since Fledging Maximum Distance (m) Time Period Since Fledging Figure 8-9. Pattern of post-fledging movement in juvenile Burrowing Owls from the Agricultural study area at (a) a time scale similar to post-fledging period in migratory populations (King and Belthoff 2001, Todd 2001), and (b) throughout the year until the next breeding season. Each line represents the maximum distance from the natal burrow (> 100 m) for a different juvenile owl. The circles represent known locations and the lines represent the time between known locations. Period lengths on the x-axis vary from weekly (1-10), biweekly (11-22), and a final ten-week period that coincides with the initiation of the breeding season (23). 165
166 Adults Within Breeding Season Of the 62 adult owls initially radio-tagged, we included 35 in the analysis of dispersal probability and distance, and 22 were included in the analysis of the experimental data on nest predation and dispersal. Thirteen of the 62 owls died soon (< 28 days) after radio-tagging (Gervais et al. 2006). Additionally, 4 nests with a total of 8 radio-tagged owls were either killed or negatively affected by road maintenance soon after radio-tagging (Catlin and Rosenberg 2006), 2 owls were never relocated during the breeding season, and 4 owls continued to move throughout the study period and thus did not meet our definition of dispersal (see Definition of Terms under General Field Methods, this chapter). These omissions resulted in a total of 35 adult owls that we included in analysis of movement patterns. Of these, 22 owls from 15 nests (8 treatment, 7 control) met the criteria for inclusion as either control or treatment owls for the experiment on nest predation. Previously banded owls allowed us to investigate the effects on dispersal of a previous year s experience with a mate or territory. Results from the formal experiment are reported in Catlin and Rosenberg (unpubl. ms). Here, we report on the larger sample of 35 owls much of which was taken or modified from Catlin (2004). A total of 15 of 35 owls (43%) dispersed during the breeding season. Owls that lost their mates tended to be more likely to disperse from their initial nest than those that remained paired, particularly female owls. Six of 10 owls (60%; 3 of 3 females, 3 of 7 males) that lost their mate dispersed while 6 of 18 owls (33%) that did not lose mates dispersed during the breeding season. Two of 4 competing models included mate loss as a parameter, but the intercept model received the highest ranking, providing marginal strength in support of effects. Owls that lost their current mate were 3.15 (95% CI: ) times more likely to disperse than birds that did not lose their mate. Owls whose nests were depredated tended to be more likely to disperse than those that nested successfully, but there was little evidence that the reaction of owls to nest depredation differed from that of owls whose nest failed for other reasons. Ten of 20 owls whose nests were depredated (50%) dispersed, while 4 of 9 owls whose nests failed for other reasons (44%) dispersed, and only 1 of 6 successful birds (17%) dispersed. Depredation, however, did not appear among the competing models, but the parameter estimates did offer some evidence that nesting failure in general was related to an increase in dispersal probability. The weighted estimates indicated that birds whose nests were depredated were 5.44 (95% CI: ) times more likely to disperse than successful birds. Birds whose nests failed because of abandonment were estimated to be 4.39 (95% CI: ) times more likely to disperse as birds that were successful. There was little evidence, however, that the dispersal probability differed between owls whose nest were depredated and those that failed for other reasons (1.24, 95% CI: ). The estimate for the days with transmitter effect was (95% CI: ); this parameter represents the increase in dispersal probability associated with an increase in the number of days that an owl survived with a radio. The inclusion of this variable in the models controlled for its effect on dispersal probability. We found some indication that mate fidelity and nest site fidelity from the previous year affected dispersal probability at the agricultural area in the current year, particularly mate fidelity. Of the 11 owls that were mated to the same mate as the previous year at the beginning of the breeding season, 7 (64%) dispersed, and 4 of 13 owls that were not with the same mate 166
167 167 (31%) dispersed. The mate fidelity parameter was included in 4 of the 7 competing models, but the no effects model also appeared at the top of the set. The support for an effect from mate fidelity was relatively strong (same mate: 5.95, 95% CI: ), suggesting that mate fidelity had some effect on dispersal probability. There was less support for the hypothesis that nest site fidelity affects dispersal probability; owls that bred at the same nest site as the previous year were 2.11 (95% CI: ) times more likely to disperse than those that did not. Eight of 15 owls that nested at the same nest as the previous year (53%) dispersed, and 3 of 8 owls that were at new nest sites (38%) dispersed. The variable for same nest as the previous year did appear among the competing models, but the no effects model was the highest ranked model. Although both estimates had wide confidence intervals, their point estimates were in a direction opposite to our hypotheses, suggesting that previous experience with a mate or territory may increase dispersal probability within the next breeding season. In contrast to dispersal probability, we found little evidence that dispersal distance was affected by the loss of a current mate. The parameter for mate retention did not appear among the competing models and the estimate for the effect of mate loss on dispersal distance was 1.75 (95% CI: ). Similarly, there was little evidence to indicate that nest depredation increased dispersal distance. Nest depredation did appear among the competing models, but gender was the highest ranked model. The median dispersal distance for owls whose nests were depredated was 0.41 (95% CI: ) of that for owls whose nests were successful or failed for other reasons, suggesting that, if anything, these owls dispersed shorter distances than successful owls or owls that failed for other reasons, contrary to our predictions. We found little evidence of an effect of mate fidelity or nest site fidelity on dispersal distance. Neither of the variables appeared among the competing models. The effect of having a new mate on median dispersal distance was 1.51 (95% CI: 0.34 to 6.64), and the estimate for the nest fidelity parameter was 1.47 (95% CI: 0.38 to 5.65), showing little evidence for either mate fidelity or nest site fidelity affecting dispersal distance. Comparison of Adult Movement Patterns: Grassland vs Agricultural Sites A total of 24 of 46 owls (52%; 21 males, 25 females) dispersed within the breeding season at the Grassland and Agricultural study areas, respectively. Study area had the greatest effect on dispersal probability, whereas there was less evidence in support of an effect due to nesting success and owl gender. We identified 3 competing models that were supported by the data, which included subsets of all of the parameters tested, indicating that there was some evidence for effects on dispersal probability from all of these parameters. Owls from the Grassland area were more likely to disperse (9 of 11, 82%) than owls from the Agricultural area (15 of 35, 43%). Owls that successfully nested had a similar dispersal probability as those that failed; 7 of 13 successful breeders (54%) dispersed while 17 of 33 failed breeders (52%) dispersed (Fig. 8-10). After controlling for study area, however, there was some evidence that owls whose nests failed were more likely to disperse than those whose nests were successful, but the estimate was imprecise. Female and male owls also had similar observed rates of dispersal; 13 of 25 female owls (52%) dispersed, and 11 of 21 male owls (52%) dispersed (Fig. 8-11). Estimates for the change in odds-ratio associated with owls from the Grassland site, owls whose 167
168 nests had failed, and female owls demonstrated a decreasing amount of evidence and were 7.56 (95% CI: ), 2.45 (95% CI: ), and 1.66 (95% CI: ), respectively Proportion 0.4 Failed (n = 33) Successful (n = 13) Distance (m) >12800 Figure Comparison of the distribution of burrowing owl within-season breeding dispersal distances by nesting success. Data were collected throughout the breeding season, April to August, 2002 at the Agricultural and Grassland study areas. The frequency at the m interval represents those owls that did not disperse. From Catlin (2004). 168
169 Proportion Males (n = 21) Females (n = 25) Distance (m) >12800 Figure Comparison of the distribution of burrowing owl within-season breeding dispersal distances by gender. Data were collected throughout the breeding season, April to August, 2002 in the Agricultural and Grassland study areas. The frequency at the m interval represents those owls that did not disperse. From Catlin (2004). We found the strongest evidence for owl gender affecting dispersal distance. We also found some evidence that study area and nesting success affected dispersal distance, but the results were inconclusive. The 24 within-season breeding dispersals ranged from 124 m to m (mean = 2616 ± 823 m; n = 15 from the Agricultural area and n=9 from the Grassland area). The results indicated that female owls, owls from the Grassland area, and owls with failed nests dispersed farther than male owls, owls from the agricultural area, and owls that successfully bred, respectively (Table 8-5). Variables for owl gender and study area appeared among the competing models, but the no effects model received the highest ranking. The median dispersal distance for female owls was 3.73 (95% CI: ) times greater than that for males (Fig. 8-11). The median dispersal distance for owls from the grassland area was 2.55 (95% CI: ) times greater than for owls from the agricultural area (Fig. 8-12). The 169
170 median dispersal distance for owls whose nests failed was 2.31 (95% CI: ) times greater than that for successful birds after controlling for gender and study area (Fig. 8-10). 170 TABLE 8-5. Comparison of within-season dispersal distances (m) in relationship to gender and nesting success of Burrowing Owls at the Grassland and Agricultural study areas. From Catlin (2004). Summary Statistics Dispersal Distance (m) Sex of Owl Nesting Success Study Area Male Female Success Fail Agricultural Grassland N Range Mean SE Median
171 Proportion Agricultural owls (n = 35) Grassland owls (n = 11) >12800 Distance (m) Figure Comparison of the distribution of burrowing owl within-season breeding dispersal distances in the Agricultural and Grassland study areas. Data were collected throughout the breeding season, April to August, The frequency at the m interval represents those owls that did not disperse. Geometric Model Despite their suitability for some dispersal data, he geometric models did not fit our data well. These models displayed a relatively large lack of fit, particularly for owls in the Grassland study area and female owls and for relatively long distance movements in all of the models (Figs. 8-13, and 8-14).
172 Table 8-6. Parameter estimates from geometric models fitted to Burrowing Owl witbreeding dispersal distance at the Agricultural and Grassland study ar Geometric Predicted Agricultural Owls (n = 15) 3 2 Geometric r-square = Number of Owls > Geometric Predicted Grassland Owls (n = 9) 3 2 Geometric r-square = Distance (m) >9600 Figure Comparison of the fitted geometric model for distribution of Burrowing Owl within-season breeding dispersal distances. Data include owls that moved >100 m. The predicted distribution was calculated using non-linear regression (PROC NONLIN, SAS Inst., 1999) from the number of owls that dispersed within each 400-m interval. From Catlin (2004).
173 Figure Comparison of the fitted geometric model for Geometric distribution Predicted of burrowing owl withinseason breeding dispersal distances and sex of owl. Data Minclude ale Owls owls (n = that 11) moved >100 m. The predicted distribution was calculated using non-linear regression (PROC NONLIN, SAS Inst., ) from the number of owls that dispersed within each Geometric r-square = Number of Owls > Geometric Predicted Female Owls (n = 13) 3 2 Geometric r-square = Distance (m) Figure Comparison of the fitted geometric model for distribution of Burrowing Owl within-season breeding dispersal distances and gender of owl. Data include owls that moved >100 m. The predicted distribution was calculated using non-linear regression from the number of owls that dispersed within each 400-m interval. From Catlin (2004). >9600
174 IX. Estimation of Natal and Breeding Dispersal: Mark - Reobservation Data 174 Summary We used observations of uniquely marked Burrowing Owls to estimate natal and breeding dispersal probability and distance within the Fragmented, Grassland, and Agricultural study areas. We did not include the Grassland site in analyses of dispersal because of limited reobservation data. In this chapter, we summarize and synthesize our research on dispersal using mark-reobservation methods. Our primary results corroborate those from analysis of dispersal patterns from telemetry data (Chapter VIII) demonstrating that Burrowing Owls have a broad range of dispersal patterns, with strong individual variation that is partially explained by age class, gender, and study site. Almost half of the adult owls that were reobserved between years remained within 100 m of their nests, whereas almost all of the juveniles moved considerably greater distances. Owls moved distances up to 10 km, and in all of our study sites, up to the maximum distance at which they remained in the study area. This caused some negative bias in our estimates. Dispersal distributions were approximately normally distributed for juveniles whereas adult dispersal distances were best fit a negative exponential relationship. These different distributions suggest an inclination to move away from the immediate area of the nest for juveniles and then at approximately 1 km from the nest, there is a decline in the probability of dispersing further. General Field Methods In this chapter we estimate natal and breeding dispersal and describe the patterns of movements using mark-recapture data only. We used data from adult and juvenile Burrowing Owls banded April-July and resighted April-July ; the number of years varied among study sites (Table 9-1). We fitted each bird with a colored, metal alpha-numeric band (Acraft Sign and Nameplate Co., Canada) and a USGS numeric metal band (size 4) and relocated banded birds each year using several survey methods that ensured a high resight probability at all sites except the Grassland site (see Chapter IV, Field Methods). We used the same criteria for including an owl to enter the dispersal analysis as we did for the survival analyses (Chapter VII), with the additional criteria that owls must have been seen in at least 2 successive years, and only distances between successive years were used. Further, only owls that had a known active nest using the criteria described in Chapter IV (Field Methods) were included in analyses. In the Agricultural study area, we included owls that were observed in all areas of the study area including Area C (Fig. 2-10), which was not included for estimation of survival (see Chapter IV, Field Methods, for explanation).
175 175 We defined dispersal as movements of 100 m or greater from the previous nest site between breeding seasons. This distance was approximately the median nearest neighbor distance for active burrowing owl nest sites at our study sites (Chapter VI) and contains the area around a nest that includes satellite burrows for juveniles and the breeding pair (Green and Anthony 1989, Desmond and Savidge 1999, Ronan 2002). Catlin et al. (2005) previously used this distance as the criteria for dispersal and provided supporting arguments for its use. In addition to movements within the study area, we had opportunistic re-sightings of owls from outside the study area from which they were banded or movements into the study area from owls banded from outside the study area. This occurred at the Urban and Fragmented study sites. We report the distances of movements of owls that were observed within and outside of the study areas in consecutive years; that is, owls must have been observed without a gap between breeding seasons. Because the probability of these movement events cannot be estimated with our data, we use these movements descriptively as a demonstration of movements that can occur, and to allow modification to our dispersal functions to accommodate these movements and thus reduce the expected negative bias of estimated dispersal distributions of banded birds. Because each study site was of a different size and shape, identical true dispersal distributions could result in different estimated dispersal patterns. This is likely to occur with birds because a negative bias could be present if individuals disperse beyond the search boundaries of the study (Porter and Dooley 1993; Koenig et al. 1996). In the Addendum to this report, we will examine this potential by applying the estimated dispersal distributions at each site with a random direction to the actual owls found at the site in question, thus forming a hypothetical set of movements some of which will be outside the study area. From those inside the study area, that is, those that would have been possible to have been found through the resight surveys, we will re-compute the dispersal distributions and evaluate potential bias. Statistical Methods To compare dispersal patterns across study areas, years, age class, and gender, we separated dispersal probability and dispersal distance for analyses, following Catlin (2004) and Catlin et al. (2005). This facilitated understanding biological mechanisms that motivate dispersal and facilitated analyses because of the clearly bimodal distribution patterns almost half of the owls remained at or near their previous years nest and the remainder dispersed throughout a large range of distances. We used the distance criteria stated above for defining a movement as a dispersal event. Analyses of dispersal distance only included owls that moved 100 m between years. Some individuals were included in the data more than once, the number equal to the number of dispersal events we recorded for a given individual. We report the frequency of this in the Results, but have not included the repeated nature of individuals in the statistical analyses. As such, estimates of precision of the regression coefficients are approximate. We will include the repeated measurements of distance in an analysis to be reported in the Addendum to this report. To estimate the relative association of each factor (study area, years, age class, and gender), we developed an a priori set of 10 candidate models (see Results). We used a generalized linear model approach (SAS Proc Genmod; SAS 2001) to estimate the parameters of
176 176 each model and used AIC model selection approaches (Burnham and Anderson 2002) to compare the relative suitability of each model. To evaluate dispersal probability, we used a logit response variable (logistic regression) which allowed us to estimate the relationship of the explanatory variables to the probability that an individual dispersed (i.e., moved < 100 m between years). To evaluate dispersal distance, we log transformed the response variable because of the large range of values, with most centered towards shorter distances. We then used Proc Genmod to estimate the relationship between the explanatory variables and the distance an individual moved for those individuals that met our criteria of dispersal (i.e., 100m). We computed the explained variance (R 2 ) for the best log-distance model with Proc GLM (SAS 2001) and estimated the contribution of each variable to the variation that was explained by using the sum of squares for that variable / total sum of squares explained by the model. For estimating R 2 of the best model for dispersal probability, we used the maximum rescaled approach (Allison 1999). Results A total of 507 Burrowing Owls met the criteria for inclusion in the estimation of dispersal probability. Of these, a total of 889 records were of owls observed in at least 2 consecutive years and met the criteria for inclusion in the analyses (Table 9-1). There was a total of 175 juveniles included in the analyses, and of these 75 ( 30 in the Urban site, 18 in the Fragmented site, none in the Grassland site, and 27 in the Agricultural site) were included also as adults because they were observed in at least 3 years, providing 2 potential inter-annual movements. Many individual owls were reobserved in more than 2 years, providing potentially several inter-annual movements (Table 9-2). Over 80% of the total number of observations (n=714 of 889, 80.3%; Table 9-1) were movements as adults exhibiting either breeding dispersal ( 100m) or site fidelity (<100 m). The remainder of the records, 175 (19.7%), were juveniles that were reobserved as adults, and thus reflect natal dispersal. A large number of adults were included in the dispersal analyses (407 individuals out of 847 (48.1%) banded (excepting the last year of the study from which cohort re-observations were not possible) whereas fewer juveniles banded were included (175 of 1016, 17.2%). The low percent of juveniles reobserved and included in the dispersal estimates is likely due to both the high mortality (Chapter VII) and greater movements outside the study area (See Discussion). The sample size of movements of owls in the analyses per study area reflected both the number of owls initially banded and the low re-observation rate of owls that moved at the Grassland site, ranging from a total of 20 movements at the Grassland site to nearly 500 owls at the Agricultural study area (Table 9-1). The majority of owls remained near their previous nests (Fig. 9-1). However, longerdistance movements demonstrated that owls did move throughout the study area. A few dispersed over 10 km, near the limit of the distance across study areas and hence our ability to detect them. Adult owls had high site fidelity with over 50% remaining within 100 m of a burrow from year to year (Fig. 9-2). Distribution of movements declined rapidly with distance from the previous year s nest site, resembling an exponential decline (Fig. 9-2). This pattern contrasted with juveniles, whose dispersal distribution resembled a normal distribution, with few
177 177 juveniles that remained within 100 m of the nest, the largest number dispersing approximately 1 km, and declining numbers of juveniles detected moving farther. These general patterns were true at the Urban (Fig. 9-3), Fragmented (Fig. 9-4), and Agricultural (Fig. 9-5) study areas; there were only 20 movements of 19 owls recorded at the Grassland study area (Fig. 9-6) thus limiting inferences on movements based on mark-resight methods. We thus did not conduct statistical analyses on movements at the Grassland site. Table 9-1. Number of movements of Burrowing Owls that were included in estimation of dispersal distances from the four study areas, The number of individual owls is less than the numbers shown here as some individuals were seen more than once (Table 9-2). There were 889 total movements used in the analyses. Urban Fragmented Grassland Agricultural Total Years Included Adult Males Adult Females Juvenile Males Juvenile Females
178 178 Table 9-2. Number of observations of individuals in the analyses of (A) dispersal probability (including 0 distance) and (B) dispersal distance (movements 100m). Number of dispersal events represents the number of times an individual was included in the dispersal data set. Percent of the population is in parentheses. A. Dispersal Probability Number Dispersal Urban Fragmented Grassland Agriculture Total Events 1 69 (53.1) 82 (71.3) 18 (94.7) 114 (46.9) 283 (55.8) 2 30 (23.1) 25 (21.7) 1 (5.3) 62 (25.5) 118 (23.3) 3 17 (13.1) 8 (7.0) 43 (17.7) 68 (13.4) 4 10 (7.7) 16 (6.6) 26 (5.1) 5 4 (3.1) 7 (2.9) 11 (2.2) 6 Total Individuals 7 1 (0.4) 1 (0.2) B. Dispersal Distance Number Dispersal Urban Fragmented Grassland Agriculture Total Events 1 67 (70.5) 70 (87.5) 11 (100) 108 (77.1) 256 (78.5) 2 24 (25.3) 9 (11.3) 24 (17.1) 57 (17.5) 3 3 (3.2) 1 (1.3) 6 (4.3) 10 (3.1) Total Individuals 4 1 (1.1) 2 (1.4) 3 (0.1)
179 Proportion Distance (m) >10000 FIGURE 9-1. Distribution of dispersal distances for all owls pooled (n=889 owls). Distance shown is the mid-point of m (no dispersal), m, and the remaining distances are at 500 m intervals. The error bar denotes the min and max proportion of owls within each distance class based on the range of values from each site and year Male Adults (N = 390) Female Adults (N = 324) Male Chicks (N = 99) Female Chicks (N = 76) Proportion FIGURE 9-2. Distribution of inter-annual dispersal distances for each gender and age class from all owls pooled from study area and years (n=889 owls) Distance shown is the mid-point of m (no dispersal), m, and the remaining distances are at 500 m intervals. The error bars denote the minimum and maximum proportions of owls based on the proportions of owls within each distance class for each year and study area Distance >10000
180 Proportion Male Adults (N = 96) Female Adults (N = 89) Male Chicks (N = 34) Female Chicks (N = 21) FIGURE 9-3. Distribution of inter-annual dispersal distances for each gender and age class from the Urban study area (n=240 movements). Distance shown is the mid-point of m (no dispersal), m, and the remaining distances are at 500 m intervals. The error bars denote the minimum and maximum proportions of owls among years Distance (m) > Proportion Male Adults (N = 42) Female Adults (N = 57) Male Chicks (N = 32) Female Chicks (N = 25) Distance (m) FIGURE 9-4. Distribution of inter-annual dispersal distances for each gender and age class from the Fragmented study area (n=156 movements). Distance shown is the mid-point of m (no dispersal), m, and the remaining distances are at 500 m intervals. The error bars denote the minimum and maximum proportions of owls among years >10000
181 Proportion Male Adults (N = 7) Female Adults (N = 9) Male Chicks (N = 4) FIGURE 9-5. Distribution of dispersal distances for each gender and age class from the Grassland study area (n=20 movements). Distance shown is the mid-point of m (no dispersal), m, and the remaining distances are at 500 m intervals. The error bars denote the minimum and maximum proportions of owls among years Distance (m) > Proportion Male Adults (N = 245) Female Adults (N = 169) Male Chicks (N = 29) Female Chicks (N = 30) FIGURE 9-6. Distribution of dispersal distances for each gender and age class from the Agricultural study area (n=473 movements). Distance shown is the mid-point of m (no dispersal), m, and the remaining distances are at 500 m intervals. The error bars denote the minimum and maximum proportions of owls among years Distance (m) >10000
182 182 Although a majority of owls remained near the nest between years and did not disperse, the probability of dispersal was strongly associated with age class and gender, and weakly associated with study area. Year was not clearly associated with the probability of dispersal. The model that included year effects was among the lowest ranking models (Table 9-3), probably largely due to the complexity of the model and the more limited data for each year, making detecting effects more difficult. However, parameter estimates suggest minor influence of year; the small decrease in the deviance (Table 9-3) supports the inference that dispersal probability was similar among years. Rather, models that included study area, age class, and gender ranked the highest, and the model that included all of these effects had the highest ranking (Table 9-3) and obtained an R 2 =0.32. The interaction of age and gender did not improve fit considerably despite being ranked similarly as the Gender + Age + Site model. Based on the highest ranking model (Gender +Age + Site; Table 9-3), probability of dispersal was associated only weakly with study area, more strongly with gender, and very obviously with age class. The Urban study area had the highest probability of dispersal, followed by the Fragmented site, and the lowest probability of dispersal was associated with the Agricultural study area (Fig. 9-7; Table 9-4). Confidence intervals of the estimates of dispersal for each study area suggest that the differences are tentative but the magnitude of the differences in the point estimates indicate possible biologically important differences. Juveniles had approximately a 30 times greater odds of dispersing than adults, and females were 1.5 times more likely to disperse than males (Table 9-4). Using the second highest ranking model (Site + Gender + Age + Age*Gender; Table 9-3), the patterns were upheld with the additional insight that there was some indication that female juveniles had a greater dispersal probability than that estimated by the individual effects of Gender and Age. There was however little confidence in the estimates of this interaction (β = ± 0.82), as the 95% confidence interval overlapping 0 and indicating no effect. For those owls for whom we recorded movements of >100 m, there was a broad range of distances moved. These varied primarily among age class and gender, with less variation among study areas than we had anticipated. Of the 10 models evaluated, there was overwhelming support for 2 models: Gender + Age, and Site + Gender + Age (Table 9-5). Approximately 29% of the variance was explained (R 2 ) by the highest ranking model, Site + Gender + Age model. There was only weak support for an effect of study area as estimated from the Site + Gender + Age model; the 95% confidence intervals for the site effects all overlapped 0, and the total contribution to explained variance was only 2.0%. Based on point estimates of the backtransformed regression coefficients for the Site + Gender + Age model, distances tended to be highest at the Fragmented site (1.2 [95% CI: ] times higher than Agricultural site) and equal at the Urban site compared to the Agricultural site (1.0 [95% CI: ]), consistent with the observed distances (Fig. 9-8). Although the Urban and Agricultural sites had similar estimated effects on log-transformed distance, the Urban area clearly had greater variation, and was the only site with observed distances >10 km (Fig. 9-8), possibly an artifact of the greater length of the study area (see Synthesis, Chapter XI). As with the probability of dispersal, age class was the factor most associated with distance, contributing 92.3% of the explained variation. Juveniles moved 3.35(95% CI: ) times greater distances than adults (log-transformed distance, β = 1.2 ± 0.10). Females moved 1.4 (95% CI: ) times greater distances than males (log-transformed distance, β = 0.34 ± 0.09), but gender only contributed 7.7% to the total
183 183 explained variation of the model. There was no support for an interaction between gender and age class, suggesting that the effects were additive; female juveniles had the greatest movements and those movements were estimated to be 4.7 times greater than those of an adult male. Table 9-3. Summary of model comparisons for dispersal probability estimated with logistic regression. The Grassland study area was excluded from these models. Data from 1996 through 2003 were included. Model Description k Deviance AICc w Null (intercept only) Gender Age Class Study Area Gender + Age Gender + Age + Site Gender + Age + Site + Gender*Age Year Gender + Age + Year Gender + Age + Site + Year Gender + Age + Site + Year + Site*Year
184 184 Table 9-4. Effects of factors associated with dispersal probability as estimated with logistic regression. The Grassland study area was excluded from these models. Data from 1996 through 2003 were included. The Gender + Age + Site model was used for the basis of inference. The estimates are relative to a reference variable: Study site (Agricultural), Gender (Male), and Age (Adult). Parameter Beta (SE) Odds Ratio Odds Ratio 95% CI Urban Site 0.42(0.34) Fragmented Site 0.42(0.18) Female 0.39(0.16) Juvenile 3.40 (0.34) Table 9-5. Summary of model comparisons for dispersal distance estimated with a generalized linear model structured as linear regression. The response variable, distance, was log-transformed prior to analysis. The Grassland study area was excluded. Data include years from 1996 through Model Description k Deviance AICc w Null (intercept only) Gender Age Class Study Area Gender + Age Gender + Age + Site Gender + Age + Site + Gender*Age Year Gender + Age + Year Gender + Age + Site + Year Gender + Age + Site + Year + Site*Year
185 185 FIGURE 9-7. Proportion of Burrowing Owls that dispersed (nests located 100 m between years) in three study areas during Numbers above bars are the number of owls that were included in the analysis and represent both those owls that dispersed and those that did not. The total sample size was 869 movements from 488 different owls. The Grassland site is not included due to inadequate data. FIGURE 9-8. Distribution of distances moved between years for Burrowing Owls that dispersed (nests located 100 m between years) in three study areas during Numbers below the box plots are the sample size. The total sample size was 401 movements from 315 different owls. The median (solid line through the box), mean (dotted line through the box), 25 th 75 th percentile (shaded box) and the 10 th -90 th percentile (bars), and outliers are illustrated on each box. The Grassland site was excluded due to inadequate data.
186 Movements Outside Study Areas 186 In 2000, an adult female first banded as a nestling in 1999 at the Fragmented site was recaptured at the Grassland site. The data were re-checked several times to confirm this long distance dispersal. All of the evidence was confirmatory. This owl thus had a natal dispersal distance of 130 km. The area covered within a 130 km radius is approximately 53,000 km 2 and thus the Grassland site represents less than 2% of the area covered by the distance the owl dispersed. We do not know how much of this area is suitable habitat for Burrowing Owls. Such long distance movements may be much more common than assumed as the likelihood of detection following movements of this magnitude is so small. FIGURE 9-9. Movements of Burrowing Owls into and out of the Urban study area during We observed a total of 8 owls that moved between the study area and the surrounding area. Natal dispersal movements are shown in green lines and adult breeding dispersal in yellow lines. The triangle (adult) and the hexagon (juveniles) is indicates the initial observation prior to movement. In the Urban study area, there were a total of 8 owls that we observed to have moved from or to the study area between consecutive years and for which nest locations were known. Three of these were adults and 5 were chicks (Fig. 9-9). Two of the adults were banded outside the study area and re-observed within the study area, having moved 1.6 and 3.0 km, similar to the dispersal distances observed within the study area. The third adult was banded within the study area and moved 851 m to the outside border of the study area. Four of the 5 juveniles moved an average of 10.7 km (range: km) from the San Jose Airport, where juveniles have been banded prior to the study (J. Barclay, pers. commun.). One juvenile moved from the study area to just outside of the border (1.7 km; Fig. 9-9).
187 X. Nest Habitat Selection at the Grassland Study Area 187 Summary Habitat characteristics associated with nest site selection is an important aspect of wildlife management because it is the vegetation and other factors that managers can often modify to benefit a species, as well as to guide minimize compromising the favored habitat during other management activities. In this chapter, we evaluate the habitat characteristics at two levels of detail: ground-based measurements of vegetation and availability of burrows, and the less detailed but more broadly available analysis of vegetation types. In general, we found suddle differences in nest site selection from ground-based measurements comparing nest to random sites and at the less detailed analysis of vegetation type, we found overwhelming selection for Grassland rather than almost equally available Scrub vegetation types. Key findings from this analysis are selection for sites with greater number of large-diameter burrows, burrows near vegetation that acts as a short perch, and locations within the grassland vegetation type. Future analyses will investigate selection of specific types of grasslands that are available within the Grassland study area. We explored factors associated with nest site selection of Burrowing Owls at the Grassland study area by comparing nest sites with random locations. We use both detailed ground-based measurements and vegetation type that was derived from a broader analysis of vegetation in the San Joaquin Valley. Field and Statistical Methods Nest Site Characteristics A thorough investigation of nest site characteristics was conducted in the Grassland site in 1999 and A detailed description of the field methods is described in Chapter IV and is taken from Ronan (2002). Briefly, we used a paired and unpaired burrow approach to examine habitat characteristics between nests and unoccupied burrows nearby. Unoccupied (paired) burrows were located based on the criteria that they were the closest intact, unoccupied burrow with an opening of at least 10 cm diameter that lay beyond a 100 m radius of the nest burrow. We used the first suitable burrow found along a random compass bearing. At both nest and random burrows, we measured habitat characteristics (see Chapter IV for details). To understand habitat factors associated with a nest site at a scale larger than the immediate area, we measured habitat characteristics at Burrowing Owl nests and unoccupied, random burrows. To locate random burrows, we generated a list of random points that were within 500 m of either side of call survey transect roads. We located the nearest intact burrow
188 188 with a diameter of 10 cm within 50 m from the random point and measured habitat characteristics as described previously. If a burrow was not found then habitat characteristics were not measured. Ronan (2002) developed a suite of 15 a priori models to examine the influence of habitat characteristics on nest site selection. The following methods are from Ronan (2002) After assessing multi-collinearity, mulch density, the number of satellites within 50 m of the nest (satellites), the number of perches within 50 m of the nest (perches), and the diameter of the nest or the randomly selected burrow were included in analyses of nest site characteristics. Vegetation density and satellite burrow availability may interact to affect predation rates, therefore we included this interaction term in analyses. We used the mean values of the habitat variables for each sampling distance (5m and 20 m) and analyzed the distances separately. We compared habitat variables between nests and unoccupied burrows in the local vicinity of nests for the paired burrows using 1:1 matched-pairs logistic regression because nests and unoccupied burrows were spatially correlated and therefore lacked independence (Hosmer and Lemeshow 1989). Each nest and unoccupied burrow pair represented 1 sample. The response variable was set equal to 1 and the explanatory variables were the mean differences between the paired observations for each habitat variable at each sampling distance (5 m and 20 m). We fitted the logistic regression model using PROC LOGISTIC with the no intercept option (SAS 2001). For the comparison of nests and unoccupied random burrows within the study area (unpaired burrows), we used logistic regression (PROC LOGISTIC; SAS 2001). The response variable was coded as 1 if a burrow was a nest and 0 if it was a random burrow and the explanatory variables were the mean habitat variable values for each sampling distance. The logistic regression model described the probability that a burrow was a nest as a function of the explanatory variables. Point and Buffer Analysis with GIS Vegetation Data We used the GIS vegetation layer and pooled vegetation types described in Chapter VI to estimate selection of vegetation type at the scale of the nest location and a 100 m area surrounding the nest that often includes the satellite burrows (reviewed in Chapter VI). We generated 100 random points throughout the study area that fell within the maximum distance from the survey road that nests were located (1070 m), and we excluded points that fell within the woodland vegetation type and wetland environments, such as Soda Lake, as they were obviously not suitable nest habitat. Random points that had >20% of the 100 m buffer classified as lake or not sampled were also omitted from analyses. These were conditions that existed for the estimates of the vegetation surrounding nest sites. Approximately 3.3% of the area within 1070 m of the roads we used to survey Burrowing Owls was not sampled during the vegetation classification by BLM (Chapter VI); nest and random points that fell within these non-sampled areas were omitted from the analysis. We evaluated nest selection as the comparison of vegetation types and percent grassland habitat surrounding nests versus random locations. Because the probability of detecting nests decreased with distance from the survey roads (Chapter VI), we included the distance from the road as a covariate. We used logistic regression
189 189 to explore several models estimating the probability of a location being a nest site vs a random location on the landscape. The explanatory variables we considered included distance from the survey road and either a point being the grassland vegetation type or the percent of grassland within the 100 m radius surrounding the nest or random point.
190 Results 190 Nest Site Characteristics Paired Burrows-- In 1999, we sampled habitat characteristics at 31 burrowing owl nests and 31 paired, unoccupied burrows. Mulch density, vegetation density at 10 cm, and effective height of the vegetation were correlated (tolerance = 0.3, 0.2, 0.3, respectively). These variables show a correlation because mulch is the accumulation of dead vegetation such that greater vegetation density and height contribute to greater mulch density. Of these, we retained mulch density for analysis. At 5 m from the burrow, greater burrow diameter best distinguished nest sites from unoccupied sites (Table 10-1), with the odds of a burrow being a nest increasing by 67% per cm of diameter of opening (Table 10-2). At 20 m from the burrow, the global model was the best approximating model (Table 10-1), yet the best and competing models showed poor precision of estimates of the odds ratios (Table 10-2). For both 5 m and 20 m, model selection results provided evidence that nest burrows had a lower mean mulch density, a greater mean burrow diameter, more satellite burrows, and fewer perches compared with unoccupied burrows (Table 10-3). Unpaired Burrows-- In 2000, we sampled habitat characteristics at 33 burrowing owl nests and 32 random burrows. For both 5 m and 20 m distances from the burrow entrances, the global model was selected as the best approximating model (Table 10-1). The probability that a burrow was a nest increased as burrow diameter, satellite burrows and perches increased (Table 10-2), though the influence of perches on nest selection was inconclusive due to the large standard error for the parameter estimates. Likewise, the influence of mulch density on nest selection was inconclusive due to imprecise estimates; this was similar for the interaction of mulch density and satellite burrows as well. The mean values for habitat characteristics were generally consistent with the model selection results. Nests had lower mulch density, greater burrow diameter, more than 2 times the number of satellite burrows, and a similar number of perches compared with random burrows (Table 10-3). Point and Buffer Analysis with GIS Vegetation Data The analysis of vegetation types within 100 m of the entrance at nests versus random burrows was based on 103 nests and100 random burrows. The number of nests was spread almost equally among years (38, 31, and 40 in 1997, 1998, and 1999, respectively). All of the nests were located within 1070 m of the road, and thus we used this distance as the maximum distance for random points from the road as well. Most nests were very close to the road, with similar patterns among years whereas random points were evenly distributed throughout the area (Fig. 10-2). Grassland vegetation was closest to the road, as estimated from the random points.

191 191 We therefore included distance as a variable in the models to estimate habitat selection of the vegetation types in order to control for this pattern. Owls clearly selected grassland vegetation cover for nesting. Within 1170 m of the survey road network there was a total of 39,440 ha, the majority of which was classified as Grassland (24,008 ha, 63.4%) and a large proportion was classified as Scrub (11337, 28.7%). The remaining areas included woodland (1.1%), Lake (3.4%) and areas not sampled (3.3%). The random points estimated the areas sampled well, given that points considered non-habitat (woodland and lake) and non-sampled areas were excluded from analysis. Nests were more often located in grassland than scrub than expected by chance: 98 of 103 (95.1%) nests compared to 69 (69.0%) random points. The remainder of the nests were located in scrub (n=5, 4.9%; Fig. 10-3), in which 31.0% of the random points were located. FIGURE Grassland study area with the network of survey roads and the vegetation type shown within 1170m, the furthest distance Burrowing Owl nests were located during
BURROWING OWL NESTING SUCCESS AT URBAN AND PARKLAND SITES IN NORTHERN CALIFORNIA
 California Burrowing Owl Symposium 1-15 BURROWING OWL NESTING SUCCESS AT URBAN AND PARKLAND SITES IN NORTHERN CALIFORNIA LYNNE A. TRULIO Department of Environmental Studies One Washington Square, San Jose
Post-Breeding Dispersal of Burrowing Owls in an Extensive California Grassland
 Am. Midl. Nat. 155:162 167 Post-Breeding Dispersal of Burrowing Owls in an Extensive California Grassland JEFF R. ROSIER AND NOELLE A. RONAN Department of Fisheries and Wildlife, Oregon State University,
An Updated Management Plan For The Burrowing Owl Population At Naval Air Station Lemoore Lemoore, California
 An Updated Management Plan For The Burrowing Owl Population At Naval Air Station Lemoore Lemoore, California An Updated Adaptive Management Plan For The Burrowing Owl Population At Naval Air Station, Lemoore
An Adaptive Management Plan For The Burrowing Owl Population At Naval Air Station Lemoore Lemoore, California
 N68711-96LT-60008 An Adaptive Management Plan For The Burrowing Owl Population At Naval Air Station Lemoore Lemoore, California August 1998 Prepared for: US Navy, Engineering Field Activity West 900 Commodore
Response of Burrowing Owls to Experimental Removal of Satellite Burrows
 The Journal of Wildlife Management 78(6):1115 1119; 2014; DOI: 10.1002/jwmg.742 Note Response of Burrowing Owls to Experimental Removal of Satellite Burrows NOELLE A. RONAN, 1 Department of Fisheries and
Raptor Ecology in the Thunder Basin of Northeast Wyoming
 Raptor Ecology in the Thunder Basin Northeast Wyoming 121 Kort Clayton Thunderbird Wildlife Consulting, Inc. My presentation today will hopefully provide a fairly general overview the taxonomy and natural
Gambel s Quail Callipepla gambelii
 Photo by Amy Leist Habitat Use Profile Habitats Used in Nevada Mesquite-Acacia Mojave Lowland Riparian Springs Agriculture Key Habitat Parameters Plant Composition Mesquite, acacia, salt cedar, willow,
GREATER SAGE-GROUSE BROOD-REARING HABITAT MANIPULATION IN MOUNTAIN BIG SAGEBRUSH, USE OF TREATMENTS, AND REPRODUCTIVE ECOLOGY ON PARKER MOUNTAIN, UTAH
 GREATER SAGE-GROUSE BROOD-REARING HABITAT MANIPULATION IN MOUNTAIN BIG SAGEBRUSH, USE OF TREATMENTS, AND REPRODUCTIVE ECOLOGY ON PARKER MOUNTAIN, UTAH Abstract We used an experimental design to treat greater
Slide 1. Slide 2. Slide 3 Population Size 450. Slide 4
 Slide 1 Slide 2 The science behind management of game birds, predators, and landscapes of the Midwest: the ups and downs of pheasant populations William R. Clark Iowa State University Iowa DNR, DU- IWWR,
Surveys for Giant Garter Snakes in Solano County: 2005 Report
 Surveys for Giant Garter Snakes in Solano County: 2005 Report By Glenn D. Wylie 1 and Lisa L. Martin November 2005 U.S. GEOLOGICAL SURVEY WESTERN ECOLOGICAL RESEARCH CENTER Prepared for: The Solano County
A.13 BLAINVILLE S HORNED LIZARD (PHRYNOSOMA BLAINVILLII)
") A. BLAINVILLE S HORNED LIZARD (PHRYNOSOMA BLAINVILLII) A.. Legal and Other Status Blainville s horned lizard is designated as a Department of Fish and Game (DFG) Species of Concern. A.. Species Distribution
A. BLAINVILLE S HORNED LIZARD (PHRYNOSOMA BLAINVILLII) A.. Legal and Other Status Blainville s horned lizard is designated as a Department of Fish and Game (DFG) Species of Concern. A.. Species Distribution
Iguana Technical Assistance Workshop. Presented by: Florida Fish and Wildlife Conservation Commission
 Iguana Technical Assistance Workshop Presented by: Florida Fish and Wildlife Conservation Commission 1 Florida Fish and Wildlife Conservation Commission Protects and manages 575 species of wildlife 700
A.13 BLAINVILLE S HORNED LIZARD (PHRYNOSOMA BLAINVILLII)
") A. BLAINVILLE S HORNED LIZARD (PHRYNOSOMA BLAINVILLII) A.. Legal and Other Status Blainville s horned lizard is designated as a Department of Fish and Game (DFG) Species of Concern. A.. Species Distribution
A. BLAINVILLE S HORNED LIZARD (PHRYNOSOMA BLAINVILLII) A.. Legal and Other Status Blainville s horned lizard is designated as a Department of Fish and Game (DFG) Species of Concern. A.. Species Distribution
Pygmy Rabbit (Brachylagus idahoensis)
") Pygmy Rabbit (Brachylagus idahoensis) Conservation Status: Near Threatened. FIELD GUIDE TO NORTH AMERICAN MAMMALS Pygmy Rabbits dig extensive burrow systems, which are also used by other animals. Loss
Pygmy Rabbit (Brachylagus idahoensis) Conservation Status: Near Threatened. FIELD GUIDE TO NORTH AMERICAN MAMMALS Pygmy Rabbits dig extensive burrow systems, which are also used by other animals. Loss
Swainson s Hawk (Buteo swainsoni)
") Swainson s Hawk (Buteo swainsoni) Status State: Threatened Federal: None Population Trend Global: Declining State: Declining Within Inventory Area: Unknown Data Characterization The location database for
Swainson s Hawk (Buteo swainsoni) Status State: Threatened Federal: None Population Trend Global: Declining State: Declining Within Inventory Area: Unknown Data Characterization The location database for
Ames, IA Ames, IA (515)
") BENEFITS OF A CONSERVATION BUFFER-BASED CONSERVATION MANAGEMENT SYSTEM FOR NORTHERN BOBWHITE AND GRASSLAND SONGBIRDS IN AN INTENSIVE PRODUCTION AGRICULTURAL LANDSCAPE IN THE LOWER MISSISSIPPI ALLUVIAL
BENEFITS OF A CONSERVATION BUFFER-BASED CONSERVATION MANAGEMENT SYSTEM FOR NORTHERN BOBWHITE AND GRASSLAND SONGBIRDS IN AN INTENSIVE PRODUCTION AGRICULTURAL LANDSCAPE IN THE LOWER MISSISSIPPI ALLUVIAL
Great Horned Owl (Bubo virginianus) Productivity and Home Range Characteristics in a Shortgrass Prairie. Rosemary A. Frank and R.
 Productivity and Home Range Characteristics in a Shortgrass Prairie. Rosemary A. Frank and R.") Great Horned Owl (Bubo virginianus) Productivity and Home Range Characteristics in a Shortgrass Prairie Rosemary A. Frank and R. Scott Lutz 1 Abstract. We studied movements and breeding success of resident
Great Horned Owl (Bubo virginianus) Productivity and Home Range Characteristics in a Shortgrass Prairie Rosemary A. Frank and R. Scott Lutz 1 Abstract. We studied movements and breeding success of resident
Basin Wildlife. Giant Garter Snake
 Basin Wildlife The multiple-species program of the NBHCP addresses a total of 26 wetland and up land plant and animal species. The giant garter snake and Swainson s hawk are its primary focus. Giant Garter
Moorhead, Minnesota. Photo Credit: FEMA, Evaluating Losses Avoided Through Acquisition: Moorhead, MN
 Moorhead, Minnesota Photo Credit: FEMA, 2010. Evaluating Losses Avoided Through Acquisition: Moorhead, MN Background Moorhead is a midsize city (pop. 38,065) in Clay County, Minnesota. The largest city
Vulnerability Assessment Summary
 Climate Change Vulnerability Assessment (January 2017 version) Blunt-nosed Leopard Lizard Vulnerability Assessment Summary Overall Vulnerability Score and Components: Vulnerability Component Sensitivity
University of Canberra. This thesis is available in print format from the University of Canberra Library.
 University of Canberra This thesis is available in print format from the University of Canberra Library. If you are the author of this thesis and wish to have the whole thesis loaded here, please contact
EXECUTIVE SUMMARY FOR A PRESENCE/ ABSENCE SURVEY FOR THE DESERT TORTOISE (Gopherus agassizii),
,") C.5 Desert Tortoise EXECUTIVE SUMMARY FOR A PRESENCE/ ABSENCE SURVEY FOR THE DESERT TORTOISE (Gopherus agassizii), on the proposed Alta Oak Creek Mojave Wind Generation Project near Mojave, Kern County,
C.5 Desert Tortoise EXECUTIVE SUMMARY FOR A PRESENCE/ ABSENCE SURVEY FOR THE DESERT TORTOISE (Gopherus agassizii), on the proposed Alta Oak Creek Mojave Wind Generation Project near Mojave, Kern County,
BOBWHITE QUAIL HABITAT EVALUATION
 BOBWHITE QUAIL HABITAT EVALUATION Introduction The Northern Bobwhite Quail (Colinus virginianus) is the most well known and popular upland game bird in Oklahoma. The bobwhite occurs statewide and its numbers
EIDER JOURNEY It s Summer Time for Eiders On the Breeding Ground
 The only location where Steller s eiders are still known to regularly nest in North America is in the vicinity of Barrow, Alaska (Figure 1). Figure 1. Current and historic Steller s eider nesting habitat.
Removal of Alaskan Bald Eagles for Translocation to Other States Michael J. Jacobson U.S Fish and Wildlife Service, Juneau, AK
 Removal of Alaskan Bald Eagles for Translocation to Other States Michael J. Jacobson U.S Fish and Wildlife Service, Juneau, AK Bald Eagles (Haliaeetus leucocephalus) were first captured and relocated from
Swainson s Hawk (Buteo swainsoni)
") Swainson s Hawk (Buteo swainsoni) Status State: Threatened Federal: None Population Trend Global: Declining State: Declining Within Inventory Area: Unknown Data Characterization The location database for
Swainson s Hawk (Buteo swainsoni) Status State: Threatened Federal: None Population Trend Global: Declining State: Declining Within Inventory Area: Unknown Data Characterization The location database for
Managing Uplands with Keystone Species. The Case of the Gopher tortoise (Gopherus polyphemus)
") Managing Uplands with Keystone Species The Case of the Gopher tortoise (Gopherus polyphemus) Biology Question: Why consider the gopher tortoise for conservation to begin with? Answer: The gopher tortoise
Managing Uplands with Keystone Species The Case of the Gopher tortoise (Gopherus polyphemus) Biology Question: Why consider the gopher tortoise for conservation to begin with? Answer: The gopher tortoise
Physical Description Meadow voles are small rodents with legs and tails, bodies, and ears.
 A Guide to Meadow Voles Identification, Biology and Control Methods Identification There are 5 species of Meadow Vole common to California. They are the California Vole, Long-tailed Vole, Creeping Vole,
Research Summary: Evaluation of Northern Bobwhite and Scaled Quail in Western Oklahoma
 P-1054 Research Summary: Evaluation of Northern Bobwhite and Scaled Quail in Western Oklahoma Oklahoma Agricultural Experiment Station Division of Agricultural Sciences and Natural Resources Oklahoma State
FALL 2015 BLACK-FOOTED FERRET SURVEY LOGAN COUNTY, KANSAS DAN MULHERN; U.S. FISH AND WILDLIFE SERVICE
 INTRODUCTION FALL 2015 BLACK-FOOTED FERRET SURVEY LOGAN COUNTY, KANSAS DAN MULHERN; U.S. FISH AND WILDLIFE SERVICE As part of ongoing efforts to monitor the status of reintroduced endangered black-footed
MAMMAL SPECIES SEEN AT SCOTTSDALE COMMUNITY COLLEGE INDEX OF 14 SPECIES
 MAMMAL SPECIES SEEN AT SCOTTSDALE COMMUNITY COLLEGE INDEX OF 14 SPECIES References at end. Text written by staff. Photos by Roy Barnes, Emma Olsen and Dr. John Weser. Bailey's Pocket Mouse Black-tailed
State birds. A comparison of the Northern Mockingbird and the Western Meadowlark. By Shaden Jensen
 State birds A comparison of the Northern Mockingbird and the Western Meadowlark By Shaden Jensen Western Meadowlark! Similar to the Eastern Meadowlark in appearance, this bird can be recognized by its
What is the date at which most chicks would have been expected to fledge?
 CURLEW FAQs FACTS AND FIGURES AND ADVICE FOR THOSE WANTING TO HELP SUPPORT NESTING CURLEW ON THEIR LAND The Eurasian Curlew or, Numenius arquata, spends much of the year on coasts or estuaries, but migrates
Texas Quail Index. Result Demonstration Report 2016
 Texas Quail Index Result Demonstration Report 2016 Cooperators: Jerry Coplen, County Extension Agent for Knox County Amanda Gobeli, Extension Associate Dr. Dale Rollins, Statewide Coordinator Circle Bar
Everglades Invasive Reptile and Amphibian Monitoring Program 1
 WEC386 Everglades Invasive Reptile and Amphibian Monitoring Program 1 Rebecca G. Harvey, Mike Rochford, Jennifer Ketterlin, Edward Metzger III, Jennifer Nestler, and Frank J. Mazzotti 2 Introduction South
Woodcock: Your Essential Brief
 Woodcock: Your Essential Brief Q: Is the global estimate of woodcock 1 falling? A: No. The global population of 10-26 million 2 individuals is considered stable 3. Q: Are the woodcock that migrate here
The Greater Sage-grouse: Life History, Distribution, Status and Conservation in Nevada. Governor s Stakeholder Update Meeting January 18 th, 2012
 The Greater Sage-grouse: Life History, Distribution, Status and Conservation in Nevada Governor s Stakeholder Update Meeting January 18 th, 2012 The Bird Largest grouse in North America and are dimorphic
Subject: Preliminary Draft Technical Memorandum Number Silver Lake Waterfowl Survey
 12 July 2002 Planning and Resource Management for Our Communities and the Environment Scott E. Shewbridge, Ph.D., P.E., G.E. Senior Engineer - Hydroelectric Eldorado Irrigation District 2890 Mosquito Road
SCHEDULE ACKNOWLEDGEMENTS WEB SITE DOCUMENTS. Grey Hayes Elkhorn Slough Coastal Training Program. Dana Bland Granite Rock Sand Plant IMPORTANT POINTS
 CALIFORNIA RED-LEGGED FROG WORKSHOP ACKNOWLEDGEMENTS California Department of Transportation U. S. Fish and Wildlife Service U. S. Geological Survey Norman Scott & Galen Rathbun California State Parks
ROGER IRWIN. 4 May/June 2014
 BASHFUL BLANDING S ROGER IRWIN 4 May/June 2014 4 May/June 2014 NEW HAMPSHIRE PROVIDES REGIONALLY IMPORTANT HABITAT FOR THE STATE- ENDANGERED BLANDING'S TURTLE BY MIKE MARCHAND A s a child, I loved to explore
Home Range, Habitat Use, Feeding Ecology and Reproductive Biology of the Cuban Boa (Chilabothrus angulifer) at Naval Station Guantánamo Bay, Cuba
 at Naval Station Guantánamo Bay, Cuba") Home Range, Habitat Use, Feeding Ecology and Reproductive Biology of the Cuban Boa (Chilabothrus angulifer) at Naval Station Guantánamo Bay, Cuba Dr. Peter J. Tolson - Department of Conservation and Research,
Home Range, Habitat Use, Feeding Ecology and Reproductive Biology of the Cuban Boa (Chilabothrus angulifer) at Naval Station Guantánamo Bay, Cuba Dr. Peter J. Tolson - Department of Conservation and Research,
COUNTY OF ALBEMARLE STAFF REPORT SUMMARY
 COUNTY OF ALBEMARLE STAFF REPORT SUMMARY Project Name: SP201000008 The Canine Clipper Dog Grooming and Boarding Planning Commission Public Hearing: July 27, 2010 Owner: Amy Peloquin Acreage: 6.126 Staff:
SOSSAMAN CLOUD PARK. Site Conditions
 SOSSAMAN CLOUD PARK distant views of the Superstition Mountains to the northeast. A series of dirt roads are visible throughout the site and trash and debris from local neighborhoods are present. A graded
May Dear Blunt-nosed Leopard Lizard Surveyor,
 May 2004 Dear Blunt-nosed Leopard Lizard Surveyor, Attached is the revised survey methodology for the blunt-nosed leopard lizard (Gambelia sila). The protocol was developed by the San Joaquin Valley Southern
12 The Pest Status and Biology of the Red-billed Quelea in the Bergville-Winterton Area of South Africa
 Workshop on Research Priorities for Migrant Pests of Agriculture in Southern Africa, Plant Protection Research Institute, Pretoria, South Africa, 24 26 March 1999. R. A. Cheke, L. J. Rosenberg and M. E.
APPENDIX F. General Survey Methods for Covered Species
 APPENDIX F General Survey Methods for Covered Species APPENDIX F General Survey Methods for Covered Species As described in Chapter 4, the Imperial Irrigation District (IID) will conduct baseline surveys
Steps Towards a Blanding s Turtle Recovery Plan in Illinois: status assessment and management
 Steps Towards a Blanding s Turtle Recovery Plan in Illinois: status assessment and management Daniel R. Ludwig, Illinois Department of Natural Resources 1855 - abundant 1922 - common in Chicago area 1937
Federal: Birds of Conservation Concern (BCC) for U.S. Fish and Wildlife Service (USFWS) Region 1; protected under the Migratory Bird Treaty Act.
 for U.S. Fish and Wildlife Service (USFWS) Region 1; protected under the Migratory Bird Treaty Act.") Legal Status State: Threatened Federal: Birds of Conservation Concern (BCC) for U.S. Fish and Wildlife Service (USFWS) Region 1; protected under the Migratory Bird Treaty Act. Critical Habitat: No critical
Legal Status State: Threatened Federal: Birds of Conservation Concern (BCC) for U.S. Fish and Wildlife Service (USFWS) Region 1; protected under the Migratory Bird Treaty Act. Critical Habitat: No critical
Sheikh Muhammad Abdur Rashid Population ecology and management of Water Monitors, Varanus salvator (Laurenti 1768) at Sungei Buloh Wetland Reserve,
 at Sungei Buloh Wetland Reserve,") Author Title Institute Sheikh Muhammad Abdur Rashid Population ecology and management of Water Monitors, Varanus salvator (Laurenti 1768) at Sungei Buloh Wetland Reserve, Singapore Thesis (Ph.D.) National
Author Title Institute Sheikh Muhammad Abdur Rashid Population ecology and management of Water Monitors, Varanus salvator (Laurenti 1768) at Sungei Buloh Wetland Reserve, Singapore Thesis (Ph.D.) National
Nesting Swainson s Hawks (Buteo swainsoni) in the Natomas Basin Habitat Conservation Plan Area 2003 Annual Survey Results
 in the Natomas Basin Habitat Conservation Plan Area 2003 Annual Survey Results") Nesting Swainson s Hawks (Buteo swainsoni) in the Natomas Basin Habitat Conservation Plan Area 2003 Annual Survey Results Public Document September 2003 Nesting Swainson s Hawks (Buteo swainsoni) in the
Nesting Swainson s Hawks (Buteo swainsoni) in the Natomas Basin Habitat Conservation Plan Area 2003 Annual Survey Results Public Document September 2003 Nesting Swainson s Hawks (Buteo swainsoni) in the
Trilateral Committee Meeting May 16-19, 2016 Ottawa, Ontario, Canada. Sonoran Pronghorn Recovery Update
 Trilateral Committee Meeting May 16-19, 2016 Ottawa, Ontario, Canada Sonoran Pronghorn Recovery Update Binational Cooperators Arizona Game and Fish Department FWS - Cabeza Prieta National Wildlife Refuge
GeesePeace a model program for Communities
 GeesePeace a model program for Communities Canada geese and other wildlife live within or at the fringe of our landscapes and communities which sometimes places them in conflict with us. Our challenge
Red-Tailed Hawk Buteo jamaicensis
 Red-Tailed Hawk Buteo jamaicensis This large, dark headed, broad-shouldered hawk is one of the most common and widespread hawks in North America. The Red-tailed hawk belongs to the genus (family) Buteo,
Post-Release Success of Captive Bred Louisiana Pine Snakes
 Post-Release Success of Captive Bred Louisiana Pine Snakes The Louisiana pine snake (Pituophis ruthveni) Most endangered reptile in the U.S. 1 st and only SSP for a U.S. reptile Only 6% of SSP s are for
Investigations of Giant Garter Snakes in The Natomas Basin: 2002 Field Season
 Investigations of Giant Garter Snakes in The Natomas Basin: 2002 Field Season Investigations of Giant Garter Snakes in The Natomas Basin: 2002 Field Season By Glenn D. Wylie and Lisa L. Martin U.S. GEOLOGICAL
IMPORTANT PLANT SPECIES FOR QUAIL AND CATTLE IN SOUTH FLORIDA
 IMPORTANT PLANT SPECIES FOR QUAIL AND CATTLE IN SOUTH FLORIDA James A. Martin Graduate Research Assistant Tall Timbers Research Station and University of Georgia Bobwhite quail are one of the widest ranging
Title of Project: Distribution of the Collared Lizard, Crotophytus collaris, in the Arkansas River Valley and Ouachita Mountains
 Title of Project: Distribution of the Collared Lizard, Crotophytus collaris, in the Arkansas River Valley and Ouachita Mountains Project Summary: This project will seek to monitor the status of Collared
HUMAN-COYOTE INCIDENT REPORT CHICAGO, IL. April 2014
 HUMAN-COYOTE INCIDENT REPORT CHICAGO, IL April 2014 By: Stan Gehrt, Ph.D., Associate Professor School of Environment and Natural Resources The Ohio State University And Chair, Center for Wildlife Research
Critical Habitat: No critical habitat has been designated for this species.
 Legal Status State: Endangered, Fully Protected Federal: Endangered Critical Habitat: No critical habitat has been designated for this species. Recovery Planning: Recovery Plan for Upland Species of the
Texas Quail Index. Result Demonstration Report 2016
 Texas Quail Index Result Demonstration Report 2016 Cooperators: Josh Kouns, County Extension Agent for Baylor County Amanda Gobeli, Extension Associate Dr. Dale Rollins, Statewide Coordinator Bill Whitley,
TEXAS WILDLIFE JULY 2016 STUDYING THE LIONS OF WEST TEXAS. Photo by Jeff Parker/Explore in Focus.com
 Photo by Jeff Parker/Explore in Focus.com Studies show that apex predators, such as mountain lions, play a role in preserving biodiversity through top-down regulation of other species. 8 STUDYING THE LIONS
SPECIES ASSESSMENT FOR WESTERN BURROWING OWL (ATHENE CUNICULARIA HYPUGAEA) IN WYOMING
 IN WYOMING") SPECIES ASSESSMENT FOR WESTERN BURROWING OWL (ATHENE CUNICULARIA HYPUGAEA) IN WYOMING prepared by SARAH J. LANTZ 1, HAMILTON SMITH 2 AND DOUGLAS A. KEINATH 3 1 Research Assistant, Wyoming Cooperative Fish
SPECIES ASSESSMENT FOR WESTERN BURROWING OWL (ATHENE CUNICULARIA HYPUGAEA) IN WYOMING prepared by SARAH J. LANTZ 1, HAMILTON SMITH 2 AND DOUGLAS A. KEINATH 3 1 Research Assistant, Wyoming Cooperative Fish
Altona Mosquito Control Policy 2016
 TOWN OF ALTONA MOSQUITO CONTROL POLICY The Town of Altona Public Works and Parks Departments recognize their important role in controlling the adult mosquito population within the limits of the Town of
WILD HORSES AND BURROS
 III.17 WILD HORSES AND BURROS This chapter presents the environmental setting and affected environment for the Desert Renewable Energy Conservation Plan (DRECP or Plan) for wild horses and burros. It describes
2014 BOBCAT MANAGEMENT GUIDELINES
 2014 BOBCAT MANAGEMENT GUIDELINES KIAWAH ISLAND, SOUTH CAROLINA Town of Kiawah Island 21 Beachwalker Drive Kiawah Island, SC 29455 843-768-9166 Originally published August 12, 2008 First revision March
Andros Iguana Education Kit Checklist
 Andros Iguana Education Kit Checklist Activity A: Where Have All the Iguanas Gone? Activity Sheets Envelope Activity Instructions Sheet Iguana Habitat Master Copy Threat Coverage 30%/70% Master Copy Threat
ECOLOGY OF ISOLATED INHABITING THE WILDCAT KNOLLS AND HORN
 ECOLOGY OF ISOLATED GREATER SAGE GROUSE GROUSE POPULATIONS INHABITING THE WILDCAT KNOLLS AND HORN MOUNTAIN, SOUTHCENTRAL UTAH by Christopher J. Perkins Committee: Dr. Terry Messmer, Dr. Frank Howe, and
Water vole survey on Laughton Level via Mill Farm
 Water vole survey on Laughton Level via Mill Farm Grid reference: TQ 4911 Mill Farm, Ripe, East Sussex November 2008 Hetty Wakeford Ecologist Sussex Ecology Introduction The Ecologist undertook a water
Striped Skunk Updated: April 8, 2018
 Striped Skunk Updated: April 8, 2018 Interpretation Guide Status Danger Threats Population Distribution Habitat Diet Size Longevity Social Family Units Reproduction Our Animals Scientific Name Least Concern
SPECIES AT RISK IN ALBERTA. Children s Activity Booklet
 SPECIES AT RISK IN ALBERTA Children s Activity Booklet Table of Contents You Where you live A duck and where it lives Animals and Plants Species at Risk, Habitat & Threats Grizzly Bear Swift Fox Wood
BALD EAGLE NESTING IN RELATION TO HUMAN DISTURBANCE SOURCES IN THE LAKE ALMANOR REGION, CALIFORNIA
 BALD EAGLE NESTING IN RELATION TO HUMAN DISTURBANCE SOURCES IN THE LAKE ALMANOR REGION, CALIFORNIA DANIEL A. AIROLA, 1 Airola Environmental Consulting, 2700 6 th Avenue., Sacramento, CA, 95818, USA Abstract:
More panthers, more roadkills Florida panthers once ranged throughout the entire southeastern United States, from South Carolina
 Mark Lotz Florida Panther Biologist, Florida Fish & Wildlife Conservation Commission Darrell Land Florida Panther Team Leader, Florida Fish & Wildlife Conservation Commission Florida panther roadkills
by L. W. Oliphant and W. J.P. Thompson c/o Department of Veterinary Anatomy University of Saskatchewan Saskatoon, Saskatchewan S7N OWO
 RECENT BREEDING SUCCESS OF RICHARDSON'S MERLIN IN SASKATCHEWAN by L. W. Oliphant and W. J.P. Thompson c/o Department of Veterinary Anatomy University of Saskatchewan Saskatoon, Saskatchewan S7N OWO Abstract
ESRM 350 The Decline (and Fall?) of the White-tailed Jackrabbit
 of the White-tailed Jackrabbit") ESRM 350 The Decline (and Fall?) of the White-tailed Jackrabbit Autumn 2013 Outline (the 5 Components) (1) Background why leporids are such great study subjects (2) About white-tailed jackrabbits (3) The
ESRM 350 The Decline (and Fall?) of the White-tailed Jackrabbit Autumn 2013 Outline (the 5 Components) (1) Background why leporids are such great study subjects (2) About white-tailed jackrabbits (3) The
LEAST TERN AND PIPING PLOVER NEST MONITORING FINAL REPORT 2012
 The Central Nebraska Public Power and Irrigation District Holdrege, Nebraska LEAST TERN AND PIPING PLOVER NEST MONITORING FINAL REPORT 2012 NOVEMBER, 2012 Mark M. Peyton and Gabriel T. Wilson, Page 1:
The Effects of Meso-mammal Removal on Northern Bobwhite Populations
 The Effects of Meso-mammal Removal on Northern Bobwhite Populations Alexander L. Jackson William E. Palmer D. Clay Sisson Theron M. Terhune II John M. Yeiser James A. Martin Predation Predation is the
Mexican Gray Wolf Endangered Population Modeling in the Blue Range Wolf Recovery Area
 Mexican Gray Wolf Endangered Population Modeling in the Blue Range Wolf Recovery Area New Mexico Super Computing Challenge Final Report April 3, 2012 Team 61 Little Earth School Team Members: Busayo Bird
2012 Quail Season Outlook By Doug Schoeling, Upland Game Biologist Oklahoma Department of Wildlife Conservation
 2012 Quail Season Outlook By Doug Schoeling, Upland Game Biologist Oklahoma Department of Wildlife Conservation The Oklahoma Department of Wildlife Conservation has conducted annual roadside surveys in
November 6, Introduction
 TESTIMONY OF DAN ASHE, DEPUTY DIRECTOR, U.S. FISH AND WILDLIFE SERVICE, DEPARTMENT OF THE INTERIOR, BEFORE THE HOUSE JUDICIARY SUBCOMMITTEE ON CRIME, TERRORISM, AND HOMELAND SECURITY ON H.R. 2811, TO AMEND
Alberta Conservation Association 2009/10 Project Summary Report
 Alberta Conservation Association 2009/10 Project Summary Report Project Name: Habitat Selection by Pronghorn in Alberta Wildlife Program Manager: Doug Manzer Project Leader: Paul Jones Primary ACA staff
Coyote (Canis latrans)
") Coyote (Canis latrans) Coyotes are among the most adaptable mammals in North America. They have an enormous geographical distribution and can live in very diverse ecological settings, even successfully
Coyote (Canis latrans) Coyotes are among the most adaptable mammals in North America. They have an enormous geographical distribution and can live in very diverse ecological settings, even successfully
VANCOUVER ISLAND MARMOT
 VANCOUVER ISLAND MARMOT STATUS: CRITICALLY ENDANGERED The Vancouver Island marmot is one of the rarest mammals in the world and can be found only in the alpine meadows on Vancouver Island. By 2003, there
AN APPLIED CASE STUDY of the complexity of ecological systems and process: Why has Lyme disease become an epidemic in the northeastern U.S.
 AN APPLIED CASE STUDY of the complexity of ecological systems and process: Why has Lyme disease become an epidemic in the northeastern U.S. over the last few decades? What causes Lyme disease? 1 Frequency
An Invasive Species For more information: MyFWC.com/iguana
 An Invasive Species The green iguana (Iguana iguana) is a large lizard not native to Florida. Florida s subtropical climate has allowed these iguanas to thrive and reproduce in regions of the state where
RED-EARED SLIDER TURTLES AND THREATENED NATIVE RED-BELLIED TURTLES IN THE UPPER DELAWARE ESTUARY. Steven H. Pearson and Harold W.
 RESOURCE OVERLAP AND POTENTIAL COMPETITION BETWEEN INVASIVE RED-EARED SLIDER TURTLES AND THREATENED NATIVE RED-BELLIED TURTLES IN THE UPPER DELAWARE ESTUARY Steven H. Pearson and Harold W. Avery Six Most
Flat-tailed Horned Lizard (Phrynosoma mcallii)
") Flat-tailed Horned Lizard (Phrynosoma mcallii) Legal Status Taxonomy State: Species of Special Concern Federal: Bureau of Land Management Sensitive, U.S. Forest Service Sensitive Critical Habitat: N/A
Flat-tailed Horned Lizard (Phrynosoma mcallii) Legal Status Taxonomy State: Species of Special Concern Federal: Bureau of Land Management Sensitive, U.S. Forest Service Sensitive Critical Habitat: N/A
St. Clair Reservoir Rehabilitation: Proposed Changes to Sir Winston Churchill Park Dogs Off-Leash Area and Tennis Courts
 St. Clair Reservoir Rehabilitation: Proposed Changes to Sir Winston Churchill Park Dogs Off-Leash Area and Tennis Courts Public Drop-In Event December 11, 2018 6:30pm 8:30pm Timothy Eaton Memorial Church
PRELIMINARY EVALUATION OF THE IMPACT OF ROADS AND ASSOCIATED VEHICULAR TRAFFIC ON SNAKE POPULATIONS IN EASTERN TEXAS
 PRELIMINARY EVALUATION OF THE IMPACT OF ROADS AND ASSOCIATED VEHICULAR TRAFFIC ON SNAKE POPULATIONS IN EASTERN TEXAS D. Craig Rudolph, Shirley J. Burgdorf, Richard N. Conner, and Richard R. Schaefer, U.
Conserving Birds in North America
 Conserving Birds in North America BY ALINA TUGEND Sanderlings Andrew Smith November 2017 www.aza.org 27 Throughout the country, from California to Maryland, zoos and aquariums are quietly working behind
Geoffroy s Cat: Biodiversity Research Project
 Geoffroy s Cat: Biodiversity Research Project Viet Nguyen Conservation Biology BES 485 Geoffroy s Cat Geoffroy s Cat (Leopardus geoffroyi) are small, little known spotted wild cat found native to the central
Distribution, population dynamics, and habitat analyses of Collared Lizards
 Distribution, population dynamics, and habitat analyses of Collared Lizards The proposed project focuses on the distribution and population structure of the eastern collared lizards (Crotaphytus collaris
We are adult American. Field Marks. We are the smallest falcons in North America. Like other falcons, we have long, pointed wings,
 We are adult American Kestrels. Our scientific name is Falco sparverius. Field Marks We are the smallest falcons in North America. Like other falcons, we have long, pointed wings, long tails, and we flap
Alberta Conservation Association 2018/19 Project Summary Report. Project Name: Enchant Project Strong Farmlands. Thriving Habitat.
 Alberta Conservation Association 2018/19 Project Summary Report Project Name: Enchant Project Strong Farmlands. Thriving Habitat. Wildlife Program Manager: Doug Manzer Project Leader: Layne Seward Primary
Ciccaba virgata (Mottled Owl)
") Ciccaba virgata (Mottled Owl) Family: Strigidae (Typical Owls) Order: Strigiformes (Owls) Class: Aves (Birds) Fig. 1. Mottled owl, Ciccaba virgata. [http://www.owling.com/mottled13.htm, downloaded 12 November
Ciccaba virgata (Mottled Owl) Family: Strigidae (Typical Owls) Order: Strigiformes (Owls) Class: Aves (Birds) Fig. 1. Mottled owl, Ciccaba virgata. [http://www.owling.com/mottled13.htm, downloaded 12 November
Water Vole Translocation Project: Abberton ReservoirAbout Water Voles Population Dynamics
 Water Vole Translocation Project: Abberton ReservoirAbout Water Voles Measuring up to 24cm, water voles (Arvicola amphibius) are the largest of the British voles and at a quick glace, are often mistaken
Island Fox Update 2011
 ! page 1 of 5 The island fox offers a dramatic example of how people can come together to make a positive difference for an endangered species. In 1998, s were plummeting on four of the California Channel
Erin Maggiulli. Scientific Name (Genus species) Lepidochelys kempii. Characteristics & Traits
 Lepidochelys kempii. Characteristics & Traits") Endangered Species Common Name Scientific Name (Genus species) Characteristics & Traits (s) Kemp s Ridley Sea Turtle Lepidochelys kempii Triangular head w/ hooked beak, grayish green color. Around 100
Endangered Species Common Name Scientific Name (Genus species) Characteristics & Traits (s) Kemp s Ridley Sea Turtle Lepidochelys kempii Triangular head w/ hooked beak, grayish green color. Around 100
FIELD GUIDE TO NORTH AMERICAN MAMMALS Bailey's Pocket Mouse (Chaetodipus baileyi)
") Bailey's Pocket Mouse (Chaetodipus baileyi) Bailey's Pocket Mice are solitary, nocturnal, and live in burrows. Pocket Mice mostly eat seeds, using their "pockets," fur lined, external cheek pouches, to
Bailey's Pocket Mouse (Chaetodipus baileyi) Bailey's Pocket Mice are solitary, nocturnal, and live in burrows. Pocket Mice mostly eat seeds, using their "pockets," fur lined, external cheek pouches, to
Western Pond Turtles (Clemmys marmorata) in the Multiple Species Conservation Program Area
 in the Multiple Species Conservation Program Area") Western Pond Turtles (Clemmys marmorata) in the Multiple Species Conservation Program Area Preliminary Survey Results 2002 U.S. Department of Interior U.S. Geological Survey Loss and modification of
Western Pond Turtles (Clemmys marmorata) in the Multiple Species Conservation Program Area Preliminary Survey Results 2002 U.S. Department of Interior U.S. Geological Survey Loss and modification of
Mr T.B Brown. Land off Turweston Road, Northamptonshire REPTILE SURVEY REPORT
 Mr T.B Brown Land off Turweston Road, Northamptonshire REPTILE SURVEY REPORT June 2013 FPCR Environment and Design Ltd Registered Office: Lockington Hall, Lockington, Derby DE74 2RH Company No. 07128076.