University of Cape Town
|
|
|
- Ophelia Rogers
- 5 years ago
- Views:
Transcription
1 - LIFE HISTORY AND PHYSIOLOGICAL ECOLOGY OF THE LIZARD, CORDYLUS GIGANTEUS. BY JOHANNES H. VAN WYK Thesis submitted in fulfilment of the requirements for the degree of DOCTOR OF PHILOSOPHY in the Department of Zoology, Faculty of Science,. JUNE 1992
2 The copyright of this thesis vests in the author. No quotation from it or information derived from it is to be published without full acknowledgement of the source. The thesis is to be used for private study or noncommercial research purposes only. Published by the (UCT) in terms of the non-exclusive license granted to UCT by the author.
3 l To my late father, Professor J. H. van Wyk, who in his short life could only dream about me walking the road of a scientist, the wonderful example he set will always be a great inspiration to me, and to my late my late parents-in-law, J. P. and J. F. Franken who patiently waited, but never lived to see also one of their dreams come true.
4 ii DECLARATION The research reported in this thesis is original work, completed by me between 1984 and '( 1990 under supervision of the University of Cape to.wn. The pata collection, analysis and interpretations are my own, and any assistance I received is fully acknowledged.
5 iii ACKNOWLEDGEMENTS I gratefully acknowledge the many people and institutions who supported me during this study. Professor Gideon Louw, for accepting me as a student in the _first place, and for all the encouragement and supervision he gave me during the fieldwork stages of this project. Dr Scott Turner, for resuming the supervision of my thesis following the departure of Prof. Gideon Louw. Dr Sue Nicolson, my third supervisor, for valuable advice and encouragement while writing my thesis, but most of all, for patiently and without any delay reading my thesis. I am greatly indebted to her for improving the literary presentation of my writings. My external examiners, Prof L. J. Guillette (Florida University, USA), Prof R. Shine (University of Sydney, Australia) and Prof A. Bauer (Villanova University, USA) for valuable suggestions. The Council and Directors, Drs C. M. Engelbrecht and C. D. Lynch of the National Museum for encouragement and support during the years of my employment. I greatly appreciate the ample opportunity for field research, the use of museum facilities, most of the financial support for field studies, and later permission to use the study collection. The Orange Free State Department of Nature Conservation, especially Dr Lucas Stolz, for advice, support and permission to conduct this project. Mr C.J. Retief of the farm Greenlands for allowing me to collect lizards on his farm. Mr Wynand Louw and his family for their hospitality, continued interest and all their support while conducting research on their farms. Wynand is the perfect host for a field researcher, who, at all times without hesitation, provided valuable logistic support.
6 iv Sincere thanks are owed to my research assistants at the National Museum, Trudie Saaiman, Rod Douglas, Mike Bates, Frans and Simon who provided valuable field and laboratory assistance during this study., I have great appreciation for their dedication and all the sacrifices they made during the course of this project. Department of Chemical Pathology, University of the Orange Free State in particular Professor W.J.H. Vermaak for kindly providing facilities, in the use of the radioimmuno-assay laboratory and the SMAC analytic system. Mr T. Muller for his invaluable assistance during the hormone assays. Department of Soil Science, University of the Orange Free State, in particular Prof. Burger for the use of their laboratory facilities. Department of Geology, University of the Orange Free State, m particular, Prof Nie Grobbelaar, for the use of their surveying field equipment. Public Works Department for the use of scafholding to build an observation tower in the field. Department of Zoology, University of Stellenbosch for allowing me to finalize this study. The South African Weather Bureau for kindly providing climatic data of the study areas. I am also indepted to the following people: - Dr Schalk Louw and his staff in the Entomology Section at the National Museum for helping with the identification of insects. - Prof S. Maritz for all the discussions on growth models and the mathematical development of an oscillating growth model. - Mandy Lombard for spectrophotometric measurements of lizard skins. - Dirk Versveld for being so helpful with the MCS datalogger and tape reader. - Mr B.P. Ludick for valluable information on the agriculture of the High Veld Region. - Johan Watson for many discussion during the planning of this project and also for field assistance when I needed it most.
7 v -,All the staff that worked at the National Museum during my employment for the invaluable assistance and support they gave me. A special word of thanks to the librarians, late Tharina Koole and Millie Bronkhorst for all their help. - LeFras Mouton for the use of his printer and for all the times he took responsibility for my duties so that I could work on my thesis. - Mr A. Lintveld for all his help since my return to Stellenbosch. - Marietjie Steyn (help with art work and diagrams), Shirley de Viliers (help with typing and printing) and Mrs. J. Botha for all the help in the Zoology library at Stellenbosch. - Dr F. Ellis who helped me understand the pedology terminology. A special word of thanks also to my dear mother and sister as well as all my relatives-in-law who always supported and encouraged me. Finally, my most special thanks to my wife, Irna and two sons Jos and Franken, for all their patience, sacrifices and perpetual encouragement all these years.
8 vi ABSTRACT LIFE HISTORY AND PHYSIOLOGICAL ECOLOGY OF THE LIZARD, CORDYLUS GJGANTEUS. J.H. van Wyk, Zoology Department, University of Cape Town, Rondebosch 7700, South Africa Cordylus giganteus is a large, terrestrial, viviparous lizard, endemic to the Highveld grasslands of South Africa. Its distribution is limited and its conservation status is vulnerable. Autopsy and mark-recapture methods were used to study the seasonal aspects of its reproductive cycle, diet, energy reserves, growth, population dynamics, daily activity and thermoregulation. Reproduction is distinctly seasonal in both sexes. Females may reproduce biennially. Vitellogenesis commenced in autumn (March), and continued through hibernation with ovulation in spring (October). Two or three young are born in autumn. A functional placenta is implicated. Seasonal steroid hormone profiles are presented. Males exhibit a postnuptial spermatogenetic cycle. Spermatogenesis commences in spring with peak spermiogenesis in autumn and testicular regression following in late autumn. Spermatozoa are stored in the epididymis and ductus def erens for seven to eight months. A bimodal plasma testosterone profile is reported, consistent with spermiogenesis in autumn and mating behaviour in spring. C. giganteus feeds during 8 months of the year and prefer Coleoptera as prey. Fat bodies are utilized for winter maintenance and reproduction. Hatchlings grow 20-30mm during the first year and maximum growth rates occur in summer. Males and females attain sexual maturity at about 165 mm SVL in the fourth year. Seasonal affects on growth rate resulted in poor fit by either logistic-by-length or von Bertalanffy models and a seasonal oscillating model was introduced. Adult males are smaller than females; head sizes are the same but allometric slopes differed significantly. Population size and structure remained stable in the study area. Densities ranged from 9-11 lizards/ha. The age structure is marked by the low relative abundance of juveniles. Survivorship during the first year varied among years. Mortality was highest during summer months rather than winter months. Average annual survival of adults 'was high, but varied with sex and years (ranged from 58%-80% ). A life table yielded a net reproductive rate (Ro= 1) sufficient to sustain the population, if the
9 vii reproductive life of an adult female is at least 12 years. Lizards remain in their burrows during winter. In summer, activity was bimodal on sunshine days but unimodal on cool overcast days. Body temperature is regulated by behavioural means (postural and orientation changes) and by shuttling to the cool burrow microclimate. The life history strategy corresponds partially to that of K-selection.
10 viii CONTENTS CHAPTER 1: GENERAL INTRODUCTION 1.1. LITERATURE REVIEW Discovery, Nomenclature and General Description Distribution and General Conservation Status Existing Conservation Measures Recent Research IUECTIVES OF THE STUDY CHAPTER 2: STUDY AREAS, HABIT AT AND GENERAL PROCEDURES LOCATION PHYSIOGRAPHY 2.2.l. Geology Pedology Climate Highveld Region VEGETATION LIZARD BURROWS Harrismith Bethlehem 2.5. LIZARD Cou:ECTION 2.5.l. Field Collecting and Transportation Autopsy and Storage 2.6. MARK-RECAPTURE STUDY
11 ix CHAPTER 3: FEMALE REPRODUCTION: TIMING OF THE REPRODUCTIVE CYCLE INTRODUCTION MATERIAL AND METHODS Study Area and Lizards 3.2.l.l. Autopsy and Measurement Mark - Recapture Study Environmental Correlates and Statistics RESULTS Size at Sexual Maturity Reproductive Condition Fat Storage Reproductive Performance of Individual Females Climatic Correlates 3.4. D1scuss10N CHAPTER 4: FEMALE REPRODUCTION: SEASONAL PHYSIOLOGICAL CHANGES DURING THE FEMALE REPRODUCTIVE CYCLE 4.1. Introduction 4.2. MATERIAL AND METHODS Study Area and Lizards Biochemical Analysis Statistical Analysis 4.3. RESULTS Ovarian Cycle Liver Mass Plasma Calcium, Inorganic Phosphate, Total Proteins Plasma Estradiol and Testosterone Clutch Characteristics
12 x Embryonic Development Corpus Luteum Diameter and Plasma Progesterone Oviducal Cycle 4.4. D1scuss10N CHAPTER 5: THE MALE REPRODUCTIVE CYCLE INTRODUCTION MATERIAL AND METHODS Study Area and Lizards Autopsy Procedures Radioimmunoassay: Testosterone Climatic Correlates Statistics 5.3. RESULTS Size at Sexual Maturity Testicular Cycle and Spermatogenesis Plasma Testosterone Accessory Ducts Renal Sexual Segment Climatic Correlates Male-Female Synchronization 5.4. Discussion
13 xi CHAPTER 6: FEEDING ECOLOGY INTRODUCTION 6.3. RESULTS MATERIAL /\ND METHODS Study Area and Lizards Stomach Content Analysis Food Resource Abundance Validation Foraging Mode ' Seasonal changes in Mass of Contents of the Alimentary Canal ~.3. Composition of Diet J General diet Seasonal variation in diet composition Niche breadth Dietary overlap Resource Availability and Prey Selection 6.4. DiscussION CHAPTER 7: SEASONAL VARIATION IN ENERGY RESERVES INTRODUCTION 7.3. RESULTS MATERIAL /\ND METHODS Study Area and Lizards Autopsy Procedures Statistics Fat Bodies Liver Mass 7.4. DISCUSSION
14 xii CHAPTER 8: GROWTH AND SE~UAL DIMORPHISM 8.1. INTRODUCTION 8.2. METHODS Study Area and Lizard~ Growth Analysis Sexual Dimorphism 8.3. RESULTS 8.3.l. Growth Sexual Dimorphism 8.4. D1scuss10N CHAPTER 9: POPULATION DYNAMICS 9.1. INTRODUCTION 9.2..METHODS RESULTS Study Area and Lizards Data Collection Data Analysis Population Size and Density Age Structure and Sex Ratio Survivorship Aspects of Dispersal Life Table 9.4. D1scuss10N
15 xiii CHAPTER 10: MICROCLIMATE, ACTIVITY AND ASPECTS OF 10.l. THERMOREGULATION INTRODUCTION MATERIAL AND METHODS Study Area and Lizards Methods Microclimate Telemetry Reflectance Measurements RESULTS 10.3.l DISCUSSION Seasonal Variation in the Microclima~e Population Activity, Postures and Orientation Body Temperature and Individual Activity Reflectances of Skin CHAPTER 11. GENERAL DISCUSSION REFERENCES C. GIGANTEUS AND LIFE HISTORY THEORY C. GIGANTE US AND CoNSERV A TION APPENDICES
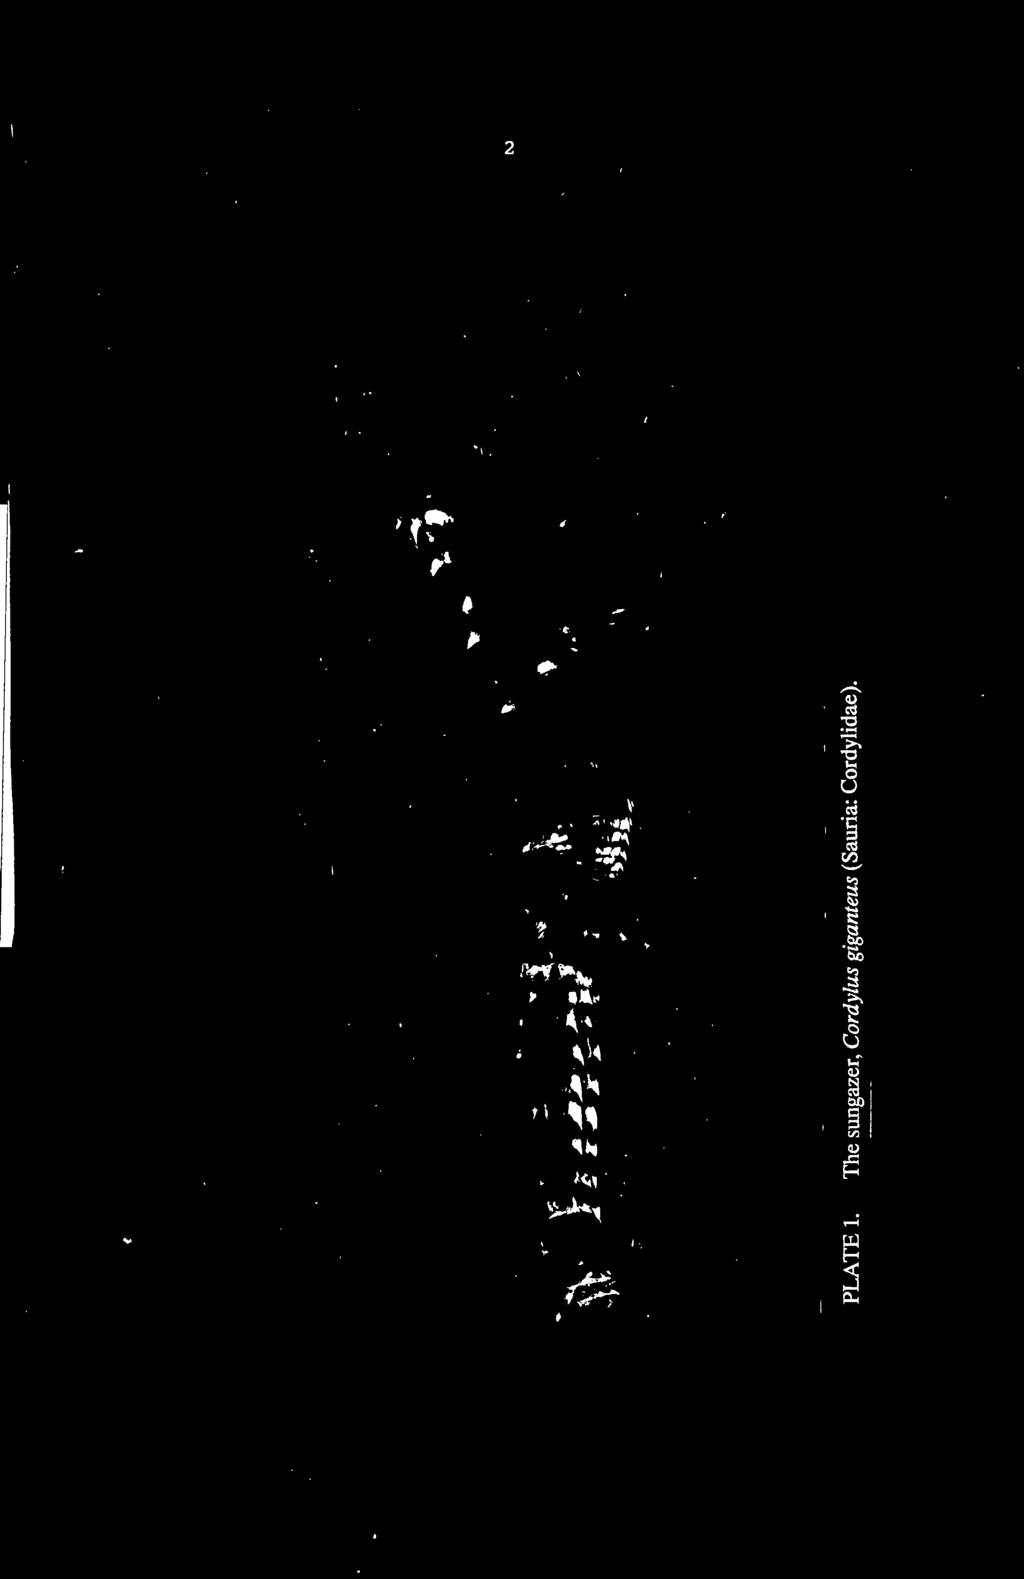
16 1 CHAPTER ONE GENERAL INTRODUCTION 1.1. LITERATURE REVIEW Discovery, Nomenclature and General Description The large girdled lizard, also referred to as the sungazer, was first collected and described by Andrew Smith in 1844 following "an expedition into the interior of South Africa in the years 1834, 1835 and 1836". He placed it in the genus Cordylus and appropriately named it Cordylus giganteus. Cordylus giganteus is the largest of all the Cordylus species, mature lizards reaching 200 mm snout-to-vent length (SVL) and close to 400 mm in total length (Plate 1). They are heavily armored, with large keeled spiny scales, and it is the conspicuous elongated occipital spines, scales on the neck and sides of the tail that are characteristic. The dorsal parts of the head, body and tail of the adults are usually dark brown to blackish. The labials and scales of the neck and body are yellow-brown, and the ventral surfaces are dirty white to straw-yellow, often infused with grey. The hatchlings and juveniles are more colourful, being dark brown with yellow-orange crossbars on the legs, back, sides and tail. The ventral parts are creamy white and the tip of the tail is usually orange-red (see FitzSimons, 1943; Loveridge, 1944; de Waal, 1978 for detailed descriptions). Lang (1991) supported the J)10nophyly of Cordylidae and Gerrhosamidae as Cordyliformes and accepted Estes et al.'s (1988) hypothesis of a Scincidae-Cordyliformes relationship and together constituting the Scincoidea. Cordylids are therefore recognized as scincomorphs (Lang, 1991 ).


17 2
18 3 Dumeril & Bibron ( 1839) reinstituted the generic name Zonurus Merrem, 1820 to replace Cordy/us and soon afterwards Gray in 1845 described specimens he obtained as Zonurus derbianus (after Lord Derby and therefore also called "Lord Derby's. Girdled Lizard"). In 1885 Boulenger recognized the priority of the specific name giganteus and derbianus was synonimized, but he still employed the generic name Zonurus. In a taxonomic revision of the Cordylidae, Loveridge (1944) suggested that the name Cordylidae replace Zonuridae since Zonurus Merrem, 1820 was antedated by Cordy/us Laurenti, In his study on the generic relationships within the Cordyliformes, Lang (1991) suggested Cordylus to be the sister-taxon to a Platysaurus-Pseudocordylus clade. In the latest checklist of the lizard fauna of southern Africa, Branch (1988) listed 17 species for Cordylus and presently 25 species are recognized (Herselman, 1991). To date no comprehensive attempt has been made by systematists to resolve relationships within the genus Cordy/us. A preliminary analysis was recently carried out by Herselman (1991) and a sister group relationship between C. giganteus and C. cataphractus is suggested. From this study it seems evident that the extensive ornamentation, which is characteristic of both these species and gives them a prehistoric appearance, may be a recently derived character state. The sister group relationship of these species is also suggested by the karyological data of Olmo & Odierna (1980) who noted that these species have a chromosome number of 44, in contrast to 34 in the remaining Cordylus species. autapomorphic character exhibited only in C. giganteus is the epidermal generation glands in the antebrachial (fore-arm) regions of males (Van Wyk & Mouton, 1992). An Distribution and General Conservation Status The type locality of C. giganteus is taken from Smith ( 1844) where he writes " Inhabits the interior districts of Southern Africa, and is not unfrequently seen on the rocky pinnacles of Quathlamba mountains, which separate the country of the south-east, from that of the interior." As pointed out by several taxonomists, the type locality given by A. Smith as on the pinnacles of Quathlamba Mountains (i.e. Drakensberg Range) is highly unlikely, especially since this species is not rock-living like most other cordylids
19 . 4 (FitzSimons, 1943; Loveridge, 1944; de Waal, 1978). In all probability Smith collected C. giganteus from the grassland foothills close to the Drakensberg Range and later confused it with the crag lizard, Pseudocordylus melanotus, frequently seen on rocky outcrops in the eastern Orange Free State and the western slopes of the Drakensberg mountains (Fitzsimons, 1943). It is now known that C. giganteus is endemic to the grasslands of the north-eastern ~ Orange Free State and the adjacent western parts of Natal and south-eastern Transvaal (Figs. 1.1 & 1.2). The distribution range of C. giganteus falls within the Highveld Agriculture Region extending over 14 of the 48 magisterial districts (Fig. 1.1), an approximate area of ha out of a total ha. The isolated localities (Fig. 1.1) reported by earlier collectors, namely Boshof (in the British Museum), Bloemfontein (Hewitt, 1909), Hoopstad and Colesberg (in the South African Museum) seem doubtful recordings (de Waal, 1978; Branch, 1981; van Wyk, 1988). It has previously been suggested that if these isolated localities are indeed proved to be authentic, it would mean that the range of C. giganteus has shrunk eastwards (de Waal, 1978; Branch, 1981) and that reintroduction should be considered. However, during an extensive survey, de Waal (1978) could not verify any of these localities. Furthermore, McLachlan (1986) confirmed that the Hoopstad record probably came from the Odendaalsrus district which is within the distribution range of the species. Van Wyk (1988) suggested that the areas in question seem to be least affected by habitat destruction and one would expect to find lizards there today if they occurred there naturally {150 years ago). If the doubtful localities are ignored, the distribution is not known to have changed markedly during recent times. From its natural distribution it is clear that C. giganteus has a very restricted range within the Highveld grasslands, which makes it particularly vulnerable when compared to widespread species. In the first South African Red Data Book, McLachlan (1978) listed C. giganteus as a vulnerable species. A decade later, in an update of the Red Data Book for Amphibians and Reptiles edited by Branch (1988), van Wyk was forced to retain its "vulnerable" status mainly because little was done since 1978
20 5 TRANSVAAL Figure 1.1. CAPE PROVINCE Map of South Africa, indicating the distribution of Cordy/us giganteus (dark shading) in the Highveld Region (light shading) of the north-eastern Orange Free State and south-eastern Transvaal Isolated locality records (see text) are also indicated, H = Hoopstad, B = Boshof, BL= Bloemfontein and C = Colesberg.
21 MAGISTERIAL DISTRICTS IN THE HIGHVELD REGION Figure 1.2 km O F3 E3 F3 Map of the High veld Region, indicating the magisterial districts where 1ogkm c:f C. giganteus is expected to occur (Based on records presented in de Waal, 1978, Stolz and Blom, 1981, Jacobsen et al., 1990 and 0. Bourquin, pers. comm.). Stars show the location of the two study areas.
22 7 to establish the true conservation status of this species. Although total numbers are not known for C. giganteus, the mere fact that it is endemic to the Highveld grasslands, and the continued man-made changes in this ecosystem, suggest that C. giganteus may soon be regarded as an endangered species. The, existence of this species is threatened by several factors. Habitat destruction:- In its many guises, degradation of the natural habitat is one of the main threats to South African herpetofauna in general (Branch, 1988) but. specifically C. giganteus, since it is totally terrestrial. Actions such as agricultural, industrial, mining, and urban development, dam and road construction as well as pollution to name but a few of the real threats faced by C. giganteus populations. Figure 1.3 shows that agriculture and mining activities have already transformed large areas within the distribution range of C. giganteus. The land types in the different magisterial districts were surveyed jointly by the Highveld Agriculture Region and the Soil and Irrigation Research ' Institute (Scheepers et al., 1984; Ludick & Joubert, 1986; Ludick & Wooding, 1991). From these reports information relevant to the conservation status of C. giganteus was extracted and is summarized in Table 1.1. Off the natural grassland, it is estimated that 81.5% of the total area is arable soil of which 40.1 % is deeper than 400 mm and therefore extremely suitable for crop production (Table 1.1) and also, C. giganteus burrows (de Waal, 1978; Stolz & Blom, 1981, Branch & Paterson, 1975, van Wyk, 1988, Jacobsen et al., 1990). The shallow soils (effective depth (ED) < 400 mm), including the soil on steep slopes and in streambeds, are generally to a lesser extent subjected to ploughing, only in the case of so-called veld improvement by planting graze. C. giganteus burrows are usually present in lower densities in the steep slope areas or other areas with shallow soils. The non-arable soil may be considered marginal potential habitat for C. giganteus and may therefore, not be regarded suitable for ~ lizards to dig their burrows, due to restrictions such as large rocks, shallow soils or exposed rock.
23 22 1s ~ 26 2BO ~ CArE rrovince ~ / ~o 30 "\_'o 36 1e ; Figure 1.3 Map of the Orange Free State and adjacent south-eastern Transvaal and north-western Natal, indicating land use (black) and the location of underlying coalfields (shade). Land use in the coalfields is not indicated. BL = Bloemfontein, H = Harrismith and S = Standerton ao dll~ co
24 9 Table 1.1. Summary of the land use in the Highveld Region (after Ludick & Wooding, 1991). Only magisterial districts where ~. giganteus is known to occur naturally were considered (see Fig. 1.2). Land use component Area in hectares (%) Available for Agriculture 4,408,749 (96.6%) Suitable for Cultivation 3,594,388 (81.5%) (ED* > 400 mm) 1,767,604 (40.1%) (ED < 400 mm) 1,826,784 (41.4%) suitable for Grazing only 814,341 (18.5%) Under Cultivation 1,849,732 (42 %) (ED>400 mm) 1,497,482 (84.7%) (ED<400 mm) 35,2250 (19.3%) Under Grazing 2,558,998 (58%) Suitable for cultivation 245,524 (5.6%) * ED = Effective Depth
25 10 In the part of the Highveld Agriculture Region where C. giganteus occurs, it is currently estimated that 42% of the natural grassland is already cultivated for monoculture crop production and 58% of the area is used for grazing; of the latter, at least 5.6% could be cultivated for the purpose of veld improvements or crqp production (Table 1.1). Comparing the area potentially available for monoculture crop production with the area currently in use, it becomes evident that most of the deeper soil (ED > 400mm) is already cultivated in the larger Highveld region (Ludick & Wooding, 1991 and Table 1.1). Fortunately in the eastern areas of this region stock farming prevails, for example in the Harrismith district, 40% of the deeper soil is still natural grassl<,md used for grazing. Industrial development:- Coal mining activity is affecting the natural habitat in the southern Transvaal with coal fields stretching into the eastern Orange Free State. Petersen et al. (1985) reported that the construction of several new power stations in the southern Transvaal will affect at least C. giganteus lizards. The first of these, the Majuba Power Station (near Amersfoort; Fig. 2.1 ), covers a total area of 3200 ha, which represents 1.8% of the C. giganteus distribution range in the Transvaal (Jacobsen et al., 1990). Ten new power stations are planned as future developments in areas overlaying the coal beds (Petersen et al., 1985) (see also Fig. 1.3). Pollution:- The possible impact of pollution, especially secondary poisoning of food resources due to crop-spraying and poisoning of other insects (e.g. grass-eating termites, Hodotermes mossambicus) is unknown. It is also possible that burrow fumigation of yellow mongooses and suricates may affect remaining C. giganteus populations, owing to the misidentification of burrows (Petersen et al., 1983; van Wyk, 1988). Pet and Muti trade:- Although Provincial ordinances abide by the rules laid down by the Convention on International Trade in Endangered Species (CITES), illegal export continues and C. giganteus still appear in the annual reports of CITES and that of reptile dealers over the world (Branch, 1988). Dried skins, whole bodies and preserved fat bodies have been noted in "Muti" shops and these C. giganteus products presumably are used by tribal witchdoctors (Du Pesani, pers. comm.; Auerbach, 1987; Petersen et al., 1985).
26 Existing Conservation Measures. In addition to being listed as a species with a vulnerable conservation status in the most recent Red Data Book for Reptiles and Amphibians (Branch, 1988), C. giganteus is also listed along with all other cordylids and pseudocordylids in Appendix II by CITES (see Branch, 1988). Because of this, and the known local threats to the species, C. giganteus is given special protected status under both Orange Free State and Transvaal Conservation Ordinances. Mentis & Huntley (1982) report that only about 1.5% of the grassland biome is included within designated national parks, provincial reserves and state forests. In the eastern OFS, C. giganteus occur naturally only in the Sterkf ontein Dam Reserve (near Harrismith;.± burrows) and in municipal reserves of towns in the High veld Region (van Wyk, 1988). In the southern Transvaal, a small reserve(.±.. 300ha) has recently been set up by ESCOM, in collaboration with the Transvaal Directorate of Nature Conservation, at the Majuba Power Station site near Amersfoort, mainly for the purpose of relocating lizards affected by the development at the mining site (Newbery et al., 1985; Petersen et al., 1985; Jacobsen et al., 1990). Relocation of C. giganteus ahead of development has been attempted on several occas10ns. Petersen et al. (1985) and Jacobsen et al. (1990) reported on a large scale relocation program in the Amersfoort area. They mentioned success rates exceeding 70% after 3 months. Relocations with unknown success were also conducted by conservation officials of the Department of Development Aid in the Harrismith area, the Municipality of Bethelehem and the National Parks Board in the Golden Gate Nature Reserve (outside the natural distribution range of C. giganteus ) Recent Research After the description of C. giganteus.by Smith ( 1844 ), the species did not draw much attention until Dr. Robert Broom in 1913 received an adult female from F. W. FitzSimons (former director of the Port Elizabeth Museum) to take back to England. During the sea voyage, two young were born. Dr. Broom later introduced these lizards to the members of
27 12 the Zoological Society of London and donated this C. giganteus family to the London Zoo where they were exhibited for years. Both FitzSimons (1943) and Loveridge (1944) gave life history notes on C. giganteus in their taxonomic monographs. Although concern was expressed early about their well-being (FitzSimons, 1962) and they enjoyed protection by Provincial ordinances, very little research was conducted to learn more about the life history of this species. Branch & Patterson (1975) reported on the dynamics of seven burrows excavated. In contradiction to the observations of FitzSimons (1943), that C. giganteus mostly occupy deserted small mammal burrows, they reported that these lizards usually dig their own burrows and that no burrow ended in an enlarged chamber. Other important observations, were the absence of basking activity during the winter and the presence of "hibernating" amphibians sharing the C. giganteus burrows during winter. De Waal (1978) conducted an extensive survey of herpetofauna and for the first time presented an updated distribution map for C. giganteus occurring in the Orange Free State. Because of the small distribution range, he stressed that C. giganteus needs more stringent control by conservation authorities. Stolz & Blom (1981) reported on a trial translocation effort in the vicinity of the Sterkfontein Dam near Harrismith. During 1982/83, N. H. G. Jacobsen and his co-workers surveyed the southern Transvaal and at the same time initiated an extensive translocation program from an area where the Majuba Power Station was to be constructed to a small neighbouring reserve (Newbery et al., 1985; Petersen et al., 1983; 1985). Jacobsen et al. ( 1990) reported valuable ecological information gained during this translocation trial. Marais ( 1984) reported that C. giganteus may be carnivorous and gave some information on the basking behaviour. He also pointed to the large numbers of these lizards being exported to Europe and North America exclusively for the pet-trade. This is emphasized by a series of popular articles published in European herpetological journals on C. giganteus in captivity (Schmidt, 1924; Wermuth, 1966; Schonfeld, 1973; Seidel, 1979; Switak, 1980; Welzel, 1981). Adolphs & Trager (1987) reviewed the ecological data published, in an attempt to understand the low success rate of captive breeding in Europe.
28 13 Paulduro & Paulduro (1987) replied with an article where they criticize wrong statements made by Adolphs & Troger (1987) and presented photographs depicting sexual dimorphic characters in C. giganteus. Apart from the above reports, C. giganteus was included in taxonomic studies (Olmo & Odierna, 1980; Lang, 1989; Herselman, 1991) and anatomical studies (Green, 1983; Laforgia & Varano, 1982; van Wyk & Mouton, 1992). To summarize, C. giganteus have interested herpetologists and especially naturalists since early times, but in spite of this interest and recent concern for the conservation status of this species, detailed field research on this species is lacking. It seems obvious that gaining such information is an important prerequisite for the successful conservation of C. giganteus. At the start of this project in 1984, apart from the occasional note by taxonomists and amateur herpetologists, hardly anything was known about the life history of any of the cordylid lizards. It is only recently that interest has been sparked both in its taxonomy, ecology and physiology. Since the family Cordylidae is one of 16 lizard families, most international scientists, reviewing either reptilian comparative anatomy or physiology or analyzing life history variation in squamates, have pointed to the absence of detailed information regarding this African lizard family (see Dunham et al., 1988) OBJECTIVES OF THIS STUDY The primary aim of this study was to provide life history information on C. giganteus, in order to contribute to the development of an informed management program which will ensure that its conservation status does not deteriorate from the vulnerable to the endangered category. Secondly, the aim of this study was to further our knowledge of life history variation within the family Cordylidae, which is endemic to southern Africa. A third objective was to gain life history information on a large-bodied terrestrial viviparous lizard inhabiting the temperate southern hemisphere, since the data base used to construct current saurian life history models consists mainly of information concerning small lizards from mostly northern hemisphere countries.
29 14 Chapter 2 summarizes the abiotic and biotic features characteristic of the Highveld region where C. giganteus occurs, with special reference to the two study areas. This chapter also describes all the general procedures common to most of the following chapters. Chapters 3 and 4 deal with the female reproductive cycle. Chapter 5 describes the male reproductive cycle, ending with a discussion on the synchronization of the two cycles. Chapter 6 presents the results of monthly stomach analysis and the seasonal variation in resource abundance. Chapter 7 deals with seasonal variation in the energy reserves and relates these to reproduction and hibernation. Chapter 8 describes seasonal variation in growth rates and investigates the phenomenon of sexual dimorphism. Chapter 9 describes seasonal variation in the dynamics of the study populations, with special reference to the variation among years, and predicted a life table. Seasonal changes in the microclimate with associated changes in activity and behavioural aspects of thermoregulation are presented in Chapter 10. Finally, Chapter 11 discusses the life history of C. giganteus in relation to the current life history models described for squamates. The implications of this study for the conservation of C. giganteus are also briefly discussed.
30 15 CHAPTER TWO STUDY AREAS, HABITAT AND GENERAL PROCEDURES 2.1. LOCATION This study was conducted using two study areas situated in the Highveld Grassland Region within the province of the Orange Free State (Fig. 1.1). Lizards were collected OJ? a monthly basis from two farms in the Harrismith district, Fraserspruit and Greenlands (29 23'S latitude, 29 Ol'E longitude, 1620 m altitude). Initial collecting was done on Fraserspruit but after the area south-west of Harrismith was marked for industrial and township development, all collecting was conducted on Greenlands. Ecological studies were conducted in the Bethlehem district on the farm Middelpunt (28 Ol'S/28 05'E, 1591 m altitude) PHYSIOGRAPHY Geology Most of the distribution range of C. giganteus is underlain by sandstones, mudstones and shales of the Beaufort Series, with Upper Ecca sediments to the north and west of its range (Fig. 2.1). The Beaufort Series is exposed as sporadic outcrops throughout the region. The Stormberg Series forms the high ground of the southern and eastern parts of the C. giganteus distribution range. Over most of the area, dolerite intrusions form ridges and escarpments (Scheepers, 1975).
31 Pedology Parent materials of the soils in most of the region are believed to be locally derived from the surrounding geological formations (Harmse, 1966). The fine sandy topsoils are probably largely wind-deposited and derived from the sandstone scarps in the area (Scheepers, 1975). The Highveld Region, is characterized by variation in soil types. Seven basic soil types are recognized in the Highveld Region, of which four major soil units/types (combinations) could be distinguished (Fig. 2.2). yellow to dark brown, loamy, plinthenic soils. In general, these soil associations are The gentle undulating slopes of the intermediate and lowland areas are dominated by the Avelon, Escort, Kroonstad and Longlands soil families (Highveld Region Report, 1986; Macvicar, 1991). In the valley areas, dark clay soils like Rensburg and Duplex soils dominate. Towards the west, soil associations change to a more apedal or sandy texture (Fig. 2.2). It is mostly the Hutton, and Clovelly soil types that dominate giving the soil a yellow to red colour. To the north however, apart from the plinthenic type soils, soil associations are characterized by higher clay contents with a dark colour (Fig. 2.2). In the larger Highveld Region it is estimated that 5.2 m hectares of arable soil are deeper than 400mm. About two thirds of this include Avalon, Hutton, Clovelly, Glencoe, and Bainsvlei soil types and are mainly utilized for crop production (Highveld Region Report, 1986; Macvicar, 1991) and therefore, potentially by C. giganteus for digging their burrows Climate Highveld Region The Highveld Region is located west of the Great Escarpment, and has a continental climate with widely fluctuating temperature and rainfall conditions. Strong climatic gradients extend across the region, especially from east to west. These gradients are strongly correlated with altitude (Scheepers, 1975). The distribution range of C. giganteus lies between the 1400m and 1800 m contour lines with its greatest area within the 1500m and 1670m contours.
32 GEOLOGICAL FORMATIONS 29 1 Dwyka 2 Ecca 3 Beaufort 4 Storm berg 5 Basalt v Figure 2.1. km100 so Vredefort Dome ~ F3 f--a Geological map of the High veld Region Plinthic catcna (a) 3 Plinthic catcna (b) 4 Pri mic-. pcdo- and/or glcy cutanic soils 6 Glenrosa and/or Mispah soils 7 Rock and lithosols (a) < 10% high elevation duplexs/ megalithic soils (h) > 10% high elevation duplcxs/ megalithic soils km !GO F3 FA~ 28 1ogkm 2 Figure 2.2. Pedological regions of the Highveld Region (after Highveld Region Report, 1986).
33 18 Rainfall: The mean annual precipitation, mainly through thunderstorm rainfall, varies from 800mm in the east to less than 500mm in the extreme west. Over most of the extensive central area, the rainfall averages between 600mm and 700mm per year. More than 70% of the total annual precipitation falls during the period November to March. The winter quarter, June to August, is usually dry, with about 5% of the total annual precipitation falling in this period. Long-term data also indicate that the reg10n is characterized by a mid-summer drought from mid-december to mid-january. Hail is a periodic phenomenon, m;ually confined to the period October to December, whereas snow is a rare occurrence, mainly limited to the high mountains in the east. Temperature: In general terms, the temperature regime may be described as temperate to cool with relatively warm summers and cold winters. The Highveld Region is characterized by considerable differences in mean monthly temperatures along an east - west gradient, inversely correlated with topographic relief (van der Wal, 1977). The mean i summer (January) isotherms in the region vary from 18 C in the east to 24 C in the west and the mean winter (July) isotherms vary between 7 C in the east and 9 C in the west. Frost occurs throughout the region, increasing with altitude. In the east the first heavy frost is expected during early May and frost continues for at least 145 days, whereas in the rest of the region the number of expected frost days decreases to 120. Climadiagrams: In spite of the strong climatological gradients extending from east to west across the distribution range of C. giganteus, climadiagrams (Walter, 1963) of Harrismith, Lindley and Kroonstad (Fig. 2.3) show that the central and southeastern parts of the Highveld Region have climates of essentially similar patterns Harrismith Seasonal climatological data for this study came from daily recordings with a Cassella thermohygrograph and an automatic weather station 5 km to the east at Sterkfontein Dam. Unfortunately the temperature data of the latter source were lost. Photoperiod regimes were calculated using the formula in
34 oc KROONSTAD (1348 m) 16.4 C 606. LINDLEY (1524 m) 15.3 C 647 HARRlSMITH (1628 m) 13.8 C 624 mm mm ' ~. 80 C 80 c IO Figure 2.3. Climadiagrams (Walter, 1963) of the towns Kroonstad, Lindley and Harrismith (see Fig. 1.1) juxtaposed (after Scheepers, 1975). Mean monthly temperatures (thin line) and precipitation (thick line): Celsius temperature scale to left, millimeters of rainfall to right Monthly precipitation above 100 mm in black and scaled down in proportion l: 10. Hum id periods: vertical hatching; dry periods: stippling. Black blocks below abscissa: months with mean daily minima below 0 C; Hatched blocks: ~ those with absolute minima below 0 C. Figures at bottom left corner of diagram: upper indicates mean daily minimum and lower indicates absolute minimum temperature of coldest month. At top of diagram, altitude in parentheses alongside station. Figures in upper right corner: on left, mean annual temperature (C); right, mean annual total precipitation (mm). mm ID
35 20 Van Leeuwen (1981) and are presented in Fig Because of the close proximity of the study areas, the photoperiod of the two locations was assumed to be the same. Ra inf all: The Harrismith study area was characterized by a high annual rainfall, ranging from 500mm to 1002mm, with a distinct dry season during the winter months (Fig. 2.5). The average total annual rainfall for the period was 720mm. Mid-summer drought periods were evident during December of 1982 and The total summer rainfall (Oct-Mar) for the period was 646mm compared to the 475mm for the period. Both summer quarters of the years 1983/84 and 1984/85 received more than 250mm rain. Autumn and winter quarters of 1984 received more rainfall than the corresponding periods during 1983 and 1985 (Fig. 2.6). Temperature: The mean monthly maximum and minimum air temperatures varied markedly between seasons (Fig. 2.7). Excessively hot weather is relatively rare, but the Harrismith area is subject to very cold winters, with minimum temperatures of -10 C and lower being recorded frequently during the months of June and July. The average duration of the frost period is 135 days with a maximum of 153 days. Heavy frost may be expected as soon as the 1st May until as late as 20th September Bethlehem Long term climatic data for Bethlehem was obtained from the South African Weather Bureau. Detailed microclimatic information for the Middelpunt study area, will be presented in Chapter 10. Rainfall: Rainfall patterns for the period 1984 to 1987 are presented in Figs. 2.8 and 2.9, and correspond to those of Harrismith. The average total annual rainfall ( ), was 653 mm. Temperature: Seasonal variation in the mean monthly maximum and minimum temperatures for the period 1984 to 1987 are depicted in Fig The same thermal regime as in the Harrismith study area is reflected. Frost may set in as early as 20th April and occur as late as 30th September. Scheepers (1975) suggest that in the vicinity of Lindley duration of the frost period may be as long as 240 days because of a low lying "frost
36 21 HOURS 15.--~~~~~~~~~~~~~~~~~~~~~~~~~~~--, F M A M J J A s 0 N D Figure 2.4. Annual photoperiodic cycle at the latitude of Bethelehem, calculated using the formula in van Leeuwen (1981). TOTAL MONTHLY RAINFALL {mm) 200~~~~~~~~~~~~~~~~~~~~~~~~~~~ II ~ E J F M A M J J A s 0 N D Figure 2.5. Total monthly rainfall for Sterkfontein Dam (Harrismith district) for the period and specifically for the years 1984 through 1985.
37 TOTAL RAINFALL (mm) SUMMER'82/83 AUTUMN'83 WINTER'83 SPRING'83 SUMMMER'83/84 AUTUMN'84 WINTER'84 SPRING'84 SUMMMER'84/85 AUTUMN'85 WINTER'85 SPRING' Figure 2.6. Total seasonal rainfall for Sterkfontein Dam (Harrismith district) for the years Seasons are presented in three monthly periods: summer = December, January & February; autumn = March, April & May; winter = June, July & August; spring= September, October & November. TEMPERATURE ( C) ~~~~~~~~~~~~~~~-,--~~~~~~~~~~~--, Figure L--~--L~~-'---~--L~~-'-~~L-~~~~-l-~ J'---~-'-~~-'-~--J J F M A M J J A s 0 N D Mean monthly maximum and minimum air temperatures at Greenlands study area (Harrismith district) for the period March October Missing data represents months of which data were lost
38 EZ2l ffib ~ II Figure 2.8. J F M A M J Total monthly rainfall and average total monthly rainfall for Bethlehem (28 20'S /28 15'E) during the period SUMMER'83/84 AUTUMN'84 WINTER'84 SPRING'84 SUMMMER'84/85 AUTUMN'85 WINTER'85 SPRING'85 SUMMER'85/86 AUTUMN'86 WINTER'86 SPRING'86 SUMMER'86/87 AUTUMN'87 WINTER'87 SPRING'87 SUMMER'87, 188 TOTAL RAINFALL (mm) Figure 2.9. Total seasonal rainfall for Bethlehem for the years
39 24 TEMPERATURE (C) _., * J F M A M J J A s 0 N D Figure Mean monthly maximum and minimum temperatures for Bethlehem during the years TEMPERATURE ( C) ~~~~~~~~~~~~~~~~~~~~~~~~~~~~ SOIL 10cm SOIL 30cm ---son. 60cm - AIR TEMP (1.2 m) '--'-'--'---'-~.l--l...-L--'--1--'--'-l-.l-L l..-.L.-1_,L l..-..l-.L-.L-L l..-L-l--L...J J FM AM J J AS 0 ND Figure Soil temperatures at 10cm, 20cm and 60cm measured daily at 0800h, 1400h and 2200h. For comparison mean air temperatures are indicated.
40 25 pocket" in a river valley into which cold air drains. Seasonal variation in air temperatures (measured at l.2m above soil) and subsoil temperatwes are presented in Fjg The amplitude of diurnal fluctuations in the soil just below the surface (locm) parallel that of the ambient temperature. However, the amplitude is smoothed out in soil deeper than 30cm VEGETATION The Highveld Region is dominated by what Acocks (1988) describes as Cymbopogon-Themeda veld (Acocks type 48) (Fig. 2.12). Along the south-eastern border of the Highveld Region there is a narrow strip of Highland Sourveld (Acocks type 44 ), mainly growing on sandy soils and along the western border the Dry Cymbopogon-Themeda Veld (Acocks type 50) adjacent to Kalahari Thornveld (Acocks type 16) (Fig. 2.12). The distribution of C. giganteus is limited to six Pure Grassland Types described by Acocks (1988), 48, 49, 52, 53, 54 and 56 (Fig. 2.12). Because of extensive cultivation of arable land for production of monocultures in the Highveld Region, the natural vegetation mainly survives in non-arable areas. Furthermore, it is clear from reports (e.g. Scheepers et al., 1984; Ludick & Joubert, 1986) that the current poor status of the natural vegetation is the outcome of decades of overgrazing by livestock LIZARD BURROWS With the help of several field assistants, the gently sloping natural grassland in the study areas was systematically searched for lizard burrows. Burrows were recognized by their oval shape with a characteristic raised ridge along the middle of the floor of the entrance. This distinguished them from most other burrows, such as mongooses. While the entrances of burrows may have a sandy clearing others were obscured by tufts of grass. All burrows located were numbered and marked with an iron stake (1.2 m). The locations of the burrows were subsequently mapped, using a surveyor plain table (ZEITZ) on a 1: 1000 scale. The orientation of the burrow entrance and the aspect of the slope was noted according to the wind directions using a compass.
41 d ; ~ I I VELDnPES~ 1988) 48- Cymhopogon Thtm)a veld 49- Transitional Cymbope.e:::. Thtm~eld SO- Dry Cymbopogon- Thtmtiiilveld SI Pan Turf veld.52- Thrmrda veld or Turf Highvcld 53- Patchy High veld to Cymbopogon- Thtmeda Transitio 54- Turf Highvcld to Highland Sourveld Transition.5.5- Bakcnveld to Turf Highveld Transition.56- Highland Sourveld to Cymbopogon- Thtmeda Veld Transition Figure Major vegetation zones of the Highveld Region (after Acocks, 1988) cf
42 27 In both the study areas mapped, the distribution of burrows seemed to be close to random (Figs & 2.14). The overall density for Greenlands was 5.1 burrows per hectare compared to the 6.8 burrows per hectare in the Middelpunt study area. Burrows were found in densities as high as 19 /ha in places, but on the other hand large areas were found without any burrows. Stolz & Blom (1981) reported burrow densities of 4-6 per hectare and Jacobsen et al. (1990) a mean of 4 per hectare. Excavation of the burrows (monthly for 15 months), using pick and shovel, was done carefully to ensure that the inhabitants were not injured (see paragraph ). Excavation continued until at least six adult males and six adult females were collected for autopsy purposes. In order to complete the collecting and transport of the lizards to the laboratory in the shortest possible time, two teams, consisting of two persons, conducted the excavation procedure. Following excavation, the following pertinent measurements (cm) of the excavated burrow were made using a steel tape: length, depth, diameter of burrow at the entrance, middle and end. Soil was then returned to the hole and grass replanted. The burrows slope gently to an average depth of 48 cm, ranging from cm below the surface of the soil (Fig. 2.15). The range of burrow depths corresponds with that reported by Jacobsen et al. (1990), and as in the latter study, in most burrows the terminal part was found to be the deepest point, which is in contrast to the suggestion by De Waal (1978) that the burrows curve upwards towards the end. The depth of the burrows was poorly correlated with length ( r = 0.45; p < 0.05; n = 273). Although burrow length was variable, most (75%) were between m (Fig. 2.15). Burrows are always single chambered and mostly have one or more bends along the length but rarely turned to complete a full circle. Diameters taken along the length of the burrows indicated that the burrows taper towards the terminal end (Table 2.1 ). Most excavated lizards were found with their heads wedged in the narrow terminal end of the burrow, and it is only in the immediate vicinity of the entrance that adult lizards have sufficient room to turn around. Since the diameter of the burrow decreased towards the terminal part of the burrow (Table
43 - 44m "... ::A ~ ~ " ' ~,,,C? ~--' - ~~~ i~~. ~ "-~\ ""' " ~" Figure Map of study area and locations of burrows excavated at Greenlands (Harrismith district). Burrow directions and contour lines are indicated. ~\... l I~... s 8 Ir) 0 Ir) \0 A9 N co
44 SOm - MVN. -. a..... = OT ~ :...\.... A.!t PT ' Figure Map of study area at Middelpunt (Bethlehem district). Burrow location (dots) and insect traps (pitfall, PT) locations are indicated The position of the markrecapture study area is demarcated as A and the observation I activity study as B. MN is magnetic north and TM true north. OT is the position of an observation tower. tv ~ '
45 30 FREQUENCY _ a '--" N = 273 ::r: ~ p.., fl:1 Cl N = _ a '--" ~ Cl z ~ ~ FREQUENCY Figure Dynamics of excavated burrows at Greenlands (Harrismith district). A: Frequency of burrow depths, B: Frequency of burrow lengths. The arrows indicate the respective means.
46 31 Table 2.1. Summary statistics of burrow length, depth and widths taken at entrance, middle and end of the C. giganteus burro at Fraserspruit and Greenlands populations during excavation of lizards for autopsy. VARIABLE N MEAN± lsd MINIMUM MAXIMUM LENGTH (cm) ± VERTICAL DEPTH (cm) ± ENTRANCE WIDTH (cm) ± MIDDLE WIDTH (cm) ± END WIDTH (clil) ±
47 ), and it seems possible that juveniles may be responsible for the extension of longer burrows. Only in one instance was the terminal part of the burrow enlarged, and suggestions of a communal terminal space (FitzSimons, 1943) could not be substantiated. During times of heavy thunder storms or prolonged rains during summer, burrows are flooded. De Waal (1978) suggested that air may be trapped in the upward curved terminal part supplying oxygen to the inhabitants until the water drained away. During this study it was observed that in some cases it may take several days for the water to drain and during such time lizards still emerged from the burrow to bask in the sun and retreated to the water logged burrow when disturbed or during night fall. Therefore, it appears that C. giganteus could survive a reasonably long period of submergence, as previously reported by Rose (1962), de Waal (1978), and Jacobsen et al. (1990). The excavation of burrows at Greenlands study area took place on a north-eastern slope. Figure 2.16 indicate that most entrances (85%) were facing down the slope east through north to west, with 66% facing north to north-east. Stolz & Blom (1981) reported that 70% of the burrows they excavated at Sterkfontein Dam, close to the Greenlands site, faced in a northerly direction on a south facing slope. On the other hand Jacobsen et al. (1990) reported that most burrows they excavated faced south-west to north-east. Four of the seven burrows excavated by Branch & Paterson (1975) on an east fronting slope faced east whereas two faced north. Therefore, apart from the report of Stolz & Blom (1981), it seems that burrows. are mostly dug into the slope and entrances face with the aspect of the slope. Although C. giganteus digs its own burrow this activity is a rare site in the field. On only four occasions did I witness the digging of a new burrow. All the digging was done by adults and happened in the rainy season when the soil was soft. In two of the cases did the lizards completely dig themselves below soil surface during the same day they started. In the other cases the lizard, for some unknown reason, started a new burrow close to its existing burrow and only occupied the new burrow after a few days of digging. The fact that a reservoir of empty burrows (7% in the Greenlands study area) exist in populations
48 33 may explain the low frequency of shorter burrows or digging activity (see also Stolz & Blom, 1981; Jacobsen et al., 1990). Burrows were mostly occupied by single adult lizards (51%) (Fig. 2.17). When more than one lizard was present, it was mostly an adult female together with juveniles. However, adult males were encountered together with juveniles in 10% of the burrows (Fig. 2.17). Apart from insects (mostly cockroaches), amphibians, namely Cacosternum boetgeri and Stenodactylus (Kassina) wealli, were common inhabitants during the autumn and winter months. In only one instance a snake, Hemachatus haemachatus (rinkhals) was found in an empty burrow LIZARD COLLECTION Here I will detail the general procedures common to most of the chapters below. Detailed methods regarding specific investigations appear in subsequent chapters Field Collecting and Transportation Lizards were collected from February 1984 to April 1985 at approximately monthly intervals (usually around the middle of the month) by excavating them from their burrows. As mentioned above, special care was taken not to injure lizards during excavation. Following excavation, the lizards were weighed, marked, and immediately placed on ice and transported to a laboratory at the National Museum in Bloemfontein. Excavation of burrows continued until at least six adult males and six adult females were collected. All juvenile lizards were also collected Autopsy and Storage Autopsy was carried out within 48 hours after capture. In order to establish whether transportation affected the body mass of the lizards, they were reweighed before being given a lethal dose of sodium pentobarbitone (Sagital). Body mass and snout-vent length (SVL) were determined to the nearest 0.01 g and 1 mm respectively. Blood was collected directly from the heart in a heparinized syringe. Plasma was separated by centrifugation, quick frozen in liquid nitrogen and stored at -20 C until further
49 34 = SLOPE FACING NORTH E NE N NW w SW s SE WIND DIRECTIONS Figure Frequencies of the orientation of burrow entrances of 177 burrows excavated at Greenlands (Harrismith district) according to aspect PERCENTAGE 60~~~~~~~~~~~~~~~~~~~~~~~~~~~~~~ ADULT FEMALE 257. N = 273 FEMALE + JUVENILES 297. NO LlZARDS 77. ADULT MALE MALE + JUVENILES LlZARDS/BURROW Figure Frequencies of occurrence of the number of C. giganteus in 273 burrows excavated at Greenlands. The pie diagram insert indicate the incidences of lizards by sex and age collected from excavated burrows.
50 35 analysis. The liver, fat bodies, kidney, gonads, and contents of the alimentary canal were removed and weighed to the nearest 0.1 mg. Material removed was either stored at -20 C until further analysis or subsequently fixed in 10% buffered formaldehyde (Bancroft & Stevens, 1977). The abdominal cavity and the rest of the body were blotted dry and weighed to the nearest 0.01 g and subsequently stored at -20 C until further analysis MARK-RECAPTURE STUDY Following the mapping of the MiddeJpunt study area (see Fig. 2.14) the area was visited at approximately six week intervals. Adult lizards were collected by placing a noose at the burrow entrance and anchoring it with a 120 mm iron nail. As the lizard emerged it was noosed and the collector could carefully remove the lizard from the burrow entrance by pulling the nylon rope, and while keeping a plastic ruler over its dorsal surface to prevent the occipital spines from anchoring in the roof of the burrow. Small hatchlings and juveniles were collected with the aid of nylon netting (20 mm mesh) covering the entrance of the burrow rather than a noose. As the small lizards emerged they became entangled in the netting. With the help of field assistants burrows were frequently checked in order to avoid exposure of captured lizards to the hot sun or predators in the vicinity. Each lizard was permanently marked by clipping toes and large abdominal scales in an unique combination. Standard data taken at each capture included sex, total length, SVL, body mass, and burrow. Lengths were measured to the nearest 1 mm with a flexible steel ruler. Mass was measured with a portable field balance to the nearest 0.1 gram. The presence of generation glands in the femoral and fore-arm regions was used to identify male lizards. Lizards < 120 mm (i.e. < 2 years) could not be sexed reliably using external characteristics. These lizards were classified as juveniles. The sex of juveniles was determined several years after they were marked. Following capture and measuring, lizards were placed in the burrow of capture. A total of 350 lizards was marked, and 1225 recaptures were recorded at the Middelpunt study site.
51 36 CHAPTER THREE FEMALE REPRODUCTION: TIMING OF THE REPRODUCTIVE CYCLE 3.1. INTRODUCTION Reproductive cycles have been described for numerous species of lizards and generalizations regarding reproductive strategies occur frequently in recent reviews (see Fox, 1977; Licht, 1984). Reptiles inhabiting the temperate climates exhibit distinct patterns of seasonal reproductive activity (Licht, 1984 ). Since reproductive patterns may be influenced by several factors such as phylogeny, climate and geographical distribution, a diversity of patterns exists in temperate zone lizards (see Bradshaw, 1986; Licht, 1984; Mendez de la Cruz et al., 1988 for reviews). Nevertheless, despite considerable diversity of reproductive cycles in temperate zone reptiles, it is possible to recognize broad categories (see Licht, 1984; Jameson, 1988). Considering the geographic region south of the Cunene and Zambezi rivers (17 S - 35 S) in Africa one is struck by the 400 reptile species of which 231 are lizards. Basic \ I 1 \ phenological information, however, is still needed for most of these species. In particular, information on members of the family Cordylidae is notably absent from studies concerning reptilian life history theory (see Shine, 1985; Dunham et al., 1988). The only cordylid in which reproduction has been studied in some detail is Cordy/us polyzonus (Flemming, 1988; van Wyk, 1989; 1990), a wide-ranging rupicolous, viviparous lizard (Branch, 1988). From Chapter 1 it is clear that information regarding C. giganteus in general, and its reproductive biology in particular, is confined to ecological notes in taxonomic accounts
52 37 and general texts. The conservation status of this species has been regarded as vulnerable since 1978 (MacLachlan, 1978; van Wyk, 1988), mainly because of extensive habitat destruction (Chapter 2). Cree & Thompson (1988) underlined the importance of deta)led reproductive information for effective reptile conservation programs. The females of C. giganteus have been reported to be viviparous, giving birth to two young in late summer (FitzSimons, 1943; de Waal, 1978). Branch (1988) mentioned the possibility of biennial reproduction in C. giganteus females, but did not indicate on what grounds such a statement was made. The only other mention of the possibility of biennial reproduction in C. giganteus was made by van Wyk (1988). Female reproductive cydes of temperate zone viviparous lizards are commonly annual (i.e. more than 50% of the mature females in a population breed annually), although an occasional skip of reproduction has been described in desert-dwelling lizards (see Bull & Shine, 1979; Hasegawa, 1984; Whittier & Crews, 1987 for reviews). Seasonal patterns of reproduction in a population are the result of physiological synchronism among individuals and not alj members of a population may breed every year although reproduction is still regarded as seasonal (Hasegawa, 1984; Whittier & Crews, 1987). Aldridge (1979) suggested that if the proportion of reproductive females significantly deviates from 50%, reproduction can not be regarded as biennial. Biennial reproduction in lizards is a relatively uncommon phenomenon (Jameson, 1988). Snakes and turtles, however, are known to exhibit biennial or even triennial or quadrennial reproductive cycles (Saint Girons, 1957; Aldridge, 1979). The existence of true biennial reproduction (i.e., individual females only capable of reproducing in alternate years) is questioned by Aldridge (1979) and Blem (1981; 1982), and current data suggest that often such a phenomenon is a temporal one, related to the energetic cost of reproduction. Because it is more often circumstantial rather than solid evidence that is presented to support biennial reproduction in a particular species, Hasegawa (1984) suggested that in addition to the standard procedure of monthly sampling, the reproductive performance of individual females must be examined for several reproductive seasons.
53 38 C. giganteus is also known to "hibernate" (i.e. no above ground activity for extended periods) in their burrows during the winter and early spring months (de Waa1, 1978; van Wyk, 1988; Chapter 10). The occurrence of "hibernation" in South African reptiles is largely unknown and therefore, the effect that such an extended period of hypothermia may have on the reproductive biology of C. giganteus unexplored. In light of the abundance of reports that correlate gonadal changes with climatic variables (Lofts, 1978; Duval et al., 1982; Licht, 1984), but Licht (1984) warns that such efforts give minimal insight into the physiological basis of seasonal synchrony in reproduction, because of covariance between these climatic factors. On the other hand the importance of recognizing phylogenetic constraints in addition to the traditional ecological adaptionist view when condsidering variation in life history strategies, has recently come to the forefront (James & Shine, 1987; Dunham et al., 1988; van Wyk, 1990; Flemming & van Wyk, 1992). In this Chapter the female reproductive cycle of C. giganteus is described as biennial and its significance discussed. An effort is also made to identify environmental variables coordinating the fem ale reproductive cycle. With this basic background knowledge of incidence of events in the female reproductive cycle, Chapter 4 investigates physiological changes during the female reproductive cycle MATERIAL AND METHODS Study Area and Lizards Aspects of the reproductive biology of C. giganteus were studied at both Harrismith (Frazerspruit and Greenlands farms) and Bethlehem (Middelpunt farm) study areas. The physiography and climate of these study areas were described in detail in Chapter 2. Lizards were collected from February 1984 to April 1985, at approximately monthly intervals by excavating them from their burrows (for details see Chapter 2).
54 l.l Autopsy and Measurements General autopsy procedures were described in Chapter 2. In addition to the use of 10% buffered formalin, vitellogenic ovaries were fixed in Smith's fixative (Humason, 1967) and preserved in 70% ethanol. The ovaries were subsequently examined for reproductive condition and the largest follicles measured through a stereomicroscope to the nearest 0.01 mm. When in doubt about reproductive condition, ovaries were dehydrated in ethanol, cleared in toluene, embedded in Paraplast, serially sectioned at 6µ and stained with Harris hematoxylin; as counterstain either eosin or periodic acid Schiff stain was applied (Bancroft & Stevens, 1977). Reproductive condition was determined using as criteria the ovarian mass, diameter of the two largest ovarian follicles of each ovary, presence of oviducal eggs, presence of corpora haemordica or corpora lutea and presence of corpora albicantia. Although three primary conditions - nonreproductive, vitellogenic and gravid (luteal) - could be distinguished, each primary data set was split in two subsets in order not to obscure variation within these groupings. In some cases monthly variation within the primary groups was analyzed. (1) Vitellogenic (VIT): Vitellogenesis and no oviducal eggs with mean ovarian follicle diameter either smaller than 8mm (VITl) or larger than 8mm (VIT2) (2) Gravid (PO): The presence of oviducal eggs (embryos) and previtellogenic follicles with the mean ovarian follicle diameter smaller than 5mm and conspicuous corpora lutea. Based on embryo developmental stage gravid females were subdivided in females with embryos younger than stage 40 (Dufaure & Hubert, 1961). (POl) and embryos of stages 40 and 41 (P02). Although embryonic development and pigmentation were completed in stage 40 embryos, I made use of an additional stage 41 to recognize the growth that occurred from developmental stage 40 to the time of parturition. (3) Nonreproductive (PP): Mean ovarian follicle diameters smaller than 5mm (previtellogenic), with corpora albicantia and no oviducal eggs and either collected during the period February - September (vitellogenesis)(ppl) or collected during the period September through February (PP2). In addition to data obtained from freshly caught specimens, museum specimens (n = 98) were also examined. These specimens were from localities in the Orange Free State
55 40 province (see de Waal, 1978). Data collected on each museum specimen included: SVL, number and diameter of the largest ovarian follicle (to 0.01 mm), reproductive condition (nonreproductive, vitellogenic, gravid), number and stage (Dufaure & Hubert, 1961) of embryos in utero (if present) Mark - Recapture Study Data obtained from the mark-recapture study (see Chapter 2 for details), conducted at Middelpunt study area from October 1985 to March 1988, provided additional information on the reproductive performances of individual females. During this field study, a total of 104 females was captured, marked by toe clipping, measured, weighed (to nearest CU g) and released. Recapturing was done at six week intervals. Apart from temporal changes in body mass of the individual females, the presence of newly born hatchlings in the same burrow as the female was noted. A female with newly born hatchlings in the same burrow was regarded as postreproductive. On the other hand, females that did not give birth in a particular year were regarded as nonreproductive for the preceding months. Only mature females ( mm SVL) that were recaptured 'during at least three or more consecutive years were included in this dataset (n = 25; x = ± 0.6 mm SE) Environmental Correlates and Statistics. Partial correlation and Stepwise multiple regression analysis were used to investigate covariation between reproductive condition and environmental variables. The mean ovarian mass (OVAR) and mean diameter of the two largest ovarian follicles (FOLD) for each monthly sample were the dependent variables. Climatic data included as independent variables, total monthly rainfall (RAIN), maximum (TMAX) and minimum (TMIN) environmental temperatures, average monthly temperature (TA V), mean monthly soil temperature at 200 mm depth (SOIL), relative humidity (RH) and photoperiod (PHOTO). Following Lee et al. (1989), climatic data of the 30 days preceding co1lection of the lizards was used.
56 41 Analysis of variance (ANOV A) was performed to determine significant trends within the sample and Tukey's multiple range procedure (a = 0.05; Sokal & Rolhf, 1981) used to test for significance among sample means. Analysis of covariance (ANCOV A) with SVL as covariate was used to adjust the group means whenever the variable was shown to be significantly affected by body size. In order to evaluate the possibility of biennicd reproduction, the null hypothesis (Ho) stating that the proportion of reproductive ' females is not different from 50 percent was tested using Chi-square analysis of contingency table data. A test for heterogeneity of the contingency table (Ho: the monthly samples did not come from the same population) was performed in order to establish whether it was valid to pool the complete data set and to apply the Cochran contillgency correction (Zar, 1984). Probability values smaller than 0.05 were recognized as significant RESULTS Size at Sexual Maturity During the collecting period a total of 295 female lizards were collected, individual sizes ranging from mm SVL (Fig. 3.l). Body size of female C. giganteus with either yolked fojlicles, oviducal eggs, or corpora lutea varied from mm SVL. The smallest female to exhibit vitellogenesis was 170 mm SVL and the smallest to contain in utero developing embryos was 173 mm SVL. It was, therefore, assumed that females attained reproductive maturity at about 170 mm SVL. Females ranging between mm SVL were encountered most frequently during collecting (Fig. 3.1) Reproductive Condition Seasonal variation in the mean diameter of the largest ovarian follicles and the histological appearance of ovarian follicles indicated that there were three female reproductive groups (vitellogenic, gravid and nonreproductive) at any time of the year or stages of the ovarian cycle (Fig. 3.2).
57 42 NUMBER OF LIZARDS n = SNOUT-VENT LENGTH (mm) Figure Body size distribution of female C. giganteus lizards collected during the period February 1984 to April The arrow indicates minimum size at sexual maturity, based on the condition of the reproductive organs.
58 PAR... = -= 0 j~g 0 F M A M J ov J A S 0 N D MONTHS J PAR + F M A 1985 Figure.~ 3.2. Relation of mean diameter of largest ovarian follicles in C. giganteus ovaries to time of year. Each symbol represents one lizard and three female reproductive groups are indicated ( vitellogenic; gravid; o = nonreproductive ). Arrows indicate either parturition (PAR) or ovulation ( OV) events.
59 44 The monthly occurrence of vi tel logenic, gravid and non-reproductive females is represented in Fig It is apparent that in only six of the 15 months collected, the nonreproductive group (including the gravid females) was smaller than the reproductive group, whhe for the overall sample 53% of the adult lizards were regarded as nonreproductive during the breeding season. Analysis of variance indicated that no. significant difference existed among reproductive stages (F(2, 134) = l.35; p > 0.05; x = ±. 0.5 mm) using SVL as dependent variable. A test of heterogeneity (Ho: the monthly samples come from the same population)(zar, 1984) revealed that the sample was homogeneous, thereby not rejecting the null hypothesis ( az = 1.35; DF= 7; p > 0.05) and data could be pooled. Following application of Cochran correction, chi-square analysis (see Zar, 1984)(Ho: the frequency of nonreproductive females in the total sample differed significantly from the expected 50%) revealed that the mean percentage of nonreproductive females (53%) in the population was not significantly different from the 50% (p > 0.05). Similar results (nonreproductive females = 55% (p > 0.05) were obtained for the period of additional collecting during Fat Storage A one-way analysis of covariance (ANCOV A) revealed that fat body mass was not significantly affected by variation in female SVL (F(l,160) = 0.01; p > 0.05). Significant variation in the mean fat body mass was indicated among reproductive groups (F(5,l60) = 8.55; p < 0.05; Fig. 3.4 ). The mean total fat body mass of preovulatory vitellogenic females was significantly greater than both gravid and nonreproductive females (p < 0.05). Mean total fat body mass of late gravid females, usually collected during late summer and early autumn (February - April), was found to be significantly smaller than early vitellogenic females (p < 0.05; Fig. 3.3) but not smaller than early gravid and nonreproductive lizards (p > 0.05).
60 45 F M A M J 1984 J A S 0 N D MONTHS J F M A 1985 Figure, 3.3. The proportion of C. gigameus females represented in each of three reproductive categories in 15 monthly samples collected during the period February 1985 to April Reproductive (vitellogenic) females = cross hatched bars; gravid females = open bars; nonreproductive females = solid bars. b (18) (10) a b (10) 0 PPl PP2 VITl VIT2A VIT2B REPRODUCTIVE STAGE POl P02 Figure Variation among the female reproductive categories (see Material & Methods) in C. giga~teus abdominal fat body mass (mean ± I SE). The advance vitellogenic category (VIT2) is suhdevided into VIT2A, vitellogenic females collected before winter hibernation and VIT2B, vitellogenic females collected during winter and spring. Bars with different alphabetic superscripts are significantly different (Tukey's (HSD) multiple range procedure, p < 0.05 per comparison)
61 Reproductive Performance of Individual Females During the mark-recapture study following the reproductive performance of 25 marked females it was found that 23 (92%) of these females did not reproduce annually. Moreover, seven (28%) of the marked females did not give birth to young in three consecutive years. The SVL of these females did not differ significantly from the rest of the sample (p > 0.05). Noteworthy on the other hand was that two females (8%) did indeed reproduce in two consecutive years, but because of the short term nature of this study it could not be established whether these fem ales reproduced every year. Climatic Correlates As a result of a high percentage of nonreproductive females in all the months, and the length of the breeding season, only data for the months (January - October) during which vitellogenic activity was expected were included in this analysis. Due to the high intercorrelation among environmental variables only selected variables (highest r ) were used in the stepwise multiple regression analysis on the complete data set, and on the vitellogenic females only. Multiple regression analysis indicated that for the recrudescence (vitellogenic females) data set, both photoperiod (PHOTO) and total monthly rainfall (RAIN) entered the regression model (OVARY = PHOTO RAIN; r = 0.90; p < 0.05) Although mean ovarian follicle diameter (FOLD) covaried significantly with mean ovarian mass (OV AR; p < 0.05), follicle diameter may be considered a better indicator of ovarian activity. Results from the multiple regression analysis indicated that photoperiod (PHOTO) was the best predictor of mean ovarian follicle diameter (FOLD = 27 - l.57photo; r = 0.88; p < 0.05), explaining 80% of the variation. The correlation between mean follicle diameter (FOLD) and photoperiod (PHOTO) was negative and significant (r = -0.94; p < 0.05), as was the correlation with average environmental temperature (TAV) (r = ; p < 0.05).
62 DISCUSSION In C. giganteus populations studied, it was clear that the proportion of nonreproductive females did not significantly deviate from 50% (53% and 55%). Apart from the lizards, Anguis fragilis (Patterson, 1983), and Eumeces okadae (Hasegawa, 1984), consistent biennial female reproduction has not been reported for temperate zone lizards, and annual reproductive cycles are the rule (Licht, 1984 ). A tropical lizard, Barisia monticola is a viviparous lizard reported to reproduce biennially (Vial & Steward, 1985), but a small sample size precluded statistical validation. Although the C. giganteus data strongly supports the hypothesis of biennial reproduction, potential sources of errors need to be evaluated. The possibility that all the nonreproductive C. giganteus females were immature may be rejected on several grounds. Firstly, the fact that the mean SVL of both reproductive and nonreproductive lizards did not differ significantly (p > 0.05) suggests that not all mature females reproduce annually. Secondly, histological investigation revealed that the majority of the ovaries of the nonreproductive females had corpora albicantia of various ages. Thirdly, oviducts of nonreproductive females larger than 170 mm SVL were relatively large and somewhat flattened, suggesting previous reproduction, whereas obviously immature females smaller than 170 mm SVL had small and threadlike oviducts. Tinkle (1962), Blem (1981) and Hasegawa (1984) stressed that variation in age structure of a population among years and localities may lead to errors when categorizing reproduction as a strict biennial phenomenon. Size distributions of C. giganteus fem ales from the autopsy data sets indicated that the majority of the females studied were between 170 and 190 mm in SVL. The 25 marked females studied in the field were all larger than 190 mm, and in a size range that did not change significantly among the years of study (see Chapter 9 below). The possibility of bias from new breeders or even old low fecundity females does not seem to be a major concern since the recruitment of new breeders was found to be extremely low and no indication of decreased or increased fecundity associated with increase in body size was evident (Chapter 9).
63 48 In addition, Blem (1981; 1982) pointed out that small sample sizes and the power (probability of rejecting the hypothesis) of the statistical analysis may obscure the fact that the proportion of reproductive females deviate significantly from 50 % and therefore result in Type JI errors (acceptance of a false hypothesis). The fact that autopsy and markrecapture datasets, supplemented with museum material were included in the C. giganteus study, resulting in a sample size of 168 mature females and the application of Cochran's contingency correction, surely minimized the chances of committing a Type II error, especially when compared to previous studies. The important question, as Hasegawa (1984) pointed out, is: "why do individual fem ales skip reproduction opportunities?" rather than whether the proportion of nonreproductive females significantly deviate from 50 %. It is generally agreed that the potential for annual reproduction exists in biennially breeding species and that factors implicated in the control of frequency of female reproductive cycles may be energy related, especially if a long summer gestation period and an interseasonal hibernation period is the rule (see Aldridge, 1979; Bull & Shine, 1979; Hasegawa, 1984), as is the case with C. giganteus. In this regard it seems essential that adequate fat reserves exist before the hibernation period, either for vitellogenesis to continue through the winter or to ensure maintenance of advanced vitellogenesis after emergence in spring. In the case of C. giganteus females, vitellogenic activity started during late summer (January-February), coinciding with the period of parturition (see Chapter 4). Although fat body size was at a seasonal low at this time for C. giganteus lizards in general, smallest fat bodies were encountered in advanced gravid and nonreproductive females (see Chapter 7). Furthermore, C. giganteus females exhibiting advanced ovarian development, during midwinter hibernation, maintained larger fat bodies than nonreproductive counterparts collected at the same time (Chapter 7). This is in accordance with results reported by Hasegawa (1984) for the lizard E. okadae. Dependence of reproduction upon fat reserves has also been suggested for several snakes known to breed biennially (Aldridge, 1979; Bull & Shine, 1979; Diller & Wallace, 1984 ).
64 49 The fact that during the time of early vitellogenesis in C. giganteus, nonreproductive females, with small corpora albicantia, were present but with fat bodies similar in size to that of early vitellogenic females, and yet no signs of vitellogenesis, seems to suggest the possibility of triennial reproduction in certain individuals. The occurrence of two C. giganteus females, in the mark-recapture study, that did breed annually may be explained by differential resource availability in the study area, allowing certain individuals to accumulate adequate lipid stores to commence with vitellogenesis following birth of young. This is essentially what Aldridge ( 1979) suggested when postulating that all temperate zone snakes are potential breeders and that it is the energy requirements that determine the actual percentage of females breeding in a given year. Comparing the reproductive strategy of C. giganteus to the annual breeding cycle of the only other cordylid lizard studied, C. polyzonus (van Wyk, 1989; Flemming & van Wyk, 1991), the timing of the vitellogenic cycle was very similar except that in C. giganteus the onset may be earlier. A clear biphasic fat body cycle was reported for C. polyzonus (van Wyk, 1989), first a general increase in fat body size during autumn and early winter and a second increase, during mid-summer prior to the onset of vitellogenesis in late summerautumn. A similar mid-summer fat body increase was evident in C. giganteus males and immatures (Chapter 9). Gravid C. giganteus females showed signs of such an increase, but it was found not to be statistically significant. C. giganteus which were nonreproductive in the past season, however, showed a more pronounced fat body increase during December (mid-summer), although admittedly not as pronounced as in C. giganteus males and C. polyzonus females (gravid at the time). Van Wyk (1989) and Flemming & van Wyk (1992) reported that the yolk reserves of the C. polyzonus embryos was an adequate energy resource prior to parturition. However, I suggest in Chapter 4 that indirect evidence indicates that meaningful placental transfer of nutrients may take place prior to parturition in C. giganteus, therefore, taxing the energy stores of the female close to the winter hibernation period. Van Wyk (1989), furthermore, pointed to evidence of continuous feeding throughout the winter months in C. polyzonus whereas C. giganteus remained in their burrows for at least three months during winter without feeding (see Chapters 6 &
65 50 10). Indications are, therefore, that for C. giganteus females factors like the magnitude of mid-summer lipid reserves, placental energy transfer and no winter feeding together with a large body size and relatively large preovulatory egg size, may be some of the reasons why this cordylid commonly breeds biennially. Bull & Shine (1979) suggested that this phenomenon of "low frequency reproduction (LRF)" is probably derived from annual reproduction and point to several species exhibiting geographical variation in fre~uency of reproduction. They inferred from these that LRF evolved only if the average fecundity or survival increases over annual reproduction as is expected with large expenditures on reproduction, including activities such as breeding migration, egg brooding and viviparity, which may require so large an expenditure of energy that annual reproduction is not possible. It is also clear that a high survivorship is an important factor, which ultimately determines the reproductive success of the biennial strategy selected by females (Bull & Shine, 1979; Hasegawa, 1984 ). Consistent with this prediction was an annual survival rate as high as 80% for mature C. giganteus females (see Chapter 9). The biennial reproductive strategy of C. giganteus also supports the suggestion by Hector et al. ( 1985) and Whittier & Crews (1987) that the phenomenon of biennial reproduction is usually confined to females of longer-lived, large species. Biennial reproduction in female C. giganteus may have been selected for because of limited energy resources, either because of limited storage before the onset of the following vitellogenic cycle or because of no feeding during the winter hibernation period. High survivorship of mature females allow females to accumulate reserves by the second or third seasons to reproduce successfully. The onset of vitellogenic activity in C. giganteus during late summer and autumn correspond to that reported for C. polyzonus females and several other viviparous squamates (see van Wyk, 1989; Flemming & van Wyk, 1992). Whether factors like declining photoperiod, declining ambient temperatures and the onset of the dry season, alone or in combination, had any direct stimulatory affect determining the onset of vitellogenesis in C. giganteus is not known. An intraspecific study on the cordylid lizard, C.
66 51 polyzonus (van Wyk, 1989; 1990; Flemming & van Wyk, 1992) showed that ambient temperature may be the main variable responsible for variations in the timing of reproductive events, either of direct action or the existence of a temperature threshold to ' facilitate a photoperiod response, for the onset of recrudescence (see Licht, 1984 ). Although most reports dealing with biennial reproduction mention reproductive effort as the most important controlling factor, it remains to be determined how the environmental influences (if at all important) are suppressed in the nonreproductive females. Naulleau & Fleury (1990) suggested that the balance between fat reserves and circulating progesterone concentrations may determine whether vitellogenesis start in the biennially reproducing snake, V. aspis implicating that it is the high circulating progesterone levels that block vitellogenesis when energy reserves are low, in nonreproductive females. It is clear, however, that much more research is needed to understand the control of biennial reproduction in a viviparous species like C. giganteus.
67 52 CHAPTER FOUR FEMALE REPRODUCTION: SEASONAL PHYSIOLOGICAL CHANGES DURING THE REPRODUCTIVE CYCLE 4.1. INTRODUCTION In Chapter 3, it was suggested that female reproduction in C. giganteus is a prenuptial phenomenon, with the onset of vitellogenesis in autumn, but that most females reproduce biennially or triennially. The only cordylid in which physiological parameters, related to reproduction, has been studied to date is Cordylus polyzonus, a viviparous lizard exhibiting autumn gonadal recrudescence and an annual reproductive-cycle (Flemming, 1988; van Wyk, 1989; Flemming & van Wyk, 1992). Reproduction in most temperate zone lizards is strictly seasonal and most often an annual phenomenon (Licht, 1984 ). For most of the yolk-producing reptiles, it seems that environmental energy resources may be the important factor determining the reproductive strategy which individuals follow (Aldridge, 1979, Nagy, 1983). Therefore, the production of yolk precursor in the liver and subsequent transport to and accumulation within the oocyte during oogenesis in oviparous and most viviparous temperate lizards may generate physiological models with a high predictive value for a particular environment or species. However, few studies exist which compare the basic seasonal gravimetric and physiological changes during the reproductive cycles of lizards reproducing infrequently (biennially or triennially) especially comparing nonreproductive and reproductive categories throughout the annual cycle (Naulleau & Fleury, 1990). In reptiles, as in most other vertebrates, some evidence indicates that estradiol is the major hormone of the follicular phase (vitellogenesis) of the ovarian cycle (Callard & Ho, 1980; Guraya, 1989) although no consistent relationship between estradiol and the events in
68 53 the ovarian cycle has been established (Licht, 1984 ). The possible involvement of hormones other than estradiol in the control of vitellogenesis cannot be excluded and in this regard Ho et al. (1982) together with others (Guraya, 1989) have suggested the possibility of a multihormonal control of vitellogenesis. In particular, seasonal estradiol profiles are needed for more species to establish consistent relationships between estrogens and female reproductive events. In spite of considerable variation reported in reptilian plasma progesterone profiles, Callard & Ho (1980) recognize two basic patterns in reptiles: firstly, in most viviparous and certain oviparous species there is a close post-ovulatory correlation between levels of progesterone and luteal development and secondly, in oviparous turtles and certain squamates, a single narrow peak at the time of ovulation is evident. Although the principal origin of plasma progesterone, at least during gestation, may be the corpora lutea (Mead et al., 1981 ), other tissues such as the ovaries (ovarian tissue and atretic follicles) and adrenal glands have been suggested as contributors (Guillette et al., 1981; Dauphin-Villemant et al., 1990; Naulleau & Fleury, 1990). Noteworthy is that Naulleau & Fleury (1990) suggested that seasonal hormonal profiles, specifically progesterone levels in biennial reproducing species, may not necessarily differ among nonreproductive and reproductive females. The objective of this investigation was, to describe seasonal morphological, gravimetric and physiological changes associated with autumn gonadal recrudescence. and the biennial reproductive strategy adopted by female C. giganteus lizards MATERIAL AND METHODS Study Area and Lizards The study area, collection and autopsy procedures were as described above in Chapters 2 and 3. Both fixed and frozen ovaries were later examined and the following measurements taken: diameter of the two or three largest ovarian follicles (nearest 0.1 mm) and diameter of corpora lutea (nearest 0.1 mm). All measurements were made either by analytical balance, ocular micrometer or vernier caliper. If eggs were present in oviducts,
69 54 the number in each oviduct was recorded, as were the wet weight of both eggs and empty oviducts to the nearest 0.1 mg. Since embryonic development was well synchronized, one embryo was separated from its yolk and both weighed to nearest the 0.1 mg. The stage of embryonic development was determined according to the. development sequence of Dufaure & Hubert (1961) for Lacerta vivipara. Embryos and yolk were dried in an oven at 50 C to constant weight. Ovaries and selected oviducts were subjected to histological procedures as described in Chapter 3. Reproductive conditions noted each month were described above in Chapter Biochemical Analysis Total plasma testosterone, estradiol and progesterone concentrations were determined by solid-phase 1251 radioimmunoassay (RIA) according to the Coat-A Count procedure (Diagnostic Products Corporation, LA). Duplicate unextracted plasma samples ( ul) were analyzed with reference to a standard curve based on standards prepared in human serum. According to the supplier, the antibodies used were highly specific for the steroids measured, with very little crossreactivity to other steroids or metabolites. Crossreactivity was in most cases less than 10%. Duplicate quality controls were placed at the beginning, middle and end of each assay in order to determine intra- and interassay variation. Although extensive assay validations were not performed validation pararr;ieters were supplied with tl]e kits or measured as follows: Testosterone assay sensitivity was 0.11 ng/ml, intra-assay coefficient of variance (CV) 4.4%; inter-assay CV 6.4%; Estradiol assay sensitivity was 10 pg/ml, intra-assay CV 5.3%, inter-assay CV 6.4% (n = 4); Progesterone assay sensitivity was 0.05 ng/ml, intra-assay CV 7.2% and inter-assay CV 7.9% (n = 3). Lizard plasma samples diluted with phosphate buffered saline (ph = 7) showed good parallelism with the standard curve. Neither hemolysis, lipemia nor the use of heparin as an anticoagulant interfered with the assays. Total plasma protein, calcium, and inorganic phosphate concentrations were determined in 1 ml plasma samples using an automated SMAC II analyzer (Technicon).
70 55 The analyzer measured total protein by the Biuret method (Weichsaulbaum, 1946), calcium by the o-cresolphthalein complexone method with deproteinization (Ray Sarkar & Chauhan, 1967) and inorganic phosphate by the ammonium phosphomolybdate reaction (Fiske & Subbarow, 1925) Statistical Analysis All similar data for a female were averaged and all means for a given group (month or reproductive condition) were combined to calculate group means and standard errors. One-way analysis of variance (ANOV A) was performed to determine whether significant variation existed among groups and Tukey's multiple range procedure (a = 0.05; Sokal & Rohlf, 1981) to identify the significantly different groups. For correlations involving organ mass which varied significantly with body size, analysis of covariance (ANCOV A), with SVL as a covariate was used to adjust the group means. Homogeneity of variances was tested by using Bartlett's test and log-transformed prior to analysis where necessary RESULTS Ovarian Cycle V itellogenic ovary:- The onset of yolk deposition in reproducing females was evident in females collected from February April 1984 and again in January March 1985 (Fig. 4.1). Follicle diameters of the largest follicles were generally >5 mm. Histological examination revealed that small deutoplasmic yolk spheres and vacuoles were abundant within the ooplasm. The thecal layer appeared undifferentiated and the granulosa layer reduced, to consist of a single layer of cuboidal cells. Vitellogenic follicles > 10 mm characterized the ovaries of reproductive females during autumn (May) through winter hibernation (June-August) to spring (October) in 1984 (Fig. 4.1). Large deutoplasmic yolk spheres and vacuoles dominated within the follicle and the granulosa layer was reduced to a thin layer containing squamous cells. The ovarian mass changed significantly from the onset of vitellogenesis through preovulation (F(l,166) = 33.04; p < 0.05) (Table 4.1). I
71 56 Figure 4.1. Monthly variation in the mean diameter (± 1 SE) of the largest ovarian follicles in vitellogenic (closed squares), gravid '(closed circles) and nonreproductive females (open squares) during the reproductive cycle in C. giganteus. Sample sizes are above the baseline. Arrow~ indicate either parturition (PAR) or ovulation (OV) events.
72 57 Preovulatory ovanan follicles, characteristic of reproducing females co11ected after hibernation during September, were significantly (p < 0.05) larger than ovarian follicles of nonreproductive or early vitellogenic females (VIT 1; Table 4.1; Fig. 4.1 ). Ovulation occurred during the October - November period with the subsequent appearance of oviducal eggs (Fig. 4.1 ). Post-ovulatory ovary:- Both the mean ovarian mass and mean follicle diameter (Table 4.1; Fig. 4.1) were significantly reduced (p < 0.05) in females containing freshly ovulated oviducal eggs. The number of corpora lutea corresponded to the number of oviducal eggs present. The mean diameter of the corpora lutea changed significantly during gestation (F(6,17) = 7.97; p < 0.05), decreasing to a minimum size at the time of parturition in February (p < 0.05). Corpora atretica were sometimes present. ANOVA indicated significant variation in ovarian mass among the months (F(6,17) = 1.30; p < 0.05) (October February 1985) for pregnant females and Tukey's HSD range test revealed that it was the ovaries from females collected in October 1984 that were significantly different (p < 0.05) from the other postovulatory females collected in the subsequent months. Mean ovarian follicle diameter, however, did not show significant variation among months (F(6,l7) = 1.84; p > 0.05). Hydrated follicles were small (x = ±_ 0.08) and histologically no large yolk droplets were visible in the ooplasma. The larger follicles were histologically characterized by cellular differentiation in the enlarged granulosa layer. layer, were noticeable in this layer. Large pyriform cells, characteristic of the early preovulatory granulosa Nonreproductive ovary:- Females exhibiting this condition were present in all the monthly collection samples (Fig. 4.l and Chapter 3). It was noteworthy that nonreproductive females with small corpora albicantia were present at the onset of vitellogenesis. The condition of the nonreproductive ovary was very much the same as for the postovulatory condition. No significant difference among the latter conditions was evident using either mean follicle size or ovarian mass (Table 4.1; p > 0.05). The major differences were the histological appearance and size of the corpora albicantia and the presence of developing embryos in the oviducts..
73 ( 58 Table 4.1. Variation in the mean (±1 SE) ovarian follicle diameters, ovarian mass, liver mass and oviducal mass among mature~ giganteus females grouped according to reproductive condition. Values with different superscripts are significantly different (Tukey's Multiple Range Test, P < 0.05 per comparison). Reproductive ovarian ovarian Adjusted Condition Follicle Mass Oviducal!!. Diameter (mm) (mg) Mass (g) PPl PP2 VI Tl VIT2 POl P02 ANOVA ± o.1oa 3.20 ± o.12a 5.42 ± 0.16 b ± 0.45C 3.30 ± o.12a 3.13 ± o.12a (F = ) (p < 0.05) ± O.l3a 2.48 ± 0.26a 5.50 ± 0.61a ± 4,03bc 3.30 ± 0.32a 2.51 ± o.15a (F 5 16 o = 33.04) (p < 0.05) 0.97 ± o.o4a o.85 ± o.01a 1.03 ± o.o5a 1.35 ± 0.07 b 1.44 ± 0.12 b 2.11 ± 0.29C (F 5, 160 = 26.16) (p < 0.05)
74 ( 59 Histologically, ovarian follicles of nonreproductive females were as described for the postovulatory condition. The mean follicle diameter did not change significantly among collection months (F(15,69) = 1.92; p > 0.05; Table 4.1; Fig. 4.1) and averaged 3.40 mm (SE = 0.06 mm) Liver Mass Liver mass was significantly affected by body size (F(l,158) = 15.57; p' < 0.05) and the means subsequently adjusted by ANCOV A. Enlarged livers were characteristic of advanced vitellogenic females (p < 0.05; Fig. 4.2; see also Chapter 9). Within the vitellogenic female group significant variation in adjusted liver mass was noted (p < 0.05) but it is evident that liver hypertrophy coincided with advanced vitellogenic activity (ovarian follicles >8 mm; p < 0.05; Fig. 4.2). Evident, though, from Fig. 4.2 is the difference in magnitude between vitellogenic fem ales and nonreproductive females during the period of hepatic enlargement. Mean liver mass of postovulatory females (gravid) was markedly reduced compared to vitellogenic females (p < 0.05) and nonreproductive adult females (Fig. 4.2) Plasma Calcium, Inorganic Phosphate, Total Proteins Vitellogenic females were marked by elevations in both total calcium and inorganic / phosphate concentrations in the plasma (Table 4.2). among reproductive groups but no trend emerged (Table 4.2). Total proteins varied significantly Plasma Estradiol and Testosterone Plasma estradiol level~ were significantly different among reproductive stages (Table 4.2). In spite of considerable individual variation, early vitellogenic females (VITI) showed elevated plasma estradiol levels, although not significantly different when compared to nonreproductive and gravid females (Table 4.2). However, plasma estradiol levels in advanced vitellogenic fem ales (VIT2) were higher (p < 0.05) than all the other reproductive groups (Table 4.2).
75 60 ADJUSTED LIVER MASS (g) 7 c PPl PP2 VITl VIT2 POl P02 FEMALE REPRODUCTIVE STAGES Figure Variation in (X ± 1 SE) in the mean adjusted liver mass among C. giganteus females grouped according to reproductive condition. Values with different superscripts are significantly different (Tukey's multiple range test, p < 0.05 per comparison). Symbols as explained in Material and Methods section and Fig ESTRADIOL (ng/ml) Sample sizes are given in Table '" T F M A M J 1984 J A S 0 N D MONTHS J F M A 1985 Figure 4.3. Monthly variation (X ± 1 SE) in plasma estradiol concentrations in vitellogenic C. giganteus females. Sample sizes and symbols are given in Fig. 4.1.
76 61 Tab~ 4.2. Variation in mean (±1 SE) estradiol, calcium, inorganic phosphate and total protein concentration in the plasma among mature~. giganteus females grouped according to reproductive condition. Values with different superscripts are significantly different (Tukey's Multiple Range Test, p < 0.05 per comparison)~ Reproductive Estradiol Calcium Inorganic Total Condition Phosphate Protein n. (nmol/ml) (mmol/l) (mmol/l) (g/l) PPl PP2 VI Tl VIT2 POl P02 ANOVA ± 4.38a ± 3.27a ± 3.27a ± 60.90b 6.05 ± 2.24a 7.35 ± 2.17a (F 5, 128 = 27.97) 2.35 ± o.o6a 2.62 ± 0.13a 1.17 ± 0.07a 2.43 ± o.o5a 1.03 ± o.o8a 4.00 ± 0.36 b 1.50 ± 0.08 b 2.75 ± 0.32a 1.24 ± 0.17a 2.35 ± o.o8a i.10 ± o.o4a i.02 ± o.o5a (F = 10.12) (F5.128 = 5.68) (p < 0.05) (p < 0.05) (p < 0.05) ± 0.76a ± 0.66b ± i.07ab ± 0.77b ± 2.16ab ± o.38ab (F5,128 = 3.61 (p < 0.05)
77 62 Highest plasma estradiol concentrations were measured after hibernation in advanced vitellogenic females prior to ovulation (Fig. 4.3). Plasma estradiol levels were lowest in both early and advanced gravid females, not differing from the nonreproductive females (Table 4.2). Although total plasma testosterone was measured, no detectable. concentrations were measured in any of the females studied Clutch Characteristics Based on counts of oviducal eggs, clutch sizes varied between 1 and 4. Mean clutch size was 2.7 (SE = 0.1; n = 24). Although females containing eggs ranged in size from mm SVL, no significant correlation existed between female body size and number of embryos in utero (r = -0.14; F(l,22) = 0.41; p > 0.05). Both the intercept and the slope of the regression model were not significantly different from zero (p > 0.05). Limited data did not allow correlation between neonate size and female SVL but the wet mass of newlyovulated eggs (embryonic stage 20) correlated with female SVL (r = 0.78, p < 0.05, n = 9). The mean RCM for newly-ovulated eggs was 0.06.± Embryonic Development Following ovulation and fertilization in spring, embryonic development continued throughout the summer (Fig. 4.1). Stage 20 embryos (Dufaure & Hubert, 1961) were the earliest developmental stage encountered in the October 1984 sample. These embryos show very little differentiation, with seven pairs of somites and an anteriorly forming neural tube. A Stage 30 embryo was characterized by the presence of the limb buds. The optic capsule was spherical and the eyes showed some pigmentation. The branchial slits were open. Development of the limb bud to paddles with differentiated fingers, pigmentation of the eyes and development of the lower jaw continued during December with embryos exhibiting stages Neither the total egg dry mass nor the embryo dry mass increased significantly during these stages (Fig. 4.4 ). Stages were marked by the development of differentiated limbs, the closure of the branchial slits, the formation of the tympanum and completion of the lower jaw. Bony scales were apparent and the head
78 63 A b.o '-"' 3 - (/) ~ :;... ~ 2 A 1 B EMBRYONIC STAGE Figure 4.4. Summary of mean total egg wet mass (Fig. 4.4A), embryo dry mass (Fig. 4.4B; light shading) and embryonic yolk dry mass (Fig. 4.4B; dark shading) variation during gestation in C. giganteus females.
79 64 covered with pigment spots. Development was completed (stage 40) during January with the pigmentation of the scales (similar to the pigmentation that will show at birth). The wet mass of the eggs increased 130% during gestation (Fig. 4.4A). At the same time, mean embryo wet mass and embryo dry mass increased significantly (p < 0.05)(Fig. 4.4B). The concomitant decrease in dry yolk mass (Fig. 4.4B) did not explain the dramatic increase in dry embryonic mass. Mean dry mass of embryos versus that of newly ovulated eggs indicated that a total gain of 130% in dry mass occurred during gestation of which most is evident between stages 40 and 41 (Fig. 4.4B). A small amount of yolk was always present prior to parturition (stage 41 embryos), and analysis indicated that it had a high water content (77%) Corpus Luteurn Diameter and Plasma Progesterone Luteal size and appearance:- Corpora lutea in early gravid females (embryonic stages < 30), appeared large (5.32 ± 0.46 mm), sac-like, with a large aperture. Gravid fem ales with stage 30 to 38 embryos in utero contained corpora lutea that macroscopically appeared more compact and with only a few exhibiting a small aperture. The mean diameter of the corpora lutea (3.03 ± 0.03 mm) during this phase did not change significantly (F(l,88) = 7.97; p > 0.05). Corpora lutea only decreased considerably in diameter after parturition (1.00 ± 0.11 mm; p < 0.05), and were present as measurable structures ( > lmm in diameter) until October - November, almost always associated with a nonreproductive ovary (PPl). Corpora albicantia were present in all mature females and macroscopically resembled the postpartum corpora lutea, although generally smaller and oval to elongated or flattened in appearance. These structures were associated with both nonreproductive ovaries and reproductive ovaries. Plasma progesterone:- Plasma progesterone levels varied significantly among reproductive stages (F(5,128) = 3.0; p < 0.05; Fig. 4.5) and coincided with luteal development during gestation. Significant variation was indicated by ANOV A within the gravid female group (F(l,88) = 7.97; p < 0.05) among early gravid (embryonic stages <40) and late gravid females (embryonic stages >40). Peak plasma progesterone levels
80 65 PROGESTERONE (ng/ml) 8..--~~~~~~~~~~~~~~~~~~~~~~~~~~~~--. 7 a PPl PP2 VITl VIT2 POl P02 FEMALE REPRODUCTIVE STAGES Figure 4.5. Variation in (X ± 1 SE) in the mean plasma,progesterone concentration among C. giganteus females grouped according to reproductive condition. Values with different superscripts are significantly different (Tukey's multiple range test, p < 0.05 per comparison). Symbols as explained in Material and Methods section and Fig Sample sizes are given in Table 4.1.
81 66 coinciding with early gravidity (Fig. 4.5). Luteal diameter did not correlate significantly with plasma progesterone concentration (r = -0.07; p > 0.05). Postpartum females exhibited plasma progesterone levels significantly lower than early gravid females (p < 0.05) (Fig. 4.5). Noteworthy, was the relative high plasma progesterone concentrations (however, not significant; p > 0.05) in early vitellogenic females (VITl; Fig. 4.5) Oviducal Cycle Analysis of covariance (ANCOV A) indicated that variation in oviducal mass in C. giganteus was significantly effected by body size (F(l,160) = 26.48; p < 0.05). Variation in ANCOV A adjusted mean oviducal mass among reproductive stages was found to be significant (F(5,160) = 26.16; p < 0.05). It is clear from Table 4.1 that oviducts were hypertrophied (p < 0.05) during late vitellogenic and gravid reproductive stages. Seasonal variation in mean adjusted oviducal mass in vitellogenic females varied significantly among collection months. Vitellogenic females collected in February had significantly smaller oviducts than preovulatory females collected in October (F(l3,40) = 4.61; p < 0.05; Fig. 4_.6 ). Similarly, the mean oviducal mass of gravid females varied considerably among collection months, being heaviest in the months prior to parturition (February - March) (F(6,16) = 6.12; p < 0.05; Fig. 4.6). Postpartum (nonreproductive) females (PPl) had lighter oviducts than gravid females (p < 0.05; Table 4.1; Fig. 4.6) similar in appearance and mass to early vitellogenic fem ales (p > 0.05). Although significant seasonal variation was indicated by ANCOVA in mean oviducal mass of nonreproductive females (F(15,72) = 3.89; p < 0.05) no significant trend among months could be indicated DISCUSSION The ovarian cycle of C. giganteus corresponded to the Type II pattern of follicular growth and vitellogenesis described for certain temperate zone snakes (Aldridge, 1979). Vitellogenesis was initiated in late summer/early autumn, around the time of parturition, and continued through winter hibernation until ovulation in spring (October). The ovarian cycle of C. giganteus corresponds to the prenuptial pattern of ovarian growth described
82 PAR ov PAR,..._, 01...,, {/). {/) <( 2 _J <( u :::> 0 > Figure '--..~_.._~_._~....~--1-~...1-~ ~-L-~...1.-~ ~-1..~-L J F M A M J 1984 J A S 0 N D J MONTHS F M A M 1985 Monthly variation in the mean oviducal mass ( ± l SE) in vitellogenic (closed squares), gravid (open squares) and nonreproductive (open circles) females during the reproductive cycle of the C. giganteus. Sample sizes and symbols are given in Fig. 4.l.
83 68 by Licht (1984) for other reptiles. The dynamic changes in the granulosa cells in the follicular wall and the appearance of small deutoplasmic yolk spheres in the ooplasm of C. giganteus ovarian follicles at the onset of vitellogenesis through ovulation were consistent with reports for other vitellogenic non-mammalian vertebrates (for review see Guraya, 1989). Using calcium and inorganic phosphate concentrations as indicative of plasma vitellogenic concentration, it was clear that the vitellogenic complex in C. giganteus plasma corresponded to the reported lipo-phosphoprotein-calcium nature of this complex which increases during vitellogensis (Gavaud, 1986; Ho et al., 1982). As it has been suggested that this complex is produced in the liver, a corres~onding liver hypertrophy during the vitellogenic stages (Ho et al., 1982), in C. giganteus is not surprising. It is, however, important to remember that apart from its role in reproduction, the liver may also play an important role in energy storage (glycogen & lipids) during winter hibernation (Etheridge et al., 1986). In the case of C. giganteus, the involvement of the liver in both activities is suggested considering males, nonreproductive females and juveniles displayed significantly enlarged livers in autumn and winter, although in the case of vitellogenic females the magnitude of increase was much greater (see Chapter 7 below). Similar to reports by Flemming & van Wyk (1992) for C. polyzonus and several other species (Etheridge et al., 1986; Loumbourdis & Kattoulas, 1985), the liver cycle paralleled that of the fat body cycle in C. giganteus (see Chapter 7) indicating that these lipid reserves are metabolized concurrently for vitellogenesis or other metabolic demands during hibernation. Thompson ( 1981) used liver mass as an indirect measure of placental nutrition exchange in the viviparous lizard, Sphenomorphus quoyii but did not find significant variation in liver mass during the gestation period. In the present study the mean liver weights of gravid females were smaller than that of nonreproductive females collected during the same time of the year which may indicate a depletion in metabolic reserves in the gravid C. giganteus females. Because of the calcium nature of vitellogenin, and reported hypercalcemia in vitellogenic reptiles (Guraya, 1989; van Wyk, 1984), the rise in plasma calcium in C.
84 69 giganteus during vitellogensis was not unexpected. Packard et al. (1985) have shown that the embryos of oviparous reptiles mobilize most of their calcium needs from the yolk and shell, but squamate embryos may obtain all the necessary calcium from the rich stores present in the yolk alone (Jenkins & Simkiss, 1968). Although Jenkins & Simkiss (1968) concluded that adequate calcium was stored in the yolk accompanying the developing embryos of the snake Vipera berus, Thompson (1982) reported that additional calcium was transported via the placenta to the embryos in the lizard, Sphenomorphus quoyii. Since plasma calcium levels did not increase at any stage during the gestation period, it may be concluded that the calcium stored in the yolk is sufficient for embryonic development in C. giganteus females, but before accepting this conclusion, more needs to be learned about the calcium metabolism in this large bodied viviparous lizard. No significant seasonal trend was evident in the total plasma protein concentration in the female C. giganteus. Van Wyk (1984) reported that the total plasma protein concentration in the oviparous lizard Agama atra did not change substantially as a result of compensatory decrease in the albumin-like factor when vitellogenic precursor concentration increased. Similar results were reported by Callard et al. (1978) and Gapp et al. (1979) for the turtle Chrysemys picta. Estradiol, originating from the granulosa and/ or thecal layers of the oocyte, has. been suggested to be the primary stimulus of vitellogenin production by the reptilian liver (Gavaud, 1986; Ho et al., 1987). Plasma estradiol levels in reproducing C. giganteus females seem to support this generalization, with peak estradiol concentrations measured in advanced vitellogenic females during late autumn, winter and early spring. Seasonal plasma estradiol profiles in C. giganteus corresponded to the profiles reported for C. polyzonus (Flemming, 1988). Ho et al. (1982), however, emphasized the complexity of regulation of reptilian vitellogenesis and pointed to a possible multihormone involvement in modulating the vitellogenic response to estradiol. In this regard, the uptake of vitellogenin in the oocyte by micropinocytosis has been shown to be under FSH control (Limatola & Filosa, 1989). The plasma estradiol levels in gravid and nonreproductive C. giganteus fem ales were significantly lower than the levels in early or advanced vitellogenic
85 70 females, suggesting that the control of biennial reproductive activity may be m~diated through the control of the production of estrogens. How males discriminate between vitellogenic and nonreproductive fem ales during spring mating is still speculative. The involvement of estrogens in the control of female fem oral gland secretions may lead to differential behavior patterns among different sexes or different female individuals. Alberts (1991) reported that only unmated females show glandlliar activity in D. dorsalis. Vitellogenesis in C. giganteus culminated in ovulation during spring (September). As in the cordylid, C. polyzonus (van Wyk, 1989; Flemming & van Wyk, 1992), ovulation in C. giganteus was well synchronized among vitellogenic females. No major preovulatory rise in plasma testosterone or progesterone concentrations was measured in C. giganteus although reported for certain chelonians and snakes (Callard & Ho, 1980). The hormonal control of ovulation in reptiles, especially the involvement of gonadotropins and prostaglandins, needs much more study before making any generalizations (Guraya, 1989; Jones, 1987). Unlike many other reptiles (Dunham et al., 1988; Fitch, 1970) and the only cordylid studied to date, C. polyzonus (Flemming & van Wyk, 1992; van Wyk, 1989) clutch size did not increase with increasing SVL in female C. giganteus. However, similar to other large bodied viviparous lizards, Elgaria coerulea ( Gerrhonotus coeruleus) (Steward, 1979) and Barisia imbricara (Guillette & Casas-Andreu, 1987) limited data seem to suggest that it is rather the size of the egg or neonate that is influenced by female body size. Therefore, under strong selection for larger newborn, larger older females may have higher fitness if more energy is channeled into individual young (Steward, 1979). Ballinger (1973) observed that larger young from viviparous Sceloporus jarrovi exhibit greater survivorship. Sinervo & Licht (1991) suggested that egg size, total clutch mass and relative clutch mass are physiologically coupled life history traits, and therefore could be related to the hormonal control of reproduction. This may also explain the low relative clutch mass (RCM) value and the biennial reproduction pattern (Chapter 3) of C. giganteus females, although nutrition and resource availability may be important additional factors influencing processes Jike vitellogenesis.
86 71 As in mammals and viviparous reptiles (Guraya, 1989; Xavier, 1987), the life of corpora lutea in C. giganteus females is extended for the duration of gestation and, therefore, remained a conspicuous f ea tu re of the post-ovulatory ovary until after parturition. The mean diameter of the C. giganteus corpora lutea did not change significantly during pregnancy and only decreased in size after parturition. All indications are that the corpus luteum is the main source of progesterone in the gravid female reptile (Mead et al., 1981). Elevated plasma progesterone levels marked the period of embryonic development up to stage 40 and although the diameter of the corpora lutea did not change the plasma progesterone levels decreased during the final stages of embryonic development in C. giganteus. In contrast, in C. polyzonus females (Flemming, 1988) the progesterone content of corpora lutea and plasma peaked much later, prior to parturition. To date reports on plasma progesterone levels among reptiles indicate considerable variation in temporal patterns during gravidity, either reaching highest concentrations in any one of the trimesters prior to parturition (see Guraya, 1989; Xavier, 1987 for reviews), with plasma progesterone reaching a peak in the second trimester in C. giganteus. Kleis-San Francisco & Callard (1986) reported a comparable temporal pattern in the female viviparous snake, Nerodia, and showed in addition that progesterone receptors in the oviduct increased during vitellogenesis, when estradiol levels were high, but decreased when estradiol level decreased and progesterone levels increased. These authors explained the continued progesterone activity despite the low receptor levels on the basis of an increased sensitivity of steroid-receptor-genome interaction. It is clear that more research concerning the functional significance of plasma progesterone temporal patterns are needed to elucidate the role of progesterone in gravid reptiles. Apart from one report by Naulleau & Fleury (1990) regarding plasma progesterone levels in the snake, Vipera aspis, no studies mentioned progesterone levels in nonreproductive females in biennial reproducing lizards. In the case of V. aspis (Naulleau & Fleury, 1990), based on the observation that the annual progesterone profile in nonreproductive females did not di ff er from that of reproductive fem ales, an annual endogenous endocrinological cycle has been suggested. This phenomenon was not evident
87 72 m nonreproductive C. giganteus females, although plasma progesterone levels were elevated in early vitellogenic fem ales, but whether progesterone plays an important part in the control of biennial reproduction, as suggested by Naulleau & Fleury (1990), needs further investigation. With the exception of lizards known to ovulate prior to winter (Mendez de la Cruz et al., 1988), embryonic development occurred in summer in most squamates (Licht, 1984 ). Embryonic growth took place throughout summer (October - February) in C. giganteus, with parturition in February. A similar trend was reported for C. polyzonus (van Wyk, 1989; Flemming & van Wyk, 1992). Like most other viviparous and oviparous lizards, the mean wet mass of the C. giganteus embryos increased dramatically, paralleled closely by a significant decrease in yolk mass. Most of such an increment can usually be explained by the uptake of water during embryonic development (Mendez de la Cruz et al., 1988) since dried embryos did not increase in weight when compared with the post-ovulation dry mass of the yolk. Although I haye no data concerning nutritional exchange in C. giganteus, the fact that the embryos exhibited a 130% increase in dry weight by the end of development, when compared to the dry weight of newly ovulated eggs, suggests that placental nutritional ~xchange may have occurred. This was especially the case during late pregnancy in C. giganteus embryos when development was complete (stages 40 & 41) and a considerable increase.in dry embryonic mass was evident. This is in contrast to the decrease of 15.9 % (van Wyk, 1989) and 23.4% (Flemming & van Wyk, 1992) in dry embryonic mass reported for C. polyzonus. Several viviparous lizards have placentae capable of transporting nutrients (Guillette & Casas-Andeu, 1987; Thompson, 1981). Placental organic exchange, however, may vary from minimal to extensive depending what contribution the yolk reserves make towards the energy demands of the growing embryo's (Steward et al., 1990). Placental exchange in C. giganteus appears moderate when compared to the % increase in embryo dry mass reported for the skink, Mabuya heathi (Vitt & Blackburn, 1983), also exhibiting the most advanced chorioallantoic placenta known for reptiles (Type III; Weekes, 1935). The morphological characteristics of the C. giganteus placenta are not
88 73 known, and needs further study to substantiate placental transfer during late pregnancy in this species. Seasonal oviducal hypertrophy has been reported for several reptilian species and the annual changes in the size and weight of the oviducts are generally believed to be directly dependent upon ovarian secretions (Fox, 1977; Licht, 1984) such as estradiol. An marked annual oviducal cycle, similar to other reptilian species (Fox, 1977; GuiJlette et al., 1989; Picariello et al., 1989), was evident in C. giganteus females. The initial oviducal hypertrophy, coinciding with elevated plasma estradiol levels, is in accordance with the thesis that the oviduct is a main target organ of estradiol (Fox, 1977; Mead et al., 1981). Although it is generally reported that oviducal hypertrophy takes place prior to ovulation under estradiol influence and remains so for the duration of gravidity (Picariello et al., 1989), in C. giganteus females the oviduct, as in other viviparous species (Guillette, 1982) increased in mass during gestation, culminating in the advanced staged of embryonic development (stages 40 and 41 ). This may further point to the development of a functional chorioallantoic placenta and the associated increase in oviducal vascularity (Guillette & Jones, 1985; Mason & Guillette, 1987). As was the case in the triennial cycle of the snake Vipera aspis (Saint Girons, 1973), the regressed condition of the oviducts were retained in C. giganteus throughout the nonreproductive period until the next vitellogenic phase. It was, however, noteworthy that the oviducts of nonreproductive females showed some increase in mass during the period of vitellogenesis, although the plasma estradiol levels were generally low in these females at this time when compared with vitellogenic females. Furthermore, when compared to oviducts of gravid females, the oviducts of nonreproductive females were decreased in mass, which may point to the importance of progesterone in the maintenance of the hypertrophied oviduct in gravid C. giganteus females. The oviducts of immature C. giganteus females were generally small and threadlike when compared to the larger and more flattened oviducts (although in a regressed state) of mature C. giganteus nonreproductive females, and did not show any seasonal hypertrophy.
89 74 In conclusion, the results obtained in this study suggest that in this biennial reproducing viviparous lizard, C. giganteus, marked differences prevail in the physiology of the nonreproductive and reproductive females, the control of which remains speculative.
90 75 CHAPTER FIVE THE MALE REPRODUCTIVE CYCLE 5.1. INTRODUCTION Models concerning life history tactics in lizards have been primarily based upon parameters relating to the female reproductive cycle and data sets originating from studies of the northern temperate regions (see Dunham et al., 1988 for review). Ballinger & Schrank (1973) and Trauth (1979) stated that characteristics of the male reproductive cycle may be just as important as the female reproductive cycle in determining the total reproductive strategy of a species. ReptiUan testis cycles, when based on the relationship between seasonal timing of spermatogenesis and mating season ot time of ovulation in the female, appear to conform to two basic types which were designated as prenuptial spermatogenesis (spermatogenesis immediately precedes mating) and postnuptial spermatogenesis (gonadal recrudescence occurs after the breeding season with subsequent sperm storage in the epididymis) (Bradshaw, 1986; Saint Girons, 1985; Vosloe, 1944). Lofts (1977) suggested that in endocrinological terms these two categories should be recognized and pointed out that the distinction is made whether or not a species retains its spermatozoa in the ductus epididymidis for a prolonged period after cessation of the spermatogenetic cycle. The postnuptial cycle is common in temperate zone snakes and chelonians but uncommon in lizards; most temperate zone lizards exhibit prenuptial spermatogenesis (Lofts, 1987; Jameson, 1988). Marked differences in the temporal relationships between testicular activity and circulating androgen levels or secondary sexual characters in pre- and postnuptial cycles may exist (Lofts, 1987; Weil, 1985).
91 76 Even thought seasonal changes in the size and histology of the testis are known in several reptiles, few reports include associated variation in circulating androgens and activity of accessory sexual organs (e.g. epididymis, sexual segment of the kidney and femoral or pre-cloaca! glands). In lizards and snakes exhibiting prenuptial spermatogenesis, the accessory sexual structures develop and reach maximum activity during the peak spermiogenesis period, usually associated with increased circulating androgen levels. The induction of mating behavior in most reptiles exhibiting post-nuptial., cycles occurs at a time when circulating androgens are low and Crews (1984) refer to these two patterns as "associated" and "dissociated" reproductive tactics. However, bimodal androgen profiles have been reported in postnuptial cycles, one peak during spermiogenesis and another at the time of mating (Crews, 1984; Aldridge et al., 1990). Whilst a considerable literature exists on seasonal patterns of testicular activity and related subjects in representatives of all three major reptilian orders (see Dunham et al., 1988), South African lizards have been largely neglected in this regard. In particular, spermatogenesis, has only been studied in a few species, Bradypodion pumilum and Chamaeleo namaquensis (Burrage, 1973), Aporosaura anchietae and Merales cuneirostris (Goldberg & Robinson, 1979), Mabuya quinquetaeniata and Mabuya striata (Simbotwe, 1980). The only cordylid in which male reproduction was studied in some detail to date is the wide ranging, rupicolous Cordylus polyzonus (Flemming, 1988; van Wyk, 1990). spermatogenetic cycle was reported to be prenuptial, with the onset of spermatogenic recrudescence in autumn, peak spermiogenesis in spring, prior to ovulation in the females, followed by testicular regression during the hot summer months (van Wyk, 1989; 1990). Information regarding the male reproductive cycle of C. giganteus is nonexistent, and although the female reproductive cycle conforms with a prenuptial gonadal pattern, the uncommon phenomenon of biennial reproductive activity was reported in Chapter 3. In this Chapter the male reproductive cycle of C. giganteus is described, with The evidence to show that spermatogenesis, in contrast to vitellogesis being a prenuptial phenomenon, is a post-nuptial event. Seasonal variation in gravimetrical, histological, hormonal and secondary sexual characters associated with the testicular cycle are presented
92 77 and correlated to the major environmental variables. Following the description of gonadal cycles in both sexes the question of reproductive synchronization arises and will be discussed MATERIAL AND METHODS Study Area and Lizards See Chapter 2 for details on the study area. The collecting procedures were as described in Chapter 2 and Chapters 3 and 4 for female lizards Autopsy Procedures General autopsy procedures were as described in Chapter 2 and Chapters 3 and 4 for female lizards. The testes, ductus epididymidis, ductus deferens and the kidneys were removed. The testes were separated from the Wolffian ducts and the testicular mass, length and diameter measured.. The right testis, Wolffian ducts and kidneys were preserved in 10% buffered formalin, dehydrated in ethanol, cleared in toluene, embedded in paraffin (Paraplast), sectioned at 5-6 µand stained with Erlich's hematoxylin and eosin (Humason, 1967). Because stages of the spermatogenic cycle in reptiles are reflected by variation in the morphology of the seminiferous tubules, 10 cross sections were selected (tubules that were near circular) per lizard, measured with an ocular micrometer and the spermatogenic activity assessed qualitatively by using the classification scheme from Licht (1967). Several authors used stage 1 for complete regression but like Mayhew (1971), I used stage 8 for this category (Table 5.1). Seasonal changes in the amount of sperm in the lumen of the accessory ducts were evaluated qua1itatively. At least 10 random measurements of the epithelial cell heights of the ductus epididymidis and ductus deferens for each lizard were made with an ocular micrometer.
93 78 Table 5.1. Classification of spermatogenic stages in C. giganteus. Adapted from Licht ( 1967) and Mayhew (1971). Histological Conditions Stage Seminiferous Tubules Epididymis 1 Involuted with only Atrophic, empty spermatogonia Primary spermatocytes appearing Secondary spermatocytes and early spermatids abundant Transforming spermatids with a few spermatozoa Spermatids and spermatozoa abundant Spermatozoa abundant Hypertrophied, many spermatozoa with (maximum level of spermiogenesis) Spermatozoa abundant but Atrophic, many spermatozoa spermatids and spermatocytes greatly reduced Involuted with only spermatogonia Atrophic, empty Atrophic, empty Atrophic, empty Hypertrophied, empty Atrophic, many spermatozoa
94 Radioimmunoassay: Testosterone Total plasma testosterone was determined by solid-phase 125I radioimmunoassay (RIA) according to the Coat-A-Count procedure provided by Diagnostic Products Corporation (For details see Chapter 4 ) Climatic Correlates Correlation and multiple regression analysis were used to investigate covariation between reproductive condition and environmental variables (for details see Chapter 3 ). The mean testis mass (TMASS) and mean diameter of seminiferous tubules (SEMI) for each monthly sample were the dependent variables. Climatic data included as independent variables included, total monthly rainfall (RAIN), maximum (TMAX) and minimum (TMIN) environmental temperatures, average monthly temperature (TAV), mean monthly soil temperature at 200 mm depth (SOIL), relative humidity (RH) and photoperiod (PHOTO) Statistics One-way analysis of variance (ANOV A) and Tukey's multiple range procedure (a = 0.05; Sokal & Rohlf, 1981) were used to statistically correlate variables with reproductive events. For correlations involving organ mass which varied significantly with body size, analysis of covariance (ANCOV A), with SVL as a covariate was used. Pearson correlation coefficients further clarified the relationship, if significant. Because all the lizards in a monthly sample were not spermatogenically synchronized, means and standard errors regarding testis mass and diameters of seminiferous tubules could be affected, obscuring the seasonal trends. However, the only months severely affected were October 1984 and January 1985 since in the other months it was usually only a few (1-2) lizards that displayed the previous or next stage. Variation in morphological and physiological variables was, therefore, also compared among stages.
95 RES UL TS Size at Sexual Maturity During the collection period a total of 124 male lizards were collected, individual sizes ranging from mm SVL (Fig. 5.1). The smallest male to exhibit testicular enlargement and active spermatogenesis (spermiation) was 165 mm SVL. That specimen was collected in March 1984 and had a total testicular mass of 600 mg. spermatozoa were present in both the ductus epididymidis and ductus def erens. Abundant Smaller males ( mm SVL) collected throughout the year possessed small seminiferous tubules (x = µm.± µm; range = µm) typically with a single basal layer of large spermatogonia, but without lumina. It was, therefore, assumed that males attained reproductive maturity at about 165 mm SVL. Males ranging between mm SVL were encountered most frequently during collection (Fig. 5.1) Testicular Cycle and Spermatogenesis Testicular mass in C. giganteus was significantly affected by body size (ANOVA: F(l,88) = 7.97; p < 0.05). Seasonal changes in the testicular mass in C. giganteus, using adjusted (ANCOV A) testicular mass is graphically summarized in Fig ANOV A revealed that the variation was significant among collection months (F(l4,88) = 10.45; p < 0.05). The diameter of the seminiferous tubules varied significantly among collection months (Fig. 5.3A; F(14,88) = 8.46; p < 0.05) in parallel with the testicular mass (recrudescent, progressive and culminating months: r = 0.97, p < 0.05; regressive months: r = 0.96, p < 0.05). Spermatogenic synchronization between males collected on the same day in a particular month varied from fully synchronized to representation of three different spermatogenic conditions (Fig. 5.3B). Therefore, histological events, regarding spermatogenesis will be presented according to spermatogenic stage rather than by month. Adjusted testicular mass varied significantly among the spermatogenic stages (ANOVA: F(7,80) = 34.8; p < 0.05). The diameter of the seminiferous tubules similarly varied significantly between stages (ANOV A: F(7,80) = 26.4; p < 0.05).
96 81 30 n = SNOUT-VENT LENGTH (mm) Figure 5.1. Body size distribution of male C. giganteus lizards collected during the period February 1984 to April The arrow indicates minimum size at sexual maturity, based on the condition of the reproductive organs. a LJL--1~-L_,.._J_~J_~L...,...--1~_L~-1-~_L_~..i ~L---i~-L~-'--' F M A M J J A S 0 N D J F M A MONTHS 1985 Figure 5.2. Monthly variation (mean + lse) in the adjusted mean testis mass (ANCOV A) during th~ annual reproductive cycle of the male C. giganteus. Values with different superscripts are significantly different (Tukey's multiple range test, p < 0.05 per comparison). The monthly sample size is given below the SE bars.
97 82 Table 5.2. Variation in adjusted (ANCOVA) testicular mass and mean seminiferous tubule diameterl by spermatogenic stage in C. giganteus. Stage n Testicular mass (mg) Seminiferous tubule diameter (mg) (µm) ± 11.sa ±3.2a ±16.7a ±8.7a ±6.6a 227.2±4jab ± 41.9b ± 14_9abc ± 36.9bc ± 30.7cd ±18.8c ± 12.4d ± 27.4b ± 15.2bc ±10.sa 205.8±8.6a 1 Different superscripts indicate significant difference (p < 0.05) among means (Tukey's multiple range test).
98 83 Figure 5.3. Seminiferous tubule diameter and spermatogenic condition. (A). Monthly variation (mean.±. lse) in the ANCOVA adjusted mean seminiferous tube diameter during the annual reproductive cycle of male C. giganteus. Values with different superscripts are significantly different (Tukey's multiple range test, P < 0.05 per comparison). The monthly sample sizes are given in Fig (B). Monthly frequency (lizard numbers) distribution of males in each of eight spermatogenic stages (see Table 5.1 ). Stage numbers are indicated within the bars.
99 84 Cordylus giganteus males emerged from winter hibernation during the period August to September. During September the mean testicular mass was at a minimum (x = 231 mg, SE = 36 mg; Fig. 5.2), exhibiting spermatogenic regression (stage 8; Fig. 5.3) The mean seminiferous tubule diameter was significantly reduced when compared to earlier months (Fig. 5.3). Most seminiferous tubules were lined (l-2 layers) with spermatogonia and SertoJi cells (Fig. 5.4A). In contrast to the Sertoli cells, the cell boundaries of the spermatogonia were well defined. The cytoplasm of the latter cells stained more intensely. Spermatogonia had granular, rounded nuclei and were considered to be resting. The Sertoli cells usually characterized by their larger vesicular nuclei exhibited very much reduced nuclei during stage 8. Lumina were occluded by a Sertoli syncitium in which residual spermatocytes, spermatids and spermatozoa were usually entrapped. Males collected in spring, following emergence from winter hibernation, exhibited stage l spermatogenic condition (Figs. 5.3B & 5.4B). The adjusted mean testicular mass and the diameter of the seminif erous tubules was lowest during stage l but not significantly different from stage 8 (Table 5.2). The epithelia of the seminiferous tubules were dominated by spermatogonia and Sertoli cells (Fig. 5.4B). Although the histological appearance of this stage is very much the same as stage 8, spermatogonia were more abundant and mitotic divisions were observed regularly. The intertubular tissue was characterized by a proliferation of Leydig cells (Fig. 5.4C). Spermatogenic stage 2 was characterized by spermatogonial mitosis, the appearance of primary spermatocytes (leptotene of prophase in meiosis I) and the formation of lumina in the seminiferous tubules with epithelia consisting of 3-4 cell layers (Fig. 5.4C & D). Intertubular tissue was more compressed between the closer lying tubules (Fig. 5.4C & D). The adjusted testicular mass and seminiferous tubule diameter remained unchanged when compared to stage l males (Table 5.2). Few males (n = 4) were found to be in this spermatogenic condition (Fig. 5.3).

. (D) October 1984 (stage 2, Table 5.1). (E) November 1984 (stage 3, Table 5.1). (F) January 1985 (stage 4, Table 5.")

100 Figure 5.4. Photomicrograph of seminiferous tubules showing seasonal change in spermatogenic activity for adult C. giganteus males. (A) August (stage 8, Table 5.1). (B) September 1984 (stage 1, Table 5.1). (C) October 1984 (stage 2, Table 5.1). (D) October 1984 (stage 2, Table 5.1). (E) November 1984 (stage 3, Table 5.1). (F) January 1985 (stage 4, Table 5.1). SG = spermatogonia; PS primary spermatocytes; SS = secondary spermatocytes; US = undifferentiated spermatids; MS = metamorphosing spermatids; SZ = spermatozoa; SC = Sertoli cel1s; IC = interstitial cells. All bars are 50 µtn unless otherwise indicated.
101 86 Although a gradual increase in testicular mass and mean diameter of the seminiferous tubules was evident (stage 3) during early summer, Tukey's multiple range procedure indicated that these increments were not significant when compared with previous stages (Table 5.2). Lumina were well formed, Sertoli nuclei and spermatogonia were located adjacent to the basement membrane, and the other germinal cells were arranged centrally in order of their development (Fig. 5.4E). In stage 3, primary spermatocytes outnumbered spermatogonia. Leptotene, zygotene and pachytene stages of meiosis I prophase were the most common stages of primary spermatocytes recognized. Secondary spermatocytes were rare but undifferentiated spermatids were occasionally present. The presence of transforming spermatids in stage 4, marked the onset of spermiation during mid-summer (Figs. 5.3 & 5.4F). In males exhibiting stage 4, a series of stages in the development of the spermatids involving reorganization of nuclear and cytoplasmic material and growth of the flagellum was recognizable. Nuclei varied in form, ranging from the initial invaginated, with the anteriorly situated acrosomal vesicle to the elongated rather slender nucleolus and the short flagellum just protruding from the spermatid. Secondary spermatocytes and undifferentiated spermati.ds were more abundant than primary spermatocytes although in some tubules the latter were still dominating. Intertubular tissue was very much compressed between the now larger seminiferous tubules (Table 5.2). The adjusted mean testis mass, however, was significantly greater during spermatogenic stage 4 when compared to previous stages (p < 0.05; Tukey's multipe range procedure; Table 5.2). Like stage 2 this stage was brief in duration. Compared to the preceding stages (1, 2 & 3) Tukey's multipe range procedure indicated that both adjusted testis mass and seminiferous diameter were significantly increased in males exhibiting stage 5 spermatogenic condition (p < 0.05; Table 5.2). The acceleration of the spermiogenesis process over cell division led to the abundance of metamorphosing spermatids and moderate amount of mature spermatozoa at the luminal side of the seminiferous tubule (Fig. 5.5A). Although reduced in numbers,

. (C) May 1984 (stage 7, Table 5.1). (D) June 1984 (stage 7, Table 5.1). (E) Epididymis of adult male collected in March 1984.")
102 81 Figure 5.5. Photomicrograph of seminiferous tubules and epididymis showing seasonal change for adult C. giganteus males. (A) February 1985.(stage 5, Table 5.1). (B) March 1984 (stage 6, Table 5.1). (C) May 1984 (stage 7, Table 5.1). (D) June 1984 (stage 7, Table 5.1). (E) Epididymis of adult male collected in March (F) Portion of epididymis exhibited in (E).
103 88 divisions were still occurring in some spermatocytes. It was noteworthy that stage 5 was the rule in February 1985 compared to stage 6 in February 1984 (Fig. 5.3). Maximum mean adjusted testicular mass and diameters of seminiferous tubules in autumn coincided with the peak of spermiogenesis in stage 6 (Table 5.2). The seminiferous epithelia were dominated by advanced metamorphosing spermatids and mature spermatozoa were in abundance on the luminal side (Fig. 5.5B). Free spermatozoa filled the lumina of the seminiferous tubules. The epithelium of the seminif erous tubule was reduced in height and divisions in spermatocytes rarely seen (Fig. 5.5B). During late autumn, prior to hibernation, the decrease in testes size and diameter of the seminiferous tubules marked the onset of testicular regression (stage 7; Table 5.2; Fig. 5.3). The seminiferous epithelia appeared thickened with hardly any lumen visible (Fig. 5.5C). However, it must be noted that the diameters of the seminiferous tubules were significantly reduced during stage 7 (p < 0.05; Tukey's multipe range procedure; Table 5.2), which may indicate contraction of the tubule rather than proliferation. Spermatozoa are still abundant on the luminal side of the seminiferous epithelium and in the lumen although it was in some cases rather problematic to decide whether regression had in fact started (Fig. 5.5D). Transforming spermatids were reduced in numbers. Spermatogonia and primary spermatocytes (all stages up to pachytene) were abundant close to the basement membrane (Fig. 5.5D) Plasma Testosterone ANOV A indicated that, in spite of considerable individual variation, significant monthly variation occurred in plasma testosterone concentrations. (F(14,80) = 6.27; p < 0.05; Fig. 5.6) and spermatogenic stages (F(7,80) = 15.18; p < 0.05; Fig. 5.7). It is evident from Figs. 5.6 and 5.7 that plasma testosterone levels peaked twice during the testicular cycle. Firstly, during the peak spermiation period (February, March and April) and stages (stages 5 & 6) plasma testosterone increased significantly (Figs. 5.6 & 5.7; Tukey's multipe range procedure; p < 0.05). Plasma testosterone levels rapidly decreased during May 1984 and was hardly detectable during the winter hibernation
104 89 PLASMA TESTOSTERONE (ng/ml) 7~~~~~~~~~~~~~~~~~~~~~~~~~~~~--, 6 a 5 a a a a F M A M J J A S O N D J F M A 1984 MONTHS 1985 Figure 5.6. Monthly variation (mean _±_ lse) in the total plasma testosterone concentration during the annual reproductive cycle of male C. giganteus. Values with different superscripts are significantly different (Tukey's multiple range test). Sample sizes are given in Fig PLASMA TESTOSTERONE (ng/ml) a,b 4 T SPERMATOGENIC STAGE Figure 5.7. Changes in the plasma testosterone concentrations (means.± SE) a~sociated with spermatogenic stages (Table 5.1) in male C. giganteus. Values with different superscripts are significantly different (Tukey's multiple range test). Sample sizes are given in Table 5.2.
105 90 period (Fig. 5.6). Secondly, another significant increase in plasma testosterone levels during September 1984 occurred (p < 0.05; Fig. 5.6). This relatively brief increase in plasma testosterone levels coincided with a stage 1 spermatogenic condition (early recrudescence) (Figs. 5.3 & 5.7) at a time when both the adjusted mean testicular mass and mean seminiferous tubule diameters are at a seasonal low (Figs. 5.2 & 5.3). The plasma testosterone levels dropped during the mid-summer months, November and December (Figs. 5.6 & 5.7; stages 2, 3 & 4) Accessory Ducts deferens. Seasonal variation was studied only in the ductus epididymidis and the ductus ANOVA indicated that the epithelium of the ductus epididymidis changed significantly in height among collection months (F(14,88) = 14.5; p < 0.05; Fig. 5.8A) and testicular spermatogenic stages (F(7,88) = 24.28; p < 0.05; Table 5.3). During hypertrophic condition during late summer and autumn months (Fig. 5.8A), the epithelial cells became tall columnar and occasionally pseudostratified-columnar, mainly as a result of the increase in cytoplasm (Fig. 5.5E & 5.5F). The cytoplasm of the epithelial cells stained eosinophilic and no large voluminous secretions were obvious, only small sized secretion granules. Intertubular connective tissue was poorly developed in all regions of the epididymis (Fig. 5.5E). In contrast, during testicular regression, the epithelial cells were significantly decreased in height (Fig. 5.8A; p < 0.05) and devoid of secretion granules (Fig. 5.9A). The appearance of the epididymis epithelium was that of low columnar or pseudostratified columnar without cilia or stereocilia (Fig. 5.9A). The epididymis during testicular regression and early recrudescence period was characterized by a marked increase of connective tissue in the intertubular region (Figs. 5.9A & 5.9B). Apart from the midsummer months, December, January and February, all other months were marked by abundant spermatozoa mixed with eosinophilic secretions (Figs. 5.9A & 5.98) in the lumen, of the ductus epididymidis (Fig. 5.8A).
106 91 'fable 5.3: Variation in mean epithelial cell heightl of ductus epididymidis and anterior regions of ductus deferens by spermatogenic stage in c. giganteus. Sexual segment activity 2 is also indicated. Epithelium cell height (u) Stage n d. epididymidis d. def erens sexual segment ± Ll8ab 6.08 ± o.04ab atrophic ± o. 76ab 6.04 ± o.02ab atrophic ± 0.53a 5.49 ± 0.28a atrophic ± o.89ab 6.02 ± o.02ab atrophic ± 4.ooab 8.80 ± 1.44abc - hypertrophied ± 1.29c 11.9 ± 0. 70C hypertrophied ± 2.21b 9.65 ± o,91bc hypertrophied ± 2.07ab ± 0.17a atrophic 1 Different superscripts indicate significant difference (p < 0.05) among means (Tukey's multiple range test). 2 "hypertrophied" if abundant secretion granules were visible in the apical cytoplasm of the collumnar cells as well as the lumen of the tubule and "atrophic" if no secretion granules were visible.
107 92 EPITHELIUM HEIGHT (U) PERCENTAGE ~~-..,..~~~~~--,-~~~~~~~~~~~~~~-o====i ~~~.L...u...<-<-<.-L-L..<-L-.<JJ..L.J...L..<'-L-L....L,a...L..L...L...LJ.:.LLIL..L...'-'-1-.L..L...c-='-LLL..L..~.LIL.LLL:.LL.LLA 0 F ~ A M J J A S 0 N D J F M A 1984 MONTHS Figure 5.8. Monthly variation in the mean cell heights in the accessory ducts during the male reproductive cycle of C. giganteus. (A). Ductus epididymidis. (B). Ductus def erens. The hatched area.indicates the percent males in the monthly sample that contained spermatozoa in their accessory ducts. Monthly sample sizes are given in Fig. 5.2.

 Epididymis of adult male collected in December 1984.")
 Portion of ductus deferens of adult male collected in October 1984.")
108 Figure 5.9. Photomicrograph of epididymis, ductus deferens and lddney sexual segment showing seasonal change for adult C. giganteus males. (A) Epididymis of adult male collected in September (B) Epididymis of adult male collected in December (C) Portion of ductus deferens of adult male collected in March (D) Portion of ductus deferens of adult male collected in October (E) Portion of kidney sexual segment (KSS) of adult male collected in March (F) Kidney sexual segment of adult male collected in September L = lumen; SG = secretory granules; NT = nephronic tubule.
109 94 Seasonal variation in the ductus deferens was only studied in. the proximal part, up to the cranial end of the kidney. Like the ductus epididymidis, the ductus deferens is strongly convoluted in its proximal part. No sharp limit is found between these two ducts. The ep(thelium became gradually lower and the lumen larger. Epithelial height in the ductus def er ens varied significantly during the reproductive cycle among the collection months (F(14,88) = 13.63; p < ().05; Fig. 5.8B) and the testicular spermatogenic stages (F(7,88) = 9.66; p < 0.05; Table 5.3). The epithelium of the ductus deferens significantly increased in height during the peak spermatogenic period (March - April 1984 vs June - December 1984; p < 0.05; Fig. 5.8B). columnar appearance (Figs. 5.9C & 5.9D). The epithelial cells varied from a cuboidal to low The cytoplasm of the epithelial cells was generally devoid of secretory granules (Fig. 5.9C & 5.9D). The lumen of the ductus def erens was filled with spermatozoa and eosinophilic secretions for most of the year except in the late summer months (Figs. 5.9C, 5.9D & 5.8B) Renal Sexual Segment The renal sexual segment in C. giganteus constitutes the secondary collecting ducts of the renal tubule ( nephron ). The epithelium of the sexual segment consists of columnar cells (Figs. 5.9E & 5.9F). Coinciding with the peak spermiation period and elevated testosterone levels (February, March & April; Figs. 5.3 & 5.7) the apical cytoplasm was filled with large densely eosinophilic secretion granules and the cell boundaries were not conspicuous (Fig. 5.9E, Table 5.3). The lumina of the tubules were filled with the densely eosinophilic secretion which made it impossible to measure cell height accurately (Fig. 5.9E). Following spermiation (May January 1985) the presence of the secretion granules diminished and the cytoplasm was either homogeneous, staining eosinophilic, or in some cases vacuolated (Fig. 5.9F). The appearance of the epithelium was more basophilic than the overwhelming eosinophilic appearance in the active season.
110 Climatic Correlates When data for all 15 months were considered, the product-moment correlation between testis mass of males and four (TMAX, TMIN, TA V & PHOTO) of the six environmental variables were significant (p < 0.05). For the regression data set, three of the six, and for the recrudescent data set, four of the six correlations were significant (p < 0.05). In only two of the six multiple regression analyses, using testis mass (TMASS) and mean seminif erous diameter (SEMI) as dependent variables, did more than a single environm~ntal enter the regression model (Table 5.4 ), a reflection of the intercorrelation among the environmental variables, as confirmed by subsequent examination of the partial correlations. Results of the multiple regression analysis indicated that for the regressive data set, photoperiod (PHOTO) was the best predictor of testis mass, explaining 82% of the variation (Table 5.4 ). For the recrudescent data set temperature (TMAX) covaried significantly with testis mass, explaining 52 % of the variation in mean monthly testis mass (Table 5.4 ). For the full data set, temperature (TMAX) explained only 22 % of the monthly variation in testicular mass. Although mean seminiferous tubule diameter (SEMI) covaried significantly with mean testicular mass (TMASS; p < 0.05), the former may be a better indicator of testicular activity. Both photoperiod (PHOTO) and temperature (TMIN) entered the multiple regression model in the recrudescent data set (Table 5.4 ). In the regressive data set model temperature (TMIN and TMAX) seem to be the best predictor of mean seminiferous tubule diameter (SEMI)(Table 5.4). For the full data set, only temperature (TMAX) covaried with mean seminiferous tubule diameter (SEMI), but it explained only 8% of the variation (Table 5.4 ) Male-Female synchronization A summary of the timing of reproductive events in both male and female C. giganteus is presented in Fig It is evident that males and females exhibit gonadal activity at different times of the year.
111 96 Table 5.3. Results of multiple regression analysis of mean testis mass (TMASS) and mean seminiferous tubule diameter (SEMI) on environmental variablesl. Regression equation Step Variable R Recrudescent data (September-April, 1984, 1985) TMASS = TMAX 1 TMAX o.12oa SEMI= PHOTO 1 PHOTO 0.871a + 9TMIN 2 TMIN 0.972a Regressive data (February-September, 1984, 1985) TMASS = PH OTO 1 PHOTO 0.904a SEMI = TMAX 1 TMAX TMIN 2 TMIN 0.924a All the data (February 1984-April 1985) TMASS = TMAX 1 TMAX SEMI= 24 + lltmax 1 TMAX (TMAX = mean monthly maxfmum temperature; TMIN = mean monthly minimum; PH OTO = mean monthly daylight hours; RAIN = total monthly rainfall) a p < 0.05
112 97 SPERMATOZOA REGRESSION SPERMIOGENESIS SPERMATOGENESIS - PARTURITION GESTATION- OVULATION - VITELLOGENESIS NONREPRODUCTIVE FEMALES J F M A M J J A S 0 N D Figure Summary diagram indicating annual reproductive events in female and male C. giganteus lizards.
113 DISCUSSION The annual spermatogenic cycle in male C. giganteus follows the pattern described by Vosloe (1944) as postnuptial and by Saint Girons (1982) as aestival. In C. giganteus, as in most species that exhibit the postnuptial pattern, testis mass is lowest in spring at the \ onset of spermatogenesis and reaches maximum size at the time of peak spermiogenesis activity during late summer or autumn. In contrast, C. giganteus females exhibit a prenuptial ovarian cycle, in which the onset of vitellogenesis occur in autumn with ovulation in spring after emergence from winter hibernation (see Chapters 3 & 4 ). Spermiation in C. giganteus males begin in mid-summer and sperm are stored through winter until early summer in both ductus epididymidis and ductus def erens. C. giganteus exhibit a postnuptial cycle close to that described for temperate turtles (Moll, 1979; Licht, 1984; Mitchell, 1985; Brewer & Killebrew, 1986), and snakes (Shine, 1977; Saint Girons, 1982, 1985; Krohmer & Aldridge, 1985; Krohmer et al., 1987). Postnuptial spermatogenesis appears not to be a common phenomenon in lizards. The oviparous Sceloporus undulatus (McKinney & Marion, 1985a) displayed summer spermatogensis with subsequent sperm storage until mating in the following spring and Jameson (1988) suggested that many other mid-latitude oviparous iguanid lizards may have similar patterns. The S. undulatus post nuptial cycle differs from the basic postnuptial cycle (Vosloe, 1944) in that spermatogenic recrudescence is only completed after winter followed by a brief midsummer rather than autumn-winter regression (McKinney & Marion, 1985a). In the live bearing iguanids, S. jarrovi (Goldberg, 1976), S. grammicus (Guillette & Casas-Andreu, 1980) and S. formosus (Guillette & Sullivan, 1985) testicular activity, like that of C. giganteus, commenced in spring, spermiation culminated in summer followed by possible sperm storage in the epididymis or ductus deferens until mating. Although the precise time of the mating period could not be ascertained for C. giganteus, the magnitude of sperm storage in the epididymis decreased after males emerged from hibernation in September. Field observations of frequent male-female interactions following emergence in spring, spring ovulation in females and the appearance of juveniles in late summer may further support a spring mating period. The possibility of mating prior
114 99 to hibernation, coinciding with peak spermiation and the onset of vitellogenesis in the C. giganteus females with subsequent sperm storage in the female oviduct until ovulation in spring cannot be excluded in C. giganteus. Although male-female interactions have been observed in autumn at the time of spermiation (van Wyk, unpublished data), autumnal mating in C. giganteus females needs confirmation since evidence showing successful copulations or oviducal sperm storage through winter is still lacking. In terms of an autumn mating period, spermatogenesis in C. giganteus could also be categorized as prenuptial. Licht (1984) mentioned that such a situation may exist in many turtles and snakes that have multiple mating seasons, usually one in spring and one in autumn. Shine (1977) and Saint Girons (1985) suggested autumnal and spring mating periods for several snake species exhibiting postnuptial or aestival spermatogenesis. For a single mating period in spring, sperm storage in the postnuptial pattern would be an indispensable precondition, and in a dual phase mating system, sperm storage in the vaginal tube of the female is necessary to ensure fertilization of the clutch in spring (Saint Girons, 1985). Just as there is an absence in the literature of information on lizards exhibiting a postnuptial cycle, only a few studies relate plasma testosterone levels to seasonal reproductive events in male lizards (see Licht, 1984; McKinney & Marion, 1985b). Seasonal variation in plasma testosterone levels in C. giganteus indicate two clear elevations, one coinciding with spermiogenesis in late summer and autumn, and a second brief peak during spring just after emergence. The two peaks in plasma testosterone found during the annual cycle of C. giganteus coincide with two important parameters in the reproductive cycle of this lizard; spermiogenesis and the mating period. Similar to reports for other reptiles exhibiting postnuptial cycles (Lance, 1984; McKinney & Marion, 1985b; Krohmer et al., 1987), the coincidence of high plasma testosterone levels in C. giganteus with recrudescence and culminative testicular phases, suggest that testosterone may be important for the completion of spermatogenesis. In lizards and snakes exhibiting prenuptial spermatogenic cycles, a single plasma androgen peak is generally measured at the time of maximum spermiogenesis (see Lofts, 1987 for a review).
115 100 '- The spring peak in plasma testosterone on the other hand occurs at the time of mating, which also coincides with female ovulation. Androgens have been implicated in the control of mating in many species of reptiles (Norris, 1987), although Crews (1984} pointed to the potential dissociation of mating behavior from high androgen levels in squamates. In the only other cordylid studied, C. polyzonus, similar biphasic plasma testosterone and androstenedione profiles were measured (Flemming, 1988). In the case of C. polyzonus the two plasma testosterone peaks, however, coincided with the onset of spermatogenesis in autumn and peak spermiation in spring respectively. A similar biphasic plasma testosterone cycle was reported in the chelonians, Chrysemys picta (Callard et al., 1976), Testudo harmanni (Kuchling et al., 1981), the snakes Nerodia sipedon (Weil & Aldridge, 1981), Thamnophis sirtalis (Weil, 1985) and Opheodrys aestivus (Aldridge et al., 1990). However, in other reported postnuptial cases, like the turtle, Pelodiscus (Trionyx) sinensis (Lofts & Tsui, 1977) and snakes Ptyas korrus (Licht, Tsui & Lofts, unpublished, quoted by Licht, 1984) and Agkistrodon piscivorus (Johnson et al., 1982), plasma testosterone only peaked in autumn at the time of maximum testicular mass. Because the rise in C. giganteus plasma testosterone levels occurs at a time when mean testicular mass is at a seasonal minimum, the origin of this testosterone remains obscure. Possibilities include: intertubular synthesis by Leydig cells, intratubular synthesis by Sertoli cells, or an extratesticular origin (dizerega & Sherins, 1981). Whether either of the latter two possibilities could alone be the origin of the spring rise in plasma testosterone levels in C. giganteus seems doubtful, but preliminary observations in both the cordylids, C. giganteus and C. polyzonus (Flemming, 1988) indicate that intertubular Leydig cejls are proliferated during the initial recrudescent period, coinciding with the secondary peak in plasma testosterone. In C. giganteus, however, no significant seasonal variation could be detected in the size of the Leydig cell nuclei. Abts (1988) reported increased size and incidence of eosinophilic cytoplasmic granulation during the spring breeding period in the lizard, Sauromalus obesus, but did not find a seasonal increase in nuclear diameter or cell number. Licht ( 1984) points to all the problems that may be associated with the evaluation
116 101 '- of testicular steroidogenesis using some cytological characteristics of Leydig cells and it is evident that more research is needed to substantiate the seasonal steroidogenic nature of both the Leydig and Sertoli cells in species exhibiting a biphasic plasma testosterone cycle. Weil & Aldridge (1981) discussed the possibility of the high testosterone levels during spring being the byproduct of low metabolic clearance. They suggested that this is possible if the plasma testosterone peak occurs immediately after emergence, but seems rather unlikely if the peak occur later during spring, as was the case in C. giganteus. The bulk of our knowledge today indicates that the epithelium height and secretory activity of the reptilian epididymis, like that of mammals, are androgen dependent ( Gigon Depeiges & Dufaure, 1977; Haider, 1985; Morel et al., 1986; Shivanandappa & Sarkar, 1987). Specific epididymal androgen concentrating cells have been identified and seasonal variations in sensitivity indicated (Dufaure & Chambon, 1978). Dufaure & Saint Girons (1984) categorized five types of ductus epididymidis in Squamata, ranging from a type with abundant and voluminous secretions marked by big secretory granules as in Lacertidae, to a type lacking secretory granules despite a hypertrophied epithelium as in Ophidia. They did not include members of the Cordylidae in their comparative study, but when compared to those of the other families studied by them, epididymal secretions of C. giganteus can be classified as an intermediate type with a ductus epididymidis similar to members of the Agamidae and Gekkonidae. High plasma testosterone levels during peak spermiogenesis in late summer and early autumn coincided with a dramatic increase in the height of the epididymal epithelium in C. giganteus. Coincident with the winter testicular regression decreasing plasma testosterone levels and large quantities of stored sperm in the epididymis, however, was a marked decline in secretory activity as well as epididymal epithelium height. The rise in plasma testosterone levels in spring appeared not to have any effect on the epididymal function in C. giganteus. It is important to note that although maximum epithelial height and secretory activity generally corresponded to elevated plasma testosterone levels in several lizard species, Arslan et al. ( 1986) and Haider & Rai ( 1987) suggested that it may rather be gonadotropins like FSH that play a role in the process leading to epididymal hypertrophy in the seasonal breeding lizard.
117 L The epithelial height of the ductus deferens in C. giganteus did change in parallel with that of the epididymis, and maximum height coincided with elevated plasma testosterone levels. Although very few reports deal with the secretions of the ductus deferens, Norris (1987) suggests that testosterone stimulates growth and secretion production in the ductus deferens of lizards. Cheng & Lin (1977) on the other hand, did not find significant seasonal hypertrophy in the ductus deferens of the lizards they studied. The absence of visible secretory granules in the epithelial cells of the C. giganteus ductus def erens, however, questions the functional significance of this structure, apart from being a storage organ for spermatozoa. The renal sexual segment of C. giganteus is confined to the secondary collecting ducts of the renal tubule and only showed pronounced secretory activity during the peak spermiation period, which coincide with elevated plasma testosterone levels in autumn. The functional significance of the squamate renal sexual segment remains speculative, although Prasad & Reddy ( 1972) suggest it to be homologous to that of seminal vesicles of mammals. It has been inf erred that the sexual segment secretions could provide nutrients for spermatozoa (Cuellar et al., 1972) or be involved in the formation of a copulatory plug after mating (Vosloe, 1944; Ross & Crews, 1977). The seasonal cycle of the renal sexual segment is well established in snakes (Saint Girons, 1982). Hypertrophy of this epithelium correlates with the mating season and respond to exogenous androgens (see Prasad & Reddy, 1972; Krohrner et al., 1987; Norris, 1987). Saint Girons (1982) stated that the sexual segment is hypertrophied in spring and autumn or fall and is, regressed in midsummer in snakes with aestival or postnuptial spermatogenic cycles. However, the occurrence of mating during fall or autumn may not be the rule even though a bimodal plasma testosterone cycles were reported for the snakes, Opheodrys aestivus (Aldridge et al., 1990) and Nerodia sipedon (Weil & Aldridge, 1981). In contrast with the hypothesis that hypertrophy of the sexual segment is associated with the mating period, the sexual segment in C. giganteus was only briefly hypertrophied during and after peak spermiation prior to hibernation. During the remaining part of the annual cycle, in particular the spring mating period, the epithelium remained atrophic.
118 103 The fact that the sexual accessory structures like the renal sexual segment and the ductus epididymidis in C. giganteus showed a monophasic cycle in contrast to the biphasic plasma testosterone cycle, may point to the temporal separation of secondary sexual structures from deterministic hormonal factors, as suggested by Crews ( 1984) who discussed mating behaviour in the absence of high testosterone levels. In the case of C. giganteus, the brief plasma testosterone peak measured after emergence in spring did not affect the morphological and physiological status of the sexual accessory structures, but it may have initiated male mating behavior in spring around the ovulation period of the females. Studies regarding the coordination of reproductive activity in reptiles have focussed on a variety of environmental factors such as photoperiod, moisture, temperature, nutrition and also social interaction that could act as cues (see Duval et al., 1982; Licht, 1984 for reviews). Spermatogenic recrudescence in C. giganteus, correlates significantly with increasing ambient temperatures and photoperiods, two variables known to covary, and making it hardly possible to discriminate between the role either of these variables may play to initiate recrudescence. As for most reptiles, spermatogenic recrudescence and subsequent culmination in C. giganteus is confined to the relatively warm conditions of summer (Saint Girons; 1985). Flemming (1988) and Van Wyk (1989; 1990) showed that in the cordylid lizard, C. polyzonus spermatogenic recrudescence and vitellogenesis correlated with autumn conditions (declining ambient temperatures and photoperiod) and closely followed the results reported for a laboratory study by Marion (1982). From this study Marion (1982) concluded that temperature was the primary environmental cue coordinating testicular events in Sceloporus undulatus. Testicular regression in C. giganteus coincided with decreasing photoperiod and ambient temperatures. Licht (1984) mentioned a similar situation for Anolis lizards and pointed to a possible synergism between temperature and photoperiod to act as a trigger for the onset of regression. In contrast, testicular regression in C. polyzonus was accelerated by warmer temperatures, similar to other prenuptial species that start
119 104 reproductive activity in autumn (Flemming, 1988; van Wyk, 1990). Noteworthy, is the onset of vitejjogenesis in C. giganteus females during the cool environmental temperatures of autumn (Chapters 3 & 4), suggesting that the male and female reproductive cycles may be responsive to different environmental cues. The influence of rainfall on nutrition (energy balance) as a mechanism to fine tune the timing of reproductive events in a postnuptial species like C. giganteus, of which females are now known to breed biennially (Chapter 3), cannot be ruled out and needs further investigation. The fact both postnuptial and prenuptial strategies are followed by members of the genus Cordy/us, distributed mainly in southern Africa, raises questions regarding the evolutionary histories of the species and the shaping of reproductive tactics. However, Licht ( 1984) suggests that the actions of both temperature and photoperiod in controlling the timing of the gonadal cycle may be highly variable among species. Shine ( 1977) concluded in his study of Australian elapids that the seasonal timing of spermatogenesis, and the duration of retention of spermatozoa in the ductus def erens, may be adaptive to the seasonal timing of mating activity and that any interpretations, therefore, of interspecific differences requires an understanding of the selective forces determining the times of onset and cessation of mating activity. It is important to realize that reproduction is closely linked to events like seasonal fat deposition and hibernation when attempting to understand reproductive patterns (Whittier & Crews, 1987). Maximum fat body deposition in male C. giganteus occurred during testicular regression prior to hibernation and was dramatically reduced during winter. The high energy demands of spermiogenesis depleted a second fat body buildup, following the spring mating period, during mid-summer (see Chapter 7). The postnuptial tactic may be an important prerequisite for this large, viviparous species subjected to an interseasonal hibernation period. This would allow for early mating (fertilization) in spring ensurmg m this way for embryonic development to be completed before the next hibernation.
120 105 Reproductive asynchrony between males and females has been reported previously (see Mendez de la Cruz et al., 1988) although cases, as in C. giganteus, of males exhibiting postnuptial and females prenuptial reproduction, are rare. Male reproduction in C. giganteus is positively correlated with photoperiod and ambient temperature whereas ovarian activity is negatively correlated with these factors (Chapter 3). In C. polyzonus both male and female reproduction were well synchronized, with the onset of reproduction in late summer-autumn (Flemming, 1988; Van Wyk, 1979). Asynchrony suggests that C. giganteus males and fem ales either use different environmental cues or use the same cues differently to time reproductive events (Guillette & Casas-Andreu, 1980; Mendez de la Cruz et al., 1988). successful mating. Related to reproductive asynchrony must be strategies to ensure Postnuptial spermatogenesis is also associated with prolonged sperm storage in C. giganteus males until the time of ovulation in females. Although a seasonal bimodal testosterone profile may explain male mating behavior during testicular regression, autumn mating at the onset of vitellogenesis in females with subsequent oviducal sperm storage until ovulation in spring, as reported for other lizards (see Guillette & Casas-Andreu, 1980; Mendez de la Cruz et al., 1988), can not be excluded in C. giganteus. However, this would implicate dissociated female reproductive behavior, as plasma estradiol levels during autumn were relatively low in C. giganteus females. Clearly this phenomenon calls for a more detail study. In addition to the need to establish the role of environmental factors in the control of C. giganteus reproduction, evolutionary or ecological models are needed to explain how and why reproductive asynchrony between male and female C. giganteus cycles evolved. In conclusion, C. giganteus exhibits postnuptial spermatogenesis, a strategy not often encountered in temperate zone viviparous lizards. Spermatogenesis occurs in summer culminating in autumn. Sperm is stored through winter hibernation until mating in spring. Elevated plasma testosterone levels and hypertrophy of the sexual segment in the kidney as welj as epididymal epithelium occur in late summer. A second rise in plasma testosterone levels in spring may facilitate mating behavior at a time when the testis size is at a mm1mum.
121 106 CHAPTER SIX FEEDING ECOLOGY 6.1. INTRODUCTION One of the basic assumptions of most optimal diet models is the maximization of the net rate of energy intake (see Stephan & Krebs, 1986). Although reptiles are ectotherms, with energy requirements and hence food consumption rates very much lower than endotherms (Stamps et al., 1981; Nagy, 1983; Pough & Andrews, 1985), energy flow may still be one of the most important determinants of their life history strategies and intra- and interspecific dietary differences may simply reflect local differences in food availability rather than resource selection (Arnold, 1987; Diaz & Carrascal, 1990). In the field, the relationship between food choice and food abundance may be studied using selectivity measures (Chesson, 1979). These measures usually reflect the relationship between the proportion (frequency of numbers) of a given food type in the diet (r) and the proportion of that same food type in the environment (p). As r increases relative to p, selectivity increases (see Chesson, 1978; Stamps et al., 1981). When considering this relationship between selectivity and abundance of prey, three types of theoretical models make implicit predictions (see Stamps et al., 1981 for review). Firstly, the prey switching models predict that if prey switching occurs, selectivity for a given prey taxon will be positively correlated with the relative abundance of that taxon (Murdoch et al., 1975). Secondly, energy optimization models (Pyke et al., 1977; Sih, 1979) suggest that the relationship between selectivity and abundance will depend on the value of a particular prey taxon. For the high-valued foods, selectivity should be constant or increase with an increase in the food's abundance. Thirdly, nutrient optimization models (Pulliam, 1974, 1975; Westoby, 1978; Stamps et al., 1981) assume that animals need a balanced diet for
122 107 optimal health, growth a~d reproduction. These models predict that selection for a given prey taxon will not be correlated with the relative abundance of that prey taxon in the environment. Instead these models predict that selectivity will tend to be negatively correlated with relative abundance of nutritionally important foods. It is therefore of interest to consider the relationship between prey consumption and availability on a local scale in order to reveal the criteria, if any, adopted by lizards when making foraging decisions (Stamps et al., 1981; Diaz & Carrascal, 1990). Individual foraging success can be readily estimated from the volume or mass of food in the alimentary canal (Ballinger, 1977; Dunham, 1980; 1983), and may provide valuable information to explain seasonal variation patterns in several other ecological and physiological related parameters (e.g. reproduction, energy reserves, growth etc.) Resource availability may be one of the most important factors determining individual foraging success (see Dunham, 1980 for review). Individual lizards may respond to seasonal variation in resource availability in two different ways (Dunham, 1980). The first would be to increase foraging effort resulting in little, if any, reduction in mean mass of food in the stomach, size specific body mass or lipid storage during times of food shortage. The other potential response to periods of food stress would be to maintain or reduce foraging effort which would result in a decrease in the mean mass of food in the stomachs, of size-specific body mass and lipid stores. This chapter deals with the feeding ecology of C. giganteus. Other than a few anecdotal comments (FitzSimons, 1943; de Waal, 1978; Marais, 1984; Jacobsen et al., 1990), little is known about the foraging ecology of C. giganteus. In light of the conservation status of this species and recent attempts to relocate threatened populations, as well as the seemingly important role of internal energy reserves in successful reproduction in fem ales (see Chapters 1, 3 & 7), information on the feeding ecology of this species is long overdue. The objective of this study is to analyze foraging success, dietary composition, trophic overlap and prey selection patterns among sex and age classes on a seasonal basis.
123 MATERIAL AND METHODS Study Area and Lizards Lizards for this study were collected monthly on the farms Fraserspruit and Greenlands from February 1984 to April For details on the location, physical and climatological aspects of the study area see Chapter 2. Field collection and autopsy procedures were as described in Chapters 2 & Stomach Content Analysis On removal of the alimentary canal, the contents of the stomach, small intestine and hind-gut (rectum) were weighed (to the nearest 0.1 mg) and preserved in 10% buffered formalin. Later, the contents of each stomach was examined under a dissecting microscope. The contents of the intestine (usually very few items) and hind-gut were not examined. Different arthropod taxa and/ or developmental stages (larvae, pupae, adults) were considered as prey types. Prey items were identified with the aid of a reference collection and a reference work on southern African insects (Scholtz & Holm, 1985). The total number of each prey OTU (operational taxonomic unit) found in each stomach was recorded. The presence of each prey OTU in each stomach was used to calculate a percent occurrence. For each stomach the prey OTU's were sorted together and dried to constant weight in a 60 C oven. Dry weights of the cooled samples were determined to the nearest 0.1 mg. Lizards were grouped according to sex and age: (1) adult males ( mm SVL), (2) adult females ( mm SVL), (3) juveniles (90..: 169 mm SVL) and (4) hatchlings (60-90 mm SVL). Monthly samples were pooled into seasonal samples. Total number and dry mass contributions of each prey OTU were computed. Relative frequencies of numbers and dry mass of prey OTU's were tabulated. Food niche breadth was calculated using the Simpson's (1949) diversity measure : n., B =! 1/ z /1;2, ;, where P is either the relative number or dry mass of the ith prey category in i- I the sample. B ranges from 1.0 when the lizard group uses one resource state exclusively, to N (the number of prey OTU's utilized), when the sample uses all resources in equal
124 109 proportions. The evenness component of diversity (B/Bmax) was calculated by dividing niche breadth (B) by the maximum number of prey OTU's (R) in the seasonal sample and subsequently termed standardized niche breadth (B') (Dunham, 1983). B/Bmax ranges from 1/R for the former case to 1.0 for the latter. Food niche overlaps between sex and age classes were computed using Pianka's (1973) symmetric measure: n n 1: P;/ 1: p;/ i-1 ;- I where Jij is the relative value of prey OTU i in the diet of lizard class j and fik is its relative value in lizard class k, n is the total number of prey OTU's. In order to determine whether lizards selected prey according to taxonomic group, I used Ivlev's electivity index (IE; lvlev, 1961): IE= (Ps -Pa)/(Ps +Pa), where P s is the proportion of the considered prey category in the stomachs and Pa is the proportion of the same category in the environment. This simple index varies monotonically between -1 and + 1; negative values indicating prey rejection (P s < Pa), a value of zero shows the prey is chosen as encountered in the environment (P s = Pa), and positive values indicated that prey is taken in a proportion greater than it occurs in the environment (P s > Pa> In addition I calculated Bryant's (1973) selectivity index (D): log (Ps + 1) x 100/log (Pa+ 1), where values greater than 100 indicate selection for that item and values less than 100 either indicate a tendency to avoid an prey item or its unavailability.
125 Food Resource Abundance Two methods were used to estimate the abundance of potential prey. Twenty five unbaited plastic bowls (diameter = 175mm; depth = 145mm) were buried with their open ends flush with _the ground surface. The traps were placed in a grid (5 X 5), one meter apart, in an area adjacent (1 kilometer away) to the collecting site; Monoethylene-glycol was used as a preservative; Hardboard lids to prevent predation and excess debris from landing in the traps were placed on top of the open bowls. The lids were positioned to provide sufficient clearance for passage of arthropods. The traps were serviced on the day before the lizards were collected for each monthly sample (see Chapter 2). In addition to the pitfall traps, hand collecting was done by 5 persons on the day before the lizard collecting. Arthropods were collected as encountered in the grassland adjacent to the collecting site. Comparing the pitfall data with that of hand collected data, indications were that the pit fall traps underestimated the abundance of certain ground living Coleoptera. Both estimates were, therefore, used when evaluating seasonal arthropod abundance Validation In order to determine what sample size can be considered representative of the diet of C. giganteus in the study area, accumulated prey diversity was plotted as a function of number of stomachs examined (randomly chosen from the total sample). The diversity became stable at a low number of stomachs (15-20 stomachs) in both the male and female sub-samples. In light of the 272 stomachs studied, subsamples based on sex and age classes were used in the analysis.
126 RESULTS Foraging Mode Field observations revealed that C. giganteus may be categorized as a typical sit-andwait feeder. The lizards relied on visual senses to locate the prey item and feeding activities were mostly confined to the area close to the burrow (± 2m radius). Occasionally individuals would feed further from the burrow, usually when flying ants (Hymenoptera) emerged Seasonal Changes in Mass of Contents of the Alimentary Canal Stomach contents.- Seasonal variation in the monthly mean wet mass of the stomach contents of adult males, females, juveniles and hatchlings (yearlings) are presented in Figs. 6.1 & 6.2. There were significant correlations (r = ; p < ) between the mean wet mass of food in the stomachs of males, females, juveniles and hatchlings on comparable sampling dates. In all four groups ANCOV A indicated significant (p < 0.005) seasonal variation in the mean wet mass of stomach contents (see Figs. 6.1 & 6.2). Stomachs were generally devoid of any prey items during the winter hibernation period. On emergence in spring the monthly mean wet mass of the stomach contents increased dramatically in all groups (Figs. 6.1 & 6.2; p < 0.005). In both the adult (males and females) and the juvenile groups a significant (p < 0.005) decrease in the monthly mean wet mass of stomach contents occurred during November. During the autumn months the mean mass of the stomach contents in all lizards were smaller than the preceding summer months (Figs. 6.1 & 6.2). There were also significant correlations (r = ; p < 0.005) between the monthly mean mass of food in the stomachs of these lizards and the hand collected estimates of prey abundance, but not with the pit trap estimates of prey abundance (p > 0.05). The monthly mean mass of stomach contents in the lizards did not correlate significantly (p > 0.05) with mean monthly rainfall, but during 1984 increases in stomach content weights were generally associated with high rainfall in preceding months.
127 112 WET MASS (g) ~~~~~~~~~~~~~~~~~~~~~~~~~~ A MALE _. Hindgut -II- Stomach 8 B ADULT FEMALES...,._ Hindgut -II- Stomach F M A M J J A S 0 N D J F M A Figure 6.1. Seasonal variation in the monthly mean wet mass of the stomach contents and hind-gut contents of C. giganteus adult males (A) and females (B).
128 113 WET MASS (g) a.-~~~~~~~~~~~~~~~~~~~~~~~~~~----. A JUVENILES ( 2 yr+) Stomach -+- Hindgut 1.5 B HATCHLINGS -a- Stomach Hindgut F M A M J 1984 J A S 0 N D J F M A 1985 Figure 6.2. Seasonal variation in the monthly mean wet mass of the stomach contents and hind-gut contents of C. giganteus juveniles (A) and hatchlings (B).
129 114 Although February 1985 was marked by exceptionally high rainfall (150 mm) no significant increases in the monthly mean mass in stomach contents followed. Hind-gut content.-the monthly mean mass of prey remains in the hind-gut showed significant (p < 0.005) seasonal variation in all the lizards (Figs. 6.1 & 6.2). Peak values were measured in January 1985 in all lizards (Figs. 6.1 & 6.2). There was a significant correlation between the monthly mean mass of food in the stomachs and prey remains in the hind-gut in adult males, females and hatchlings (yearlings) on comparable collecting dates (r = ; p < 0.005). In juveniles this correlation was, however, not significant (r = 0.45; p > 0.1). In all lizards the monthly mean mass of the hind-gut contents correlated significantly with the hand collecting estimate of prey abundance ( r = ; p < 0.05) Composition of Diet General diet Analysis of the stomach contents of 480 C. giganteus revealed that the diet was almost exclusively made up of arthropods (Table 6.1, Figs. 6.3 & 6.4 and Appendix 1-11), with six of ten major taxa (Coleoptera, Diplopoda, Hemiptera, Hymenoptera, Orthoptera, and Lepidoptera) accounting for 80% of the total number and 90% of the gravimetric contribution of ingested food by the different age and sex groups (females, males, juveniles and hatchlings). A total of 24 prey categories were recognized, including 12 families of Coleoptera and four of Hemiptera. Coleoptera were the most important prey category, on either a numerical or a gravimetric basis, consumed by a11 lizards and at any time during the year (Figs. 6.3 & 6.4 and Appendix 1-11 ). These taxa had also a high frequency of appearance in the stomachs of lizard throughout the collecting period in the study area. (Table 6.1 ), thereby excluding the possibility of biasing the results with the consideration of prey types consumed in large amounts by only a few individuals. Of rare appearance were prey taxa such as Arachnida, Chilopoda, Diptera and Maotodea (Table 6.1 ). The only vertebrate prey item found was a hatchling C. giganteus in the stomach of a female.
130 115 Table 6.1. Frequency of appearance (%F) of prey taxa in the stomach samples (n) of c. giganteus. PREY CATEGORY LIZARD CLASSES CLASS FEMALE MALE JUVENILE HATCHLIN ORDER n %F n %F n %F n %F FAMILY ARACHNIDA ARANEAE 6 5 SOLIPUGIDA CHIWPODA 4 4 DIPWPODA INSECT A COLEOPTERA Buprestidae 1 1 Carabidae Cleridae Coccinellidae Histeridae Heteroceridae Lagriidae Lycidae Meloidae Scarabaeidae Staphylinidae 1 2 Tenebrionidae Undetermined DIPTERA 1 2 HEMIPTERA Coreidae 3 3 Lygaeidae 1 1 Reduviidae Pentatomidae Undetermined HYMENOPTERA Formicidae Undetermined LEPIDOPTERA MANTO DEA 1 1 ORTHOPTERA GRASS SOIL TOTAL PREY CATEGORTIES
131 116 Bits of vegetation, apparently ingested accidentally, occurred frequently in stomachs (50%), whereas soil was commonly found in the stomachs during hibernation (Table 6.1) Seasonal variation in diet composition Females.- Analysis of stomach contents of females, collected in the autumn of 1984, indicated that gravimetric- or numerically, coleoptera were the most important prey type of the 10 prey categories recorded (Fig. 6.3; Appendix 1). Numerically it was the Scarabaeidae (mostly Anomala and Sisyphus) followed by Tenebrionidae (mostly Somaticus) and Curculionidae (genera Hipporrhinus, Protostrophus, Rhytirrhinus) which were best represented, although gravimetrically Tenebrionidae contributed proportionally more. Except for lepidopteran larvae, other prey OTU's were at frequencies smaller than 5%. Only three adult female lizards contained identifiable animal material in their stomachs during the winter hibernation period (Appendix 2). Noteworthy, however, was the high incidence of soil in the stomachs of hibernating females. Remains of invertebrates found in the stomachs of females collected in July were all identified as Tenebrionidae (genus Somaticus). The diet of females collected after emergence, in spring 1984, did not qualitatively differ from that of females collected in autumn 1984, although the number and dry mass contribution of carabids (Graphipterus), curculionids (also Brachycerus) and especially scarabaeids increased proportionally (Fig. 6.3; Appendix 2). Tenebrionids decreased in numbers and dry mass contribution when compared to autumn 1984 values. The contribution of lepidopteran larvae and ants (Formicidae) was also reduced during spring 1984 (Appendix 2) During summer 1984, 14 prey categories were recorded with Histeridae, Lagriidae and Meloidae prey OTU's also included in the diet (Appendix 2). Millipedes (Diplopoda) increa~ed in numbers and dry mass contribution and notably the curculionids decreased markedly when compared with autumn and spring 1984 (Fig. 6.3; Appendix 3). Although ants (Formicidae) numerically composed 36% of the total number of prey items, they constituted only 2% of the diet biomass of fem ales collected in summer During the two months (March and April) of collection in autumn 1985, 12 prey OTU categories were recorded and although the
132 CHILOPODA DIPLOPOOA ARACHNIDA CARABIDAE CURCULIONIDAE SCARABAEIDAE TENEBRIONIDAE OTHER COLEOPTERA HEMIPTERA HYMENOPTERA LEPIDOPTERA ORTH OP TERA GRASS SOIL CHILOPODA DIPLOPOOA ARACHNIDA CARABIDAE CURCULIONIDAE SCARABAEIDAE TENESRIONIDAE OTHER COLEOPTERA HEMIPTERA HYMENOPTERA LEPIDOPTERA ORTHOPTERA GRASS SOIL MALE AUTUMN 84 'A' ~ SPRING SUMMER I r ~ -.; ~. - ~.- : : :. ~ : : : :. =::: l ::: :. ~ : : : I ~ : f r- i i r ari ~ _L l L_ ~ :AUTUMN t FEMALE I AUT:UMN i84 B t : : ~ : : : :. ~ : : w... = : : ~ : : : :L_:. : :.. :.... i : : : : : : : :, : : : :. ~ : :. : I l r : : l : : :! ~ ; I j i ; i ; ; ; j ; ; :::. SPRING 84 SUMMER 84 'AUTUMN 85 ~ =. : ; ~ :. t I l t I : : L : ~ Figure 6.3. Seasonal variation in the diet of C. giganteus collected from Faserspruit and Greenlands during The percent dry mass contribution of the prey families represented in the stomachs of adult C. giganteus females (A) and males (B). See appendices 1-8 for more detail ( "-J r (..
133 118 curculionids increased numerically and gravimetrically, the scarabaeids decreased in the diet when compared to summer 1984 (Fig. 6.3; Appendix 3 ). Hemiptera increased considerably when compared with the diets of other seasons studied. The same was true for lepidopteran larvae and orthopteran prey items (Fig. 6.3; Appendix 3). Stomach contents of females collected in autumn 1985 included 14 prey OTU's, of which curculionids contributed 23% in numbers (Fig. 6.3; Appendix 4 ). This was in contrast to females collected in autumn 1984 (see Appendix 1).. Males.- Prey diversity was low during autumn 1984 (only 7 prey OTU's ) and tenebrionid and curculionid prey OTU's were the most important arthropods preyed on (Fig. 6.3; Appendix 5). Although scarabaeids comprised about 17% of the total number of OTU's captured by males, these Coleoptera constituted only 3% of the diet biomass (Fig. 6.3; Appendix 5). Hymenoptera were present in the same proportions as in females collected at the same time and millipedes (Diplopoda), centipedes (Chilopoda) and carabids were notably absent. Males collected in winter contained hardly any arthropod prey OTU's, very similar to females collected during winter hibernation. The three main coleopteran taxa, Scarabaeidae, Tenebrionidae and Curculionidae, figured prominently in the spring 1984 diet of males (Fig. 6.3; Appendix 6). The number of prey OTU's increased from seven in autumn 1984 to ten with the inclusion of arachnids (Araneae) and several beetle families. During summer 1984 total prey categories recorded increased to 12 with the addition of Diplopoda, although not in the same proportion as in females (Fig. 6.3; Appendix 7). Stomach contents of males collected in autumn 1985 included only nine prey OTU's, of which scarabaeids contributed 85% in numbers (Fig. 6.3; Appendix 8). This was in contrast to males collected in autumn 1984 (see Appendix 5). Juveniles.- Numerically ants (Formicidae) comprised about 50% of captured food items by juveniles during autumn 1984 but constituted less than 20 % of the diet biomass. As for the adults, Coleoptera, predominantly tenebrionids, scarabaeids and curculionids, were the most important prey category by biomass in autumn 1984 (Appendix 9). Orthoptera also figured prominently. Winter was again characterized by empty stomachs or the occurrence of soil. Fig. 6.4 shows that stomach contents from lizards collected in
134 CHILOPODA ~A : AUTUMN 84. t DIPLOPODA. - ARACHNIDA ~ CARABIDAE ~ - CURCULIONIDAE OTHER TENEBRIONIDAE COLEOPTERA ~ HEMIPTERA ~ SCARABAEIDAE... HYMENOPTERA LEPIDOPTERA ORTHOPTERA GRASS SOIL CHILOPODA DIPLOPODA ARACHNIDA CARABIDAE CURCULIONIDAE SCARABAEIDAE TENEBRIONIDAE OTHER COLEOPTERA HEMIPTERA HYMENOPTERA LEPIDOPTERA ORTHOPTERA GRASS SOIL! ~ ~ : I ~.. ; _! _ SPRING ~ I ~ -~ I I ~ - SUMMER r- ~.AUTUMN 84 SPRiNG 84 ti ~ ~ SUMMER Figure 6.4. Seasonal variation in the diet of C. giganteus collected from Fraserspruit and Greenlands during The percent dry mass contribution of the prey OTU's represented in the stomachs of C. gigameus juveniles (A) and hatchlings (B). Because of small sizes Autumn 1985 is not represented in this figure. See appendices 9-12 for more detail ~ ~ l.o
135 120 spring 1984 (Appendix 10) were dominated numerically and gravimetrically by scarabaeids with other major prey taxa, like Curculionidae and Tenebrionidae, present in lower frequencies. Ants (Formicidae) were present in low frequencies and orthopteran prey items were the only non-coleoptera that figured. Stomachs from lizards collected during summer 1984 were dominated by beetle remains, especially scarabaeids and tenebrionids, although orthopteran remains also figured (Fig. 6.4; Appendix 11). The relative abundance of ants remained low. Only two juveniles collected in autumn 1985 were available for study, containing mostly beetle remains bjjt also one spider. Hatchlings.-In spite of the small sample sizes, it is clear that hatchlings mostly preyed on beetles, mainly tenebrionids in autumn 1984 and 1985, curculionids in spring 1984 and scarabaeids in summer 1984 (Fig. 6.4; Appendix 9-11). Prey items were more fragmented as depicted by the relatively large proportions of beetle and undetermined insect fragments (Appendix 9-11). Ants were generally present only in low frequencies. As in all the other sex and age classes, lizards collected during winter did not contain invertebrate prey items and the only stomach contents observed was soil Niche breadth Niche breadths varied little amongst sex and age classes in a particular season (Tables 6.2 & 6.3). Using relative prey biomass, females collected in autumn 1984 exhibited highest estimates of niche breadth, i.e. a trend towards equal usage of prey categories. Although the richness of prey categories in the diet generally increased during spring, the niche breaths in all classes decreased when compared to autumn and summer samples collected during 1984 (Tables 6.2 & 6.3). Autumn 1985 was characterized by narrow food niche breadths in al sex and age categories Dietary overlap Dietary overlap (based on prey OTU drymass proportions) between males and females was high (larger than 0.8) in all the seasons studied and there was little variation in overlap among seasons (Table 6.4 ). The overlap of diets between adults and juveniles was of the same magnitude as among adults (Table 6.4 ).
136 121 Table 6.2. Seasonal variation in Simpson's (1949) measure, using prey frequency, of dietary diversity and niche br-eath (B), number of prey categories (n) and standardized dietary diversity (B/Bmaxl SEX & AUTUMN'84 SPRING'84 SUMMER'84 AUTUMN'85 AGE GROUPS n MALE 07 FEMALE 10 JUVENILE 10 HATCHLING 05 B B/B n B B/B n B B/B n B B/B Table 6.3. Seasonal variation in Simpson's-(1949) measure, using relative dry mass of prey OTU's, of dietary diversity and niche breath (B), number of prey categories (n) and standardized dietary diversity (B/8maxl SEX & AUTUMN'84 SPRING'84 SUHMER'84 AUTUMN'85 AGE GROUPS n B B/B n B B/B n B B/B n B B/B HALE FEMALE JUVENILE HATCHLING
137 122 Table 6.4. Values of Pianka's (1973) symmetric estimate of trophic niche overlap for sex and age classes of~ giganteus considering dry mass contribution of prey taxa (Ojk by taxa). Overlap pairs AUTUMN SPRING SUMMER FEMALE-MALE FEMALE-JUVENILE FEMALE-HATCLING MALE-JUVENILE MALE-HATCHLING JUVENILE-HATCHLING
138 123 Lowest dietary overlap values were observed between adults and hatchlings and juveniles and hatchlings during autumn and spring 1984 (Table 6.4 ). In summer overlap between any of the classes was high Resource Availability and Prey Selection Seasonal variation in total abundance and relative abundance of potential prey taxa is presented in Figs. 6.5 & 6.6 for both pit-fall and hand collected estimates. It is clear from Fig. 6.5 that ants (Formicidae) dominated the pit-fall estimates and therefore relative abundance was also calculated with ants excluded from the analysis (Fig. 6.5). In general, potential prey taxa increased in abundance during the warmer seasons (spring and summer) (Figs. 6.5 and 6.6 ). Selection values are included in each appendix for adult males and females (Appendix l - 8). Autumn 84.- Using the pit fall estimates of relative abundance of prey taxa it is evident that apart from Lepidoptera and ants the other prey taxa in the diet of male lizards were positively selected for. In the females, as in males, positive selection for the Coleoptera in the diet was noted, with the other taxa eaten according to relative abundance. Of the Coleoptera it was the scarabaeids which had the highest relative abundance in the pit fall traps but the curculionids dominated in the hand-collected sample. The hand collection estimates suggested that Curculionidae and Scarabaeidae were eaten according to relative abundance by both sexes during this period (Fig. 6.6 ). Spring 84.-Followihg the high relative abundance of ants in the pit-fall traps were the Diplopoda and Arachnida. However, there are indications that these taxa were avoided and therefore not eaten according to relative abundance. The relative abundance of all the Coleoptera and Orthoptera was low in the pit-fall traps, resulting in positive selection values for Coleoptera in both males (except for the carabids) and females. The relative abundance of hemipterans and curculionids in the hand-collected sample increased over that in the diet.
139 CHILOPOOA ~. AUTUMN 84 OtPLOPOOA - ARACHNIDA CARA810AE... CHRYSOMELIOAE I : COCCINEL.LIOAE - : CURCULIONIOAE SCARASAEIOAE - TENEBRIONIOAE -: OTHER COLEOPTERA HEMIPTERA --- HYMENOPTERA - l.epiooptera ORTHOPTERA I GRASS SOIL CHILOPOOA OtPLOPOOA AR..cHNIOA CARASIOAE CHRYSOMEL.JOAE COCCINEl.LIOAE CURQJLIONIOAE SCAAASAEIDAE TENEBRIONIOAE OTHER COLEOPTERA HEMIPTERA HYMENOPTERA l.epiooptera - ORTHOl'TERA GRASS SOIL ~ I CHILOPOOA - CIPLOPOOA ; AR.ACHNIOA CARASIOAE CHRYSOMEL.JOAE ~ COCCINEl.LIOAE ~ OJRaJUciNIOAE ~ SCARABAEIOAE --- TENEBRIONIOAE - ' OTHER COLEQPTERA... HEt.llPTEJIA - HYMENOPTEJIA r l..epiooptera... OllTHQPTEJIA -; GRASS SOIL , -: t, ~ -... _,, : - - SPRING 84 A s t :B n. : r r I -i -r ' ~ - -., -: n r -~ ~ - ~ _,... -C:.I SUMMER 84 ( i MARCH 86 ~ I ' r. r I so [' ~ _, ~ w.. CL SC Figure 6.5. Seasonal variation in the percent contribution of the main prey OTU's in the hand-collection estimate (A), pit fall traps (B) and pit fall traps without Hymenoptera (C). 1--' [\.) *"'
140 O F M A M J 1984 J A S 0 N D J MONTHS F M A 1985 Figure 6.6. Seasonal variation in the total number of prey OTU's (absolute abundance) collected by hand. No collection was made during the winter months June, July, and August 1984.
141 J 126 Summer 84.- Pit-fall traps were again dominated by ants but the relative abundance of scarabaeids increased. This was also the case in the hand-collected sample. Pit-fall estimates (both with or without ants) suggested that the coleopterans in the diet were positively selected for. Using the hand-collected sample it was only th~ tenebrionids, Jepidopterans and mantids selected for by females and cleroids, tenebrionids and lepidopterans by males. The effect of relative abundance on selectivity of prey taxa was investigated by using simple linear regression models with the adult dataset and the hand collected (Coleoptera) and pit fall (Hymenoptera, Diplopoda, Lepidoptera and Orthoptera). For all the major prey taxa, this relationship seem to be a negative one, although statistically this was only significant for Scarabaeidae (r = 0.88 ; p < 0.05) and Orthoptera (r = 0.97; p < ().05) DISCUSSION Lizards typically forage in one of two ways, either by continuous search strategies ("widely foraging") or by a more sedentary, ambush-type strategy ("sit-and-wait") (Huey & Pianka, 1981). C. giganteus could be categorized as a typical "sit-and-wait" forager since these lizards move relatively short distances per unit time and also move a small proportion of the time. Although C. giganteus hatchlings were more active (i.e. moves per unit time) when outside the burrow, no indications were found suggesting that they adopt a more widely foraging strategy. Dunham (1980, 1981, 1983) points to the importance of knowledge about foraging success when explaining sealional variation in growth rates, total body lipids and ultimately reproductive success. Using the mass of the contents of the alimentary canal as an index of individual foraging success, it is clear that C. giganteus lizards undergo seasonal food stress during autumn and the winter hibernation period. Foraging success in C. giganteus correlated with seasonal food abundance, especially the hand collected measure. All the sex and age classes of C. giganteus were influenced in the same way by the seasonal change in resource availability. Furthermore, data presented here indicate that seasonal variation
142 127 in arthropod abundance could be explained by variation in the amount of precipitation during the preceding period. During 1984 maximum food intake occurred during the months October through December. The high food intake during October was preceded by exceptionally high precipitation during August, which resulted in an early spring prey abundance. The decrease in the mass of food in the stomachs of all C. giganteus lizards during late summer (January-February 1985) occurred at a time of maximal environmental temperatures, high monthly precipitation and high pit-fall numbers. However, in close association with this decrease in the mass of food in the stomachs was the hand collected abundance estimate, emphasizing the availability of Coleoptera. Stomach analysis showed that C. giganteus eat mainly Coleoptera, especially scarabaeids, curculionids and tenebrionids, throughout the year. The main food categories identified in this study generally agreed with the occasional reports on the diet of this lizard (de Waal, 1978; Marais, 1984; Jacobsen et al., 1990). Although Jacobsen et al. (1990) reported Hymenoptera (ants) to be one of the main prey types, because of their presence in all six C. giganteus stomachs they studied, only 17-20% of the stomachs in the present study contained ants. Isoptera alates were absent from the stomachs, in spite of the unconfirmed reports that C. giganteus consume large quantities during the summer rains when these insects swarm (L. Stolz personal communication). The lizards are also known to move further away from their burrows to feed at such times. Huey & Pianka (1981) reported a similar situation for Ptenopus garrulus suggesting that a sit-and-wait predator may increase its foraging activity with an increase in food abundance. The present study area was, however, located outside the natural distribution range of Termitidae (Coaton & Sheasby, 1972), but occasionally C. giganteus adults were observed foraging widely at times when ants (Formicidae) swarm. Although millipedes (Diplopoda) are known to produce toxins, including quinones and cyanide compounds that are released from the exoskeleton upon disturbance (Blum, 1981), the biomass contribution in the stomachs of adult females collected in summer was as high as 28%. Similarly the proportion of millipedes in the diet also increased in males and juveniles.
143 128 Marais (1984) states that C. giganteus can also be regarded as carnivorous, since they will feed on rodents and seize any creature that can be overpowered in captivity. In the present study and an extensive observation study (see Chapter 10) little evidence could be found pointing to the inclusion of vertebrate prey items in the diet, except in the stomach of one adult female (272 adults examined) a C. giganteus hatchling was found and on another occasion in the field a female was observed swallowing a hatchling. Marais (1984) also reported that captive males have been observed eating hatchlings. Evidence therefore suggests that C. giganteus rarely if ever feeds on vertebrates in its natural habitat and that cannibalism may occur but can be regarded as a rare phenomenon. Although, qualitatively speaking, the diet of adult C. giganteus lizards did not change dramatically among seasons, seasonal variation in the relative proportions of the prey categories consumed was evident. Whereas it was previously stated that C. giganteus is an opportunistic feeder (Marais, 1984; Jacobsen et al., 1990) similar to other insectivorous lizards (Sanborn, 1977; Arnold, 1987; Barbault et al., 1985), the consistency of major food categories between seasons, indicate that C. giganteus was opportunistic only in the sense of taking other taxa when these foods were present in greater abundance. Best & Gennaro ( 1984) suggested that an opportunistically feeding species is one that takes food as it encounters it. The consistency of the main food categories through spring, summer and autumn in the diet of C. giganteus indicate that some selection must take place, notably among the Coleoptera. All the major prey types in the diet showed negative relationships between relative abundance and selectivity, implicating that C. giganteus preferred a prey type more when it was relatively less abundant in the environment. In the case of Hymenoptera (ants), lizards ate the same proportion regardless of the relative abundance, which is probably the result of low variance in relative availability among seasons. Males and females selected for the same prey categories. Although small sample sizes did not allow a seasonal analysis of selection of prey types in juvenile and hatchling C. giganteus, juvenile lizards seem to select for the same prey taxa as adults. Food niche breadth estimates, as depicted by Simpson's ( 1949) diversity measure, varied among seasons in all lizard classes and appeared to be a function of overall food
144 129 abundance. The significantly lower values of autumn 1985 compared to autumn 1984 may be attributed to the lower overall resource abundance during autumn Although early autumn 1985 was marked by exceptionally high rainfall, overall resource abundance did not respond accordingly. Measurements of dietary overlap for prey taxa indicated in all the seasons a high degree of dietary similarity for all age and sex classes. This is not unexpected for adults, since male and females were usually spatially (horizontally) separated, therefore limiting competition for food resources. The same reasoning holds for most juveniles, as they mostly occupy their own burrows. Hatchlings, however, stay mostly with the female, therefore sharing the resource with the adult. Dietary overlap values were generally small between adults and hatchlings. Although prey selection based on prey size was not determined the relatively large body size -(gape size) of hatchlings make it possible to handle almost the complete size spectrum of major prey categories available to them. Temporal activity differences (see Chapter 10) among hatchlings, juveniles and adults may account for the smaller dietary overlap in autumn and spring between these classes. In summer when resource abundance was high, a higher degree of dietary similarity was found between hatchlings and adults. In summary then, C. giganteus individuals fed during eight months of the year. The mass of food in the stomachs and remains in the hind-gut indicated that maximum food intake and therefore, a high degree of foraging success occurred during the warm spring and early summer months. Foraging success decreased during the late summer and autumn. Relative prey abundance reached maximum values following periods of rain in summer. C. giganteus lizards of all age and sex classes may be regarded as partially opportunistic but preferred Coleoptera and it was especially the scarabaeids, curculionids and tenebrionids that dominated as prey taxa. Although selection of these main taxa
145 130 occurred, a negative relationship between selection and relative prey abundance was noted. Dietary overlap measurements indicated that there was a high degree of diet similarity among age and sex classes in all the seasons. Dietary overlap between hatchlings and adults was smaller in autumn and spring than summer.
146 131 CI-IAPTER SEVEN SEASONAL VARIATION IN ENERGY RESERVES INTRODUCTION Temperate zone lizards are characterized by the seasonal accumulation of energy reserves to be utilized when resources are _low or during extended periods of no activity (hibernation) (Avery, 1974; Derickson, 1976a; Bracken, 1979). In most lizards the paired abdominal fat bodies (corpora adiposa) are recognized as the most important lipid storage site (Brain et al., 1972; Derickson, 1976a,b ). Lipids are also stored to a lesser extend subcutaneously, in the tissues and tail (see Avery, 1974; Derickson, 1976 for reviews). The liver is another site of energy stores in the form of glycogen and fat droplets (Telford, 1970; Costanzo, 1985; Etheridge, et al., 1986). Derickson (1974) demonstrated that fat body lipids are the most labile, and Greenberg & Gist ( 1985) demonstrated that these lipids are part of a pool of lipids to be utilized. Therefore, fat body mass may be correlated with the total available energy reserves, but it may not be a precise indicator of the available energy reserves (Blem & Blem, 1990). In most lizards, energy stores peak prior to winter and decline to minimum levels during summer (Derickson, l976a). Hahn & Tinkle (1965) reported that Uta stansburiana utilized most of their stored lipids for reproductive efforts following hibernation. However, a dual purpose for fat body lipids, i.e. utilization for both maintenance during hibernation and reproduction in spring, was suggested for several species (Guillette & Casas-Andreu,1981; van Wyk, 1984; Etheridge et al., 1986). Vitt & Cooper (1985a) pointed out that because investment in yolk deposition by I female lizards is energetically expensive (Nagy, 1983), data on fat storage patterns can greatly aid the interpretation of reproductive cycles. In contrast to females, the dynamics
147 132 of seasonal energy storage in adult males and immatures have only been reported for a few species (see McKinney & Marion, 1985a), mostly showing that the amount of stored lipids is greater in females (Gaffney & Fitzpatrick, 1973). Although the production of sperm is generally believed to be energetically cheap compared to vitellogenesis in females, the cost of male reproductive behaviour during the mating period may be considerable (Guillette & Casas-Andreu, 1981; Vitt et al., 1978; Ortega & Barbault, 1986). In Chapter 3 evidence was presented to show that Cordy/us giganteus females breed mostly biennially, supporting the hypothesis of Aldridge (1979) that successful breeding in any year is determined by the magnitude of the energy reserves at the onset of vitellogenesis prior to winter hibernation. The male cycle, on the other hand, exhibits postnuptial spermatogenesis culminating in early autumn, and is therefore not well synchronized with the female cycle (Chapter 5). It is suggested in Chapter 5 that the males that store sperm through winter and that mating takes place around the time of ovulation in spnng. In this chapter the annual cycles of energy storage in different age and sex classes in C. giganteus are reported. Since these lizards are not active during winter, even on warm days (see Chapters 6 & 10), they provide an excellent opportunity to study the roles of the liver and fat bodies as energy sources for hibernation and reproduction MATERIALANDMETHODS Study Area and Lizards Lizards for this study were collected monthly on the farms Fraserspruit and Greenlands {Harrismith study area) from February 1984 to April 1985 For details on the location, physical and climatological.aspects of the study area see Chapter Autopsy Procedures Autopsy procedures were as described in Chapters 2 & 3. The removed livers and fat bodies were blotted dry and immediately weighed on a Mettler balance to the nearest 0.1 mg.
148 Statistics All similar data for adult females, adult males and juveniles and hatchlings (yearlings born in 1984) were averaged and all means for a given group (month or reproductive condition) were combined to calculate group means and standard errors. I used parametric statistics to examine the data when the data did not violate the assumptions of those tests; analogous nonparametric procedures (Zar, 1984) were used when the assumptions of parametric procedures could not be met. One-way analysis of variance (ANOVA) was performed to determine whether significant variation existed among groups and Tukey's multiple range procedure (a = 0.05; Sokal & Rohlf, 1981) to identify the significantly different groups. For correlations involving organ mass which varied significantly with body size, analysis of covariance (ANCOVA), with SVL as a covariate was used to adjust the group means. The STATGRAPHICS package (STSC, Inc., 1988) was used for all statistical procedures RESULTS Fat Bodies Males:- Lizard size (SVL) did not affect the size of fat bodies significantly (F(l,88) = 0.06; p > 0.1) in adult males. Significant seasonal variation in mean total fat body mass (MTFM) was, however, revealed by ANOVA (F(14,88) = 4.39; p < 0.05). variation in MTFM of male C. giganteus lizards is presented in Fig Seasonal Male fat bodies were smallest during February and March (late summer-early autumn, 1984 & 1985) in lizards exhibiting spermatogenic stages 5 and 6 (spermiogenesis). MTFM increased significantly (p < 0.05) during autumn to attain maximum values in May prior to hibernation. Fat body reserves were significantly (p < 0.05) utilized during the hibernation period. MTFM remained relatively small during spring but increased significantly during summer, culminating in December (p < 0.05). The cycle was completed with a sharp decline in MTFM values between December and February. In autumn an inverse relationship was evident between lipid accumulation and testicular mass but during
149 134 MEAN FAT BODY MASS (g) 7.---~~~~~~~~~~~~~~~~~~~~~~-'--~~~ ADULT MALES d (8) F M A M J 1984 J A S 0 N D MONTHS J F M A 1985 Figure 7.1. Monthly variation in the mean total fat body mass (mean + lse) in C. giganteus adult males. Sample sizes are given above the bars and different alphabetic characters indicate significant difference among means (Tuke)"s multiple range test, p < 0.05).
150 135 VITELLOGENIC FEMALES 6 c,d 2 B (l) II. (3) a _a a (4) GRAVID FEMALES NONREPRODUCTIVE FEMALES M J J A S 0 N D J F M A MONTHS 1985 Figure 7.2. Monthly variation in the mean total fat body mass (mean + lse) in C. giganteus vitellogenic (A), gravid (B) and nonreproductive (C) females. Sample sizes are given above the bars and different alphabetic characters indicate significant difference among means (Tukey's multiple range test,p < 0.05).
151 136 mass but during testicular recrudescence in summer, fat bodies increased followed by a sharp decrease during spermiogenesis in late summer. Females:- As in adult males, SVL did not affect the MTFM in adult females (F(l, 160) = 0.01; p > 0.1). AN OVA revealed significant variation among female reproductive classes (F(5,160) = 8.55; p < 0.05; see Chapter 3 & 4). Since females of different reproductive classes may occur in any month, seasonal variation in MTFM in adult females was analyzed according to reproductive conditions. Seasonal variation in MTFM of C. giganteus females is presented in Fig MTFM of vitellogenic females was smallest during February 1984 and 1985 and attained largest sizes at the onset of hibernation (June 1984). Fat bodies in both vitellogenic females emerging from hibernation and pre-ovulatory females were significantly reduced (p < 0.05) in size when compared to the magnitude of lipid reserves at the onset of hibernation. Gravid females generally exhibited small fat bodies ( < 2 g) but in spite of small sample sizes and variation among individuals some indication of increased fat deposition was evident in December In spite of significant seasonal variation in MTFM in nonreproductive females (F(14,87) = 3.55; p < 0.05), no clear seasonal trend could be established. The magnitude of lipid storage in the fat bodies during early autumn and spring in nonreproductive females was similar to vitellogenic females and males collected at the same time. It was, however, during the late autumn, winter and summer periods of fat deposition that nonreproductive females differed from vitellogenic females and males. Hatchlings and Juveniles:-.Because of small sample sizes, monthly MTFM's of hatchlings collected during 1984 and 1985 were pooled. Significant seasonal variation was evident in MTFM in hatchlings (F( 11, 108) = 2.28; p < 0.05). Following birth during early autumn, MTFM increased significantly (p < 0.05) in hatchlings, culminating in May prior to hibernation (Fig. 7.3). MTFM declined significantly (p < 0.05) during hibernation but increased in spring following emergence. The summer months were characterized by small fat bodies.
152 137 MEAN FAT BODY MASS (g) 1. A c HATCHLINGS (0-1 yr) (10) B JUVENILES a (2) 2 a (6) a,b (2) 1.5 a,b a,b (4) J F M A M J J A s 0 N D MONTHS Figure 7.3. Monthly variation in the mean total fat body mass (mean + lse) in C. giganteus (A) hatchlings (SVL: 60mm - 90mm) and (B) juveniles (SVL: 90mm - 165mm). Sample sizes are given above the bars and different alphabetic characters indicate significant difference among means (Tukey's multiple range test, p < 0.05). Because of small monthly samples, data from 1984 and 1985 were pooled.
153 138 ~TFM in second year and older juveniles varied significantly among months in spite of small sample sizes and individual variation (F(ll,58) = 4.29; p < 0.05). Apart from the general pattern of increased fat storage prior to hibernation followed by a subsequent decrease in MTFM during the winter months, no clear trend of increased fat storage during mid-summer was evident Liver Mass Males:- Liver mass in males was not significantly affected by body size (F(l,97) = l.73; p > 0.05). Significant seasonal variation among collection months in mean liver mass (MLM) was evident (F(14,97) = 10.74; p < 0.05) and is displayed in Fig smallest during February and March of 1984 and MLM was MLM reached maximum values during the months May and June whereafter a significant decrease was evident, down to pre-hibernation size in October (p < 0.05). Following emergence, MLM showed little variation until a significant decrease was evident in February 1985 (p < 0.05). Females:- Liver mass in females was significantly affected by body size (F(l,158) = 15.57; p < 0.05) and the means subsequently adjusted by ANCOVA. Within the vitellogenic female group significant variation in adjusted mean liver mass (AMLM) was noted among collection months (F(14,54) = 6.61; p < 0.05) and it is evident that liver hypertrophy coincided with initial vitellogenic activity (ovarian follicles > 8 mm; p < 0.05) prior to hibernation. At the time of spring emergence AMLM values were significantly reduced but not as much as before liver hypertrophy in autumn. Advanced vitellogenic activity in spring coincided with a further decrease in AMLM. AMLM values of postovulatory females (gravid) were markedly reduced compared to vitellogenic females (p < 0.05), and did not exhibit significant variation among collection months (F(7,23) = 1.10; p > 0.05). In was noteworthy, however, that AMLM varied significantly among collection months in nonreproductive females (F(14,86) = 4.57; p < 0.05), with heavier livers in fema)es collected during the period prior to hibernation (p < 0.05). Evident, though,
154 ADJUSTED LIVER MASS (g) a T a ADULT MALES c,d F M A M J J A s 0 N D J F M A 1984 MONTHS 1985 Figure 7.4. Monthly variation in the mean liver mass (mean + lse) in C. giganteus adult males. Sample sizes are given in Fig. 7.1.
155 140 g 6 ADJUSTED ljver MASS (g) d VITELLOGENIC FEMALES 7 6 a,b,c c B c GRAVID FEMALES NONREPRODUCTIVE FEMALES 2 F M A M J 1984 J A S 0 N D J MONTHS F M A 1985 Figure 7.5. Monthly variation in the mean liver mass (mean + lse) m C. giganteus vitellogenic (A), gravid (B) and nonreproductive females (C). Sample sizes are given in Fig. 7.2.
156 141 from Fig. 7.5 is the difference in magnitude between vitellogenic females and nonreproductive females during the period of hepatic enlargement. Hatchlings and Juveniles:- Because of small sample sizes monthly mean liver mass (MLM) values of hatchlings collected during 1984 and 1985 were pooled. MLM values were adjusted by ANCOVA for effects of body size (SVL; F(l,120) = 245; p < 0.05). Significant seasonal variation was evident in AMLM in hatchlings (F(ll,120) = 3.71; p < )-and depicted in Fig. 7.6a. AMLM increased significantly{p < 0.05) in hatchlings in - late autumn, declining during winter to reach lowest mean values at the time of emergence. September and October 1984 was marked by a significant increase in AMLM followed by a decrease in November. Juveniles exhibited a similar seasonal trend (F(ll.120) = 2.50; p < 0.05; Fig. 7.6b) to that evident in hatehlings and male C. giganteus DISCUSSION Pronounced seasonal activity patterns are characteristic of temperate zone reptiles. This is particularly so in regions with cold winters, where reptiles may become dormant or hibernate (Gregory, 1982). In spite of many temperate zone lizards that are known to hibernate, literature regarding reptilian hibernation is remarkably rare (Etheridge et al., 1983). Although metabolic rates may be reduced for extended periods of hypothermia, most hibernating reptiles must still store energy-yielding substances in order to survive (Gregory, 1982). In addition to the winter metabolic demands, reproduction, specially vitellogenesis (Nagy, 1983), necessitate preceding energy storage to meet the increased energy demands during early spring when food resources are scarce. Therefore, to understand the dynamics of energy storage cycles in reptiles, it is important to consider seasonal activity patterns, reproductive investment and foraging success concurrently. ~ The storage of fat in the corpora adiposa (abdominal fat bodies) prior to hibernation in C. giganteus_ males is similar to several reports (see Derickson, 1976a; Gregory, 1982) for temperate zone reptiles. However, Flemming (1988) reported no autumn increase in the fat bodies of the cordylid, Cordylus polyzonus collected along the west coast of southern Africa (typical mediterranean climate) but instead a spring-early summer fat build-up.
157 142 ADJUSTED LIVER MASS (g) ~~~~~~~~~~~~~~~~~~~~~~~~~~~~ A 1.2 a,b a HATCHLlNGS ( 0-1 yr) B a JUVENILES (1-4 yr) J F M A M J J A s 0 N D MONTHS Figure 7.6. Monthly variation in the mean liver mass (mean + lse) in C. giganteus (A) hatchlings and (B) juveniles. Sample sizes are given in Fig. 7.3.
158 143 Although it is generally believed that the energy requirements for sperm production may be low (Krebs & Davies, 1981), fat body reserves in C. giganteus were lowest during active spermiogenesis (spermatogenic stages 5 & 6). Fat body increase soon after the onset of testicular regression (spermatogenic stage 7) may suggest that energy reserves decline in late summer due to the intense spermatogenic activity (see McKinney & Marion, 1985a). However, this hypothesis is falsified by the fact that C. giganteus juveniles and all classes of females exhibited a similar late-summer decline in fat reserves. Decreased foraging success because of declining resource availability (Chapter 6) during the mid-summer months, when metabolic expenditure in general should be higher, may explain low fat reserves at this time. In spite of decreased foraging success and resource availability in autumn, C. giganteus males invested energy in fat body reserves, which suggest that metabolic demands decreased and most of the ingested energy was diverted to fat storage. Etheridge et al. (1986) suggested that lizards hibernating without winter activity should have smaller energy needs than lizards, such as Anolis carolinensis (Dessauer, 1955), which may be active on warm winter days and therefore spend most of their energy stores for winter maintenance. In C. giganteus males the high rate of fat body utilization during a relatively short hibernation period (3 months) indicate that energy demands in winter are real. Several authors suggested that male lizards may invest considerable amounts of energy, or at least expend more than they can assimilate, in behavioral activities associated with reproduction (see Etheridge et al., 1986; Castilla & Bauwens, 1990), especially in early spring when food can be scarce (Guillette & Casas-Andreu, 1981). Evidence presented in Chapter 3 indirectly suggests that most of the mating activities take place in spring around the time of ovulation, thereby explaining small fat bodies during this period in C. giganteus males. The second increase in fat body reserves of C. giganteus males during summer, coinciding with testicular recrudescence, must be the result of increased food abundance and foraging success (Chapter 6) as suggested for other lizards (Derickson, 1976b; Ballinger, 1977; Dunham, 1981). Van Wyk (1989) reported a similar mid-summer fat body
159 144 increment in the rupicolous viviparous lizard Cordy/us polyzonus, collected in the same climatic environment (summer rainfall and cold winters) as C. giganteus. As in C. giganteus males, hatchlings (born in 1984 & 1985) exhibited a significant increase in fat body reserves in late autumn prior to hibernation, followed by a precipitous decrease in size during hibernation. However, hatchling fat bodies did not increase in summer but remained small. This may be the result of the increased energy demands of somatic growth during these warm summer months (see Chapter 8). In spite of small sample sizes, the fat storage cycle of C. giganteus juveniles seem to follow the same seasonal profile as males and hatchlings. The similarity of seasonal fat storage profiles between C. giganteus adult males and juveniles is not surprising, since juveniles do not utilize large amounts of energy for reproduction but may well do so for survival during winter and periods of decreased food availability during spring and summer. It has been suggested that inadequate lipid storage prior to, or greater proportional lipid usage during the period of aphagy in immature reptiles may lead to high mortality rates (Blem & Blem, 1990). Although evidence suggest that C. giganteus yearlings have a low annual survival rate, data on fat storage or the rate of fat utilization does not seem to provide a reason for increased mortality rates (Chapter 9). Moreover, the high lipid content of somatic tissues (18.2%.±.. 1.6% vs 4-8% carcass lipids of adults) measured in yearlings prior to winter may further ensure winter survival of hatchlings. Adult females may utilize stored fat reserves for reproduction m addition to metabolic needs (Derickson, 1976; van Wyk, 1984; Etheridge et al, 1986; Ortega et al., 1987; Castilla & Bauwens, 1990; Xiang & Peichao, 1990), resulting in an inverse relationship between fat body mass and follicular development. Hahn & Tinkle ( 1965) and Smith (1968) provided experimental evidence that fat body lipids are necessary for vitellogenesis. Greenberg & Gist (1985), however, indicated that the lipids stored in the fat bodies are not preferentially utilized but are part of a pool of lipids available for reproduction. It was suggested that C. giganteus females may skip a breeding cycle depending on whether adequate energy reserves exist prior to hibernation (Chapter 3). Vitellogenesis in C. giganteus started in autumn and seem to continue during winter months (Chapter 4 ). Early
160 145 vitellogenic C. giganteus females exhibited an increase in fat body reserves prior to hibernation as in males and juveniles, but the magnitude of lipid storage was greater in the females. Although there was some indication of increased lipid storage in the fat bodies of nonvitellogenic fem ales in autumn the magnitude of lipid storage was smaller than in adult males. At emergence, fat bodies in reproductive females C. giganteus were not depleted to prehibernation minimum size, but later at the time of ovulation in spring (see van Wyk, 1983; 1989). As suggested by Hahn & Tinkle (1965) and supported by Greenberg & Gist (1985) the stored lipid reserves of the fat bodies may be important for reproductive processes early in spring when food availability is still low. In contrast, fat bodies in Cordy/us polyzonus females, collected in a mediterranean climate, peaked during the ovulatory period which suggest that stored lipids were not necessary for vitellogenesis (Flemming & van Wyk, 1992). However, the state of the resource was unknown. Fat bodies increased in size during summer in gravid C. giganteus females, but decreased to seasonal minimum sizes prior to parturition in late summer and early autumn. Evidence to suggest that placental transfer occurs between the mother and advanced embryos was presented in Chapter 4, implicating an energy burden on these gravid females (Guillette, 1982). Fat body mass remained small in nonreproductive females during summer. The present study support the hypothesis that the quantity of lipids in storage prior to the onset of vitellogenesis determine whether adult females will breed in a particular season (Aldridge, 1979; Blem, 1981, 1982; Hasegawa, 1984; Blem & Blem, 1990). Moreover, as in biennially reproducing lizard Eumeces okadae (Hasegawa, 1984 ), mature nonreproductive C. giganteus females contained small fat bodies at the time of parturition and onset of vitellogenesis. This suggest that certain fem ales may require two years to accumulate enough fat reserves for reproduction. In all sex and age classes liver hypertrophy was evident during autumn prior in C. giganteus. The autumnal liver hypertrophy is in accordance with several other reports (see Etheridge et al., 1986; Loumbourdis & Kattoulas, 1985). The association of the liver and the production of the yolk precursor in female reptiles is well known (Ho et al., 1982) and several studies report liver hypertrophy during vitellogenesis (Hahn & Tinkle, 1965;
161 146 Jameson & Allison, 1976; Lin, 1979; Loumbourdis & Kattoulas, 1985; Selcer, 1986; Etheridge et al., 1986; Flemming & van Wyk, 1992 and several others). Since the onset of vitellogenesis was noted in autumn followed by subsequent vitellogenic activity through winter, liver enlargement at this time in C. giganteus females was not unexpected. However, the autumnal liver enlargement in nonreproductive females, males and juveniles may point to the involvement of the liver in seasonal energy storage, especially prior to hibernation. Several authors have presented evidence showing the liver as an important organ of energy storage, usually in the form of glycogen and lipid (Dessauer, 1955; Telford, 1970; Aleksiuk & Steward, 1971; Greenberg & Gist, 1985). Although liver mass did not increase during summer, the seasonal profile paralleled that of the fat body cycle in C. giganteus, indicating that these reserves are metabolized concurrently for vitellogenesis and other metabolic demands during hibernation. Derickson ( 1976a) recognized four patterns of lipid storage and utilization: No lipid cycling, cycling associated only with winter hibernation, cycling associated only with reproduction and cycling associated with both hibernation and reproduction. Cordy/us giganteus females clearly fall within the fourth pattern, whereas males and juveniles fall within the second one. Post-parturition and nonreproductive females characteristically had smaller fat bodies and livers in autumn at the time of vitellogenesis onset than females exhibiting vitellogenic activity, which is consistent with the hypothesis that the biennial reproductive cycle off emale C. giganteus is determined by the ammount of energy reserves at the onset of autumnal vitellogenesis.
162 147 CHAPTER EIGHT GROWTH AND SEXUAL DIMORPHISM 7.1. INTRODUCTION Energy flow in any animal starts with the time-energy resources available to the individual, followed by energy partitioning into maintenance, storage, growth and reproduction. A knowledge of all these energy-related variables is important in understanding the particular life history strategy adopted by a species. One of the important features of reptilian growth is discontinuity, growth curves therefore, should resemble step functions rather than steadily increasing curves (Andrews, 1982). In temperate zone lizards, seasonal growth may be closely linked to temporal changes in extrinsic resources such as food availability, temperature and competition but may be superimposed on intrinsic individual differences (e.g. sex and genetics) (Dunham, 1978; Andrews, 1982). Growth patterns may therefore lead to the development of specific hypotheses regarding factors influencing lizard life histories (van Devender, 1978). Key variables in these general models include, the age at maturity and growth rate, both part of a co-evolved design of a genotype resulting from environmental selective pressures (Andrews, 1982; Ballinger, 1983; James, 1991). It follows therefore, that phylogenetic affinity and environmental influences should both be evaluated to explain growth patterns. Apart from understanding the dynamics of growth and the factors influencing this pattern, demographic studies require that individuals be aged, and for most species, a thorough knowledge of age-specific growth rates may be the only method to indirectly estimate the age of individuals (Caughley, 1977; Plummer, 1985). Andrews (1982) reviewed the patterns of growth in reptiles and demonstrated that they all share a basic "generic growth model". Therefore, along with the fact that the pattern of growth is so
163 148 amenable to mathematical modelling (Powell & Russel, 1985), a number of widely applicable growth models have been outlined. (see Kaufmann, 1981). The use of an appropriate growth model may aid the study of extrinsic factors (Dunham, 1978) and thereby provide a valuable demographic tool. Sexual dimorphism, which results from differential growth or colour pattern development, is commonly expressed among lizards as differences in body size, head size, ornamentation and colour patterns,,and the functional significance of these sexually dimorphic characters is well known in many lizard species (see Vitt & Cooper, 1985b; Cooper & Vitt, 1989; Vial & Steward, 1989). In general, most lizard species are dimorphic rather than monomorphic, with "male-plus ( + )" dimorphism more common (Schoener, 1977; Fitch, 1981). Larger body-size has been identified as a correlate of territoriality in lizards and thought to be the result of intrasexual sexual selection (Stamps, 1983). Although initially a large body of literature supported this idea, that sexual dimorphism evolved because of sexual selection, more recent studies point to the problems associated with attributing body-size dimorphism to sexual selection and emphasize the importance of examining characteristics which determine the reproductive success of individuals (see Cooper & Vitt, 1989; Shine, 1990). Alternative hypotheses related to, for example, differential survivorship among adults (Dunham, 1981) or the association of body size and fecundity and many other selective agents which might affect the sexes differentially (see Kolata, 1977; Carothers, 1984; Shine, 1990) have been put forward. The understanding of sexual size dimorphism in snakes and lizards is complicated by the fact that different selective forces may be operant on adult size for each sex (Vial & Steward, 1989; Shine, 1990). Large males are common among species exhibiting intrasexual competition (Shine, 1978; Fitch, 1981). On the other hand, larger females are more typical of those species that have large clutch sizes, viviparous reproduction and inhabit temperate zone climates (Fitch, 1981). Although Stolz & Blom (1981) and Jacobsen et al. (1990) related body size to body mass in Cordylus giganteus, no attempt has yet been made to study the dynamics of intrinsic growth in any cordylid lizard or any other South African lizard species. A relatively slow
164 intrinsic growth rate may be exp~cted in this large terrestrial cordylid adopting the "sit-andwait" food-acquisition strategy. lacobsen et al. (1990) reported that females are relatively heavier than males but attribute~ this difference to the possibility that the females in their study were gravid. The main objectives of this chapter were (1) to observe growth in body size in marked individuals and to study how size, sex and seasonality influence growth rate; (2) to determine which growth model best describes the growth of C. giganteus; (3) to examine whether morphological sexual dimorphism exists, and finally ( 4) to evaluate whether the age at maturity is consistent with predictions from life history models METHODS Study Area and Lizards. Growth ecology was studied through a mark-recapture program in the Middelpunt population (Bethlehem study area, Chapter 2). The morphometric analysis was done on lizards collected during the removal study (for autopsy) at the Greenlands study site. For more detailed descriptions of the study areas, climate and procedures during field collection, refer to Chapter Growth Analysis I used two kinds of data to analyze growth: cross-sectional and longitudinal. Crosssectional data (sometimes called mark-recapture data) are collected by recording the growth increment, over a relatively short period of time, of different individuals of different sizes, all simultaneously. This is equivalent to measuring the slope of different parts of the growth curve all at once. Longitudinal data, on the other hand, are records of the size of certain individuals at different ages and are collected sequentially as they grow (Kaufmann, 1981). Recapture data were organized into cases, each case consisting of a measurement (SVL) taken at first capture of an individual (L1), the number of days between capture and recapture (D), the equivalent measurement taken at the recapture of the individual (L2).
165 150 Most individuals were recaptured more than once and Ll was therefore given the value obtained at the immediately preceding recapture. Growth Rates: Growth rates (GR) were computed as the difference between Ll and Lz (dsvl) divided by the interval D (dt). Mean size during the interval (SVL) was the average of the first and last SVL. Growth rates were regressed on mean SVL's to avoid underestimating or overestimating growth rates if initial or final SVL's, respectively, were used. Because of the possibility that measurement error was large relative to growth for small amounts, only data with a minimum of 40 days between captures were included. Whenever, "negative" growth was recorded in adult lizards, measurements were "fixed" by assuming zero growth during that interval. Regression analysis (Model I) of GR on SVL were performed for each combination of sex and season. Whenever the residuals about the mean were heteroscedastic, data were logtransformed. In order to study seasonal growth, observations were assigned to the season which included the majority of the growth (i.e. spring-summer, autumn and winter). Regressions were compared by using analysis of covariance (ANCOVA) with logsvl as covariate and by studying the standard errors of the slopes and intercepts. Growth Models: Growth trajectories were estimated using non-linear regression with either differential, interval or the solution of the former equations of three growth models (Table 8.1 for the formulae) that have been suggested as appropriate for reptiles: the Von Bertalanffy model, the logistic by length model, and the logistic by weight model (Schoener & Schoener, 1978; Dunham, 1978, Powel & Russel, 1985, James, 1991). The latter model was however adapted for length since weight in free-living lizards can vary with condition, food and, particularly i.n females, with reproductive condition, all of which will obscure growth rate (Powell & Russell, 1985). The model returning the smallest residual mean square (sum-of-squares divided by sample size) was considered to be the closest approximation to the growth characteristic of C. giganteus. I used several approaches to fit growth models to recapture data.
166 151 Table 8.1. Summary of the growth models used in this analysis. A 1 is the asymptotic body length and r is the "characteristic growth (damping) parameter." L 1 is the length at the beginning of the growth interval and L 2 is the length at the end of the growth interval. D is the duration of the growth interval. Details and terminology follows Dunham (1978) and Schoener and Schoener (1978). Von Bertalanf fy Logistic-by-Length Logistic-by-Weight Differential egyation dl/dt = Air{l-(L/A1)} dl/dt = Lr{l - (L/A1)} dl/dt = (rl/3 ){1 - (L3/A) } 3 Solution L = A 1 (1-be-rt) L = A 1 /(1-be-rt) L = [A13/(l-be-rt)jl/3 where, b = (1-L 0 /A 1 ) b = (A 1 /L 0 )-1 b = (A13/Lo3)-l Interval egyation L2 = Ai-(A1-L1)e-rD L2 = A1L1/[L1+(A1-L1)e-lrD L2 = 3j{A13L13/[L13+(A13-L13)e-rD]}
167 152 Firstly, growth curves were estimated by fitting the different growth models to crosssectional data using non-linear regression procedures. In order to calculate the three free parameters for each model (see Table 8.1), individual lizards were aged using longitudinal data (Fig. 8.1 ). By extrapolation, ages were estimated among different generations. Aging by this procedure should at least be accurate to asymptotic body size. Secondly, I used non-linear regression analysis with the interval equation of the three models (Table 8.1 ). Interval equations are derived from the solution to the differential equations of the different growth models. The interval equation of each model has two free parameters, the asymptotic body size, A 1' and the "characteristic growth parameter", r. The third free parameter, b is not estimated from the interval equations by non-linear regression and was calculated using the mean size (SVL) at birth (67.25 ±. 3.49mm; n = 17). Thirdly, I used the differential equations of the different models. A particular useful aspect of this approach is that growth rate in SVL is a linear function of body length (SVL). Finally, if the growth rate varies seasonally these stationary growth models will not give satisfactory representations of the growth patterns under study. As a relatively simple alternative I investigated the possibility of adapting the differential equation of the logistic by length model to integrate a cyclic function, simulating seasonal variation in growth rate. Therefore, the alternative to the logistic differential equation (Table 8.1) is (1) dl/dt = Lr[l - (L/ Al)]g(t), where the factor Lr[l - (LI Al) characterizes the logistic growth curve, and g( t) is a cyclic function, introduced to reflect a seasonal trend in growth rate. (2) g(t) = [a+sin(t+ ).n/182.5]{ 1 +sin[a+sin(t+ ).n/182.5]}/2(1 +a),
168 153 where </>is a phase constant and the length of time for which g(t) = 0 in each year can be adjusted by the choice of a. The units oft are days. The parameters r, A 1, a and </> can be estimated by least squares, fitting a curve satisfying (1) to the observed pairs of (time, length) data points. To simplify matters, the value of </> can be estimated by noting the season at the start of the observational period. The value of a can also be gauged reasonably accurately from the knowledge of seasonal activity patterns. To test these growth models, I compared sizes of lizards with known ages with sizes predicted by the models Sexual Dimorphism Minimum size at sexual maturity was determined for females as the SVL of the smallest female containing vitellogenic follicles or embryos in utero (see Chapter 3). Male size at sexual maturity was taken as the smallest male exhibiting spermatogenic stage 6 in the testis. Analysis of covariance (ANCOV A), with logsvl as the covariate, examined the effects of sex on several variables describing the dimensions of the head (head width, head length, head depth) and carcass mass (all variables logtransformed) among juvenile males and juvenile females and adult females versus adult males. Carcass mass (Chapter 2) was used rather than body mass, mainly to compensate for the potential influence of reproductive or diet related factors on total body mass. Correlation and regression statistics were computed for the relationship of log transformations of the variables and logsvl for each age-sex category. The log-log analysis allows statistical comparisons of the allometric equation, (3) MORPHOMETRIC VARIABLE = b(svl)a, where bis a constant (the intercept of the log-log relationship) and the exponent a corresponds to the slope of the log-log relationship. Comparisons of means of the
169 154 morphological variables were made either by nonparametric or parametric two-sample tests RESULTS Growth Size and Age:- Measurements of SVL taken during the mark-recapture study, including 350 lizards and 1225 recaptures, are presented in Fig Although only one generation of newborns (hatch lings) was measured for three consecutive years, these known size-age relationships could be extrapolated to sizes smaller than the asymptotic SVL. These measurements suggest that a hatchling may grow mm during the first year (Fig. 8.1 & Table 8.2). The magnitude of the annual size increment decreased with time to level out, close to zero, at the asymptotic body size ( mm SVL) (Fig. 8.1 & Table 8.1). Figure 8.1 also indicates that 50% of the growth necessary to reach asymptotic SVL occurred during the first three years of life. Size at sexual maturity is 165 and 170 mm for males and females, respectively (see Chapter 3) and from Fig. 8.1 it is thus predicted I that lizards attain this size during the end of their fourth year or early in their fifth year. Moreover, using the average size increment (3.0..± mm/year) of sexually mature lizards during this study it is predicted that lizards may not attain maximum size until the eleventh year. The mean sizes of the different age classes up to maturity did not change much among years (Table 8.2). Figure 8.2A was generated with the SVL-AGE data presented in Fig. 8.1, and it is clear that, in spite of variation, a typical asymptotic growth curve emerged. Growth rate:- Growth rate (GR) was a decreasing linear function of SVL (Table 8.3 ). Although the slopes and intercepts of the regressions of GR on MSVL did differ only slightly (p > 0.001; Table 8.3), sexes were treated separately. The regression of GR on MSVL explained 70% of the variation in males and 66 % in females. Logarithmic transformations (log10) of the SVL and/or GR data did not result in an increase in the amount of explained variation. It is clear from Fig. 8.1 and Table 8.3 that GR in immature as well as young adult lizards varied significantly among seasons.
170 i :::...!.:I z 150 w -'... z w > I... ::::> z Ill I 1986 I I N I D I J I F I M I A I M [ J r J I A I s-1 0 I N I D I J I -i= I M I A I M I J I J i-a I s I 0 I N I D I J I F I M Figure 8.1. Growth records from individually marked C. giganteus at Middelpunt (October, 1985 through March, 1988). Lines connect successive recaptures and different symbols indicate different generations. Annual age categories are indicated by vertical grid lines. 8 :7... U1 U1 I
171 156 Table 8.2. SVL's (mean ± SD) of chronological age groups, from birth to maturity as calculated in March of the years studied (1986, 1987 and 1988). This is the time closest to the birth of new individuals in the population. Estimated age (years) (n) (n) (n) ± 3.67 (5) ± 1.63 (4) ± 4.68 (9) ± 5.37 (11) ± 4.49 (5) ± 4.40 (5) ± 5.78 (8) ± 9.82 (9) ± 3.43 (9) ± 0.71 (2) ± 6.40 (4) ± 7.76 (8) ± 4.24 (10) (1) ± 1.75 (6) ± 5.11 (7) ± 3.46 (9) Table 8.3. Regressions of growth rate (GR) with mean snout-vent length (MSVL) among males and females in the different seasons (summer, autumn and winter). SEX SUMMER AUTUMN WINTER Juveniles & Hales Slope * * * ± 0.01 * - * Intercept ± ± 4.u- 4 * r F 448.5* Juveniles and Females Slope * -8.oo * ,49-5* Intercept 0.32 ± 0.01* 0.16 ± 0.01* 0.04 ± * r F All lizards Slope * ' * * Intercept 0.34 ± 0.01* 0.17 ± 0.12* 0.04 ± * r F * p < 0.001
172 157 ANCOV A confirmed this observation although in mature lizards GR differed significantly only between winter and summer periods (Table 8.4 ). Comparison of growth models:- Although all three the models fitted the AGE SVL data set well, the logistic-by-length model returned a better fit (lowest SSQR/N; highest R 2 ) for the overall data set, the male data set and the fem ale data set (Table 8.5 & Fig. 8.2). Using the interval equations as well as the differential equation to determine the parameters for the different models, the von Bertalanffy model returned a better fit (Table 8.7; Fig. 8.2). Results from the Von Bertalanffy and Logistic models showed no significant difference in the characteristic growth rate (r) between males and females (Tables 8.5, 8.6 & 8.7). In each case, however, the confidence intervals about the estimated asymptotic SVL (A 1) for males and females do not overlap. These results indicate that females attain a larger asymptotic SVL than males but that both sexes approach their respective asymptotic sizes at the same rates (r) (Fig. 8.3). Size at maturity is estimated to be l70mm and 165mm for fem ales and males, respectively (Chapter 3). According to the growth models both sexes will reach maturity during their 4th year. Confidence intervals indicate that growth before maturity is the same for both males and females and that difference in asymptotic size was the result of growth rate differences after maturity (Figs. 8.2 & 8.3). Growth rate as a function of the mean SVL for all male and female recaptures is shown in Fig It is obvious that the observed growth rate (DSVL/DTIME) is variable and not a steadily decreasing linear function of body size. This explains the relative poor fits of these models to the recapture data. It is also clear that all the models underestimate the growth rates of juveniles (85-130mm SVL). The systematic deviation indicates that lizards in this size range are growing faster than is predicted by even the best fitting model (Fig. 8.4).
173 A ~ Figure 8.2. AGE IN YEARS,,... a! s; Cll logistic-by-length (interval data) 2 logistic-by-length (longitudinal data) 3 logistic-by-length (growth rate data).4 Von Bertalanffy (interval data) 90 5 Von Bertalanffy (longitudinal data) 6 Von Bertalanffy (growth rate data) AGE IN YEARS Growth models: A: C. giganteus body size (SVL) as a function of age during recapture study over the period October 1985 through March 1988 in Middelpunt population. Age was determined from Fig B: Growth curve estimates. Using all the recapture data, the estimated parameters (Tables 8.5, 8.6 & 8. 7) for the different growth models determined were used to calculate, growth trajectories. Estimated age at sexual maturity is determined by projection using the three best fit models.
174 159 Table 8.4. Analysis of covariance (ANCOVA) comparing growth rates (mm/day) among seasons (summer, autumn and winter) in the different sex and age classes. Log-SVL was used as covariant to adjust means in all casses. Column values with different alphabetic superscripts in each row are significantly different (p < 0.001). SEX SUMMER AUTUMN WINTER F DF Juvenile 1ales (70 - loomm) Mean ± lse 0.19 ± o.01a 0.1 ± 0.01 b 0.03 ± 0.005C 54,2* 2,61 Juvenile f e1ales (70 - loomm) Mean ± lse 0.18 ± o.01a 0.10 ± 0.14 b 0.03 ± 0.005C 47.8* 2,81 Juvenile tales ( mm) Mean ± lse 0.10 ± o.01a o.o5 ± o.005b 0.01 ± 0.002C 53,7* 2,133 Juvenile females ( mm) Mean ± lse 0.12 ± o.01a 0.05 ± 0.01 b 0.01 ± 0.003C 59,5* 2,157 Adult 1ales (> 171mm) Mean ± lse 0.01 ± o.002a 0.01 ± o.003ab 4.o- 3 ± o.001b 3.7 2,198 Adult fe1ales (> 171mm) Mean ± lse 0.01 ± o.002a 0.01 ± o.002ab 4.o- 3 ± o.001b 1.2* 2,309
175 160 Table 8.5. Summary of parameter estimation for each growth model* for all male and female c. giganteus recaptures. Model SSQR/N B r Kales and Females (n = 1136) Von Bertalanf f y Logistic-by-length Logistic-by-weight Von Bertalanf f y Logistic-by-length Logistic-by-weight Fe11ales Von Bertalanf f y Logistic-by-length Logistic-by-weight l * The solutions to the differential equations (Table 1) were used to fit th~ different models to the SVL (mm) by Age (taken from Fig. 8.1) data set. SSQR/N is the residual error mean square. R 2 is the correlation coefficient. A 1 is the estimated asymptotic SVL. r is the estimated characteristic growth rate. B is defined in Table 8.1. Alspresented are the "conventional" confidence intervals (Schoener & Schoener, 1978).
176 161 Table 8.6. Parameter estimation for each growth model, for all male and female c. giganteus recaptures, estimated by using the interval equation of the growth models described in Table 8.1. Non-linear regression of SVL increment (mm) on time interval (days) were performed. Model SSQR/N r B Hales and Fe1ales (n = 1136) Von Bertalanffy ± ± 7, Logistic-by-length Hales Von Bertalanf f y Logistic-by-length Fe1ales Von Bertalanf f y Logistic-by-length ± ± 5.8 o.8r 3 ± i.u ± ± ± ± 6.1 o, 1r 3 ± 8.4r !0 ± ±
177 I 140 ~ "--_,..~....._~...,_~"----L----L~'--~ AGE IN YEARS Figure 8.3. A comparison of the Von Bertalanffy growth curves for male and female C. giganteus. The growth parameters (Table 8.6) were determined by using nonlinear least-squares regression procedures with the interval equation (Table 8.1 ).
178 163 o.4 [] [],, [] [] >-. ro "d [] '-.,. [] [] [] DID s Et [] [] [] [] "'-/ 61:[][] [] ~ 0.2 ~ ~ [] [] [] a [] [] [] [] [] [] [] [] [] [] t:i::: [] [] ~ 0 ~ ~ 0.1 [] 0.0 [] [] a~d [I] [] Do [] [] [] atf [] D D D a clll [] DDO a D c:d D '2i a MSVL (mm) Figure 8.4. Scatter plots of growth rates against the mean snout-to-vent length (MSVL) for all the recaptures of C. giganteus to compare the fit of three growth models (Table 8.1 ). The predicted growth rates of the Von Bertalanffy (A), logistic-by-length (B) and logistic-by-weight (C) models, fitted by nonlinear least-squares regression.
179 164 Table 8.7. Parameter estimation for each growth model for all male and female C. qiganteus recaptures estimated by using the differential equation of the growth models described in Table 8.1. Non-linear regressions of growth rate (mm/day) on MSVL (L 1 +L 2 /2) were performed. Model SSQR/N r B Von Bertalanf f y Logistic-by-length Logistic-by-weigth o-3
180 165 The seasonal oscillating growth model fitted to longitudinal data sets of small lizards (hatchlings) is depicted in Fig. 8.5, and it is clear that the fit is extremely good. The predicted asymptotic size is in the range of that predicted by the other static models, whereas the characteristic growth rate (r) was. much higher than that predicted by the other models Sexual Dimorphism Apart from the presence of generation glands (van Wyk & Mouton, 1992) in the fore-arm (antebrachial) regions in juveniles and adult males (Fig. 8.6), no obvious sexual differences was noted in either coloration (at any time of the year) and ornamentation among the sexes. Generation glands are present in all males larger than 120 mm SVL. A characteristic feature of C. giganteus is the enlarged occipital scales but these structures showed similar allometric growth patterns to other head dimensions and were not associated with maturity or sex. In the overall sample, the variables studied (head width, HW; head length, HL; head depth, HD; carcass mass, CM) were highly correlated with SVL (Tables 8.8 & 8.9; Fig. 8.7). Mean SVL, and carcass mass of adult females were significantly greater than that of adult males (Table 8.8; p < 0.05) but mean head measurements of adult females were not significantly different from those of adult males. Mean head and body dimensions of juveniles did not differ significantly between the sexes (Table 8.8). Although the means of the head measurements did not differ among adult males and females, the slopes of most of the allometric models differed significantly (Table 8.9). This observation was substantiated by ANCOVA (Tables ). Neither regression analysis nor ANCOV A revealed differences in any of the head measurements among male or female juveniles (Tables ). In all three parameters (HW, HL, HD) the slopes of regressions, with SVL as independent variable, differed significantly among juvenile males and adult males, the slopes of juveniles being the greatest. Between juvenile females and adult females ANCOV A revealed only differences in slope in HD.
181 I 90 ~ ~ ~ ~ ~ lf.i DAYS SINCE BIRTH DAYS SINCE BIRTH DAYS SINCE BIRTH Figure 8.5. Three selected cases from Fig. 8.1 to show the fit of the seasonal oscillating logistic-by-length growth model (see text).

 Fore-arm region of an adult female without any generation glands (GG).")
.")
182 167 Figure 8.6. Photomicrographs to show morphological sexual dimorphism in the incidence of epidermal glands in C. giganteus. (A) Femoral region of an adult female, exhibiting only femoral pores (FP). (B) Fore-arm region of an adult female without any generation glands (GG). (C) Femoral region of an adult male exhibiting both femoral pores and generation glands (GG). (D) Fore-arm region of an adult male with patches of generation glands (GG).
183 168 fable 8.8. Comparisons of body and head size means(± lse) for adult male, adult female and juvenile~ giganteus collected from the Harrismith study area The correlation coefficient of regression of morphometric variable on SVL is given in parentheses. :haracter Adult Adult Juvenile Juvenile Males Females Males Females (n = 88) (n = 139) (n = 21) (n = 32)!)nout- vent length (mm) ± 0.6a ± o.5b ± ± 2.3 Jead width (mm)(0.99) 35.9 ± ± ± ± 0.5 lead length (mm)(0.99) 47.4 ± ± ± ± 0.5 llead depth (mm)(0.98) 20.8 ± ± ± ± 0.3 :arcass mass (g)(0.99) ± l.9a ± 1.6b 98.0 ± ± 4.9 -i..ody mass (g)(0.97) ± ± ± l ± 5.8 '{ote: Different alphabetic superscripts indicate significant difference (P < 0.05)
184 169 Table 8.9. Regression of log head measurements (± SE) with log snout-vent length (SVL) for Cordylus giganteus collected at the Harrismith study area. Stage Head length Head depth Head width Carcass mass Adult tales (n = 88) Slope ** 0.05 ± 0.02** 0.15 t 0.02** ** Intercept ±-3.05** 4.11 ± ± ±: i.03** r F Adult fetales (n = 138) Slope ** 0.06 ± 0.01** 0.13 ± 0.02** **. Intercept ±: 2,74** 9.20 ± ± ±: 0.83** r F Juvenile fetales (n = 27) Slope ** 0.12 ± 0.02** ** ** Intercept ±: 2.60** ± ±: 2.62** ±: i.23** r F Juvenile tales (n = 31) Slope ** 0.12 ± 0.02** 0.19 ± 0.02** ** Intercept ±: 3.5o** ± ± ±: 0.73** r F 60.l Undeterainates (n = 121) Slope ** ** 0.17 ± 0.001** ** Intercept 4.00 ±: 0.01 ** 1.60 ±: 0.01** ± ±: 0.24** r F * p < 0.05 ** p <
185 170 N 408 HEAD LENGTH Figure SVL (mm) Relationship of head length (upper), head width (middle) and head depth (lower) to SVL in C. giganteus. The vertical lines indicate sizes at sexual maturity for males and females respectively. Regression models for juveniles, males and females are fitted (see Table 8.9 for models).
186 171 r~ble 8:10. Analysis of covariance (ANCOVA) comparing log of head length among age groups and sexes of t. giganteus. Group F df p Juvenile males vs juvenile females ,47 > dult females vs adult males ,224 < Table Analysis of covariance (ANCOVA) comparing log of head width among age groups and sexes of ~ qiqanteus. Group Juvenile males vs juvenile females Adult females vs adult males F df p ,47 > ,224 < Table Analysis of covariance (ANCOVA) comparing log snout-vent length among age groups and sexes of!;.. giganteus. In this case log head width was used as covariant. Group F df p Juvenile males vs juvenile females ,47 > Adult females vs adult males ,272 < 0.001
187 bo..., rn ~ rn ~ u ~ u o Males Females # op ~ ~o 0 R> 50.,e 0 0 at sp ~ I Sexual maturity ,..... ~ oo SVL (llllll) Figure 8.8. Carcass mass as a function of SVL in C. giganteus. w
188 173 Therefore, although head size increased with SVL in both sexes, at sexual maturity, the rate.\ of increase in head size of fem ales was less than that of juveniles and adult males (Table 8.9, Fig. 8.7). The rate of increase in carcass mass with increase in SVL is allometric (Fig. 8.8) and seem to be greater in adult females when compared to adult males. AN COY A revealed significant differences in the regression slopes of logarithmic transformed variables (Tables ) DISCUSSION Growth analysis:- Growth and reproduction are two important processes competing for any energy surplus after maintenance costs have been satisfied in the energy budget of an ectotherm (van Deventer, 1978). Although the energy available to an individual may be finite, the factors setting maximum limits may vary seasonally or sporadically, and it is expected that individuals will alter its proportional energy allocation accordingly (Congdon et al., 1982). Such energy trade-offs occur in reptiles and are indicated by reduced or arrested growth rates of reproductive individuals during the breeding season or when food availability is low (Dunham, 1978; Stamps, 1983). Growth in C. giganteus generally corresponds to the basic reptilian pattern where most of the post-natal growth occurs before sexual maturity is reached (Andrews, 1982). The longitudinal and cross-sectional recapture data presented here for C. giganteus also indicate that growth rate declined with age and that all size and sex classes were significantly affected by seasons. The evidence presented shows that after birth in early autumn, hatchlings as well as other juveniles, used most of the food energy acquired to store energy in their fat bodies, to be used for maintenance during the winter hibernation period (see Chapter 7). Following emergence in spring, maximum growth rate coincided with increasing environmental temperatures (Chapter 2) and resource availability (Chapter 6) as well as greater foraging success in all immature lizards. Similar results were reported for both temperate and tropical lizards (Andrews, 1982; Dunham, 1978; van Deventer, 1978).
189 174 In.comparison to other lizards, the growth rate of C. giganteus hatchlings (0.08 mm/day), according to hatchling length in Fig. 8.9 of Andrews (1982), clustered among the slow growth species like the similar sized rock iguanid, Cyclura carinata (Iverson, 1979). Although growth rates of C. giganteus hatchlings born in the same month varied, lizards of the same ag~ and size generally clustered together and it was thus possible to age larger juveniles. Following the three generations of C. giganteus hatchlings, it became clear that occasionally certain individuals grow slower during the first year than others of the same generation (Fig. 8.1). Bradshaw (1971) reported a similar phenomenon in his study on the agamid, Amphibolurus ornatus, although the variation in growth rates was much more extensive in his study. An interesting observation that Bradshaw (1971) made, was that fast- and slow-growing individuals have differing probabilities of survival during seasonal stresses. This phenomenon seem to be less dramatic in the C. giganteus population studied, but nevertheless should be noted since such variation of growth rates make it difficult to estimate age from size in such a population. Whether differential survivorship is associated with the variation in growth rates in C. giganteus is not known and should be persued. Because growth in the first years was well synchronized, the age of maturity could be estimated with reasonable certainty. Age at maturity did not differ between males and females, and was estimated that this size is reached in the fourth or fifth year. These values are within predicted size at maturity for lizards, in general, of this body length (see Fig. 8.3 in Andrews, 1982). Although Tinkle et al. (1970) suggested that viviparity in lizards may be correlated with delayed maturity and greater body size in females, the difference in age or size at which sexual maturity is reached in C. giganteus males and females is subtle. lt could, however, be hypothesized that the smaller size at maturity in C. giganteus males is the result of the rechannelling of resources into early maturation. After maturity is reached, the growth rates of males and females drop considerably in C. giganteus. Using a growth rate of mm/year it is estimated that asymptotic SVL (190mm - 200mm) may be attained at approximately ten to eleven years after birth. As
190 175 suggested in Chapter 3, C. giganteus females may breed biennially or even triennially. Although differential growth patterns among breeding and non-breeding females were not determined, it is expected that vitellogenic or gravid females allocate little energy towards growth and that growth in adult females should be confined to the non-reproductive period. Adult males, on the other hand exhibit peak spermatogenic activity during autumn with the possibility of mating activity in spring. Therefore, following fertilization in spring, the summer period, coinciding with peak food resources and high foraging successes, should be the main growth period. Growth data in lizards are commonly fitted to one of two asymptotic models - the Von Bertalanffy growth model, and or the logistic growth model (Schoener & Schoener, 1978; Kaufmann, 1981; Andrews, 1982). Although both these models produce sigmoidal curves when growth is measured in mass, they differ markedly in shape when growth is measured in length (see Andrews, 1982 for review). Andrews (1982) pointed out that the von Bertalanffy growth model usually fits the growth pattern of long-lived reptiles best (see also van Deventer, 1978; Chabreck & Joanen, 1979; Gibbons et al., 1981; Plummer, 1985). The Von Bertalanffy growth model, however, did not accurately predict the sizes of C. giganteus of known age. It was the logistic models that fitted the data best. However, when the interval equation or differential equations were used, the Von Bertalanffy model fitted best. It was therefore evident that the goodness-of-fit among the models was not great. Growth rate was highest in hatchlings and all indications were that growth rate decreased steadily towards asymptotic SVL, but when parameter estimates were derived from GR vs mean SVL regressions, growth models with little predictive value resulted. Model I regression must meet several assumptions (van Devender, 1978). Although the residuals about the regression line in the C. giganteus data were normally distributed they were heteroscedastic, in which case the analysis is inappropriate and does not describe growth in this species. Fitting both Von Bertalanffy and logistic by length growth models to longitudinal field data of C. giganteus juveniles, showed that size was generally being overestimated even when average growth rate of all the seasons were used to calculate the
191 176 model parameters. Plummer (1985) converted growth age for the snake Opheodrys aestivus, predicted by a Von Bertalanffy model, to chronological age by addition of the total number of inactive months. In analyzing the growth data of C. giganteus it soon became obvious that the significant seasonal "spurts", as Dunham (1978) also found in Sceloporus merriami and are probably the case in most other temperate zone reptiles, would make the use of these growth models inappropriate. Although I attempted to compensate for the effect of seasonal variation in growth by subtracting an inactive period of at least 90 days from the recapture interval over winter, the fit of the growth curves did not improve dramatically. The Von Bertalanffy and logistic growth models are both stationary models in that the parameters are assumed to be time-invariant over the recapture time interval used in the parameter estimation procedure. When extrinsic factors result in significant seasonal variation in growth rates this assumption may not be met (Dunham, 1978; Kaufmann, 1981; Andrews, 1982). As pointed out by Dunham (1978), recapture data should be partitioned into time intervals in order to meet the assumptions.in order to ensure a good fit or predicative accuracy. It was quite clear from the C. giganteus longitudinal field data, that growth in juveniles was markedly affected by winter hibernation. Since little of the energy reserves were utilized for growth in C. giganteus juveniles, maintenance costs during winter seem to be an important factor for survival. Attempts to modify existing growth models to simulate seasonal growth in C. giganteus more realistically proved to hold some potential. Although this model needs to be refined, specially the estimation of confidence levels, it may become a valuable tool in demographic studies concerned with lizards inhabiting temperate zone climates where the length of the interseasonal cold and dry period is a predictable phenomenon. No such attempt has yet been made for other reptiles, although a similar approach has been followed in analyzing seasonal growth patterns in fish (Pauly, 1981). However, while it is, strictly, impossible to estimate individual ages it is possible to obtain a picture of the distribution of ages through the distribution of birth sizes. Therefore, in the refinement of this seasonally oscillating logistic growth model the question of trying to
192 177 reconstruct the distribution of ages to match the distribution of birth sizes needs further investigation. Growth in most reptiles is generally believed to be a determinate phenomenon, although there is some evidence of nondeterminate growth (Bellairs, 1969). Most growth models assume that growth is physiologically limited by processes intrinsic to the animal (Andrews, 1982). Naganuma & Roughgarden (1990), however, suggested that growth is not limited physiologically, but rather is selectively truncated by extrinsic factors to maximize reproductive output. When allowing growth to continue according to an energetic production function, growth only leveled out at unrealistic large body sizes, underlining the importance of incorporation of extrinsic ecological considerations. Sexual dimorphism:- Fitch (1981) reviewed sexual size dimorphism in reptiles and like Schoener (1977) noted that monomorphic species were uncommon and that male+ dimorphism (i.e. males of a species are the larger sex at adulthood) is more common in lizards. As in several other lizard species studied recently (see Cooper & Vitt, 1989), sexually mature males of C. giganteus have larger heads than females of similar SVL. However, like the lizard species Sceloporus undulatus (Cooper & Vitt, 1989) and Barisia monticola (Vial & Steward, 1989), sexual dimorphism in the head size of adults is due to an apparent larger decrease in female head size relative to juvenile and male head sizes. On the other hand, body size (SVL) increases at a rate greater than head size once C. giganteus females reach sexual maturity. Therefore, the data presented here for C. giganteus suggest that this cordylid can be regarded as female+ dimorphic, which corroborate, the results of Jacobsen et al. (1990). Female+ dimorphism is not uncommon for reptiles since Schoener (1977) and Fitch (1981) noted this phenomenon in about 30% of the species they studied. Shine (1990) put forward two main possibilities for ontogenetic determination of sexual differences in mean adult size. Firstly, he hypothesized that sexual differences in body size are determined by processes operating on juveniles either by differential growth rates or in the age at maturation. Secondly, sexual differences may be determined by sexual differences in growth and survival in adult life. He concluded that, in general, differences in prematurational growth, age at maturity, or both may be the primary
193 determinants of sexual dimorphism in adult body size. The female+ dimorphism in C. giganteus, however, seem to be explained better by the second possibility since maturation size of males and females was very similar with little evidence of delayed maturation in females. As in the territorial iguanid lizard, Sceloporus undulatus (Cooper & Vitt, 1989), the decrease in slope of the regression of head width and depth on SVL after sexual maturity in C. giganteus fem ales may be explained on the basis that fem ales allocate relatively more energy to growth of reproductively significant morphological characters after reaching maturity than to characters less directly tied to reproductive success. Females must deal with the metabolic costs of vitellogenesis (Packard et al., 1977) and, in viviparines, gravidity (Guillette, 1982), while males have no such energetic costs. One of the assumptions associated with this explanation is that a relative increase in SVL implies a greater potential reproductive output in the form of increased clutch size (Tinkle et al., 1970; Trivers, 1976; Gibbons et al., 1981; Tinkle & Dunham, 1986). Although clutch size in C. giganteus females did not increase significantly with increasing SVL, ovulated egg mass increased with female SVL. Limited data indicated that hatchling size increase with increasing female SVL in C. giganteus (Chapter 4 ). The fact that hatchling size is usually positively correlated with female size (Steward, 1979) could suggest that the selective advantage of larger hatchlings have a greater survivorship possibility and/or increased fitness of larger young produced prior to winter hibernation. Viviparity, particularly in lizards, tends to be correlated with delayed maturity and greater body size at sexual maturity (Tinkle et al., 1970). These factors could serve to hold minimum female size relatively invariable, while not constraining minimum male size (Powell & Russell, 1985). Delayed reproduction and fem ale+ dimorphism are found in several viviparous reptiles (Gregory, 1977; Benton, 1980; Madsen, 1983; Guyer, 1978). Powel & Russell (1985) reported delayed maturity in females of the viviparous lizard, Phrynosoma douglasii brevirostre, suggesting it could well be that more resources are devoted to early maturation than to growth, with a consequent small size at maturity in
194 179 males. Whether the small difference in size/ age at maturity in C. giganteus sexes is real & the result of a decrease in male growth before maturity is reached is unknown. The possibility that head proportions or body size in C. giganteus have diverged between sexes as a result of their importance as sex-recognition cues is unlikely. Ghiselin (1974) discussed the phenomenon of sexual size dimorphism in the context of sexual selection and set out four possible types of male-male competition which would promote it. He suggested that three of these would most likely lead to male+ dimorphism or to monomorphism. The fourth, male dispersal competition, puts a premium on mobility and early maturation in males and he suggests this category is the most likely to lead to fem ale+ dimorphism. The implication of this hypothesis is that if males are selected for mobility and early maturation, they are likely to devote more resources to these functions than to grow in body size, and thus are likely to be smaller at maturity than females, which are under no such constraints (Powell & Russell, 1985). Furthermore, relatively low densities in C. giganteus populations ( < 20 indivduals/ha; Chapter 9), and a low frequency of intraspecific encounters suggest that there is little selection for features associated with male-male agonostic encounters but much selection for features facilitating male mobility and mate-searching abilities. C. giganteus females were more sedentary, confined close to their burrows whereas it was adult males that frequently moved long distances to "seek" females. In summary then, data suggest that C. giganteus males attain their asymptotic size more rapidly than females do theirs, by early cessation of growth, and that females attain a greater asymptotic size by relative prolongation and a more gradual tapering off of growth. Although there was some indication that males mature at an earlier age/size than females, it seems more probable that female+ dimorphism is attained after maturation as a result of differential growth. It seems unlikely that sexually dimorphic morphological features play a role in mate recognition or selection in C. giganteus.
195 180 CHAPTER NINE POPULATION DYNAMICS 9. L INTRODUCTION The great diversity of life histories exhibited by squamates has stimulated attempts to summarize and explain the patterns of life history variation (see Tinkle et al., 1970; Stearns, 1984, Dunham & Miles, 1985; Dunham et al., 1988). A large database now exists, describing variation in life histories, demographies and population dynamics among lizard \ species (e.g. Tinkle et al., 1970; Dunham, 1981, 1983; Ruby & Dunham, 1984; Tinkle & Dunham, 1986; James & Shine, 1988; Henle, 1989, 1990a) and among populations of single species (e.g. Bradshaw, 1971; van Devender, 1982; Abts, 1987; Pilorge, 1987; Henle, 1988, 1990b ). Nonetheless, data for testing current theories of life history evolution in lizards remain inadequate (Dunham, 1982; Dunham et al., 1988 a,b) and demographic studies of populations of species over a wide range of environments are needed (Ruby & Dunham, 1984; Henle, 1989). Population dynamics include three basic aspects of the demography of a species: ( 1) the study of changes in the numbers of individuals in populations, (2) the factors influencing these changes, and (3) the mechanisms (if any) by which numbers are regulated (Solomon, 1971; Turner, 1977). To attend to these aspects of population dynamics, several questions need to be addressed regarding factors influencing natality, immigration, emigration and mortality. The available population dynamics studies are highly biased towards small, short Jived species reaching maturity in less than 2 years (see Turner, 1977; Abts, 1987; Bull, 1987). Although the generation of Jif e tables may provide schedules of births and deaths, as a function of age, it is usually the causes of death that interest ecologists when analyzing the
196 181 dynamics of a population. Little is known about this aspect in most lizard populations studied (Bradshaw, 1986) and could supply valuable information for the management of populations with a vulnerable conservation status. It may be hypothesized that survival in lizards is not age-dependant and therefore, show a linear decline with ageing of the cohort (Bradshaw, 1986). At first this seems an unlikely conclusion, specially since many studies suggest otherwise, namely that there is greater mortality early in life and improved survival later (see Turner, 1977; Bradshaw, 1986 for reviews). There is evidence to suggest that if climatic factors are the primary reasons for death, then the former pattern may result (Bradshaw, 1986), but when biotic factors such as competition for resources or predation result in death, survival may indeed be age-dependant. Life history information, especially aspects of population dynamics, derived from observations of marked lizards is virtually nonexistent for South African lizards. In light of the conservation status of C. giganteus, speculations regarding longevity (Branch & Patterson, 1975; Marais, 1984; van Wyk, 1988; Jacobsen et al., 1990), and the possibility of high mortality pressures in juvenile classes (van Wyk, 1988; Jacobsen et al., 1990), calls for information regarding these aspects of population dynamics in C. giganteus. The purpose of this study was, therefore, to collect data pertaining to aspects of population dynamics in C. giganteus, including seasonal changes in population size, age structure, sex ratio and age-specific survivorship. In addition, population features of two geographically distant C. giganteus populations are compared METHODS Study Areas and Lizards Demographic information from two populations was collected during the period 1984 through The primary data set (mark-recapture s~udy) came from a population resident on the farm Middelpunt (see Chapters 2 & 8). A total of 350 lizards was marked, and 1225 recaptures were recorded at the Middelpunt site. In addition, the seasonal distribution of age/size classes of lizards collected for autopsy studies at the Harrismith
197 182 study area (Greenlands; Chapter 2) was used to evaluate aspects of inter-population variation. Physical and climatic characteristics of both study areas are described in Chapter Data Collection This study area was visited at approximately six week intervals and lizards of all age classes were collected with a noose or small mass net covering the entrance of the burrow (see Chapters 2 & 8 for more details) Data Analysis The mark-recapture procedure provided data on age-specific survivorship, sex ratios, age structure, population density and aspects of dispersal. Most lizards could be reliably aged from size of first capture and growth patterns (see Chapter 8). Because mathematical growth models (see Table 8.1) did not predict ages of known age lizards accurately, a method of extrapolation from longitudinal recapture data of known-age lizards was used to age lizards (Fig. 8.1 ). Adult lizards could not be aged with any certainty and were aged according to size class and annual growth rate. Changes in the dynamics of the population were therefore also analyzed using SVL rather than age classes. Population size and age-specific survival estimates:- Population size was estimated from direct observations. New captures declined following the second visit to the study area. Because these lizards are conspicuous and diurnal in activity, the direct count method (Caughley, 1977) could be used with confidence. The fact that these lizards were captured with relative ease made C. giganteus particularly suitable for a reliable population estimates. I plotted the capture records of all the lizards and from this graph, emigration or death of.individuals could be determined. If an individual was not captured during three consecutive capture periods (each period lasting at least five days in the field) it was considered lost (dead or emigrated). After the initial estimation of population size, new lizards captured were marked as immigrants. Age structures, sex ratios and agespecific survival schedules were calculated during March (following parturition) and October (following hibernation).
198 183 In order to evaluate the seasonal frequency of movement between burrows, the change in capture (i.e. burrow) position as well as the sex of the co-inhabitants of the burrows was noted after every capture period. Short-term movement or home range movements rarely occurred and was therefore not included in this study. Lizards collected for autopsy provided additional data on the seasonal changes in age structures of Juveniles (all immature classes) in the Greenlands population (100 km east of the Middelpunt population, see Chapter 2 for details). Burrows were opened, until at least six adult males and females were captured. Immature lizards encountered were also collected and the monthly sample should, therefore, represent a close to random sample and reflect true sex and size ratios in the population. Statistical procedures:- I used parametric statistics to examine the data when the data did not seriously violate the assumptions of those tests; analogous nonparametric procedures (Zar, 1984) were used when the assumptions of parametric procedures could not be met. Probability values smaller than 0.05 were recognized as significant RESULTS Population Size and Density The estimated population size at the Middelpunt study area varied between 130 and 180 lizards (Table 9.1). Excluding the estimate for March 1988, a stable population size was observed during 1986 and 1987 (Table 9.1). Densities fluctuated accordingly, ranging from 8.93 lizards/ha lizards/ha (Table 9.1). From the 180 burrows excavated at the Greenlands study area, an overall density of lizards/ha was obtained Age Structure and Sex Ratio Middelpunt study area:-size and age distributions of lizards in March and October for each year are shown in Figs. 9.1 & 9.2. It is evident from these figures that apart from the March 1987 sample, sexually mature lizards dominated in all the other samples. The absolute and relative abundance of 2 yr-olds through 4 yr-olds were low in all samples. The relative abundance of lizards younger than 2 yr varied from highest numbers just after
199 184 Table 9.1. Population size and density estimates for~ giganteus at Greenlands (removal study, July April 1985) and Middelpunt (October March 1988) study areas. DATE ESTIMATED DENSITY BURROWS DENSITY SIZE (N) (N/ha) (N) (N/ha) GREENLABDS MIDDELPUNT Octo!>er 1985 March 1986 October 1986 March 1987 October 1987 March 1988 X ± lsd ± ±
200 185 IHB HATCHLINOS 4 o ~ ADULT MALES OCTOBER ADULTFEMAL MARCH z OCTOBER 1986 MARCH 1987 OCTOBER MARCH Figure 9.1. O AGE CLASSES (Yrs) Age structures of male and female C. giganteus in the Middelpunt population for October - March
201 186 HATCHLINOS ADULT MALES ADULT FEMALES -~ '-' z 0 f::: <...:I ::i u.. 0 z 0!== ~ ~ to MARCH 1987 OCTOBER 1987 SVLCLASSES 0 = mm 1 = mm 2 = mm 3 = mm. 4 = mm 5 = mm 6 = mm 7 = mm 8 = mm 9 = mm 10 = mm s 6 7 SVLCLASSES MARCH 1988 Figure 9.2. Size distributions of male and female C. giganteus m the Middelpunt population for October - March
202 187 parturition in February to lowest in late summer. The ratio of hatchlings relative to adult females in the March 1986 and 1987 samples were 0.40 and 0.57 respectively. It is evident from Figs. 9.1 & 9.2 that the age and size distributions did not change dramatically among samples (excluding the first and the last) in this population. The average sex ratio of adult males and females did not deviate significantly from an assumed 1:1 ratio (1:1.38 ± 0.12; x2 = 2.56; p > 0.05). The sex ratio of adults changed significantly among samples (X2 = 11.5; 4 d.f.;p < 0.05) but although females occurred in greater numbers, the sex ratio in all samples did not differ significantly from the expected 1:1 ratio (p > 0.05; Table 9.2). The average sex ratio of immature males and females also did not deviate from the assumed 1:1 ratio (1:1.07 ± 0.26; x2 = 2.20; p > 0.05; Table 9.2) and did not differ significantly among seasonal samples (X2 = 1.5; p > 0.05 ). It is evident from the size and age distributions in the Middelpunt population that the asymptotic size of adult males are smaller than that reached by females (Figs. 9.1 & 9.2). Fraserspruit and Green/ands study areas:- Size and age distributions of lizards collected at Fraserspruit study area during February 1984 to June 1984 is shown in Fig. 9.3A and that of the Greenlands population, collected during July 1984 through April 1985, in Fig As was the case in the Middelpunt population, immature lizards (120 mm mm SVL) were rarely collected. The age structure of these populations did not differ significantly (X2 = 8.0; 8 d.f.; p > 0.05) but did differ significantly from the Middelpunt population in all comparisons (Greenlands vs Middelpunt, March 1986: x2 = 49.5, 9 d.f.,p < 0.001; March 1987: x2 = 62.8; 9 d.f., p< 0.05; October 1986: x2 = 56.4, 9 d.f., p < 0.05; October 1987: x2 = 63.4, 9 d.f., p < 0.05). As in the Middelpunt population, males were generally smaller than females (Fig. 9.3). Comparing the three populations (Middelpunt, Fraserspruit and Greenlands), smaller asymptotic sizes of males in the Fraserspruit and Greenlands populations with regard to the Middelpunt population became evident (X2 = 31.3; p < 0.05; Fraserspruit, autumn-1984 vs Middelpunt March 1986 and x2 = 29; p < 0.05; Greenlands, summer-1984 vs Middelpunt October 1986). A similar result was found when comparing adult female size distributions among these populations (X2 = 28.3; p < 0.05 and x2 = 42.7; p < 0.05).
203 188 Table 9.2. Sex ratios by season in different c. giganteus populations (Fraserspruit, Greenlands and Middelpunt). C. giganteus population (Interval) Juvenile sex ratio (female/male )(n) Adult sex ratio (female/male)(n) Fraserspruit (Feb 84-Jun 84) Greenlands (Jul 84-Dec 84) Greenlands (Jan 85-Apr 85) Mean ± 1 SE Middelpunt Oct 85-Mrc 86 Mrc 86-0ct 86 Oct 86-Mrc 87 Mrc 87-0ct 87 Oct 87- Mrc 88 Mean ± lse * x2 test, P < (15) 1.50 (15) 1.60 (16) 1.55 ± (39) 0.88 (33) 0.93 (27) 1.40 (24) 1.25 (23) 1.07 ± (72) 1.82* (79) 1.67* (80) ± (108) 1.30 (108) 1.44 (93) 1.46 (95) 1.48 (96) 1.38 ± 0.11
204 189 PERCENTAGE 40~~~~~~~~~~~~~~~~~~~~~~~~---, A EHB JUVENILES 30 ~ ADULT MALES - ADULT FEMALES 20,-... ~ 10.._,, z 0 -f-1 < ~ ::::> ~ 0 ~ 30 ~ 0 z -0 f-1 20 i:i:::: 0 ~ 0 i:i:::: 10 ~ B c g 10 SVL CLASSES Figure 9.3. Size distributions of male and female C. giganteus in the Frazerspruit (A) and Greenlands populations (B,C) (removal study) for July- April
205 190 Average sex ratio m the adult group in the Fraserspruit population did not significantly deviate from a 1:1 ratio w~ilst it did in the Greenlands population (Table 9.2). In both populations were the mean sex ratio close to an equal ratio (Table 9.2) Survivorship Survivorship schedules of different cohorts computed for summer and winter periods in every year ( at Middelpunt) are presented in Table 9.3. Estimated survival of hatchlings during their first autumn/winter period ranged from 92% (1986) to 94% (1987). Apart from 2 yr-olds all the other age classes survived the autumn/winter period well ( > 80% ). cohorts. Summer survival, however, varied markedly among years and The lowest survivorship was computed in all the juvenile (immature) cohorts during summer of 1987 /1988. Adult survival as a rule remained high in all the intervals of study. Annual survivorship for the different cohorts over the 3.5 year period is shown in Table 9.4. First year survivorship (hatchlings) was 63%. For age classes..?.. 2, I regressed the natural logarithm of the number of survivors (In S) in an initial cohort of 100 on age x (in years). The regression equation for females (1986), ln S = x (r = , p < 0.001) and males (1986), ln S = x (r = , p < 0.001) support the hypothesis of linearity (age-constant mortality)(turner, 1977). The slopes for males and females (1986) were significantly different (ANCOVA, F18 = 20.9, p < 0.001). Annual survival (S ' = eh, where b is the slope from the above regressions and e is 2.718) for females was 80% and for males 59% during During the 1987 interval annual first-year (hatchling) survivorship decreased markedly (16%). Although the survivorship regression equations differed significantly among years and sexes (ANCOVA, p < 0.001), the annual survival rate was above 80% for both males and females in age classes.l 6 (Table 9.5).
206 191 Table 9.3. Age-specific survivorship of C. giganteus during the mark-recapture study ( ) at the Middelpunt study population. AGE CLASSES (Yrs) INTERVAL Oct 85-Mrc 8 (Summer) N at start N at end % Survival N Recruits 32* Mrc 86--0ct 86 (Winter) N at start N at end % Survival Recruits Oct 86-Mrc 87 (Summer) N at start N at end % Survival Recruits 32* Mrc 87--0ct 87 (Winter) N at start N at end % Survival Recruits Oct 87-Mrc 88 (Summer) N at start N at end % Survival Recruits 13* * Hatchlings
207 192 Table 9.4 Cohort survival of c. giganteus since first capture during the mark-recapture study ( ) at the Middelpunt study population. AGE CLASSES o* o* st marked N marked % 1st yr s % 2nd yr s * Hatchlings Table 9.5. Annual cohort survival of c. giganteus during the mark-recapture study ( ) at the Middelpunt study population. AGE CLASSES o* HARCll: MARCH 1987 FEMALES MALES MARCH MARCH 1988 FEMALES MALES * Hatchlings (1:1 sex ratio assumed in age classes ~ 2)
208 Aspects of Dispersal Since it was attempted to mark every individual lizard in the study area, the extent of immigration could be directly estimated (Table 9.3). Because I did not search for marked lizards in adjacent areas, no true assessment could be made of emigration relative to mortality. Therefore, no attempt was made to differentiate between emigration and mortality. Apart from the occasional daily movements away from their home burrows, lizards remained within a 2 meter radius of the entrance of their burrows (Chapter 10). The frequency of burrow changes by individuals were determined on a monthly base (Fig. 9.4 ). lt is clear that in any month no more than 31 % of the lizards shifted to another burrow (Fig. 9.4 ). Figure 9.4 depicts that more changes occurred during spring and early summer periods (mating period)(x2 = 39.7; p < 0.05). There was no significant difference between the frequency of movement of males and females among recapture intervals (X2 = 4.5; p > 0.05) Life Table Life tables for female lizards are presented in Tables 9.6 & 9.7. Because of the stringent assumptions of vertical life tables on the one hand and the longevity of C. giganteus on the other hand, I constructed "hybrid" life tables (see Dunham et al., 1988b ). Although the population size remained approximately constant over the study period (Table 9.1), I assumed that the average population was more or less stationary for the period , but changes in the age-specific mortality and immigration/ emigration rates could have occurred among the years 1986 and The tentative life tables emphasize the high mortality early in life, especially in lizards_:::;_ 2 yrs. The overall result of the life table functions is summarized as the net replacement rate, R 0. Average fecundity is calculated to be 2.7 young per gravid female and did not change significantly with change in the body size of mature females (Chapters 3 & 4). Assuming a 1:1 sex ratio at birth, and that most females reproduce biennially, a replacement rate of l.02 fem ales produced per female per generation is predicted using the 1986 survivorship schedules (19 years; Table 9.6). Using the same procedure but with the
209 194 - FEMALES m:j MALES ~JUVENILES D NO CHANGE PERCENTAGE MOVED 100..:..:.:::;:~::.:;:~~.;=--.-,:-TT~rr--r-r-r-r--rr-Tl~TT~rr-r I INTERVALS 1,.. 2 J = = 11 = 12 = lj = INTERVALS Oct'B5-Dec'B5 oec'b5-jan'b6 Jan'86-Mrc'86 Mrc'86-May'86 May'86-Sep'86 sep'86-nov'86 Nov'B6-Jan'87 Jan'87-Mrc'B7 Mrc'B7-May'87 May'87-Sep'87 sep'87-nov'87 Nov'87-Jan'88 Jan'88-Mrc'88 Fl GU RE 9.4. Frequencies of changes in resident burrows during the preceding interval.
210 195 Table 9.6. Life table for female ~_ganteus at Hiddelpunt based on the survival schedules of 1986 and an average fecundity of 0.7 young per mature female. The average fecundity of 2.8 was corrected for a 1:1 sex ratio and a biennial reproductive frequency. x ' mx 0.0 o.o 0.0 o.o lxmx o.oo 0.00 o.oo o.oo o.oo R 0 = 1.02
211 Table 9.7. Life table for female C. giganteus at Middelpunt based on the survival schedules of 1987 and an average fecundity of 0.7 young per mature female. The average fecundity of 2.8 was corrected for a 1:1 sex ratio and a biennial reproductive frequency. x o.oo 0.00 mx lxmx o.oo o.oo o.oo R 0 = 0.14
212 survivorship schedules a much lower female replacement rate of 0.14 females produced per female per generation is predicted (Table 9.6). The estimated average of 0.7 hatchlings per adult female, based on fecundity schedules obtained from the Fraserspruit and Greenlands populations, was. higher than that for Middelpunt (0.52 and 0.56 in 1986 and 1987 respectively). In order to reach R 0 = l, when working with a 0.54 fecundity rate, it was estimated that females will have to survive to an age of 19 years (14 years of maturity). The annual survival regression model (based on 1986 survivorship schedules) for females indicate that when starting with an initial cohort of 100, females may survive at least 18 years DISCUSSION Rigorous tests of life history theory reqmre information on key demographic parameters for a much larger and more diverse sample of lizards than used up to now in such analyses (see Turner 1977; Dunham et al., 1988a,b). Evident from these reviews is the lack of demographic information on large-bodied, long-lived viviparous lizards and lesser known groups, in particular members of the family Cordylidae. Populations are rarely considered over different years, when environmental conditions and other factors such as predator pressure might vary considerably. As pointed out by van Devender (1982), demographic studies should contribute to knowledge in at least three ways. Firstly, the study should describe important biological aspects of the populations and identify critical stages in the life history of the species. Secondly, general patterns must be found among related or similar species. Thirdly, the new data should be used to test possible theoretical models. Population density.- In his summary of squamate population dynamics, Turner (1977) asked the question of whether large lizards have lower population densities, but because of a lack of information withheld a generalization. For all lizards included in his review, Turner ( 1977), reported an average of 51 lizards/ha, which was based on studies of mostly small sized lizards. C. giganteus densities at both study sites were lower (8-11/ha) than most of the lizard densities listed by Turner ( 1977). Jacobsen et al. (1990) reported a
213 198 density of 6.5/ha in another C. giganteus population. Bull (1987) and Henle (1990a) reported much lower densities (l-3/ha) for the large viviparous lizard, Tachydosaurus rugosus (305mm SVL). Similarly Abts (1987) reported densities of 13-25/ha in his study on the chuckwalla, Sauromalus obesus (200mm SVL). Although a large lizard like the marine iguanid (Amblyrhynchus cristatus, l.6kg) maintains densities of around 900/ha, indications are that large lizards generally exhibit lower densities than smaller ones. The only other cordylid population studied (Cordy/us cordylus, 75mm SVL; Burrage, 1974), exhibited great variation in densities, ranging from /ha. It is clear that population densities may not necessarily be a function of body size but rather several independent variables, e.g., the structural complexity of the environment and energy resources of the system (Turner 1977; Pianka, 1973). Age structure and population size.- A temporal sequence of cross sections is a simple way to depict population dynamics (see Turner, 1977; van Deventer, 1982; Dunham et al., 1988). Implicit in demographic analysis, especially when employing mark-recapture procedures, is the assumption of equal catchability of all individuals (Caughley, 1978; Plummer, 1985). Although in most studies concerned with free ranging lizards uphelding this assumption may be a problem. However, it was maintained in this study, since marked I C. giganteus lizards of all age classes were easily captured and recaptured. The age structure schedules of the populations studied did differ significantly but an overall pattern of low juvenile numbers emerged. Stoltz & Blom (1981) and Jacobsen et al. (1990) reported similar age structures in which less than 20% of the population contributed to the juvenile group. Bull (1987) and Henle (1990a) reported similar figures (6-22%) for juveniles and subadults in populations of the large Australian skink Trachydosaurus rugosus. The constancy of the age structure among years and C. giganteus populations points towards the attainment of a stable age distribution in the Middelpunt population which could only be the result of relative long term constant mortality schedules and rate of increase or decrease. /
214 199 Jacohsen et al. (1990) suggested that the C. giganteus lizards in the Majuba population are smaller in size than the Orange Free State lizards (comparisons based on largest SVL's). Although it is difficult to compare the results of the current study with that of Jacobsen et al. (1990) because they did not present a detailed age/size structure, it is apparent that the smaller males and females from the Harrismith population are similar in size to the lizards in the Majuba population and that adult lizards in the Middelpunt population arc generally larger. Stolz & Blom (1981) reported on a C. giganteus population at Sterkfontein dam (close to the present study area) and although they mention that lizards may weigh up to 300 g, it is not clear whether this was an exception. Geographic variation in body size schedules may either be genetically based or represent ecophenotypic variation (see Dunham 1982; van Devender 1982; Ruby & Dunham 1984 ). The latter possibility implies concurrent variation in food resources, magnitude of competition or predation. Alternatively, proximal environmental factors may favor shifts in energy allocation in order to compensate for changes in size-specific maintenance costs (Ballinger 1983) or their may be differences in the growing season of males and females among populations (Ruby & Dunham, 1984). The extent of geographic variation in body size distributions of C. giganteus populations needs more research before explaining such variation. Population estimates, in the case of C. giganteus, based on direct counts (complete census method) together with recapture history of individuals, suggested that this population represent a typical stationary population, in which no drastic change in total numbers occurred among years or even among seasons. This is the pattern reported for other long lived lizard species (Turner, 1977; Abts, 1987; Bull, 1987). Survivorship and sex ratio.- The present study and two others (Stolz & Blom 1981; Jacobsen et al., 1990) show that C. giganteus mortalities are high in the first two years. Since young are born in autumn it may be speculated that mortality, due inadequate energy reserves for hibernation could be a major factor. Bull (1987) suggested 61 %-81 % juvenile mortality for the large skink (Trachydosaurus rugosus). In another large lizard, 1st-year survival in chuckwalla populations.in the Colorado desert was affected by summer rainfall
215 200 and varied from 14% to 53% during wet and dry summers respectively (Abts 1987). In contrast to 'J'rachydosaurus, C. giganteus hatchlings survived the winter hibernation reasonably well (72% & 94%). Whether the assumption of high winter mortality is valid in the study of Bull (1987) is uncertain since he assumed that females reproduced yearly and from this assumption he predicted the number of births in autumn. If the T. rugosus fem ales prove to reproduce biennially then winter mortality would be much lower because births were overestimated. Summer survival of C. giganteus juveniles was more variable and it seems reasonable to accept that predation was the major cause of mortality in these classes. Bull (1987) also recognized predation as a potential source of juvenile mortality in his study on'/'. rugo.ms. Yellow mongoose (Cynictis penicillata) was a common sight in the Middelpunt study area, especially during summer of 1987 /1988 and observed on two occasions to take C. giganteus young. Although Cynictus penicillata mainly prey on insects, the relative abundance of reptilian items in the diet, range from 6% - 11 % (see Smithers, 1971; Lynch, 1979). It may be that the proportion of lizards preyed upon may change dramatically in grassland areas where C. giganteus occur. Jacobsen et al. (1990) also mention black-headed herons and the spitting-cobra (Hemachatus haemachatus) as predators. Although adult lizards may be less susceptible to these predators because of their size and spiny tails, juveniles, being smaller and without the sharp tail spines, would be less able to deter predators. Research is needed to establish whether the predator load changed in the small islands of grassland remaining between the large cultivated areas. Marais (1984) suggested that C. giganteus males may be cannibalistic (presumably in captivity). In the present study only two incidence of cannibalism were noted, both being adult females (Chapter 6). Older, larger lizards ( > 2 yr or > 120 mm SVL) generally had higher survival rates than younger lizards. Sources of adult mortality are unknown and because the magnitude I of emigration was not determined, it is beyond the scope of this study to explain losses in the adult C. giganteus classes in the population studied. Annual survivorship in adults ranged from 59% - 80%. This is among the highest estimates reported for viviparous lizards (see Turner, 1977; Krekorian, 1984 ), conforming with the general notion that larger
216 201 lizards live longer and that survival of adults is high (Turner, 1977; van Devender, 1982; Bull, 1987). Increased survivorship with age and size may be the result of several factors including the dose association with a deep and long burrow, the heavily armored body with enlarged spines on the thick tail, the enlarged occipital spines enabling the lizard to anchor itself to the roof of the burrow and a keen eyesight. In all the C. giganteus populations studied the sex ratio did not differ significant!~ from the expected 1: I ratio, but adult females always outnumbered the adult males. Jacobsen et al. (1990), reported a ratio of 1:1.57 which proved to deviate significantly (X 2 = 24.5; p < ().05) from the expected l:l ratio (Calculated from their Fig. 6 & Table 1). The sex ratio of immatures did not differ significantly from the expected l: 1 ratio, but evident from the present study and that of Jacobsen et al. ( 1990) was that the sex ratio is more balanced in the juvenile classes. The differences in the adult classes could he the consequence of differential survivorship in populations like the Majuba one (Jacobsen et al., 1990). To test this hypothesis the slopes of the C. giganteus annual survivorship regressions of the different sexes (Middelpunt population) were compared. During 1986 the estimated annual survivorship of adult males (59%) was significantly lower than that of adult females (80%). This was, however, not the case in 1987 when annual adult survival (males & females) was estimated as being above 80%. A possible explanation for lower annual survival in males may be that the specific behavior of males during the breeding season entails a higher risk of predation than females. However, although more males generally disappeared during intervals between recaptures, these differences, again, were not significant (p = 0.07). This Jack of clear differential survivorship between the sexes is similar to some other reports (e.g. Ruby & Dunham, 1984; Pilorge, 1987) contrasts with studies on Uta (Tinkle, 1967) and Sceloporus (Blair, 1960; Tinkle & Dunham, 1984) where males survive less well, presumably as a result of predation while males defend breeding territories.
217 202 Di.r;per.r;al.- Recapture locations of lizards show that C. giganteus remained at the burrow of original capture for most of the study per.iod. It was also clear that juveniles were not forced from their natal burrows by sub-adults or adults, similar to the findings of Jacobsen et al. (1990). Although the greatest frequency of burrow change was observed during spring at the time of mating, both sexes changed burrows at this time. This is more evidence contradicting the suggestion that males are subjected to higher predator pressure and therefore resulting a female biased sex ratio. Jacobsen et al. (1990) reported that males and females were found together in the same burrow in higher frequencies during September and October suggesting increased inter-burrow movements during this time. Immigration was generally low with the most new adults captured during summer Although estimated mortality rates confound true mortality with emigration, assuming that emigration is roughly equal to immigration in a stable population then it seems reasonable to accept that emigration and immigration did not influence survivorship, population density and population structure dramatically. Life Table.- Dunham et al. ( 1988b) underlined the importance of life tables in the analysis of reproductive and life history adaptation as well as their predictive value in population dynamics. The overall result of the life table functions in C. giganteus is summarized as the net rep.lacement rate, R 0, which is 0.64 females produced per female per generation when based on the 1986 C. giganteus life table and 0.3 when based on the 1987 C. giganteus life table. This calculation indicated that the Middelpunt population was declining during the study period, , and if continued, this would lead to local extinction of the population. However, this conclusion is inconsistent with the markrecapture data which indicated that the population was reasonably stable during this period. Because of the short term nature of this study and the absence of reliable longevity data it was difficult to decide upon a good estimate of productive reproductive years of a mature female. Using the 1986 age-specific survivorship schedules, it was predicted that after 17 years a female (assuming biennial reproduction and a 1:1 sex ratio of young) would have replaced herself (R 0 2- I). This was substantiated by using the annual survivorship regression for females during Jacobsen et al. (1990), although they do not give any
218 203 information, suggested a life span of at least 10 years. The extremely low survival in the juvenile dasses during 1987/1988 period yielded a life table that predicted R 0 = 0.3, which means rapid local extinction. If it is assumed that summer 1987 was an exceptional -I,. bad season for juvenile survival in the Middelpunt population or that it was a localized phenomenon within the larger Middelpunt population, population size in this long lived species would eventually recover. On the other hand if the increase in juvenile mortality proves to be a by-product of habitat destruction as result of increased predator loads in the remaining natural grassland areas there must be some concern about the long-term survival of such populations. In summary then, the estimated size of the Middelpunt study population remained reasonable stable during the study period (October April 1988). Densities ranged from 9-11 lizards/ha. Age or size schedules did not change dramatically over the study period. The age structure was marked by the low relative abundance of 2nd - 4th-year olds. Noteworthy was that adult males and females from the Greenlands study area (removal study) were significantly smaller than those at the Middelpunt study area. Immature classes were marked by a 1:1 male-female ratio and although adult females generally outnumbered adult males the sex ratio in the adults did not significantly deviate from an expected 1:1 sex ratio. Survivorship during the first year (1986) was high (65%) but was much lower (16%) in the 1987 cohort. Mortality was highest during summer months rather than winter months and overall it seems that the first two years of life is the most critical when comes to survival. Average annual survival of adults were generally high but differed significantly among sexes and years (ranging from 58%-80%). A life table yielded a net reproductive rate (R 0 = l) sufficient to sustain the population, if assumed that the reproductive life of an adult female is at least 12 years (ca. 18 years old).
219 204 CHAPTER TUN MICROCLIMATE, ACTIVITY AND ASPECTS OF THERMOREGULATION 10. l. INTRODUCTION Since the body temperature of a lizard depend mainly on the exchange of heat between its body and the immediate physical environment, it is not surprising that daily and seasonal activity patterns are so often explained by the variation in the characteristics of the physical environment. It was Cowles & Bogert (1944) who demonstrated for the first time how desert lizards may behaviourally control body temperature, and it is now generally accepted that behaviour is the principal agent of thermoregulation (Bartholomew, l 982; Bradshaw, 1986; Cossins & Bowler, 1987). However, the upper limit of potential activity, set by the environment, may be limited by other biotic factors (e.g. competition, predation and resource availability; Huey, 1982). It is generally assumed that lizards are active whenever possible although several studies have indicated that lizards might not always be active when climatic conditions are suitable (Rose, 1981; Huey, 1982; Beuchat, 1989). It follows that an organism's pattern of activity and inactivity should reflect the adaptive advantage of each of these options, and although the obvious benefits of activity include feeding, mating and social activities, inactivity, in a protected and cool retreat, may be advantageous because it conserves energy and reduces predation (Rose, 1981; Huey, 1982). Unfortunately, the thermal biology of reptiles while inactive remains largely unknown. The frequency of activity in a lizard can potentially, influence its life history parametyrs (Beuchat, 1989). Thermoregulation in ectotherms may be regarded as a behavioural device that helps animals gather and digest food, reproduce and avoid predation by directly affecting
220 205 physiological performance (Huey, 1982; Diaz, 1991). Although shuttling behaviour between microclimates is regarded as a primary temperature regulatory mechanism, behavioural manipulation of the thermal flux affecting the body should receive specific attention if one is to understand therrnoregulation in a lizard (Bradshaw & Main, 1968; Waldschmid, 1980, Bartholomew, 1982). There is considerable literature dealing with the physiology and ecology of fossorial endotherms, specially in the respiratory microenvironment (see Boggs et al., 1984; Ultisch & Anderson, 1986 for reviews). In contrast, the burrows of lizards have received scant attention. In general, deep burrow temperatures are determined by the temperature of the surrounding soil rather than surface air temperatures. As in the case of soil temperatures declining thermal gradients result in the burrows with depth, leading to a thermally-stable microenvironment (King, 1980; Lynch, 1980; Auffenberg, 1981; Buffenstein, 1984 ). The physical dimensions of C. giganteus burrows (see Chapter 2) located in loamclayey soils make them potentially valuable retreats in the temperate grasslands. Apart from Marais ( 1984) who noted that lizards may escape from the mid-day heat in their burrows, no information exists on the daily or seasonal activity patterns of C. giganteus. At the same time the extent and mechanisms of thermoregulation in this large lizard have received no attention, in spite of the fact that it is called the "sun gazer" after the typical ANTERIOR BODY-UP posture (Greenberg, 1977) displayed when active on the surface. The aim of this study was to examine the relationship between the activity of C. giganteus and the microclimates of the burrow and surface. Secondly, I set out to investigate how the thermal environment affects thermoregulatory behaviour, specially body postures and orientation.
221 MATERIAL AND METHODS Study Area and Lizards Part of the Middelpunt population was selected to determine the activity patterns of C. giganteus (Fig. 1().1 ). For a more detailed description of the Middelpunt study area, see Chapter 2. An observation tower (8 m in height), constructed of steel scaffolding, was assembled at a position where I could see 30 burrows. A permanent hide was constructed I of shade cloth and canvas on a platform at the top of this tower. Burrows were marked and numbered with nursery plant markers and colour coded stakes (100 mm) planted at a distance of 1 m from the entrance on lines of the four compass directions (N,S,E and W). At the onset of this study most of the lizards were trapped, to be sexed, weighed, measured and individually marked. For fast identification, unique. colour codes were painted on both temporal regions. Since these colour codes were lost during the annual shedding cycle, lizards were recaptured at intervals for remarking Methods The study area was visited monthly and about 660 hours were spent in the hide observing the lizards. I used a Bausch and Lomb telescope and binoculars (8X40) to locate and observe lizards, applying both the "focal-animal" and "instantaneous scan" methods described by Altmann (1974 ). The former procedure is particularly suited for recording the frequencies and duration of various activity states of an animal during a predetermined period, whereas the latter records activity states at a preselected moment in time (Altmann, 1974 ). An observation hour was, therefore, initially divided into four periods, a "focal" period of 20 minutes and a "scanning" period for 20 minutes with two 10 minute rest periods in between. However, it was later found to be more convenient to have a "focal" period of only 15 minutes and two "scannings" within the hour. The remaining time was used for telemetry and rest. For the "focal" observations I selected a different individual lizard from the population each day (data not presented). During each scan every individual active on the surface was noted and the following information recorded: burrow number,
222 Figure 10. l WS MJTN OT Map of the C. giganteus study population at Middelpunt study area to show () n Ci> the burrow locations. WS is the burrow where ajj the microclimatic data was gathered throughout the study period; OT = observation tower with a hide on a high the burrows that were continuously observed for changes in position, posture and orientation; T indicate the location of the lizard which carried the telemeter; MN indicate magnetic north and TN true north.
223 208 lizard code, distance from the entrance, posture, angle between the body, viewed rostrally, and the perpendicular of the soil/grass surface, orientation and time. Five basking postures (Fig. 10.2), ranging from BODY-DOWN to ANTERIOR BODY-UP HIGH (Greenberg, 1977), were used. Orientation of th.e lizard was recorded by placing the ' longitudinal head-tail axis of the lizard in 45 compartments according to compass directions Microdimate Microclimatic data were recorded at an empty burrow (facing west) just out of sight. d Instantaneous readings every 15 min and 15-min averages of 1-min readings were recorded by a data logger (Mike Cotton Systems (MCS) 101, 18 channel logger). The temperature variables logged were ambient temperature ( 10 cm and 100 cm above ground level), black bulb temperature (10 cm), sand surface temperature close to the burrow, subsoil temperatures at 10, 20, and 60 cm respectively, air temperature in the burrow in the enlarged entrance, middle (75 cm from the entrance) and deep (150 cm from the entrance) parts. In addition to the temperature variables, a pyranometer (LiCor; W/m2) measured total solar radiation flux at ground level to provide quantitative information about cloud cover Telemetry Lizard body temperatures were measured by telemetry. Temperature-sensitive radiotelemeters (Model T with a 90mm probe, Mini-mitter, Sunriver, Oregon) were used to determine Tb of lizards. A three channel Lafayette receiver with an extended aerial was used. Telemeters were fitted to the lateral side of the base of the tail and the probe inserted into the cloaca and secured to the side of the cloaca opening using tissue glue. Batteries (2 X LSV) could be exchanged whenever necessary without removing the telemeter. One of the two.lizards fitted with telemeters disappeared during the second visit to the study area and was never found and therefore only one lizard (an adult female, SVL = 195 mm) was used for most of the study period. The transmitter was calibrated before the start of the study and recalibrated after the transmitter was recovered.
224 209 1 ~ BODY-DOWN HEAD-UP i ANTERIOR BODY-UP (low) ANTERIOR BODY-UP (high) ANTERIOR BODY-UP, PERCHING Figure 10.2 Stereotyped postures adopted by C. giganteus when basking on the surface.
225 210 No meaningful drift in the calibration curve occurred over the study period. During the observation days the seven lizards closest to the tower, which included the lizard fitted with the telemeter, were continuously observed for changes in position, posture and orientation. Apart from the body temperature data these data were used to present detailed accounts of shuttling and behavioural information of individual lizards throughout the day Reflectance Measurements Two adult lizards collected at Greenlands as part of the autopsy (reproductive) study (see Chapter 2) were skinned carefully to obtain skin samples of mid-dorsal surfaces and mid-ventral skin of the torso region. These samples were dried at 40 C in a oven whcrcaftcr spectral rcflcctances were measured at the National Physics Research Laboratory of the Council for Scientific and Industrial Research (CSIR) in Pretoria. Spectrophotometric measurements were made in the visible spectrum, nm. The equipment and method of calculating the spectral reflectances of the l.izard skins was similar to that used for beetle cuticles by Lombard (1989) RESULTS Seasonal Variation in the Microclimate The microclimate of the burrow, during two days in summer (November) and two days in winter (June) is presented in Fig Also displayed in this figure is the hourly variation in the windspeed during the corresponding days in November. The purpose of the latter is to illustrate the change in the wind profile from above grass level to 10 cm from the ground surface. Whenever windy conditions prevailed, it was clear that wind speed declined towards the soil surface. Ambient temperatures also showed a vertical gradient: in general it was found that air temperatures close to the surface in the short grass patches were much higher than air temperatures above grass level (lm) (data not presented).
226 211 - T-alr lootn - T-bur t1nlr T-bur tnld 5 - T-bur dt1~p - T-eoll (20 ctn)... T-eoll (40 ctn) 19 NOVEMBER NOVEMBER mmm11lmmnml mlrnm11111ln~mnmlnmnm1lrn111111nlllll1111mlrm lr11nnm1l l11rln1 6:00 9:00 12:00 15:00 18:00 21:00 0:00 3:00 6:00 9:00 12:00 15:00 18:00 35 :... T~EM~P~E~RA~T_U_R_E~(~C~)~~~~~~~~~~~~~~~~~~--, 30 - T-Rlr (loom) to 5 T-bur t1nlranoe T-bur deep Soll (20otn) T-bur mid Soll (40otn)... - ~ :.:-- '-:.:.: ~ ~ -...._.,_,, JUNE JUNE nmmmlmmmnlmmmnlnnmm1lmmmnl l mlrnmmnlmnmmlmmmn m..'""'rrli 8:45 11 :45 14:45 17:45 20:45 23:45 2:45 5:45 8:45 11 :45 14:45 17:45 WINDSPEED (m/s) ~~~-=-...:_.:_~~~~~~~~~~~~~~~~~~--, 19 NOVEMBER NOVEMBER flndopeed (10 om) - ll'lndopeed (1.2tn) 0 fnmmmfmmmnlmnmmhmmnnfnmnnnhmmnnl l l hmmnn 6:00 9:00 12:00 15:00 18:00 21:00 0:00 3:00 6:00 9:00 12:00 15:00 18:00 TIME Figure 10.3 Variation in the microclimatic parameters, including the soil temperatures, during two typical summer days (November 1986) and two winter days (June 1986). The lower graph show the variation in windspeed above grass level ( 1.2m) and 10 cm above the ground surface. Like most C. giganteus burrows this burrow entrance opened onto a patch of short grass surrounded by long grass (0.5-1 m in height).
227 212 Seasonal variation in the microclimate (the same burrow and surface area) can be studied through Figs During warrri summer conditions, deep burrow temperature ('Im from entrance) did not vary much during a 24 hour period, despite considerable variation in surface parameters. From an extreme 40 C in full summer sunshine, temperatures in the deep parts of the burrow decline with as much as 20 C. It is clear from Fig and others that air temperatures in the deep burrow closely parallel the soil temperatures measured at 40 cm, rather than surface ambient temperatures (Fig. 10.3). Air temperatures in the entrance of the burrow follow the variation in ambient temperatures (HJ cm from surface) more closely and may increase substantially if the entrance is exposed to direct sunshine, as was the case in this north-west facing burrow in the afternoon (Fig. l0.4a). Although mid-burrow temperatures did not vary considerable it paralleled, but lagged behind, entrance air temperatures. In summer the burrow, which gradually sloped towards the terminal part (see Chapter 2 for detail), provided a gradient of temperatures along its length. Entrance and mid-burrow temperatures may fall below deep-burrow air temperatures during the night and it is only after sunrise that the air temperatures in the front parts of the burrow rise above those of the deep burrow. (Figs ). During the winter days the deep-burrow air temperatures were lower than during summer (10 C) with a smaller difference between ambient surface temperatures and burrow temperatures (Fig. 10.3). However, soon after sunset, in winter, surface air temperatures declined to below freezing point, whereas deep-burrow tempeq1tures remained stable. Burrow entrance and mid-part temperatures are affected by the cold surface conditions. During the daytime the latter temperatures did not markedly increase above deep-burrow temperatures (Fig. 10.3).
228 Population Activity, Postures and Orientation September 1986:- The surface activity pattern of lizards was characterized by two main activity periods (Fig. 10.4B). During the midday hours, a smaller proportion of the popu]ation was active. A partjy overcast sky in the afternoon of 17th September did not affect the surface activity of lizards adversely and most of the population disappeared in their burrows after sunset. sunshine only after lohoo. The 18th September started as an overcast day with direct Nevertheless, most lizards in the population were active during this time. Whenever, stationary, l.izards adopted one of five stereotyped postures (Fig. 10.2). The BODY-DOWN posture (posture 1) was rarely observed and the HEAD-UP posture was seen mostly in overcast conditions. Characteristic of most of the day (Fig. 10.4C), was the ANTERIOR-UP posture (postures 3 & 4 in Fig. 10.2), adopted by most the lizards in the population. Frequently lizards assumed the ANTERIOR-UP posture with elbows maximally straightened, resulting in a near vertical position relative to the surface. The same vertical posture was assumed when lizards perched against either the side of the burrow entrance, grass tufts or any other object like stones or cow dung (posture 5 in Fig. 10.2). Lizards rarely moved far from burrows, except when feeding, defecating or for reproductive activity. Apart from the typical basking postures of C. giganteus, variation in orientation of individual lizards relative to the compass aspect and height of the sun was evident (Fig 10.4D). Early morning basking was characterized by most lizards in the population facing in a north-west direction while in an ANTERIOR-UP posture with the dorsal parts perpendicular and exposed to full sun. Lizards change orientation by turning through 180 and face south-east into the sun. Because of the altitude of the sun and the angled body, lizards are recognized as parallel to the rays of the sun, receiving minimum radiation. Orientations become much more varied dur.ing the hot midday period although north-south orientations (i.e. perpendicular to the azimuth path of the sun) were more frequently observed (Fig. l0.4d). Late afternoon sessions are marked by the south-east orientations of lizards, again facing away from the sun, exposing their backs to the sun.
![50r-----_: :_ TEMPERATtIRE ( C) --, 4 "r A 1 - T-air (locm) T-bur mid ] / L.. ~ ~ 10' 100 0 I I I I 80 60 40 20 1 2 T-blaclc (locm) 5... T-bur deep...:2._... 3 -- T-bur entrance 17 SEPTEMBER 1986 18 SEPTEMBER 1986 6:00 8:30 12:30 16:30 6:45 10:00 14:00 18:00 PERCENTAGE TIME (hh:mm) EZa POPOLl.](/docs-images/92/109954391/images/229-0.jpg "TION ACTIVITY N = 30. - RADIATION 0. 6:00 8:30 12~30 16~30 TIME (hh:mm) f I, 6:45 10:00 14:00 RADIATION (W /m ) 40 30 20 10 0-10 18:00 1003 753 50~ 253 L.")
229 50r-----_: :_ TEMPERATtIRE ( C) --, 4 "r A 1 - T-air (locm) T-bur mid ] / L.. ~ ~ 10' I I I I T-blaclc (locm) 5... T-bur deep...:2._ T-bur entrance 17 SEPTEMBER SEPTEMBER :00 8:30 12:30 16:30 6:45 10:00 14:00 18:00 PERCENTAGE TIME (hh:mm) EZa POPOLl.TION ACTIVITY N = RADIATION 0. 6:00 8:30 12~30 16~30 TIME (hh:mm) f I, 6:45 10:00 14:00 RADIATION (W /m ) : ~ 253 L. ~~II: Ii I~~ ~~ ~ ~~ ~~~ 6:30 9:00 11:30 14:00 16:30 7:45 10:00 12:30 15:00 17:45 TIME (EH:l.lli) - POST 2 W POST 3 P!/>1 POST 4 c:::j POST 5 PER~'TAGE 03 '! fjf[lf,11\:l:o'r'!'r:-''!''.~t;i'!''!'s''!''14\"'!'~t;''?\"'!' I.r'!''!''!''!'~'!'~''!''!'\'~'!'jlO!j'J'T4~'!'~'!''!'"? 1' 6:30 9:00 11:30 14:00 16:30 7:45 10:00 12:30 15:00 17:45 TIME (HH:l.lli) ms -SE ams EZ2iNE CSJN Dmr Bir [X)ST ~ ~~ ~ ' N1 IH Figure 10.4 Microclimate (A & B), population activity (B), posture (C) (see Fig for index) and orientation (D) of C. giganteus lizards during September t\.)... *"'
230 215. The appearance of midday clouds (typical of summer rainfall areas) did not markedly affect surface activity patterns, although more lizards were active during this time on 19th September when the total radiation was noticeably less than the 11th September December 1986:- Microclimate conditions are summarized in Fig. SA. The bimodal activity pattern was much more pronounced during the hot month of December (Fig. 10.SA). Deep-burrow temperatures increased to about 20 C and it is clear that most lizards in the population escape the hot summer sun by retreat to the cool burrow. The presence of midday clouds reduced the total radiation at noon, and although ambient and blackbody temperatures decreased, there was no noticeable increase in surface activity of the lizards (Fig. l0.5a & B). Again, the ANTERIOR-BODY-UP postures dominated during basking sessions, with lizards perching against the sides of burrows and nearby grass tufts during warm-up periods in the mornings. On emergence most lizards faced in a north-westerly direction, exposing darker dorsal aspects to the rays of the sun. Following an hour of basking in this position, lizards changed their orientation to face the sun (southeasterly direction). On the cooler 9th December afternoon, most lizards faced southeasterly, with only a few facing the declining sun during the late afternoon bask. On the warmer I Ith December, however, re-orientations were evident (Fig. 10.5D), with more lizards facing the declining sun, thereby exposing the lighter ventral parts of the torso region. May 1987:- Autumn days were marked by lower radiation levels and ambient and blackbody temperatures than in the summer months (Fig. 10.6). Burrow temperatures were also reduced and entrance and mid-burrow air temperatures did not exceed 20 C. The time of emergence from burrows in the mornings was not effected by the lower entrance and mid-burrow temperatures (Fig. 10.6A & B). In general, surface activity of lizards was much reduced and the break down of the bimodal activity pattern was evident (Fig ). The ANTERIOR-BODY-UP postures were the most frequently observed postures (Fig. l0.6c). Posture 3, in which the anterior parts of the body was well raised but the elbows not maximally straightened, dominated (Fig. 10.2). As on the warmer summer days, the initial basking orientation was characterized by lizards exposing their backs
 PERCENTAGE RADIATION (W/m) 40, 40 9 DECE N = 29 11 DECEMBER 1986 B 30 L 30 20 10 10 0 I.")
231 PERCENTAGE so.,--~~~~~~~~~~~~~~~~~~~-, I A DECEMBER _ 3... ; N = DECE f3~r.) ~ j ::f 01-rrrl.J.. T-bur deep A_ T-bur entrance _l_ T-air (locm) _5_. T-bur mid :.;,,;.;.. ~ ~.:..:.:.: T-black 6:20 8:45 10:45 12:45 14:45 16:45 18:45 6:45 8:45 10:45 12:45 14:45 16:45 TIME (HH:MY) PERCENTAGE RADIATION (W/m) 40, 40 9 DECE N = DECEMBER 1986 B 30 L I. I I ~~0~~H~H~~~~~~~~~~~H~~ j II I I 11 I I 1 ~~~~~H~~~~~ 11 I ~ I ~~ 17 I I ~~~~~! 11 j I 0 6:20 9:15 11:45 14:15 16:45 7:45 10:15 12:45 15:15 17:45 TIME (HH:MM) 'c', 'i \W.al ii 11~ lj 11 ~11 IHN jl 11 ~ ii ' lt'.-1t::i~! 1.1 I II\ ~ I!!,., '\;1\;1\;1' I I ~ I' 75~ '-: :: :: :: :B.t:1t:it::! I I \ 1 ~~,~~~~ t::i~ IF I 1 'I I' '"""'"V" I~~ ~ I t;l I ' i!!!!1 :' 1~"1~f-1/', ~ 111 : 1,.,,! " 1 IV.1-<"lV' I.,, 111\;1 "1"1 ~ h k 1, i :1 1,,!'-;"1Vi!"iv;LA "1, ' IA ~ ~ Ir! ;t t lj I V'IViV-.Vf ~ j.-1 ~ I I,, I,;, :N.~v.V1v,,):11 I ' ~ ~ 111 ~ ~ ~ I ii,.\; i. n '! 1:..1~~1~ I I I I 1 I '1lli 1 i~~p~ ~~c;1t::i -~~ 1 1 v ~- ~ 1 ~, ~ I h I ' I' I 1 11 ' 1hJNW '' '''I ['.l::j~t::i IA~~ ' ' i! " 257. L! 1: i; i~~nh~ri~' ~~ ~ ~ ~ ~ ~ v ~ ~ ~ ~ l~" j! 11!1!! i! JN~~~ ' t::i, ~ t::i! ~ ~ N ~ V1 h 1! \ 1Y'N~N 1Ai-J v. "1 v j! i!~~n~inr't:1n m,~ ~ ~ R..,.. J.,~ lf..lv.f_l, kl t:11n :'. ~ ~ ~ J l;:\,11.1!1!! ~ 11 LI I 'N~N I i.ann ~ "' I'- ~. ~ ~ ~ ~ 1 Q7. I'.!.,,,,;., "ld~t:jl>iuii; I~~,, ', l;i: ~,,, ' 1N~,I 6:20 9:15 11:45 14:15 16:45 7:45 10:15 12:45 15:15 17:45 TIME (HH:MM) - POST 2 ~ POST 3 E2Za POST 4 LJ POST '" '"1j:J,! ' ""... "",_,.,..... ".. """' ' D 1' 'N i; f t:::t?s r Ii I! I' I u~ I~ Ll ~ ~ I''. 25~' 11: ~~ i!~~~... I, I i~hn~ ~I~ O,o 1 f,,, I i!t ~ ( 1 II ' II II~ l~r'; 6:20 9: 15 11:45 14:15 16:45 7:45 10:15 12:45 15:15 17:45 TIYE (HH:l.W) ~ s - SE [IlIJ! E22J N! [SJ N D N1I' E3 11' lxj SY Figure 10.5 Microclimate (A & B), population activity (B), posture (C) (see Fig for index) and orientation (D) of C. giganteus lizards during December 1986.
University of Canberra. This thesis is available in print format from the University of Canberra Library.
 University of Canberra This thesis is available in print format from the University of Canberra Library. If you are the author of this thesis and wish to have the whole thesis loaded here, please contact
NOTES ON THE ECOLOGY AND NATURAL HISTORY OF TWO SPECIES OF EGERNIA (SCINCIDAE) IN WESTERN AUSTRALIA
 IN WESTERN AUSTRALIA") NOTES ON THE ECOLOGY AND NATURAL HISTORY OF TWO SPECIES OF EGERNIA (SCINCIDAE) IN WESTERN AUSTRALIA By ERIC R. PIANKA Integrative Biology University of Texas at Austin Austin, Texas 78712 USA Email: erp@austin.utexas.edu
NOTES ON THE ECOLOGY AND NATURAL HISTORY OF TWO SPECIES OF EGERNIA (SCINCIDAE) IN WESTERN AUSTRALIA By ERIC R. PIANKA Integrative Biology University of Texas at Austin Austin, Texas 78712 USA Email: erp@austin.utexas.edu
Sheikh Muhammad Abdur Rashid Population ecology and management of Water Monitors, Varanus salvator (Laurenti 1768) at Sungei Buloh Wetland Reserve,
 at Sungei Buloh Wetland Reserve,") Author Title Institute Sheikh Muhammad Abdur Rashid Population ecology and management of Water Monitors, Varanus salvator (Laurenti 1768) at Sungei Buloh Wetland Reserve, Singapore Thesis (Ph.D.) National
Author Title Institute Sheikh Muhammad Abdur Rashid Population ecology and management of Water Monitors, Varanus salvator (Laurenti 1768) at Sungei Buloh Wetland Reserve, Singapore Thesis (Ph.D.) National
NOTES ON THE ECOLOGY AND NATURAL HISTORY OF CTENOPHORUS CAUDICINCTUS (AGAMIDAE) IN WESTERN AUSTRALIA
 IN WESTERN AUSTRALIA") NOTES ON THE ECOLOGY AND NATURAL HISTORY OF CTENOPHORUS CAUDICINCTUS (AGAMIDAE) IN WESTERN AUSTRALIA By ERIC R. PIANKA Integrative Biology University of Texas at Austin Austin, Texas 78712 USA Email: erp@austin.utexas.edu
NOTES ON THE ECOLOGY AND NATURAL HISTORY OF CTENOPHORUS CAUDICINCTUS (AGAMIDAE) IN WESTERN AUSTRALIA By ERIC R. PIANKA Integrative Biology University of Texas at Austin Austin, Texas 78712 USA Email: erp@austin.utexas.edu
Blind and Thread Snakes
 Advanced Snakes & Reptiles 1 Module # 4 Component # 2 Family Typhlopidae They spend their lives underground in termite mounds in search of termites or similar insects. They are occasionally unearthed in
10/03/18 periods 5,7 10/02/18 period 4 Objective: Reptiles and Fish Reptile scales different from fish scales. Explain how.
 10/03/18 periods 5,7 10/02/18 period 4 Objective: Reptiles and Fish Reptile scales different from fish scales. Explain how. Objective: Reptiles and Fish Reptile scales different from fish scales. Explain
Andros Iguana Education Kit Checklist
 Andros Iguana Education Kit Checklist Activity A: Where Have All the Iguanas Gone? Activity Sheets Envelope Activity Instructions Sheet Iguana Habitat Master Copy Threat Coverage 30%/70% Master Copy Threat
Writing: Lesson 23. Today the students will practice planning for informative/explanatory prompts in response to text they read.
 Top Score Writing Grade 4 Lesson 23 Writing: Lesson 23 Today the students will practice planning for informative/explanatory prompts in response to text they read. The following passages will be used in
Dominance/Suppression Competitive Relationships in Loblolly Pine (Pinus taeda L.) Plantations
 Plantations") Dominance/Suppression Competitive Relationships in Loblolly Pine (Pinus taeda L.) Plantations by Michael E. Dyer Dissertation submitted to the Faculty of the Virginia Polytechnic Institute and Stand University
Dominance/Suppression Competitive Relationships in Loblolly Pine (Pinus taeda L.) Plantations by Michael E. Dyer Dissertation submitted to the Faculty of the Virginia Polytechnic Institute and Stand University
Title of Project: Distribution of the Collared Lizard, Crotophytus collaris, in the Arkansas River Valley and Ouachita Mountains
 Title of Project: Distribution of the Collared Lizard, Crotophytus collaris, in the Arkansas River Valley and Ouachita Mountains Project Summary: This project will seek to monitor the status of Collared
5/10/2013 CONSERVATION OF CRITICALLY ENDANGERED RUFFORD SMALL GRANT. Dr. Ashot Aslanyan. Project leader SPECIES OF REPTILES OF ARARAT VALLEY, ARMENIA
 5/10/2013 RUFFORD SMALL GRANT Project leader CONSERVATION OF CRITICALLY ENDANGERED Dr. Ashot Aslanyan SPECIES OF REPTILES OF ARARAT VALLEY, ARMENIA Yerevan, 2013 Application ID: 11394-1 Organization: Department
WildlifeCampus Advanced Snakes & Reptiles 1. Vipers and Adders
 Advanced Snakes & Reptiles 1 Module # 4 Component # 9 Viperidae - Hinged Front Fang Snakes This Family is divided into two sub-families. These are Old World and Modern / New World Adders. The predominant
Module 2.4: Small Mammals Interpreting with Chinchillas
 Module 2.4: Small Mammals Interpreting with Chinchillas Interpreting with Chinchillas: The theme of your conversations may differ from group to group depending on the program, and the age of your audience.
Reptile Identification Guide
 Care & preservation of Surrey s native amphibians and reptiles Reptile Identification Guide This identification guide is intended to act as an aid for SARG surveyors. Adder, Vipera berus A short, stocky
EFFECTS OF SEASON AND RESTRICTED FEEDING DURING REARING AND LAYING ON PRODUCTIVE AND REPRODUCTIVE PERFORMANCE OF KOEKOEK CHICKENS IN LESOTHO
 EFFECTS OF SEASON AND RESTRICTED FEEDING DURING REARING AND LAYING ON PRODUCTIVE AND REPRODUCTIVE PERFORMANCE OF KOEKOEK CHICKENS IN LESOTHO By SETSUMI MOTŠOENE MOLAPO MSc (Animal Science) NUL Thesis submitted
Habitats and Field Methods. Friday May 12th 2017
 Habitats and Field Methods Friday May 12th 2017 Announcements Project consultations available today after class Project Proposal due today at 5pm Follow guidelines posted for lecture 4 Field notebooks
A REPTILE SURVEY AT THE LAND AT HILL ROAD AND ELM TREE DRIVE, ROCHESTER, KENT,
 A REPTILE SURVEY AT THE LAND AT HILL ROAD AND ELM TREE DRIVE, ROCHESTER, KENT, Commissioned by: King & Johnston Homes Ltd and Medway Council Report Number: October 2013 Regent s Place, 3 rd Floor, 338
Reptile Method Statement
 , Northamptonshire A Report on behalf of March 2013 M1 CONTENTS 1.0 Introduction 1.1 Purpose of this Method Statement 1.2 Site Background 1.3 Reptile Ecology & Legal Protection 2.0 Methodology 2.1 Tool
Fact Sheet: Oustalet s Chameleon Furcifer oustaleti
 Fact Sheet: Oustalet s Chameleon Furcifer oustaleti Description: Size: o Males: 2.5 ft (68.5 cm) long o Females:1 ft 3 in (40 cm) long Weight:: 14-17 oz (400-500g) Hatchlings: 0.8 grams Sexual Dimorphism:
The Long-term Effect of Precipitation on the Breeding Success of Golden Eagles Aquila chrysaetos homeyeri in the Judean and Negev Deserts, Israel
 Meyburg. B-U. & R. D. Chancellor eds. 1996 Eagle Studies World Working Group on Birds of Prey (WWGBP) Berlin, London & Paris The Long-term Effect of Precipitation on the Breeding Success of Golden Eagles
ABSTRACT. Ashmore Reef
 ABSTRACT The life cycle of sea turtles is complex and is not yet fully understood. For most species, it involves at least three habitats: the pelagic, the demersal foraging and the nesting habitats. This
Rubber Boas in Radium Hot Springs: Habitat, Inventory, and Management Strategies
 : Habitat, Inventory, and Management Strategies ROBERT C. ST. CLAIR 1 AND ALAN DIBB 2 1 9809 92 Avenue, Edmonton, AB, T6E 2V4, Canada, email rstclair@telusplanet.net 2 Parks Canada, Box 220, Radium Hot
Endangered Plants and Animals of Oregon
 ))615 ry Es-5- Endangered Plants and Animals of Oregon H. Amphibians and Reptiles Special Report 206 January 1966 1,9 MAY 1967 4-- 1=3 LPeRARY OREGON ctate CP tffirversity Agricultural Experiment Station
Plestiodon (=Eumeces) fasciatus Family Scincidae
 fasciatus Family Scincidae") Plestiodon (=Eumeces) fasciatus Family Scincidae Living specimens: - Five distinct longitudinal light lines on dorsum - Juveniles have bright blue tail - Head of male reddish during breeding season - Old
Plestiodon (=Eumeces) fasciatus Family Scincidae Living specimens: - Five distinct longitudinal light lines on dorsum - Juveniles have bright blue tail - Head of male reddish during breeding season - Old
Multiple broods from a hole in the wall: breeding Red-and-yellow Barbets Trachyphonus erythrocephalus in southeast Sudan
 Scopus 29: 11 15, December 2009 Multiple broods from a hole in the wall: breeding Red-and-yellow Barbets Trachyphonus erythrocephalus in southeast Sudan Marc de Bont Summary Nesting and breeding behaviour
Raptor Ecology in the Thunder Basin of Northeast Wyoming
 Raptor Ecology in the Thunder Basin Northeast Wyoming 121 Kort Clayton Thunderbird Wildlife Consulting, Inc. My presentation today will hopefully provide a fairly general overview the taxonomy and natural
The tailed frog has been found from sea level to near timberline ( m; Province of BC 1999).
.") TAILED FROG Name: Code: Status: Ascaphus truei A-ASTR Red-listed. DISTRIBUTION Provincial Range Tailed frogsoccur along the west coast of North America from north-western California to southern British
TAILED FROG Name: Code: Status: Ascaphus truei A-ASTR Red-listed. DISTRIBUTION Provincial Range Tailed frogsoccur along the west coast of North America from north-western California to southern British
Introduction to the Cheetah
 Lesson Plan 1 Introduction to the Cheetah CRITICAL OUTCOMES CO #1: Identify and solve problems and make decisions using critical and creative thinking. CO #2: Work effectively with others as members of
Breeding Activity Peak Period Range Duration (days) Laying May May 2 to 26. Incubation Early May to mid June Early May to mid June 30 to 34
 Laying May May 2 to 26. Incubation Early May to mid June Early May to mid June 30 to 34") Snowy Owl Bubo scandiacus 1. INTRODUCTION s have a circumpolar distribution, breeding in Fennoscandia, Arctic Russia, Alaska, northern Canada and northeast Greenland. They are highly nomadic and may migrate
Snowy Owl Bubo scandiacus 1. INTRODUCTION s have a circumpolar distribution, breeding in Fennoscandia, Arctic Russia, Alaska, northern Canada and northeast Greenland. They are highly nomadic and may migrate
A description of an Indo-Chinese rat snake (Ptyas korros [Schlegel, 1837]) clutch, with notes on an instance of twinning
![A description of an Indo-Chinese rat snake (Ptyas korros [Schlegel, 1837]) clutch, with notes on an instance of twinning](/thumbs/86/93949508.jpg "A description of an Indo-Chinese rat snake (Ptyas korros [Schlegel, 1837]) clutch, with notes on an instance of twinning") 1 2 A description of an Indo-Chinese rat snake (Ptyas korros [Schlegel, 1837]) clutch, with notes on an instance of twinning 3 4 Simon Dieckmann 1, Gerrut Norval 2 * and Jean-Jay Mao 3 5 6 7 8 9 10 11
1 2 A description of an Indo-Chinese rat snake (Ptyas korros [Schlegel, 1837]) clutch, with notes on an instance of twinning 3 4 Simon Dieckmann 1, Gerrut Norval 2 * and Jean-Jay Mao 3 5 6 7 8 9 10 11
Geoffroy s Cat: Biodiversity Research Project
 Geoffroy s Cat: Biodiversity Research Project Viet Nguyen Conservation Biology BES 485 Geoffroy s Cat Geoffroy s Cat (Leopardus geoffroyi) are small, little known spotted wild cat found native to the central
JoJoKeKe s Herpetology Exam
 ~*~*~*~*~*~*~*~*~*~*~*~*~*~*~*~*~*~*~*~*~*~*~~*~*~*~*~*~*~*~*~*~*~*~*~*~*~ JoJoKeKe s Herpetology Exam (SSSS) 2:30 to be given at each station- B/C Station 1: 1.) What is the family & genus of the shown
Objectives: Outline: Idaho Amphibians and Reptiles. Characteristics of Amphibians. Types and Numbers of Amphibians
 Natural History of Idaho Amphibians and Reptiles Wildlife Ecology, University of Idaho Fall 2005 Charles R. Peterson Herpetology Laboratory Department of Biological Sciences, Idaho Museum of Natural History
Distribution, population dynamics, and habitat analyses of Collared Lizards
 Distribution, population dynamics, and habitat analyses of Collared Lizards The proposed project focuses on the distribution and population structure of the eastern collared lizards (Crotaphytus collaris
Amphibians and Reptiles Division B
 Amphibians and Reptiles Division B Amphibians and Reptiles KEY (corrected) Station I siren 1. Write the scientific name of this specimen (siren lacertian) 2. To which order do these belong?
Prof. Neil. J.L. Heideman
 Prof. Neil. J.L. Heideman Position Office Mailing address E-mail : Vice-dean (Professor of Zoology) : No. 10, Biology Building : P.O. Box 339 (Internal Box 44), Bloemfontein 9300, South Africa : heidemannj.sci@mail.uovs.ac.za
EVALUATION OF DIFFERENT CHICKEN LAYER BREEDS FOR USE IN INTEGRATED AQUACULTURE-POULTRY PRODUCTION SYSTEMS IN GAUTENG, SOUTH AFRICA
 EVALUATION OF DIFFERENT CHICKEN LAYER BREEDS FOR USE IN INTEGRATED AQUACULTURE-POULTRY PRODUCTION SYSTEMS IN GAUTENG, SOUTH AFRICA By IKGADIMENG BETTY MOTIANG Submitted in partial fulfilment of the requirements
Copyright is owned by the Author of the thesis. Permission is given for a copy to be downloaded by an individual for the purpose of research and
 Copyright is owned by the Author of the thesis. Permission is given for a copy to be downloaded by an individual for the purpose of research and private study only. The thesis may not be reproduced elsewhere
Bobcat Interpretive Guide
 Interpretive Guide Exhibit Talking Point: Our job as interpreters is to link what the visitors are seeing to The Zoo's conservation education messages. Our goal is to spark curiosity, create emotional
May Dear Blunt-nosed Leopard Lizard Surveyor,
 May 2004 Dear Blunt-nosed Leopard Lizard Surveyor, Attached is the revised survey methodology for the blunt-nosed leopard lizard (Gambelia sila). The protocol was developed by the San Joaquin Valley Southern
Physical Description Meadow voles are small rodents with legs and tails, bodies, and ears.
 A Guide to Meadow Voles Identification, Biology and Control Methods Identification There are 5 species of Meadow Vole common to California. They are the California Vole, Long-tailed Vole, Creeping Vole,
Typical Snakes Part # 1
 Advanced Snakes & Reptiles 1 Module # 4 Component # 5 Family Colubridae This is the most represented family in the course area and has the more commonly encountered species. All of these snakes only have
Legal Supplement Part B Vol. 53, No th March, NOTICE THE ENVIRONMENTALLY SENSITIVE SPECIES (GREEN TURTLE) NOTICE, 2014
 NOTICE, 2014") Legal Supplement Part B Vol. 53, No. 37 28th March, 2014 211 LEGAL NOTICE NO. 90 REPUBLIC OF TRINIDAD AND TOBAGO THE ENVIRONMENTAL MANAGEMENT ACT, CHAP. 35:05 NOTICE MADE BY THE ENVIRONMENTAL MANAGEMENT
Legal Supplement Part B Vol. 53, No. 37 28th March, 2014 211 LEGAL NOTICE NO. 90 REPUBLIC OF TRINIDAD AND TOBAGO THE ENVIRONMENTAL MANAGEMENT ACT, CHAP. 35:05 NOTICE MADE BY THE ENVIRONMENTAL MANAGEMENT
Station 1 1. (3 points) Identification: Station 2 6. (3 points) Identification:
 Identification: Station 2 6. (3 points) Identification:") SOnerd s 2018-2019 Herpetology SSSS Test 1 SOnerd s SSSS 2018-2019 Herpetology Test Station 20 sounds found here: https://drive.google.com/drive/folders/1oqrmspti13qv_ytllk_yy_vrie42isqe?usp=sharing Station
SOnerd s 2018-2019 Herpetology SSSS Test 1 SOnerd s SSSS 2018-2019 Herpetology Test Station 20 sounds found here: https://drive.google.com/drive/folders/1oqrmspti13qv_ytllk_yy_vrie42isqe?usp=sharing Station
VIRIDOR WASTE MANAGEMENT LIMITED. Parkwood Springs Landfill, Sheffield. Reptile Survey Report
 VIRIDOR WASTE MANAGEMENT LIMITED Parkwood Springs Landfill, Sheffield July 2014 Viridor Waste Management Ltd July 2014 CONTENTS 1 INTRODUCTION... 1 2 METHODOLOGY... 3 3 RESULTS... 6 4 RECOMMENDATIONS
Managing Uplands with Keystone Species. The Case of the Gopher tortoise (Gopherus polyphemus)
") Managing Uplands with Keystone Species The Case of the Gopher tortoise (Gopherus polyphemus) Biology Question: Why consider the gopher tortoise for conservation to begin with? Answer: The gopher tortoise
Managing Uplands with Keystone Species The Case of the Gopher tortoise (Gopherus polyphemus) Biology Question: Why consider the gopher tortoise for conservation to begin with? Answer: The gopher tortoise
Intraspecific relationships extra questions and answers (Extension material for Level 3 Biology Study Guide, ISBN , page 153)
") i Intraspecific relationships extra questions and answers (Extension material for Level 3 Biology Study Guide, ISBN 978-1-927194-58-4, page 153) Activity 9: Intraspecific relationships extra questions
i Intraspecific relationships extra questions and answers (Extension material for Level 3 Biology Study Guide, ISBN 978-1-927194-58-4, page 153) Activity 9: Intraspecific relationships extra questions
Animal Biodiversity. Teacher Resources - High School (Cycle 1) Biology Redpath Museum
 Biology Redpath Museum") Animal Biodiversity Teacher Resources - High School (Cycle 1) Biology Redpath Museum Ecology What defines a habitat? 1. Geographic Location The location of a habitat is determined by its latitude and its
Animal Biodiversity Teacher Resources - High School (Cycle 1) Biology Redpath Museum Ecology What defines a habitat? 1. Geographic Location The location of a habitat is determined by its latitude and its
EBA Series FOOTHILL ABORTION UPDATE: PART I: THE TICK
 EBA Series FOOTHILL ABORTION UPDATE: PART I: THE TICK Foothill abortion in cattle, also known as Epizootic Bovine Abortion (EBA), is a condition well known to beef producers who have experienced losses
A Comparison of morphological differences between Gymnophthalmus spp. in Dominica, West Indies
 209 A Comparison of morphological differences between Gymnophthalmus spp. in Dominica, West Indies Marie Perez June 2015 Texas A&M University Dr. Thomas Lacher and Dr. Jim Woolley Department of Wildlife
Writing: Lesson 31. Today the students will be learning how to write more advanced middle paragraphs using a variety of elaborative techniques.
 Top Score Writing Grade 4 Lesson 31 Writing: Lesson 31 Today the students will be learning how to write more advanced middle paragraphs using a variety of elaborative techniques. The following passages
Density, growth, and home range of the lizard Uta stansburiana stejnegeri in southern Dona Ana County, New Mexico
 Great Basin Naturalist Volume 33 Number 2 Article 8 6-30-1973 Density, growth, and home range of the lizard Uta stansburiana stejnegeri in southern Dona Ana County, New Mexico Richard D. Worthington University
Gambel s Quail Callipepla gambelii
 Photo by Amy Leist Habitat Use Profile Habitats Used in Nevada Mesquite-Acacia Mojave Lowland Riparian Springs Agriculture Key Habitat Parameters Plant Composition Mesquite, acacia, salt cedar, willow,
*Using the 2018 List. Use the image below to answer question 6.
 Herpetology Test 1. Hearts in all herps other than consists of atria and one ventricle somewhat divided by a septum. (2 pts) a. snakes; two b. crocodiles; two c. turtles; three d. frogs; four 2. The food
Transfer of the Family Platysternidae from Appendix II to Appendix I. Proponent: United States of America and Viet Nam. Ref. CoP16 Prop.
 Transfer of the Family Platysternidae from Appendix II to Appendix I Proponent: United States of America and Viet Nam Summary: The Big-headed Turtle Platysternon megacephalum is the only species in the
NATIONAL HERTETOLOGY List posted o n under Event Based upon information at
 NATIONAL HERTETOLOGY List posted on www.soinc.org under Event Organized by groups of organisms o CLASS REPTILIA AND AMPHIBIA o ORDER AND SUBORDERS o FAMILY o GENUS AND COMMON NAME Based upon information
Mr T.B Brown. Land off Turweston Road, Northamptonshire REPTILE SURVEY REPORT
 Mr T.B Brown Land off Turweston Road, Northamptonshire REPTILE SURVEY REPORT June 2013 FPCR Environment and Design Ltd Registered Office: Lockington Hall, Lockington, Derby DE74 2RH Company No. 07128076.
WildlifeCampus Advanced Snakes & Reptiles 1. Burrowing Snakes
 Advanced Snakes & Reptiles 1 Module # 4 Component # 4 Family Atractasididae As the name suggests these snakes are largely subterranean. Their heads are not very distinctive from the rest of the body and
PEREGRINE FALCON HABITAT MANAGEMENT GUIDELINES ONTARIO MINISTRY OF NATURAL RESOURCES
 PEREGRINE FALCON HABITAT MANAGEMENT GUIDELINES ONTARIO MINISTRY OF NATURAL RESOURCES December 1987 2 Table of Contents Page Introduction...3 Guidelines...4 References...7 Peregrine Falcon Nest Site Management
Reproductive cycle of the common rough-scaled lizard, Ichnotropis squamulosa (Squamata: Lacertidae) from southern Africa.
 from southern Africa.") Reproductive cycle of the common rough-scaled lizard, Ichnotropis squamulosa (Squamata: Lacertidae) from southern Africa. Print Author: Goldberg, Stephen R. Article Type: Report Geographic Code: 6SOUT
Reproductive cycle of the common rough-scaled lizard, Ichnotropis squamulosa (Squamata: Lacertidae) from southern Africa. Print Author: Goldberg, Stephen R. Article Type: Report Geographic Code: 6SOUT
Biodiversity and Extinction. Lecture 9
 Biodiversity and Extinction Lecture 9 This lecture will help you understand: The scope of Earth s biodiversity Levels and patterns of biodiversity Mass extinction vs background extinction Attributes of
Field Herpetology Final Guide
 Field Herpetology Final Guide Questions with more complexity will be worth more points Incorrect spelling is OK as long as the name is recognizable ( by the instructor s discretion ) Common names will
Big Cat Rescue Presents. Tigrina or Oncilla
 Big Cat Rescue Presents Tigrina or Oncilla 1 Tigrina or Oncilla Big Cat Rescue 12802 Easy Street Tampa, Florida 33625 www.bigcatrescue.org Common Name: Oncilla Kingdom: Animalia Phylum: Chordata (Vertebrata)
SPECIES AT RISK IN ALBERTA. Children s Activity Booklet
 SPECIES AT RISK IN ALBERTA Children s Activity Booklet Table of Contents You Where you live A duck and where it lives Animals and Plants Species at Risk, Habitat & Threats Grizzly Bear Swift Fox Wood
Striped Skunk Updated: April 8, 2018
 Striped Skunk Updated: April 8, 2018 Interpretation Guide Status Danger Threats Population Distribution Habitat Diet Size Longevity Social Family Units Reproduction Our Animals Scientific Name Least Concern
Reptile conservation in Mauritius
 Reptile conservation in Mauritius Pristine Mauritius Nik Cole 671 species of plant 46% endemic to Mauritius The forests supported 22 types of land bird, 12 endemic to Mauritius, such as the dodo The Mauritius
Northern Copperhead Updated: April 8, 2018
 Interpretation Guide Northern Copperhead Updated: April 8, 2018 Status Danger Threats Population Distribution Habitat Diet Size Longevity Social Family Units Reproduction Our Animals Scientific Name Least
Maternal Effects in the Green Turtle (Chelonia mydas)
") Maternal Effects in the Green Turtle (Chelonia mydas) SUBMITTED BY SAM B. WEBER TO THE UNIVERSITY OF EXETER AS A THESIS FOR THE DEGREE OF DOCTOR OF PHILOSOPHY IN BIOLOGY; 8 TH JUNE 2010 This thesis is
Maternal Effects in the Green Turtle (Chelonia mydas) SUBMITTED BY SAM B. WEBER TO THE UNIVERSITY OF EXETER AS A THESIS FOR THE DEGREE OF DOCTOR OF PHILOSOPHY IN BIOLOGY; 8 TH JUNE 2010 This thesis is
A Population Analysis of the Common Wall Lizard Podarcis muralis in Southwestern France
 - 513 - Studies in Herpetology, Rocek Z. (ed.) pp. 513-518 Prague 1986 A Population Analysis of the Common Wall Lizard Podarcis muralis in Southwestern France R. BARBAULT and Y. P. MOU Laboratoire d'ecologie
This is the book of David, the son of Abraham and the father of Jesus Christ Matthew 1.1. Declaration
 ! ii This is the book of David, the son of Abraham and the father of Jesus Christ Matthew 1.1 Declaration This thesis is my original work and no part has been previously submitted for a degree. Chapters
A.13 BLAINVILLE S HORNED LIZARD (PHRYNOSOMA BLAINVILLII)
") A. BLAINVILLE S HORNED LIZARD (PHRYNOSOMA BLAINVILLII) A.. Legal and Other Status Blainville s horned lizard is designated as a Department of Fish and Game (DFG) Species of Concern. A.. Species Distribution
A. BLAINVILLE S HORNED LIZARD (PHRYNOSOMA BLAINVILLII) A.. Legal and Other Status Blainville s horned lizard is designated as a Department of Fish and Game (DFG) Species of Concern. A.. Species Distribution
The puff adder is a large, sluggish, thick-bodied snake that rarely exceeds a meter in length.
 Snakes Great care must be taken with snakes due to the inherent dangers involved with handling snakes. A professional must always be called in to assist and it would be wise to call on your local snake
A FAMILY OF SPOTTED Q. I. SIMPSON AND W. E. CASTLE1
 A FAMILY OF SPOTTED NEGROES Q. I. SIMPSON AND W. E. CASTLE1 IT is the purpose of this note to put on record an interesting variation in human skin color which made its appearance as a mutation or sport
REPORT OF ACTIVITIES TURTLE ECOLOGY RESEARCH REPORT Crescent Lake National Wildlife Refuge 31 May to 4 July 2017
 REPORT OF ACTIVITIES 2017 TURTLE ECOLOGY RESEARCH REPORT Crescent Lake National Wildlife Refuge 31 May to 4 July 2017 A report submitted to Refuge Biologist Marlin French 15 July 2017 John B Iverson Dept.
Snapping Turtle Monitoring Program Guide
 Snapping Turtle Monitoring Program Guide Table of Contents 1.0 The Snapping Turtle... 3 1.1 Description... 3 1.2 Distribution and Habitat... 3 1.3 Status and Threats... 3 1.4 Reproduction and Nesting...
Fleas, lice and mites on scrub ~ares (Lepus saxatilis) in Northern and Eastern Transvaal and in KwaZulu-Natal, South Africa
 in Northern and Eastern Transvaal and in KwaZulu-Natal, South Africa") Onderstepoort Journal of Veterinary Research, 62:133-137 (1995) Fleas, lice and mites on scrub ares (Lepus saxatilis) in Northern and Eastern Transvaal and in KwaZulu-Natal, South Africa J.P. LOUW 1, I.
Onderstepoort Journal of Veterinary Research, 62:133-137 (1995) Fleas, lice and mites on scrub ares (Lepus saxatilis) in Northern and Eastern Transvaal and in KwaZulu-Natal, South Africa J.P. LOUW 1, I.
Reptile Method Statement Land at the De Winton Hotel Llanbradach Caerphilly Dated September 2015
 Reptile Method Statement Land at the De Winton Hotel Llanbradach Caerphilly Dated September 2015 ON THE INSTRUCTION OF Jon Matthews Of Greenwich Communities Ltd Reported by Richard Watkins 10 Mount Pleasant,
The Echidna The Eastern Long Beaked Echidna Nick Corlew, Harrison Simons, and Charlie Lichauer
 The Echidna The Eastern Long Beaked Echidna Nick Corlew, Harrison Simons, and Charlie Lichauer Zaglossus bruijini / Z. Bruijini The Eastern Long-Beaked Echidna Thesis: Nothing that is innocent deserves
AS91603 Demonstrate understanding of the responses of plants & animals to their external environment
 AS91603 Demonstrate understanding of the responses of plants & animals to their external environment Animal behaviour (2015, 1) Some animals display innate behaviours. As green bottle fly maggots (Phaenicia
08 alberts part2 7/23/03 9:10 AM Page 95 PART TWO. Behavior and Ecology
 08 alberts part2 7/23/03 9:10 AM Page 95 PART TWO Behavior and Ecology 08 alberts part2 7/23/03 9:10 AM Page 96 08 alberts part2 7/23/03 9:10 AM Page 97 Introduction Emília P. Martins Iguanas have long
reproductive life History and the effects of sex and season on morphology in CRoTALus oreganus (northern PaCifiC RATTLESNAKES)
") reproductive life History and the effects of sex and season on morphology in CRoTALus oreganus (northern PaCifiC RATTLESNAKES) Benjamin Kwittken, Student Author dr. emily n. taylor, research advisor abstract
reproductive life History and the effects of sex and season on morphology in CRoTALus oreganus (northern PaCifiC RATTLESNAKES) Benjamin Kwittken, Student Author dr. emily n. taylor, research advisor abstract
Size Variations m Tasmanian Rabbits
 PAPERS AND PROCEEDINGS OF THE ROYAL SOCIETY OF TASMANIA, VOLUME 89 Size Variations m Tasmanian Rabbits By M. R LIEDERMAN, LAUNCESTON, TASMANIA (WITH 2 TEx'r FIGURES) ABSTRACT In Tasmania, the great differences
BEHAVIOUR OF THE DOMESTIC DOG (Canis familiaris)
") THE INFLUENCE OF CEREBRAL LATERALISATION ON THE BEHAVIOUR OF THE DOMESTIC DOG (Canis familiaris) A thesis submitted for the Degree of DOCTOR OF PHILOSOPHY by Luke Aaron Schneider B. A. (Hons) School of
THE INFLUENCE OF CEREBRAL LATERALISATION ON THE BEHAVIOUR OF THE DOMESTIC DOG (Canis familiaris) A thesis submitted for the Degree of DOCTOR OF PHILOSOPHY by Luke Aaron Schneider B. A. (Hons) School of
Reproductive physiology and eggs
 Reproductive physiology and eggs Class Business Reading for this lecture Required. Gill: Chapter 14 1. Reproductive physiology In lecture I will only have time to go over reproductive physiology briefly,
Tachyglossus aculeatus. by Nora Preston
 SHORT-BEAKED ECHIDNA Tachyglossus aculeatus by Nora Preston The Echidna is a Monotreme, an egg laying mammal. The baby echidna is known as a puggle. Other monotremes are the Platypus and the Long-Beaked
ACTIVITY #6: TODAY S PICNIC SPECIALS ARE
 TOPIC What types of food does the turtle eat? ACTIVITY #6: TODAY S PICNIC SPECIALS ARE BACKGROUND INFORMATION For further information, refer to Turtles of Ontario Fact Sheets (pages 10-26) and Unit Five:
Vol. XIV, No. 1, March, The Larva and Pupa of Brontispa namorikia Maulik (Coleoptera: Chrysomelidae: Hispinae) By S.
 By S.") Vol. XIV, No. 1, March, 1950 167 The Larva and Pupa of Brontispa namorikia Maulik (Coleoptera: Chrysomelidae: Hispinae) By S. MAULIK BRITISH MUSEUM (NATURAL HISTORY) (Presented by Mr. Van Zwaluwenburg
Vol. XIV, No. 1, March, 1950 167 The Larva and Pupa of Brontispa namorikia Maulik (Coleoptera: Chrysomelidae: Hispinae) By S. MAULIK BRITISH MUSEUM (NATURAL HISTORY) (Presented by Mr. Van Zwaluwenburg
Who Am I? What are some things you can do to help protect my home? Track: Ohio Department of Natural Resources Photo: Cottonwood Canyons Foundation
 Who Am I? What are some things you can do to help protect my home? Track: Ohio Department of Natural Resources Photo: Cottonwood Canyons Foundation I am a Red Squirrel! I live here in Alta. I build my
Between 1850 and 1900, human population increased, and 99% of the forest on Puerto Rico was cleared.
 Case studies, continued. 9) Puerto Rican Parrot Low point was 13 parrots in 1975. Do not breed until 4 years old. May be assisted by helpers at the nest, but this is not clear. Breeding coincides with
INHERITANCE OF BODY WEIGHT IN DOMESTIC FOWL. Single Comb White Leghorn breeds of fowl and in their hybrids.
 440 GENETICS: N. F. WATERS PROC. N. A. S. and genetical behavior of this form is not incompatible with the segmental interchange theory of circle formation in Oenothera. Summary.-It is impossible for the
Weaver Dunes, Minnesota
 Hatchling Orientation During Dispersal from Nests Experimental analyses of an early life stage comparing orientation and dispersal patterns of hatchlings that emerge from nests close to and far from wetlands
Iguana Technical Assistance Workshop. Presented by: Florida Fish and Wildlife Conservation Commission
 Iguana Technical Assistance Workshop Presented by: Florida Fish and Wildlife Conservation Commission 1 Florida Fish and Wildlife Conservation Commission Protects and manages 575 species of wildlife 700
Mexican Gray Wolf Endangered Population Modeling in the Blue Range Wolf Recovery Area
 Mexican Gray Wolf Endangered Population Modeling in the Blue Range Wolf Recovery Area New Mexico Super Computing Challenge Final Report April 3, 2012 Team 61 Little Earth School Team Members: Busayo Bird
TEMPORAL AND SPATIAL DISTRIBUTION OF THE BLACK-LEGGED TICK, IXODES SCAPULARIS, IN TEXAS AND ITS ASSOCIATION WITH CLIMATE VARIATION
 TEMPORAL AND SPATIAL DISTRIBUTION OF THE BLACK-LEGGED TICK, IXODES SCAPULARIS, IN TEXAS AND ITS ASSOCIATION WITH CLIMATE VARIATION An Undergraduate Research Scholars Thesis By JOSHUA SANTELISES Submitted
REPTILE TRANSLOCATION REPORT. Hoggett s End, Bishop s Stortford, Hertfordshire
 REPTILE TRANSLOCATION REPORT Hoggett s End, Bishop s Stortford, Hertfordshire OCTOBER 2012 Surveyors: Peter Oakenfull AIEEM Date of Surveys: 30 th August 28 th September 2012 Report compiled by Graham
Dipsas trinitatis (Trinidad Snail-eating Snake)
") Dipsas trinitatis (Trinidad Snail-eating Snake) Family: Dipsadidae (Rear-fanged Snakes) Order: Squamata (Lizards and Snakes) Class: Reptilia (Reptiles) Fig. 1. Trinidad snail-eating snake, Dipsas trinitatis.
Dipsas trinitatis (Trinidad Snail-eating Snake) Family: Dipsadidae (Rear-fanged Snakes) Order: Squamata (Lizards and Snakes) Class: Reptilia (Reptiles) Fig. 1. Trinidad snail-eating snake, Dipsas trinitatis.
4 Many species of mammals, birds, reptiles, amphibians and fish 940L. Source 1 Habitats
 Source 1 Habitats 1 American Alligators can be found in fresh water environments like rivers, lakes, ponds, swamps and marshes. They also like to live in areas that are brackish, which means the water
SOME PHOTOGRAPHIC STUDIES OF THE PINK-FOOTED GOOSE
 SOME PHOTOGRAPHIC STUDIES OF THE PINK-FOOTED GOOSE Photographed by ARNOLD BENINGTON, NIALL RANKIN and G. K. YEATES (Plates 9-16) THE Pink-footed Goose (Anser brachyrhynchus) breeds in east Greenland {between
B-Division Herpetology Test. By: Brooke Diamond
 B-Division Herpetology Test By: Brooke Diamond Rules: - Play each slide for 2 minutes and answer the questions on the test sheet. - Use only pages attached to your binder, you may not use stray pages.
Response to SERO sea turtle density analysis from 2007 aerial surveys of the eastern Gulf of Mexico: June 9, 2009
 Response to SERO sea turtle density analysis from 27 aerial surveys of the eastern Gulf of Mexico: June 9, 29 Lance P. Garrison Protected Species and Biodiversity Division Southeast Fisheries Science Center