A Metagenomic Approach to Study the Effects of Using Tylosin an Antibiotic Growth Promoter on the Pig Distal Gut Microflora
|
|
|
- Griffin Merritt
- 5 years ago
- Views:
Transcription
1 A Metagenomic Approach to Study the Effects of Using Tylosin an Antibiotic Growth Promoter on the Pig Distal Gut Microflora A DISSERTATION SUBMITTED TO THE FACULTY OF THE GRADUATE SCHOOL OF THE UNIVERSITY OF MINNESOTA BY HYEUN BUM KIM IN PARTIAL FULFILLMENT OF THE REQUIREMENTS FOR THE DEGREE OF DOCTOR OF PHILOSOPHY Dr. Richard E. Isaacson, Adviser June, 2012
2 Hyeun Bum Kim 2012
3 Acknowledgments The work presented in this thesis could not have been completed without the help and support of many individuals. First and foremost, I would like to sincerely thank Dr. Richard E. Isaacson, my adviser, for all the advice, help, guidance, support and encouragement during the course of this study. The freedom he provided me to express my scientific views and the opportunities to interact with the scientific community helped me greatly in developing my research career. I consider myself very lucky to have had Dr. Isaacson as my mentor as he is extremely patient when he advises me. I would also like to thank my other committee members, Dr. Randall S. Singer, Dr. Srinand Sreevatsan, and Dr. Timothy J. Johnson for their help, advice, assistance, and support throughout this journey. I was truly fortunate to have them. I especially thank them for the hospitality and friendship they have showed me during my Ph.D. study. I am thankful to Dr. Bryan A. White at the University of Illinois. Dr. White guided me in a right direction from the beginning of my Ph.D. study and has been a great mentor. I would like to express my gratitude to Dr. Mathur Kannan, Dr. Srirama Rao, Dr. Sabita Rao, Dr. Han Soo Joo and Dr. Keum Hwa Choi and all the faculty members in College of Veterinary Medicine for their support and friendship throughout the course of my Ph.D. study. I enjoyed insightful discussions with Dr. Zheng Jin Tu, Klaudyna Borewicz, Dr. Alexa A. Pragman, Jessica Danzeisen, Dr. Luis Espejo Solovera, Dr. Joao Ribeiro Lima, Jeannette Munoz, Cristian Flores, Mike Tran, Kevin Lang, and Jonathan B. Clayton. I am indebted to them for their support and friendship. It was a pleasure interacting with other i
4 graduate students of College of Veterinary Medicine and I sincerely thank them for their friendship. I thank Dr. Russ Bey and Dr. Keith Wilson from Newport laboratories, Worthington, MN, and Dr. Kwang-Soo Lyoo for their support and help. I also thank Minnesota Supercomputing Institute of the University of Minnesota for their technical support. I was supported by a Doctoral Dissertation Fellowship provided by the University of Minnesota. This work was supported by a grant from the USDA/NRI # I give my heartfelt thanks to my family for their love, encouragement and patience throughout this adventure. I would like to especially express my gratitude to my wife, Bit Na Kang. I could never have earned this degree without her. I also owe thanks to my parents, my extended family, and friends whose love and affection have made my life enjoyable and provided a great deal of comfort. Finally, I thank my children, Mo Re and Grace, who brighten each and every day of my life. ii
5 Abstract Antibiotics have been used extensively as growth promoters (AGPs) in agricultural animal production. However, the specific mechanism of action for AGPs has not yet been determined. Following early demonstrations that oral antibiotics do not have growth-promoting effects in germ-free animals, studies of the mechanism for growth promotion have focused on interactions between the antibiotics and the gut microbiota. The central hypothesis of this study is that AGPs act by influencing compositional changes to the pig gut microbiota. By changing the composition of gut microflora, AGPs improve animal health and promote growth. The overall objective of this study is to investigate alterations of the distal intestinal bacterial microflora in response to AGPs. In this study, natural bacterial diversity of pig feces in commercial production units were described quantitatively, and changes in bacterial diversity over time were measured. Pigs receiving the AGP Tylosin were compared to pigs that did not receive Tylosin. Pyrosequencing of 16S rrna gene libraries was used to describe the microbiota. Finally, we evaluated if the Tylosin improved swine health by reducing sub-clinical infections and inflammation, and by reducing the prevalence and load of an important zoonotic pathogen Salmonella enterica. This longitudinal study of the microbial populations in the feces of the each pig showed that microbiome of the pig feces continued to change as pigs aged. The comparison of the microbiome between Tylosin and No-Tylosin groups showed microbial population shifts representing both microbial succession and changes in response to the use of Tylosin. Tylosin promoted the maturation of the adult-like fecal microbiome. However, there was no significant correlation identified between Tylosin iii
6 treatment and reduce generalized inflammation. There also was no correlation between Tylosin treatments and carriage and load of Salmonella. Overall, our results indicated that the alteration in the intestinal microflora, and its consequences, may be the underlying mechanism for beneficial effects of AGPs. Our results established a baseline upon which mechanisms of AGPs in regulation of health and growth of animals can be investigated. Furthermore, the data will aid in the identification of alternative strategies to improve animal health and consequently production. iv
7 Table of Contents List of Tables viii List of Figures ix Chapter 1. Introduction Chapter 2. Literature Review Practice of Using Antibiotic Growth Promoters (AGPs) in Food Animal Production Use of AGPs in Food Animal Production Use of AGPs in Swine Feeds AGPs: Biological Background of Growth Promotion Microflora of the Pig Intestines Roles of Gastrointestinal Microflora Sequencing-by-synthesis of the Bacterial 16S ribosomal RNA (rrna) gene Libraries S rrna gene Next-generation Sequencing to Describe Bacterial Community Structure Bioinformatics to Investigate Bacterial Community Structure Filtering out Low Quality Sequence Reads General Approach for Community Analysis Diversity and Richness Estimators v
8 2.5.1 Shannon-Weaver and Simpson Diversity Indices Rarefaction Chao1 and Abundance-based Coverage Estimator (ACE) Comparison of Bacterial Communities: Hypothesis Testing Aproaches Serum Acute Phase Proteins Salmonella in Swine Chapter 3. Longitudinal Investigation of the Age-related Bacterial Diversity in the Feces of Commercial Pigs Introduction Materials and Methods Results Discussion Chapter 4. Microbial Shifts in the Swine Distal Gut in Response to the Treatment with Antimicrobial Growth Promoter, Tylosin Introduction Materials and Methods Results Discussion vi
9 Chapter 5. Effects of the Antibiotic Tylosin on C-reactive Protein Levels and Carriage of Salmonella enterica in the Pig Introduction Materials and Methods Results Discussion Chapter 6. Concluding Remarks References vii
10 List of Tables Table 1. Number of DNA sequence reads before and after quality control (QC) Table 2. RDP classification of the sequences at genus level Table 3. Genus classification of the sequences in brackets labeled A and B in the figure Table 4. Summary of sequence reads after quality control Table 5. Microbial diversity of each group of pigs. Pooled sequence reads from all ten pigs in each group were used in diversity calculations Table 6. Sixteen abundant genera in each farm Table 7. Miscellaneous genera of the farm Table 8. Miscellaneous genera of the farm Table 9. RDP classification of unique sequences to each group in farm 1 and Table 10. Antimicrobial susceptibility test: MIC viii
11 List of Figures Figure 1. Data analysis process Figure 2. RDP classification of the sequences at phylum and class levels Figure 3. Heat map Figure 4. PCoA plots Figure 5. RDP classification of the sequences at phylum and class levels Figure 6. Differentially abundant genera between Tylosin and No-Tylosin groups Figure 7. Distribution of OTUs and sequences between Tylosin and No-Tylosin groups Figure 8. Distribution of OTUs in the two treatment groups in the farm 1 and Figure 9. Dendrograms of community structure similarity (Bray-Curtis index) Figure 10. Serum C-reactive protein concentration Figure 11. Number of Salmonella shedding pigs Figure 12. MPN per Salmonella shedding pig in each group Figure 13. Figure 13. Salmonella PFGE and Serotyping ix
12 Chapter 1 Introduction 1
13 1. Introduction In addition to being used for the treatment or prevention of infectious diseases, antibiotics have been used as growth promoters (AGPs) in agricultural animal production for about 60 years (Dibner and Richards, 2005). However, the specific mechanisms of action for AGPs have not yet been determined. Because different antibiotics with different modes of antibacterial actions are able to promote animal growth, the specific mechanisms whereby antibiotics are able to act as growth promoters are unclear. Is there a single mechanism or does each chemical class of AGPs have a unique mechanism? Following early demonstrations that oral antibiotics do not have growth-promoting effects in germ-free animals (Coates et al., 1963), studies of the mechanism of growth promotion have logically focused on interactions between the antibiotics and the gut microbiota. Direct inhibition effects by AGPs on certain gut bacterial populations can be used to explain decreased competition for nutrients and/or reduction in microbial metabolites that depress growth. Growth promotion could be the result of reduction of bacterial population that generates growth-depressing microbial metabolites. (Gaskins et al., 2002). The alteration in the intestinal microflora, and its consequences, may be the underlying mechanism for beneficial effects of AGPs. Despite the beneficial effects of AGPs, the medical community, public health officials, veterinarians, and consumers are becoming increasingly concerned with the wide spread usage of AGPs because doing so results in selection for antibiotic-resistant bacteria. The use of antibiotics at sub-therapeutic levels exposes bacteria to the compounds over extended periods of time, and this contributes to the selection and maintenance of antibiotic resistant bacteria (Dawson et al., 1984; Bager et al., 1997). 2
14 Infections by resistant bacteria are more difficult to treat and treatment is more costly. European countries already banned the use of AGPs, and it is likely that the use of feed based AGPs will be limited in the USA in the future. A recent judicial ruling in the USA has prompted the Food and Drug Administration to re-consider the advisability of using antibiotics as AGPs. It is hoped that the withdrawal of AGPs would result in a reduction in the overall usage of antibiotics in livestock animals leading to a reduction in the antibiotic resistance bacteria in animals. However, the AGP ban in European union resulted in unintentional consequences including: (i) decreased production efficiency, (ii) compensatory increases in usage of therapeutic antibiotics because of increased carriage of food borne pathogens, and (iii) increases in the incidence of infectious disease in animals (McEwen and Fedorka-Cray, 2002). Indeed, reducing the use of AGPs could result in increased carriage of food borne pathogens by livestock and overall reduction in health of these animals. Therefore, it will be imperative to identify ways to replace AGPs without notable negative effects. An initial step in the replacement of AGPs will be to understand the mechanisms by which AGPs regulate the health and promote the growth. It is highly likely that growth promotion is a result of controlling bacterial growth in the intestinal tract or by selection of specific bacterial populations in the intestinal tracts of animals. The overall objectives of the work presented in this thesis were to investigate alterations of the distal gut bacterial microflora of the pigs in response to use of AGP, Tylosin, and to evaluate association between pig health and the use of Tylosin. A central hypothesis of this thesis is that the composition of the bacterial community in the distal gut is responsible fo pig health and that Tylosin selects for a healthy microbiome. Based 3
15 on the hypothesis, this thesis described the age-related bacterial diversity in commercial pig feces and compared bacterial communities between groups of pigs with and without a Tylosin treatment. As a measure of health, the effect of Tylosin in a generalized infection was measured. Also the effect of Tylosin on the prevalence and load of an important zoonotic pathogen S. enterica in commercial pigs was measured. Data presented here showed that Tylosin did not improve animal health as measured by generalized infection or by lowering the prevalence and load of S. enterica. Tylosin did cause bacterial population shifts, and accelerated the maturation of the unique adult-like fecal microbiome. Therefore, overall results from this thesis suggest that one mechanism whereby AGPs act is to speed up the maturation of the fecal microbiome. Our results established a baseline upon which mechanisms of AGPs in regulation of health and growth of animals can be investigated. Furthermore, the data will aid in the identification of alternative strategies to improve animal health and consequently production. 4
16 Chapter 2 Literature Review 5
17 2.1 Practice of Using Antibiotic Growth Promoters (AGPs) in Food Animal Production The widespread use of antibiotics began in the mid 1940s and many believe that they ushered in the era of modern medicine. The powerful nature of antibiotics has undoubtedly enhanced the quality of life for human beings by enhancing human health. Likewise, antibiotics have been used in agriculture and tremendously contributed to the improvement of livestock health and productivity. Antibiotics are routinely used to treat or to prevent infections. Antibiotics also have been shown to enhance the growth rates and efficient metabolism of feed in livestock animals. When used to improve growth rates, antibiotics are called Antibiotic Growth Promoters (AGPs) Use of AGPs in Food Animal Production The growth promoter effect of antibiotics was discovered in the 1940s, when it was observed that animals fed dried mycelia of Streptomyces aureofaciens containing chlortetracycline residues improved their growth. The United States Food and Drug Administration approved the use of antibiotics as animal additives without veterinary prescription in 1951 (Jones and Ricke, 2003). Also in the 1950s and 1960s, European countries approved their own national regulations about the use of antibiotics in animal feeds (Dibner and Richards, 2005; Niewold. 2007). Because certain antibiotics are used in food animals both therapeutically to treat disease and sub therapeutically to increase production performance, it is ambiguous to discern between growth promotion and disease prophylaxis antibiotics. However, AGPs are used at relatively low ranges of 6
18 concentrations, ranging from 2.5 to 125 ppm (2.5 to 125 mg/kg), depending on the type of antibiotic and the food-animal species (Visek. 1978; National Academy of Sciences Committee on Drug Use in Food. 1999; McEwen and Fedorka-Cray, 2002). In the U.S., AGPs (subtherapeutic use of antibiotics) are defined as the use of an antibiotic as a feed additive at concentrations less than 200 ppm (200 mg/kg) in feeds (National Academy of Sciences Committee on Drug Use in Food. 1999). Several mechanisms of how growth promoters act have been postulated including the prevention of sub-clinical infections and the reduction in microbial use of nutrients (Gaskins et al., 2002; Dibner and Richards, 2005). AGPs also could act by reducing the presence of opportunistic pathogens in animals fed AGPs. Bacterial products such as lipopolysaccharides or immune mediators such as interleukin-1 have been shown to reduce feed conversion in animals with a conventional microflora (Roura et al., 1992), which illustrate that the host s response to the indigenous microflora could be a factor limiting growth efficiency. Direct effects of AGPs on the gut microflora might result in decreased competition for nutrients and a reduction in microbial metabolites that depress animal growth (Gaskins et al., 2002). Certain bacteria in the gut are known to be metabolically important for the animal growth. For example cellulolytic bacteria in ruminants provide glucose by degrading cellulose, which would not otherwise be digested by the host. Metabolically optimal compositions of bacteria could be selected by AGPs. Despite the beneficial effects of AGPs, AGP use in the world has been diminished dramatically since mid 1980s because of possible adverse effects of AGPs; potentially selection for antibiotic resistance bacteria. Sweden was the first nation to eliminate the 7
19 use of AGPs in Since then, the European Union continued to reduce the use of AGPs, and has banned use of all AGPs (Dibner and Richards, 2005; Allen et al., 2011). AGP use in the US has been under relatively little regulation. However, it is clear that users of AGPs in the U.S. are under pressure to remove use of AGPs from food animal production (Dibner and Richards, 2005). A recent judicial ruling in the USA has prompted the Food and Drug Administration to re-consider the advisability of using antibiotics as AGPs. On a global level, the withdrawal of AGPs from food animal production was recommended by the World Health Organization (WHO), the Food and Agriculture Organization (FAO), and the World Organization for Animal Health (OIE) until a risk assessment of AGP treatment in food animal production was carried out. The recommendations were based on potential risks of selection of antibiotic resistant bacteria that could be transferred to humans (Dibner and Richards, 2005). It is clear that the use of AGPs in food animal production is under scrutiny in the U.S. and other countries Use of AGPs in Swine Feeds In pig production systems, antimicrobial feed additives have been used either to enhance growth rate or to prevent or treat diseases of the pigs. While antibiotics are fed for 2-6 weeks to treat diseases, AGPs are used for longer periods of time, often for the entire production period (Dewey et al., 1999). According to the National Swine Survey data in the U.S., forty one percent of feeds included one or more individual antimicrobials and 19% included combinations of antimicrobials. The most common combination of antibiotics were chlortetracycline/sulfathiazole/penicillin, chlortetracycline/sulfamethazine/penicillin, and furazolidone/oxytetracycline/arsanilic 8
20 acid. The most commonly used antibiotics in swine production were tetracyclines, carbadox, bacitracin, tylosin, apramycin, and lincomycin. Creep, starter, and first-stage grower pigs were more likely to be fed antimicrobials than second-stage growers, finishers, or adult swine. Tylosin was one of the most often used AGPs in feeds for grower and finisher pigs (Dewey et al., 1999; McEwen and Fedorka-Cray, 2002; Apley et al., 2012). Tylosin belongs to the macrolide class of antibiotics and is substantially similar to erythromycin, spiramycin, tilmicosin, and tulathromycin. Tylosin is isolated from Streptomyces fradiac, and it shares the same mechanism of action with other macrolide antibiotics. Tylosin inhibits bacterial protein synthesis by binding to the 50S subunit of the bacterial ribosome. Tylosin is active against most gram-positive bacteria and Mycoplasma spp., but generally not active on gram-negative bacteria. While tylosin tartrate is easily absorbed from the intestine, tylosin phosphate is relatively poorly absorbed, and normally used as an AGP (Giguere et al., 2006; Stone et al., 2009). In swine production, tylosin has been used for growth promotion as well as for the treatment of several diseases such as atrophic rhinitis and proliferative enteropathy (Giguere et al., 2006). As an AGP, Tylosin was one of the most often used AGPs in feeds for grower and finisher pigs (Dewey et al., 1999). 2.2 AGPs: Biological Background of Growth Promotion One gram of colonic content or feces contains between bacteria, and as many as 500 bacterial species (Savage. 1977; Dibner and Richards, 2005). Although a diverse population of bacteria inhabitat the gastrointestinal (GI) tract, dominant gut 9
21 bacterial populations are Gram-positive bacteria (Savage. 1977; Mackie et al., 1999). The number of bacteria inhabiting the mammalian GI tract outnumbers host cells by 10:1 (Dibner and Richards, 2005). With this high diversity, the indigenous microbiota within the GI tract is known to provide important benefits to its mammalian host (Savage. 1977; Roediger. 1980; Berg. 1996; Backhed et al., 2005). Estimation of the overall proportions of different bacterial species in the GI tract of animals has been conducted by several studies. However, these estimates disagree, as reported results differ based on the specific GI site and the techniques used to measure bacterial content (i.e. traditional culturing methods vs. newer molecular techniques). Nevertheless, it is commonly reported that strict anaerobes such as Bacteroides spp., Clostridium spp., and Bifidobacterium spp. dominate the lower GI sites. Facultative anaerobes such as Escherichia coli, Lactobacillus spp., Enterococcus spp., and Streptococcus spp. are present at lower levels: approximately 1,000 fold lower than dominant bacteria (Suau et al., 1999; Wang et al., 2003). Most of the dominant bacteria are members of the phyla Firmicutes and Bacteroidetes. Proteobacteria which includes Escherichia coli represent a small fraction of the total bacterial population. The class Clostridia contribute most of the Firmicutes (Hayashi et al., 2002; Wang et al., 2003; Eckburg et al., 2005). Clostridia are ubiquitous and generally beneficial components of the gastrointestinal flora, however, some species, such as Clostridium perfringens and Clostridium difficile are pathogens, and cause significant productivity problems as well as food safety issues (Songer. 1998; Songer. 2004; Attwood et al., 2006). A phylotype, which is determined by 16S rrna gene sequence, is equivalent to a term for species. A variety of Bacterioidetes phylotypes 10
22 present in the lower intestinal tract, such as B. thetaiotaomicron, are known to be beneficial to the host helping nutrient absorption, epithelial cell maturation and maintenance (Hooper et al., 2001; Paster et al., 2001; Hayashi et al., 2002; Backhed et al., 2005). In addition to Proteobacteria, detection rates of Actinobacteria, Fusobacteria, and Verrucomicrobia phyla also are low (Backhed et al., 2005). The specific mechanisms whereby antibiotics are able to act as growth promoters are unclear because different antibiotics with different modes of actions are able to promote animal growth. However, there are several hypothetical mechanisms, including inhibition of sub-clinical infections and reduction of microbial use of nutrients. The effect of orally ingested AGPs can include the enhancement of body weight gain but often is limited to feed efficiency effects only. The mechanism of action is likely to be focused on the gut because some of these antibiotics are poorly absorbed. Following early studies that demonstrated that oral antibiotics do not have growth-promoting effects in germ-free animals (Coates et al., 1963), studies of the mechanism for growth promotion have focused on interactions between the antibiotics and the gut microbiota. Thus, direct effects of AGPs on the gut microflora can be used to explain decreased competition for nutrients and reduction in microbial metabolites that depress growth (Gaskins et al., 2002). A reduction in opportunistic pathogens and subclinical infections also has been linked to use of AGPs. It should be noted that injection of bacterial components such as lipopolysaccharides or immune mediators like interleukin-1 can mimic the reduced efficiency of an animal with a conventional microflora that do not receive antimicrobial in their diets (Roura et al., 1992), which illustrates the importance of the host response to 11
23 the microflora as another factor limiting growth efficiency. The alteration in microflora, and its consequences, may be the underlying mechanism for beneficial effects of antibiotics. It is highly likely that growth promotion is a result of controlling bacterial growth in the intestinal tract or selection of specific bacterial populations in intestinal tracts of animals Microflora of the Pig Intestines Before the advent of new molecular tools, studies about the GI microflora of pigs have been heavily based on culture dependent methods, Culture independent methods are based on sequencing of 16S rrna genes to investigate taxonomic compositions and distributions of GI bacteria of pigs. Culture based methods have been an important means to investigate the microflora in the pig gut, however, these were limited by their inability to describe the majority of the intestinal bacteria because a high percentage of the GI bacteria have not been cultured in vitro. Prior to the advent of next generation sequencing, the study by Leser et al employed PCR amplification coupled with gene cloning and full length sequencing of the 16S rrna gene in ileum, cecum, and colon. Their resutls demonstrated that a greater depth of sequencing would yield greater diversity (Leser et al., 2002). Data reported by Leser et al showed 375 unique operational taxonomic units (OTUs). OTU was defined at a 97% sequence identity level. The five most common phylogenetic lineages found in order of dominance were: Eubacterium, Clostridium, Bacillus-Lactobacillus- Streptococcus subdivision, Flexibacter-Cytophaga-Bacteroides group, and bacteria in the phylum Proteobacterium (Leser et al., 2002). 12
24 With an advent of new sequencing strategies, sequencing of the 16S rrna gene of bacteria using high throughput DNA sequencing facilitated extensive descriptions of the gut microflora (Fox et al., 1977; Woese and Fox, 1977; Fox et al., 1980; Schuster. 2008). Several recent studies have been published on the microbiome of the pig using whole metagenome sequencing and sequencing of PCR amplified variable regions of the 16S rrna gene coupled with pyrosequencing. Because of the nature of the sequencing technology, the depth of coverage is much greater compared to all of the previous studies combined. Recent analysis of swine fecal metagenome generated by pyrosequencing of fecal DNAs showed that the swine distal gut was dominated mainly by two phyla, Firmicutes and Bacteroidetes (Lamendella et al., 2011). Firmicutes and Bacteroidetes phyla have also been shown to be major phyla in other mammalian gut envronments, including the pig intentines (Lamendella et al., 2011). The most numerically abundant bacterial orders based on swine fecal metagenome were Clostridiales, unclassified Firmicutes, Bacteroidales, Spirochaetales, unclassified gammaproteobacteria, and Lactobacillales. Prevotella was the most abundant genus comprising 19-22% of 16S rrna gene sequences within swine fecal metagenomes followed by Sporobacter, Anaerovibro, Clostridium, and Streptococcus genera (Lamendella et al., 2011). The study of Lamendella et al is consistent with another recent study of swine fecal microbiome where the majority of classifiable sequences (75 86%) belonged to the phyla Bacteroidetes, Firmicutes, and Proteobacteria, and Prevotella was consistently abundant genus.(looft et al., 2012). 13
25 However, another study using a variable region sequencing of 16S rrna gene with 454 pyrosequencing showed that the most frequently identified genera in ileum of pigs differed from those detected in feces. The 10 most frequently identified genera in ileum of pigs were Clostridium, Lactobacillus, Streptococcus, Helicobacter, Ruminococcus, Veillonella, Candidatus, Actinobacillus, Bacillus, and Turicibacter (Dowd et al., 2008) Roles of Gastrointestinal Microflora It has been estimated that the size of the gut bacterial population is up to 100 trillion (10 14 ), and it is 10 times greater then the total number of somatic and germ cells that make up most mammals (Savage. 1977). The gut microbiome contains more than 100 times the number of genes in the mammalian host, therefore, the genetic diversity of the microbiota in the gastrointestinal tract is very large and has the potential to endow the host with biological functions that the host lacks or those that the host did not have to evolve itself because of functional features provided by gut microbiome. Therefore, the notion of commensal (the microbes benefiting, while the host is unharmed) in the mammalian host has been replaced by the mutualistic microbial organ in which both partners benefit (Backhed et al., 2005). The gut microbiota benefits the host by playing important roles in nutrient synthesis and digestion, energy metabolism, vitamin synthesis, and immune responses. It has been known that hots utilize end products of the microbial fermentation as energy sources. It is estimated that 5-20% of the total energy of the pigs is provided by microbial fermentation end products including acetic and propionic acids in the cecum 14
26 and colon (Gaskins et al., 2002). Mammals can catabolize certain disaccharides and convert them into monosaccharides, such as glucose and galactose that can be used as energy sources. However, mammals lack the ability to degrade many plant based polysaccharides like cellulose. Components of the gut microflora are known to contain cellulolytic bacteria that synthesize enzymes to digest plant polysaccharides (Bik. 2009). For example, Bacteroides thetaiotaomicron encodes 400 enzymes encoding the transport, binding, and digestion of complex sugars (Xu et al., 2003). In addition to nutrient synthesis and digestion, the gut microflora plays a role in energy metabolism in the host. Backhed et al showed that the gut microflora regulates body fat storage in the host. Results from their study revealed that the gut microflora enhanced the absorption of monosaccharides and the induction of hepatic lipogenesis in conventionally reared mice resulting in more body fat in mice with gut microflora compared to germ free mice in which fasting-induced adipocyte factor in the intestinal epithelium was suppressed (Backhed et al., 2004). Certain genera of the indigenous GI microbiota, such as Bacteroides and Eubacterium produce vitamin B12 and vitamin K (Wostmann. 1981; Berg. 1996; Hill. 1997). The gastrointestinal microflora also is an essential stimulus in the development of the animal s immune system. Work employing germ-free animals has shown that the indigenous microflora stimulates the immune system by promoting the development and expansion of the lamina propria in intestines (Savage. 1977). However, one of the most important health related beneficial effects of the GI microbiota is colonization resistance where GI microbiota prevent colonization of exogenous pathogenic bacteria in the GI tract. GI commensal bacteria block pathogens 15
27 from colonizing the GI tract by competing with them for carbon and energy source as well as for adhesion sites in the GI tract (Berg. 1996). 2.3 Sequencing-by-synthesis of the Bacterial 16S ribosomal RNA (rrna) Gene Libraries Modern techniques to describe microbial communities are mostly dependent on 16S rrna gene sequencing using high throughput next generation sequencing (i.e. sequencing by synthesis using Roche 454 sequencers or Illumina sequencers). The pioneering work of Carl Woese looking at the sequences of bacterial 16S rrna led to the understanding that 16S rrna genes could be used to infer taxonomic designations for bacteria (Woese and Fox, 1977; Fox et al., 1980). Woese et al showed that the prokaryotes could be classified into two distinct groups, Bacteria and Archaea based on differences of 16S rrna genes (Woese and Fox, 1977). Using constructed recombinant clone libraries, Olsen et al. showed that the sequence of the 16S rrna gene could be used to describe complex microbial structures (Olsen et al., 1986; Pace et al., 1986). The 16S rrna gene is unique in that it is conserved in all bacteria and is structurally composed of multiple conserved sequences that are maintained in all species and unique hyper variable regions that correlate with species type. In its simplest implementation, physical methods that can distinguish differences in the sequence of the 16S rrna gene have been used to assign taxonomic designations (Nocker et al., 2007). In general, community DNAs derived from samples are used to create PCR amplicon libraries. The sequences of the target hypervariable region(s) of 16S rrna are generated by PCR followed by sequencing using the high throughput next generation 16
28 sequencing (i.e. sequencing by synthesis using Roche 454 sequencers or Illumina sequencers). The sequences are used for taxonomic classification and diversity analysis using bioinformatics tools, such as Ribosomal Database Project (RDP) classifier, FastUnifrac, Metastat, and Mothur with an OTU definition at a identity cutoff of 97%. OTUs are the population inferred to exist on the basis of sequence data, and can be defined at different levels of resolution. Since OTUs are inferred to exist based on sequence data, OTUs are not necessarily equivalent to traditional taxonomic classification (Dethlefsen et al., 2008). However, sequences with greater than 97% identity are typically assigned to the same species (Schloss et al., 2009). These techniques showed that real microbial communities are more complex and diverse than previously thought, and have rapidly enhanced our knowledge of phylogenetic relationships between microbial taxa (Hugenholtz. 2002; Rappe and Giovannoni, 2003) S rrna Gene Direct amplification and sequencing of 16S rrna genes have been replacing culture-dependent techniques to perform taxonomic studies and identify bacterial species (Bik. 2009). 16S rrna gene in prokaryotes encodes the 16S rrna of the small ribosomal subunit, and it is about 1,550 bp long. Several characteristics of 16S rrna genes make them suitable for phylogenetic analysis (Olsen et al., 1986). The 16S rrna gene is the portion of the DNA that is most frequently used to identify bacterial species (Clarridge. 2004). 16S rrna genes are housekeeping genes, thus they are found in all bacteria because of their pivotal function in protein synthesis. 17
29 The 16S rrna gene is composed of both variable and conserved regions (Clarridge. 2004). Nine hypervariable regions (V1-V9) within the bacterial 16S rrna genes showed considerable sequence diversity among different bacterial species and can be used for species identification. Closely related bacterial species share more similar sequences than those of more distant bacterial groups (Van de Peer et al., 1996). Conserved DNA sequences flank nine hypervariable regions, and they enable universal primer design which target specific regions of 16S rrna genes in PCR amplification (Munson et al., 2004; Chakravorty et al., 2007; Wang and Qian, 2009). Numorus 16S rrna hypervariable region sequences have also been identified, and they have been used to identify a single bacterial species or differentiate among a limited number of different species or genera (Becker et al., 2004). Rapid approaches that detect certain speciesspecific sequences within a single hypervariable region are also in common use (Stohr et al., 2005). Single variable regions (V2 through V6) as well as combinations of multiple regions (eg. V3/V4 and V4/V5) have been used in the bacterial species identification after high throughput sequencing (Chakravorty et al., 2007; Claesson et al., 2009; Claesson et al., 2010). It appeared that V3 was the most suitable single region for distinguishing all bacterial species to the genus level, and a combination of V4/V5 regions was superior to V3/V4 regions because of less amplification bias introduced by the sequencing (Chakravorty et al., 2007; Claesson et al., 2010) Next-generation Sequencing to Describe Bacterial Community Structure 18
30 Next generation sequencing transformed the field of biology, and enabled massive scientific achievement and unique biological applications. Compared to Sanger capillary sequencing, high throughput DNA sequencing is a technique that provides a tool to completely describe the bacterial community structure (Woese and Fox, 1977; Fox et al., 1980; Schuster. 2008). 454 pyrosequencing is the most commonly used massively parallel sequencing technology to describe the bacteria present in a highly diverse community. There also have been studies of 16S rrna gene analysis using illumina sequencing technology. 454 pyrosequencing is superior to illumina sequencing technology in terms of sequence read length; 454 pyrosequencing generates sequence length over 450 bp long while illumina sequencing provides about 100 bp read length. However, illumina sequencing provides larger number of sequence reads than 454 pyrosequencing does with the same cost (Claesson et al., 2010). Because of better discriminatory power of longer 16S rrna sequences than short reads, the method of choice for 16S rrna gene analysis has been 454 pyrosequencing. 2.4 Bioinformatics to Investigate Bacterial Community Structure The challenges of 16S rrna gene analysis are related to a lack of proper tools, limited reference data sets, and the difficulty of handling massive amounts of data generated by high throughput DNA sequencing. However, bioinformatics tools for the analysis of 16S rrna genes have improved to handle the vast data sets produced, and new reference sequence information have been added to preexisting reference data. Bioinformatics tools, such as RDP classifier, FastUnifrac, Metastat, and Mothur are the widely used tools in 16S rrna gene analysis. 19
31 2.4.1 Filtering out Low Quality Sequence Reads Low quality sequences include sequence reads with sequence calling error and chimera formation. A wrong base calling rate (a substitution rate) of 0.042% was known to occur when a known template was used in GS FLX sequencer, and the majority of errors were insertions and deletions in homopolymer runs. Most errors were found in a few exceptionally bad reads (Quinlan et al., 2008). Currently, the company claims that sequencing error of 454 pyrosequencing is less than 0.005%. At the quality screening process, sequences that contain more than one undetermined nucleotide (N) and sequences with average quality score (error rate) less than 25 are discarded (Huse et al., 2007). Several bioinformatics tools, such as RDP s pyrosequencing pipeline and Mothur, have been utilizing to remove low quality sequence reads from the data set (Schloss and Handelsman, 2005; Wang et al., 2007; Schloss et al., 2009). Another strategy to correct for sequence artifacts including incorrect or low abundance sequence reads in high throughput sequencing data sets is to cluster sequences at 97% sequence identity (Gobet et al., 2010). The combined use of quality trimming to 0.2% error probability (equivalent to a phred quality score of > 27) in LUCY and a clustering threshold of 97% identity has proven to provide accurate, high sensitivity pylogenetic profiling of microbial communities (Kunin et al., 2010). Chimeras are recombinant hybrid DNA molecules produced by multiple parent sequences during the PCR reactions, and they are considered as sequence artifacts (Haas et al., 2011). Bacterial community analysis based on PCR-amplified 16S rrna gene sequences can be influenced by the formation of chimeric 16S RNA amplification 20
32 products. The use of 20 PCR cycles and high-fidelity proofreading enzyme minimized the formation of chimeric 16S RNA amplification products, but it did not eliminate the formation of chimeras (Lahr and Katz, 2009; Haas et al., 2011). Recently, several chimeric 16S rrna gene amplification product detection tools became available. However, these tools generally lack the capability of detecting chimeras less than 400 bp or lack a strategy to decide whether detected chimeras are really chimera or not (Gonzalez et al., 2005; Haas et al., 2011). Recent development of Chimera Slayer and UCHIME improved sensitivity and speed of chimera detection for smaller sequences (Edgar et al., 2011; Haas et al., 2011). Nevertheless, relatively little effect of chimeras on similarities and differences among bacterial communities has been shown because chimeras are generated uniquely within each sample (Ley et al., 2008) General Approach for Community Analysis RDP Pyrosequencing Pipeline has been used to detect any demographic patterns of bacterial communities using the large and robust datasets (Cole et al., 2009). Various functions of Mothur also can be used (Schloss and Handelsman, 2005; Schloss and Handelsman, 2006; Wang et al., 2007; Schloss et al., 2009). Statistical approaches to comparative community analysis can be conducted using Metastat (White et al., 2009). Metastat allows users to identify statistically unique components of the microbiome that are selected by specific treatments. Nucleotide sequences provide a precise analysis of the estimation of species richness based on 16S rrna gene sequences. Although distinctions are controversial, 21
33 sequences with greater than 97% identity are typically assigned to the same species, those assigned to the same genus have greater than 95% identity, and sequences with more than 80% identity are typically assigned to the same phylum (Schloss et al., 2009). Mothur calculates various diversity indices and richness estimators which are useful to compare the relative complexity among microbial communities and to estimate the completeness of sampling of a community (Schloss and Handelsman, 2005; Schloss et al., 2009). A rapid phylogenetic assessment using the RDP Classifier was the choice of taxon-based analysis to conduct the comparison of the community data analysis (Wang et al., 2007; Cole et al., 2009). The RDP Classifier provides rapid affiliation of each sequence to its closest phylogenetic group based on similarity to libraries constructed from all previously analyzed sequences in the database. Figure 1. Data analysis process 22
34 Once pairwise distances among sequences are obtained, Mothur generates diversity indices and richness estimators using pairwise distances (Eckburg et al., 2005; Schloss and Handelsman, 2005; Grice et al., 2008; Schloss et al., 2009). Using the distance matrix, sequences group into OTUs. Mothur defines OTUs at various cutoffs differences (ex. unique, 0, 1, 2, 3, 4, 5, 6% differences). A similarity cutoff of 97% has been commonly used to define an OTU and to calculate diversity and richness indices because 16S rrna sequences with greater than 97% identity are typically assigned to the same species (Schloss and Handelsman, 2005). A similarity cutoff of 97% means that the least similar pair within the phylotype shares at least 97% similarity. Mothur calculates diversity indices and richness estimates with 95% high and low confidence intervals. Even though, recent evidence suggests that bacteria with nearly-identical 16S rrna sequences may represent variable genotypes and different species (Eckburg et al., 2005; Konstantinidis and Tiedje, 2005; Thompson et al., 2005), it has been proven that the combined use of quality trimming to 0.2% error probability (equivalent to a phred quality score of > 27) in LUCY and a clustering threshold of 97% identity is sufficient to provide accurate, high sensitivity pylogenetic profiling of microbial communities (Kunin et al., 2010) (Figure 1). 2.5 Diversity and Richness Estimators In a stable gastrointestinal (GI) ecosystem, all available niches are inhabited by normal flora, the collection of microorganisms that normally occupy the GI tract. Any transient species derived from foreign sources other than GI ecosystem will not colonize, 23
35 but will pass through the GI tract (Berg. 1996; Manson et al., 2008). Nevertheless, the GI tract ecosystem is very complex and dynamic. It has been estimated that a total about bacteria populate the microbial population in the GI tract, and between 500 to 1,000 bacterial species present in the GI tract (Xu and Gordon, 2003; Sonnenburg et al., 2004). Most bacterial species in the GI ecosystem have not yet been cultured. In addition, even with the development of a culture independent method using PCR, cloning, and sequencing, studies on the diversity of microflora in the GI tract have been limited because of high costs and lack of throughput. However, recent application of the sequence analysis of the 16S rrna gene and the development of pyrosequencing technology enables us to sufficiently explore the microbial communities of GI tract and their diversity (Schmalenberger et al., 2001; Sogin et al., 2006; Chakravorty et al., 2007; Huber et al., 2007). With the advent of high-throughput sequencing, characterization of the nucleic acid world is proceeding at an accelerated pace. The approach to use high throughtput 454 pyrosequencing in combination with utilization of 16S rrna gene maximizes the bacterial species detecting power, and to sufficiently explore the microbial community (Sogin et al., 2006; Huber et al., 2007). The important features of bacterial communities are their diversity and richness: the number of species present and their numerical composition. In order to compare and estimate species diversity and richness from samples of microorganisms, a variety of statistical approaches have been developed. Shannon-Weaver and Simpson diversity indices are commonly used in diversity estimation of communities based on OTUs, which is the population inferred to exist on the basis of sequence data, and can be defined 24
36 at different levels of resolution. Rarefaction is used in richness measurement (relative richness; measurement of OTUs observed), whereas, ACE and Chao indices are used in richness estimation (estimated richness; measurement of OTUs expected) (Chao. 1984; Chao. 1987; Chao and Lee, 1992; Chao et al., 1993; Chao and Bunge, 2002; Schloss and Handelsman, 2005; Chao et al., 2006; Dethlefsen et al., 2008) Shannon-Weaver and Simpson Diversity Indices A definition of biodiversity is widely cited as follow: Biological diversity means the variability among living organisms from the ecological complexes of which organisms are part, and it is defined as species richness and relative species abundance in space and time (Magurran. 2004). Biological diversity has been quantified in many different ways. Richness and evenness are the two main factors taken into account when measuring diversity of certain samples. A measure of the number of different kinds of organisms present in a particular community is defined as richness. Species richness is the number of different species present. If more species present in the first sample than the second, the first sample is richer than second. Richness gives as much weight to those species that have very few individuals as to those that have many individuals. Species richness does not take into account the number of individuals of each species present. However, diversity depends not only on richness, but also on evenness. Evenness compares the similarity of the population size of each of the species present. Evenness is a measure of the relative abundance of the different species consisting of the richness of a community. As species richness and evenness increase, so does diversity. Shannon- Weaver and Simpson diversity indices have been traditionally used to measure diversity 25
37 of communities (McArthur. 2006). A diversity index is a mathematical measure of species diversity in a community. Shannon and Simpson's Diversity indices provide more information about community composition than simply species richness (i.e., the number of species present). They also take the relative abundances of different species into account. By taking relative abundances into account, a diversity index depends not only on species richness but also on the evenness, or equitability, with which individuals are distributed among the different species. However, both diversity indices are related with specific biases. The Shannon-Weaver index places a greater weight on species richness, while the Simpson index considers species evenness more than species richness in its calculation (Magurran. 1988; Schloss and Handelsman, 2005; McArthur. 2006) Rarefaction When samples are collected, there is a need to evaluate how well a sample reflects a community s true diversity, which is synonymous with species richness and relative abundance in time and space (Magurran. 2004). This is important in the studies being proposed that the association of certain microbial compositions is dependent upon the data being representative of its true composition. New biological techniques have discovered numerous species that were not detected with culture-dependent methods and morphological identification. Nevertheless, it is still impossible to reveal all bacteria of microbial communities. Consequently, microbiologists must depend on samples to inform them about the actual diversity of microbial communities. A variety of statistical approaches have been developed to compare species richness from samples. Rarefaction 26
38 curves measure OTUs observed, and are used to compare observed richness among communities that have been unequally sampled (Hughes et al., 2001). The oldest and simplest measure of species richness is to count the number of species present in the community, and some communities are simple enough to permit a complete count of the number of species present. Even though complete counts can often be done for communities in small habitat, it is often impossible to count every species in communities of a variety of organisms. In addition, a usual problem arisen from comparing samples of different sizes is that they are based on different sample sizes. The larger the sample, the greater the expected number of species. Consequently, a richness measurement is affected by a sample size. For example, if one community has 80 species in a collection of 3,200 individuals and a second community has 80 species in a collection of 950 individuals, we do not know immediately which community has higher species richness. One way to solve this problem is to standardize all samples from different communities to a common sample size of the same number of individuals (Sanders. 1969; Hughes et al., 2001). Rarefaction is a statistical method for estimating the number of species expected in a random sample of individuals taken from a collection. Rarefaction method allows direct comparisons of samples of different sizes regardless of sample sizes. The rarefaction method is dependent upon the shape of the species abundance curve and discovery rate rather than the absolute number of species per sample (Sanders. 1969). Rarefaction tells us if the sample had consisted of N individuals, what number of species would likely have been there? (Hughes et al., 2001). 27
39 2.5.3 Chao1 and Abundance-based Coverage Estimator (ACE) There are undiscovered species in almost every taxonomic study sample. In species taxonomic analyses, a practical problem is to predict the number of species in a bacterial community based on sequence data initially obtained. Accurate assessment of species richness is useful for the effective analysis of biological communities (Shen et al., 2003). In contrast to rarefaction, which compares observed richness among samples, richness estimators estimate the total richness of a community from a sample (Hughes et al., 2001). Chao1 and abundance-based coverage estimator (ACE) have been introduced to estimate richness, and they measure expected OTUs based on observed OTUs (Chao. 1984; Chao and Lee, 1992; Chao et al., 1993; Schloss and Handelsman, 2005). Chao1 is a non-parametric method to estimate the number of species in a community. Chao richness estimator was developed by Anne Chao and it is based on the concept that rare species infer the most information about the number of missing species. Chao1 estimates expected OTUs based on observed OTUs. Because Chao richness estimator gives more weight on the low abundance species, only the singletons and doubletons are used to estimate the number of missing species (Chao. 1984). Therefore, this index is particularly useful for data sets skewed toward the low-abundance species (Hughes et al., 2001). The ACE is a non-parametric method to estimate the number of species using sample coverage, which is defined as the sum of the probabilities of the observed species. The ACE method divides observed frequencies into abundant and rare groups. The abundant species are those with more than 10 individuals in the sample, and the rare species are those with fewer than 10 individuals. Only the presence or absence 28
40 information of abundant species is considered in the ACE method because they would be discovered anyway. Therefore, the exact frequencies for the abundant species are not required in the ACE method. On the other hand, the exact frequencies for the rare species are required because the estimation of the number of missing species is based entirely on these rare species (Chao and Lee, 1992; Chao et al., 1993; Hughes et al., 2001) Comparison of Bacterial Communities: Hypothesis Testing Approaches In current microbial ecology, one of the most important challenges is to compare the memberships (the list of OTUs in a community) and structures (the combination of membership and the abundance of each OTU) of communities at a specific OTU designation. Comparing the community membership and structure is critical in evaluating the degree of difference which is responsible for the difference between communities. For instance, membership and structure differences between bacterial communities in healthy and diseased animals will help us to identify candidate microbial populations accounting for healthy and disease status (Schloss and Handelsman, 2006). From descriptive characterizations of a community to hypothesis-driven ecological research, microbial ecology studies have advanced remarkably. As a result, a number of statistical tools, which describe and compare the community membership and structure of microbial communities using PCR-based libraries containing 16S rrna genes, have been developed (Schloss and Handelsman, 2006; Schloss. 2008). Existing tools, such as UniFrac and Mothur compare community structures and the memberships in different communities (Singleton et al., 2001; Schloss et al., 2004; Lozupone and Knight, 2005; 29
41 Lozupone et al., 2006; Schloss and Handelsman, 2006; Hamady et al., 2010). 2.6 Serum Acute Phase Proteins The positive relationship between infections and the elevated concentration of the serum acute phase proteins (APPs) has been demonstrated (Burger et al., 1992; Chen et al., 2003; Petersen et al., 2004). A particular acute phase serum protein (APP), C-reactive protein (CRP), has been used to access health status in swine, and the possible use of the serum acute protein as a biomarker of animal health was suggested (Burger et al., 1992; Heegaard et al., 1998; Sorensen et al., 2006). CRP has known to be associated with inflammation and it has been speculated that reduction of inflammation is one of mechanisms whereby antibiotics act as growth promoters (Gaskins et al., 2002). Quantitatively measured CRP can be used as indicators of swine health status. The acute phase response is a complex set of systemic reactions seen in animals shortly after exposure to a triggering event, and it is the body s early defense in response to trauma, inflammation or infection. One component of the acute phase response is increased hepatic synthesis increased serum concentration of APPs. Cytokines act as messengers between the local site of injury and the hepatocytes synthesizing the acute phase proteins, and the acute phase response is induced by cytokines (Petersen et al., 2004). The serum concentration of the APPs changes dramatically during the acute phase response. APPs produced by hepatocytes are present at different concentrations in the blood. Serum acute phase proteins can be classified based on the magnitude of their increase. Concentrations of positive acute phase proteins, such as haptoglobin (Hp), 30
42 serum amyloid A (SAA), and CRP increase, and negative acute phase proteins, such as albumin decrease during the acute phase response (Steel and Whitehead, 1994). Among APPs, the CRP has been used to detect health status in swine. Biological functions of CRP are complement activation and opsonization. During the early stages of infection, the serum concentration of CRP increases. Serum concentration of CRP correlates well to the clinical score and the effect of antibiotic treatment in experimental bacteria infection in pigs (Petersen et al., 2004). 2.7 Salmonella in Swine Salmonella is a non-lactose fermenting bacteria in the family Enterobacteriaceae. Salmonella is a gram-negative, noncapsulated, short rod that has peritrichous flagella and fimbriae. Salmonella is facultatively anaerobic and will grow on defined media without special growth factors (Timoney et al., 1988). However, the isolation and quantification of Salmonella from feces is to some extent prone to failure because Salmonella is often a minority among competitor bacterial species in feces. In order to ameliorate this constraint, multiple enrichments using specially formulated differential and selective media for the isolation of Salmonella have been devised, and the most useful of these are xylose-lysine-tergitol (XLT) and Xylose-Lysine-Deoxycholate (XLD) agars that have replaced MacConkey agar. It has also been shown that a better recovery of Salmonella in fecal contents by using tetrathionate broth and Rappaport-Vassiliadis R10 broth than using GN Hanja broth. The optimum growth temperature is 37 C (Timoney et al., 1988; Busse. 1995; Nye et al., 2002; Korsak et al., 2004). 31
43 Studies showed that medically important salmonella organisms may be considered as a single species, known as Salmonella enterica, which has more than 2,500 different serotypes (Murray et al., 1999). Most medical laboratories keep using clinically familiar names, such as Salmonella typhimurium or Salmonella serotype typhimurium, which would be renamed Salmonella enterica serotype Typhimurium (Timoney et al., 1988; Hohmann. 2001). Salmonella serovars, which are commonly found in swine, are a major human health problem in the U.S. The top 4 most common serotypes associated with human Salmonella infections are S enterica serovar Typhimurium, S. Heidelberg, S. Agona, and S. Infantis (Foley et al., 2008). As one of the common food borne diseases in humans, Salmonellosis is associated with contaminated food, including pork products. Contaminated pork is an important source of Salmonella infection in humans. In 2000, a study showed that 9.6% of the pork in U.S. retail stores was contaminated with Salmonella (Duffy et al., 2000). A reduction in opportunistic pathogens, such as Salmonella, has been proposed as one of mechanisms for antibiotic-mediated growth promotion. However, it is not clear whether use of AGPs results in lower carriage or load of Salmonella (Dibner and Richards, 2005). The reduction in opportunistic pathogens by AGPs, if true, is of importance in terms of accessing the mechanisms of growth promotion by AGPs as well as its relationship with public health. 32
44 Chapter 3. Longitudinal Investigation of the Age-related Bacterial Diversity in the Feces of Commercial Pigs 33
45 Longitudinal Investigation of the Age-related Bacterial Diversity in the Feces of Commercial Pigs Hyeun Bum Kim a, Klaudyna Borewicz a, Bryan A. White b, Randall S. Singer a, Srinand Sreevatsan a, Zheng Jin Tu c, Richard E. Isaacson a a Department of Veterinary and Biomedical Sciences, College of Veterinary Medicine, University of Minnesota, Saint Paul, MN 55108, USA b Department of Animal Science, University of Illinois, Urbana, IL 61801, USA c Minnesota Supercomputing Institute, University of Minnesota, Minneapolis, MN 55455, USA Published as: Hyeun Bum Kim, Klaudyna Borewicz, Bryan A. White, Randall S. Singer, Srinand Sreevatsan, Zheng Jin Tu, Richard E. Isaacson (2011) Longitudinal Investigation of the Age-related Bacterial Diversity in the Feces of Commercial Pigs. Veterinary Microbiology. November 21:153(1-2),
46 The importance of bacteria in the gastrointestinal tracts of animals is widely acknowledged as important. However, very little is known about composition and distribution of the microbial population in lower intestinal tracts of animals. Because most bacterial species in pig intestines have not been cultured, it has been difficult to analyze bacterial diversity by conventional culture methods. Even with the development of culture independent 16S rrna gene sequencing, the previous methods were slow and labor intensive. Therefore, high throughput pyrosequencing of 16S rdna libraries was used in this study in order to explore the bacterial diversity of the pig feces. In our two trials, fecal samples from individual pigs were collected five times at 3-week intervals, and the 16S rrna genes in the community DNAs from fecal samples were sequenced and analyzed. This longitudinal study design identified that microbial populations in the feces of the each pig continued to change as pigs aged. The variations of bacterial diversity of the animals were affected by less abundant bacterial components of the feces. These results help us to understand the age-related bacterial diversity in the commercial pig feces. Keywords: 16S rrna gene, bacterial microbiome, Pig 35
47 3.1 Introduction It has been estimated that approximately bacteria populate the mammalian gastrointestinal (GI) tract, and it had been thought that this population was composed of 500 to 1,000 bacterial species (Xu and Gordon, 2003; Sonnenburg et al., 2004). Studies of bacterial diversity in the GI tract have been facilitated by the development of cultureindependent, high throughput DNA sequencing. The initiation of the Human Microbiome Project facilitated a better understanding of the normal GI microbiota. Thus, much of what we know about the gut bacterial microbiome has been based on studies of humans (Roberfroid et al., 1998; Turnbaugh et al., 2007). In a balanced GI ecosystem, bacterial communities inhabit available niches and these communities are regularly and consistently found to occupy the normal GI tract. Transient species normally do not stably colonize the GI ecosystem, but pass through the GI tract (Berg. 1996; Manson et al., 2008). However, the GI bacterial microbiome is dynamic and subject to changes based on time, age, exposure to microbes, diet, and many other factors. Furthermore, disruptions in the gastrointestinal microflora allows the establishment of pathogenic, exogenous bacteria by decreasing colonization resistance (Berg. 1996). Thus, the GI tract ecosystem is very complex. Compared to humans, much less is known about the bacterial microbiome of the pig. Even though studies of bacterial diversity in the GI tract of the pig have been facilitated by the development of culture-independent DNA sequencing, studies were either limited in their abilities to identify the extent of bacterial diversity in the samples by not employing extensive DNA sequencing techniques, or unable to show longitudinal changes of the bacterial diversity within the same animals by collecting samples after euthanizing animals (Leser et al., 2002; Dowd et al., 2008; Vahjen et al., 36
48 2010). As well, little is known about how the GI bacterial microbiome of the pig contributes to swine growth and health. It is understood that pigs rely on bacterial fermentation end-products in the colon for 5-20% of their total energy (Hedde and Lindsey, 1986; Gaskins et al., 2002). One of the impediments to understanding the composition of the GI microbial community is that most bacterial species in the GI ecosystems have not yet been cultured. However, the use of high throughput DNA sequencing of the 16S ribosomal RNA (rrna) gene has resulted in robust methods to identify bacteria in populations in a culture independent manner. These methods have enabled investigators to explore the microbial communities of the GI tract and their diversity (Dowd et al., 2008; Vahjen et al., 2010). It is generally accepted that the GI bacterial microbiome changes over time from birth through adulthood (Savage. 1977). There is a succession of microbes over time that transition from aerobes in neonates to strict anaerobes in adults. This succession culminates in a somewhat balanced climax community in adults. With the current use of high throughput DNA sequencing, broad determinations of bacterial community diversity and richness can be estimated. Furthermore, sequences can be assigned to operational taxonomic units (OTUs) based on DNA sequence homologies, then the bacterial diversity can be explored by analyzing OTUs (Schloss and Handelsman, 2005; Sogin et al., 2006; Huber et al., 2007; Dethlefsen et al., 2008). In this paper, we describe the natural bacterial diversity of the pig feces in commercial production units and quantitatively describe changes of the bacterial diversity over time. Furthermore, we determined 37
49 whether this data could be analyzed by pig group rather than by individual pigs by comparing the individual pigs and pooled samples of 10 pigs. 3.2 Materials and Methods Animals and Sample Collection Pigs in two commercial pig farms located in Southwest of Minnesota, U.S.A. were used in this study. The barns contained 20 pens and each pen had 25 pigs. Pigs were kept in the same pen of the barn during the entire sampling period without introduction of any new pigs. Ten pigs from the total of 25 were randomly selected and ear tagged for identification. Fresh fecal samples from each of the ear tagged animals were individually collected from the pig s rectum. Samples were collected five times over their growth period at 3-week intervals starting when the pigs were 10-weeks old. Pigs did not receive antibiotics in feed or for any therapeutic purposes Isolation of DNA Total DNA representing the fecal microbial communities was extracted from individual fecal samples using an established method (Yu and Morrison, 2004). Briefly, community DNA was extracted from 0.25g aliquots of each fecal sample. The DNA extraction method employs two rounds of bead-beating in the presence of NaCl and sodium dodecyl sulfate, followed by sequential ammonium acetate and isopropanol precipitations. The precipitated nucleic acids were then treated with RNase A and proteinase K, and the DNA purified using columns from the QIAgen DNA Mini Stool 38
50 Kit (QIAGEN, Maryland, USA), according to manufacturer's recommendations. DNA quantity was measured using a NanoDrop 1000 spectrophotometer (Thermo Fisher Scientific Inc, Massachusetts, USA). Only DNA samples with the 260:280 ratio of were used PCR Amplicon Construction and Sequencing PCR primers that flanked the V3 hypervariable region of bacterial 16S rrnas were designed based on the blueprint for barcodes. The oligonucleotide primers included Roche A or B sequencing adapters at the 5' ends and template specific sequences at the 3' end. Barcodes were located in between the Roche A sequencing adapter and the template specific sequences of the forward primer (TCB No , 454 Life Sciences, Connecticut, U.S.). The primer sequences were: 5' (Roche A) 10-base barcode - CCTACGGGAGGCAGCAG 3' (forward) and 5' (Roche B) ATTACCGCGGCTGCTGG 3' (reverse) (Muyzer et al., 1993; Parameswaran et al., 2007). The amplification mix contained 2.5 units of FastStart High Fidelity polymerase (Roche, Mannheim, Germany), 1X FastStart High Fidelity Reaction Buffer, 0.2mM of dntps, 0.4μM of each fusion primer, and 50ng of DNA in a reaction volume of 50μl. PCR conditions were an initial denaturation at 94 C for 2 minutes: 20 cycles of 94 C 30 seconds, 60 C for 30 seconds, and 72 C for 30 seconds: and a final 7 minutes extension at 72 C. The PCR amplicon products were separated on a 1.5% agarose gels, extracted from the gels and then were cleaned using the QIAquick Gel Extraction Kit (QIAGEN, Maryland, USA). The quality of the product was assessed on a Bioanalyzer 2100 (Agilent, California, USA) using DNA1000 LabChip (Agilent Technologies, 39
51 Waldbronn, Germany). Only PCR products without primer dimers and contaminant bands were used for pyrosequencing. The PCR products from different pigs in the same time group were pooled together in equimolar ratios based on the quantification results using the NanoDrop The pooled PCR amplicons were sequenced at the Biomedical Genomic Center at the University of Minnesota (Minnesota, USA) using a Roche 454 GS-FLX sequencer (454 Life Sciences, Connecticut, USA). Sequencing of amplicons from pigs from the second farm employed titanium chemistry Data Analysis To minimize effects of random sequencing errors, we eliminated (i) sequences that did not appropriately match the PCR primer and the barcode at the beginning of a read, (ii) sequence reads with <50 bases after the proximal PCR primer if they terminated before reaching the distal primer, and (iii) sequences that contained more than one undetermined nucleotide (N). Both the proximal and distal primers were trimmed from high-quality reads before database searches and similarity calculations. In addition, LUCY, the quality score based trimming program, was used to eliminate other lowquality sequences. The LUCY end-trimming stringency of < 0.2% per-base error probability (equivalent to a phred quality score of > 27) was used (Chou and Holmes, 2001; Kunin et al., 2010). The high quality assessed sequences were aligned using the NAST alignment tool (DeSantis et al., 2006), and the aligned sequences were manually checked using the multiple sequence alignment editor and analysis tool, Jalview (Waterhouse et al., 2009). A phylogenetic assessment was conducted using RDP classifier with a bootstrap cutoff of 50%. Richness and diversity indices were generated 40
52 using Mothur (version ) with an OTU definition at a similarity cutoff of 97% (Cole et al., 2009; Schloss et al., 2009). Principal Coordinate Analysis (PCoA) plots were generated by using Weighted Fast UniFrac (Hamady et al., 2010). The heat map was generated using Mothur and TreeView (Saldanha. 2004; Schloss et al., 2009). The OTUs were obtained from Mothur, and were sorted from most to least abundance OTUs. Sequence abundance values within each OTU were normalized for comparisons of V3 OTU abundance between samples. Then the sequence abundance values were log 10 - transformed, and the heat map was made in TreeView (Saldanha. 2004). 3.3 Results The design of the studies reported here was to follow pigs being raised in conventional production units longitudinally. Ten pigs housed in the same pen in the barn were sampled at three-week intervals. Fresh fecal samples from each animal were individually collected from the pig s rectum. Two different herds were enrolled in the study. DNA sequences in each time group and farm were analyzed as pooled groups and as individual pigs DNA Sequence Data and Quality Control A total of 239,795 and 791,335 DNA sequences were generated from farm one and farm two respectively. The PCR primer barcodes allowed us to pool samples together for sequencing and subsequently to segregate the sequencing output based on time of sampling or pig number. Over 84% and 93% of the total number of sequence reads from farm 1 and farm 2, respectively, passed the quality control implemented in this study 41
53 (Table 1). The median sequence read length was 137 and 138 bases for farms 1 and 2 with no ambiguous bases with a range of bases and bases, respectively % of the total sequences from both trials were longer than 125 bases. When a homopolymer run was detected, the median length of the homopolymer was 5 bases for both trials. 42
54 Table 1. Number of DNA sequence reads before and after quality control (QC) Trial 1 2 ID 10 Weeks 13 Weeks 16 Weeks 19 Weeks 22 Weeks Total Before a QC After QC Before QC After QC Before QC After QC Before QC After QC Before QC After QC Before QC Pig1 3,820 3,717 3,516 3,320 2,735 2,677 5,661 5,550 5,031 4,979 20,763 20,243 Pig2 5,996 5,812 4,509 4,286 4,924 4,774 6,470 6,324 5,739 5,678 27,638 26,874 Pig3 4,713 4,581 4,107 3,925 4,425 4,295 5,771 5,659 3,266 3,229 22,282 21,689 Pig4 8,043 7,754 4,917 4,670 8,949 8,730 9,507 9, ,241 31,289 Pig5 3,919 3,849 3,802 3,645 4,867 4,757 6,120 6,022 4,191 4,148 22,899 22,421 Pig6 2,856 2,792 3,358 3,263 2,258 2,215 3,785 3,721 5,269 5,197 17,526 17,188 Pig7 1,962 1,891 1,449 1,364 1,818 1,777 4,046 3,994 4,559 4,512 13,834 13,538 Pig8 3,199 3,105 2,077 2,002 3,314 3,239 5,362 5,282 2,851 2,824 16,803 16,452 Pig9 4,921 4,790 2,110 2,013 3,215 3,132 5,112 5,020 2,952 2,930 18,310 17,885 Pig10 3,257 3,158 1,265 1,221 2,176 2,134 3,121 3,051 5,615 5,534 15,434 15,098 b Non 4, , , , , ,065 0 Total 47,356 41,449 46,303 29,709 41,537 37,730 60,917 53,943 43,682 39, , ,677 Pig1 7,633 7,627 17,462 17,441 15,347 15,310 8,733 8,717 16,263 16,244 65,438 65,339 Pig2 9,347 9,340 18,258 18,235 17,322 17,303 8,882 8,866 20,439 20,418 74,248 74,162 Pig3 9,221 9,212 19,375 19,332 17,659 17,615 9,705 9,694 22,054 22,019 78,014 77,872 Pig4 8,998 8,982 20,445 20,391 14,069 14,031 9,605 9,567 21,395 21,352 74,512 74,323 Pig5 9,617 9,614 17,594 17,561 17,042 17,008 9,797 9,783 22,487 22,463 76,537 76,429 Pig6 6,301 6,296 17,219 17,182 16,910 16,884 7,588 7,570 18,499 18,477 66,517 66,409 Pig7 9,412 9,403 17,978 17,950 17,137 17,117 10,388 10,364 22,077 22,030 76,992 76,864 Pig8 8,548 8,539 19,303 19,278 17,375 17,330 10,953 10,931 23,141 23,115 79,320 79,193 Pig9 8,095 8,088 20,392 20,342 13,967 13,944 10,412 10,389 23,838 23,796 76,704 76,559 Pig10 9,555 9,548 17,941 17,905 14,605 14,574 9,551 9,526 21,502 21,478 73,154 73,031 Non 4, , , , , ,899 0 Total 91,020 86, , , , , ,157 95, , , , ,181 After QC 43
55 3.3.2 Microbial Diversity Shannon-Weaver and Simpson diversity (1-D) indices were used to calculate diversity of microbial communities. The DNA sequences from all ten pigs in each group were pooled for these calculations and diversity compared over time. The average Shannon-Weaver and Simpson (1-D) index values per group were 5.74 (Standard deviation: SD=0.35) and 0.97 (SD=0.02) for farm 1, and 6.17 (SD=0.18) and 0.98 (SD=0.01) for farm 2. The range of these calculated values was for Shannon- Weaver and for Simpson (1-D) Taxon-based Analysis To describe the composition of the GI microbiome and how it changed over time, we conducted a taxon-dependent analysis using RDP classifier (Cole et al., 2009). The results shown in figure 2A describe the distribution of DNA sequences into phyla. The bacterial communities of all samples were comprised primarily of Firmicutes and Bacterioidetes, which accounted for more than 90% of the total sequences. As the pigs aged there was an increase of the proportions of Firmicutes, Spirochaetes, and unclassified phyla and a decrease in the proportion of Bacterioidetes. At the class level (Figure 2B), the proportions of Clostridia and Erysipelotrichi increased over time, and the proportiona of Bacilli and Bacteroidia decreased. The proportion of unclassified bacteria increased as pigs got older. 44


56 Figure 2. RDP classification of the sequences at phylum and class levels. A phylogenetic assessment was conducted using RDP classifier with a bootstrap cutoff of 50. Sequences after the quality control implemented in this paper were used for the RDP classification. T1 and T2 indicate trial 1 and trial 2 respectively. 45
57 At the genus level, a total of 171 genera were identified using RDP classifier. Fifteen genera contained more than 59% of the total sequences. Those 15 genera included: Prevotella, Anaerobacter, Streptococcus, Lactobacillus, Coprococcus, Sporacetigenium, Megasphaeraand, Subdoligranulum, Blautia, Oscillibacter, Faecalibacterium, Pseudobutyrivibrio, Dialister, Sarcina, and Roseburia. Among the 15 abundant genera, the detection frequency of genera Anaerobacter, Sporacetigenium, Oscillibacter, and Sarcina constantly increased as pigs aged, whereas that of genera Prevotella, Lactobacillus, Megasphaera, Faecalibacterium and Dialister decreased (Table 2). Prevotella was the most abundant genus at the beginning of the study, however, the proportion of Prevotella decreased as pigs aged. While the proportion of Anaerobacter increased as pigs grew, then it became the most abundant genus at the end of the study. At the beginning of the study, Prevotella showed the biggest proportional difference of the abundance between two trials, however Prevotella comprised similar proportion of the total sequences at the end of the study. The proportion of Streptococcus fluctuated during the experimental period, the proportion of Streptococcus increased by the weeks of 16, then decreased. 46
58 Table 2. RDP classification of the sequences at genus level Trial 1 Weeks of age Trial 2 Weeks of age Trial 1 & 2 total Genus No. % Prevotella 12,067 4,791 2,694 3,635 1,450 19,926 29,060 18,727 8,844 8, , % Anaerobacter ,248 10,439 10, ,180 12,896 46,379 98, % Streptococcus 2,341 1,406 2,597 2, ,086 15,935 19,557 8,022 12,600 69, % Lactobacillus 4,030 5,572 2,013 2,767 1,462 10,595 19,310 10,401 3,913 5,619 65, % Coprococcus 1,411 1,546 2,606 2,218 1,698 2,592 7,252 6,763 4,674 10,347 41, % Sporacetigenium ,678 3,642 3, ,532 4,355 12,183 29, % Megasphaera ,133 9,970 3,920 1, , % Subdoligranulum 1,448 1,401 1, ,904 6,589 4, ,506 20, % Blautia 1,150 1, , ,577 4,954 4,194 1,369 1,691 20, % Oscillibacter , ,491 2,671 3,196 3,067 5,629 19, % Faecalibacterium 1,434 1, ,897 5,645 3, , % Pseudobutyrivibrio ,389 5,093 3, ,065 14, % Dialister ,697 5,097 3, , % Sarcina ,643 1, ,817 12, % Roseburia , ,266 1,661 1,342 1,987 12, % Butyricicoccus ,169 1, , % Ruminococcus ,970 2, ,276 7, % Hallella ,221 1, , % Treponema ,072 5, % Clostridium ,392 5, % Butyrivibrio ,218 1, , % Turicibacter ,095 4, % Fastidiosipila ,300 4, % Erysipelothrix , % Dorea , % Lachnobacterium , % Eubacterium , % 47
59 Barnesiella , % Mitsuokella , % Desulfovibrio , % Anaerosporobacter ,377 2, % Acetanaerobacterium , % Anaerofilum , % Anaerovibrio , % TM7_genera_incertae_sedis , % Catenibacterium , % Bifidobacterium , % Parasporobacterium , % Collinsella , % Escherichia/Shigella , % Olsenella , % Catonella , % Oribacterium % Allobaculum % Papillibacter % Succinivibrio % Selenomonas % Adlercreutzia % Peptococcus % Phascolarctobacterium % Bacteroides % Hespellia % Allisonella % Tannerella % Enterorhabdus % Campylobacter % Xylanibacter % Parabacteroides % Mogibacterium % 48
60 Acidaminococcus % Ethanoligenens % Slackia % Howardella % Spirochaeta % Acetivibrio % Atopobium % Paraprevotella % Sharpea % Sporobacterium % Butyricimonas % Weissella % Lebetimonas % Eggerthella % Miscelleneous genus , % Unclassified_genus 9,251 5,497 11,162 15,401 12,097 21,604 50,940 46,067 33,221 71, , % Total 41,449 29,709 37,730 53,943 39,846 86, , ,116 95, , , % 49
61 3.3.4 Taxon Independent Analysis To address the key question of whether there was a substantial core of abundant organisms that all the groups share regardless of their age, we conducted a taxon independent analysis using OTUs as the unit of analysis. The taxon independent approach was selected because at the genus level there was a high propensity for unclassified designations. A total of 18,711 OTUs were identified in this study. Of those OTUs, 558 were defined as core OTUs because they existed in all groups from both farms and at all five time points. While core OTUs comprised only 3% of the total OTUs (558 out of OTUs), these core 558 OTUs contain majority of the sequences (> 68% of the total sequences) (Figure 3). Sequences for each core OTU were retrieved and subjected to a taxonomic analysis using RDP classifier. Most of the core OTUs belonged to the phyla Firmicutes and Bacterioidetes accounting for 79.10% and 15.58% of the total OTUs respectively. Other phyla, in which the core OTUs belonged, include: Actinobacteria (0.80%), Proteobacteria (0.69%), Spirochaetes (0.48%), Synergistetes (0.24%), Cyanobacteria (0.01%), and unclassified phyla (3.10%). 50


62 Figure 3. Heat map. The heat map was created using with an OTU definition at a similarity cutoff of 97%. Each column represents groups and each row indicates OTUs. Rows (OTUs) sorted with the largest OTUs displayed first. T1 and T2 indicate trial 1 and trial 2 respectively, and numbers indicates weeks of age. Abundant OTUs were color coded and white blanks indicates missing OTUs (No OTU was detected in the group indicated by column headings). 51
63 All of the OTUs from pigs in each time group and farm were then ordered from most prevalent to least prevalent. The ordered data was then used to create the heat map shown in figure 3. What was observed was a distinct shift in organisms represented by the heat map lines at the bottom of the figure. In particular, we observed that OTUs represented by the upper bracket labeled A in the figure were variably present, but from the third time points they appeared to be decreasing in concentration. Concurrently, OTUs represented in the lower bracket labeled B seem to appear and become more prevalent as the upper bracket OTUs decrease. Sequences from each bracket labeled A and B were retrieved, and they were subjected to RDP classification analysis. Differentially abundant genera between bracket labeled A and B were identified using Metastats (White et al., 2009). Thirteen out of a total of 129 genera detected were identified as differentially abundant genera. Among the 13 genera differentially present, the majority of OTUs comprising 66% of sequences were unclassified at genus level (Table 3). 52
64 Table 3. Genus classification of the sequences in brackets labeled A and B in the figure 3 Bracket labeled A Bracket labeled B Genus No. No. *P value % % sequences sequences Unclassified genus % % E-07 Prevotella % % Anaerobacter % % NS Oscillibacter % % 0.02 Hallella % % Roseburia % % NS Ruminococcus % % Lactobacillus % % *NS Streptococcus % % NS Coprococcus % % NS Treponema % % NS Butyricicoccus % % NS Faecalibacterium % % NS Dialister % % Subdoligranulum % % NS Sporacetigenium % % Blautia % % NS Sarcina % % NS Mitsuokella % % NS Anaerosporobacter % % NS Megasphaera % % NS Turicibacter % % NS Eubacterium % % NS Lachnobacterium % % NS Clostridium % % NS Anaerovibrio % % NS Acetanaerobacterium % % NS Fastidiosipila % % NS Oribacterium % % NS Pseudobutyrivibrio % % NS Erysipelothrix % % Barnesiella % % NS Butyrivibrio % % NS Dorea % % NS Olsenella % % Parasporobacterium % % NS Anaerofilum % % NS TM7_genera_incertae_sedis % % NS Catenibacterium % % Hydrogenoanaerobacterium % % NS Allisonella % % Parabacteroides % % NS Tannerella % % NS 53
65 Collinsella % % NS Acetivibrio % % NS Anaerotruncus % % NS Desulfovibrio % % NS Selenomonas % % NS Enterorhabdus % % NS Allobaculum % % NS Sporobacterium % % NS Butyricimonas % % NS Succinivibrio % % NS Slackia % % NS Peptococcus % % NS Xylanibacter % % NS Sutterella % % NS Subdivision5_genera_incertae _sedis % % NS Gordonibacter % % NS Anaerococcus % % NS Ethanoligenens % % NS Catonella % % NS Acidaminococcus % % Bacteroides % % Bifidobacterium % % NS Campylobacter % % NS Akkermansia % % NS Sharpea % % NS Anaerofustis % % NS Paraprevotella % % NS Escherichia/Shigella % % NS Streptophyta % % NS Asteroleplasma % % NS Fusobacterium % % NS Eggerthella % % NS Weissella % % NS Coprobacillus % % NS Howardella % % NS Papillibacter % % NS Sporobacter % % NS Shuttleworthia % % NS Hespellia % % NS Lebetimonas % % NS Pyramidobacter % % NS Parascardovia % % NS Adlercreutzia % % NS Aerococcus % % NS Enterococcus % % NS Holdemania % % NS Dethiosulfatibacter % % NS 54
66 Parvimonas % % NS Sporotomaculum % % NS Schwartzia % % NS Phascolarctobacterium % % NS Tindallia % % NS Porphyromonas % % NS Helicobacter % % NS Lawsonia % % NS Acinetobacter % % NS Haemophilus % % NS Anaerobiospirillum % % NS Cloacibacillus % % NS Anaeroplasma % % NS Fibrobacter % % NS Streptomyces % % NS Actinomyces % % NS Friedmanniella % % NS Propionibacterium % % NS Rhodococcus % % NS Corynebacterium % % NS Leuconostoc % % NS Lactococcus % % NS Facklamia % % NS Atopostipes % % NS Mogibacterium % % NS Anaerosphaera % % NS Moryella % % NS Lutispora % % NS Spirochaeta % % NS Wolinella % % NS Arcobacter % % NS Acidovorax % % NS Microvirgula % % NS Alysiella % % NS Erythrobacter % % NS Enhydrobacter % % NS Klebsiella % % NS Actinobacillus % % NS Dethiosulfovibrio % % NS Total % % *P value: Differentially abundant genus compared between brackets A and B, Significance level to threshold by 0.05 *NS: not significant 55
67 PCoA was performed to determine the relationship between OTU s in the pigs at the 5 time points. For both trials, PCoA demonstrated that the pig groups segregated by pig age and that age was the largest factor in bacterial microbiome shift (Figure 4). When we looked at pig groups rather than by individual pigs, this pattern was even more obvious (Figure 4A, and C). The validity of the group-based analysis was evaluated. PCoA plots shown in Figure 4 indicated that the pooled sample analysis was relevant to the individual sample analysis. In the weighted UniFrac analysis of the pooled samples of the trial 1, the first principal coordinate, time, explained 75.64% of sample variation, separated groups (10, 19 and 22 weeks) from others (13 and 16 weeks). The second principal coordinate (15.08% of sample variation) separated groups (10 and 13 weeks) from others (16, 19, and 22 weeks) (Figure 4A). The same results were obtained using the individual sample analysis. 10, 19 and 22 week-old pigs were separated from others by the first principal coordinate, and the second principal coordinate divided pigs into two groups (10 and 13 week-old pigs vs. 16, 19, and 22 week-old pigs) (Figure 4B). The same results were obtained after comparison of the second trial pooled sample analysis with the individual sample analysis (Figure 4C and D). 56
68 Figure 4. PCoA plots were created using weighted Fast UniFrac. PCoA plots A and C were generated by using the group DNA sequences after ten pigs in each group were individually pooled. PCoA plots B and D were created using sequences from individual pigs. A and B: PCoA plots for trial 1, C and D: PCoA plots for trial 2. 57
69 3.4 Discussion Regardless of the age of the pigs, the distal gut bacterial communities from both trials were dominated by Firmicutes and Bacterioidetes. These two phyla accounted for more than 90% of total sequences (Figures 2A and B). This result was expected because of the strict anaerobic condition in the colon and the fact that members of these phyla are heavily comprised of anaerobes. While high diversity was calculated using Shannon- Weaver and Simpson (1-D) measures, there were few phyla represented in the pig samples. These results are similar to what others have seen in human fecal samples (Suau et al., 1999; Hayashi et al., 2002; Wang et al., 2003; Eckburg et al., 2005). It is interesting to note that γ-proteobacteria are poorly represented in the pig samples. This class includes Escherichia coli, which is typically thought to be stable components of the GI microbiome. E. coli was detected 1,163 times. But relative to the most abundant microbe, Prevotella, which presented almost 11.62% of the sequences, E. coli only presented 0.12% (Table 2). Bacterial 16S rrna genes contain nine hypervariable regions that demonstrate considerable sequence diversity among different bacterial species and can be used for species identification (Van de Peer et al., 1996). Hypervariable regions are flanked by conserved stretches, enabling PCR amplification of target sequences using universal primers (Munson et al., 2004; Chakravorty et al., 2007; Wang and Qian, 2009). However, there is no consensus on a single best region, and consequently different researchers are using different regions or multiple regions for 16S rrna sequencing (Hamady and Knight, 2009). The hypervariable region 3 has been selected as one of the better target regions for 16S rrna gene analysis with high coverage rates and good classification 58
70 consistency (Dethlefsen et al., 2008; Huse et al., 2008; Claesson et al., 2009; Wang and Qian, 2009). Nucleotide sequences provide a precise analysis of the estimation of species richness based on 16S rrna gene sequences. Typically, an OTU set at a similarity cutoff of 97% is typically assigned to the same species (Schloss and Handelsman, 2005). At an OTU definition at a similarity cutoff of 97%, the analysis of human intestine associated bacterial 16S rrna sequences showed that the human microbiome consisted of approximately 15,000 36,000 bacterial species (Frank et al., 2007). This is a much higher level of diversity than previously thought where assumptions were that there were 500 to 1000 unique bacteria in the GI tract. Our group-based analysis of the sequences at the OTU definition at a similarity cutoff of 97% discovered a total of 18,711 OTUs. A small proportion of OTUs (558 core OTUs out of total 18,711 OTUs) were shared by all the groups, but the 558 core OTUs still contained the majority of the total sequences (>68%) (Figure 3). These results indicate that animals share a core set of organisms that are the most prevalent microbes. This core represents a small number of species regardless of their ages. Therefore, the major variation of bacterial populations is mainly a result of the less dominant species present in different individuals. This result matches with the recent study of non-human primate GI tract microbiome in which Ochman et al., suggested that the difference in the gut microbiota among host may occur due to rare biosphere (Ochman et al., 2010). Because sequencing and PCR may generate incorrect or low abundance sequence reads in high throughput sequencing data sets, we applied the strategy to correct for sequence artifacts by using a clustering threshold at 97% sequence identity (Gobet et al., 59
71 2010). The combined use of quality trimming to 0.2% error probability (equivalent to a phred quality score of > 27) in LUCY and a clustering threshold of 97% identity was utilized in our study to provide accurate, high sensitivity pylogenetic profiling of microbial communities (Kunin et al., 2010). However, some of the predicted OTUs may not represent real bacterial diversity because OTUs are inferred based on sequence data. OTUs are not exactly equivalent to traditional taxonomic classification, such as genus or species (Dethlefsen et al., 2008). Recent studies showed that the number of predicted OTUs can be significantly increased by using NAST and complete-linkage clustering, which are implemented in our study, compared to a single-linkage preclustering method followed by an average-linkage clustering based on pairwise alignments and to the average linkage after applying an algorithm for pyrosequencing noise removal (using PyroNoise) (Quince et al., 2009; Huse et al., 2010). The comparison of bacterial community components from the two herds and between different aged groups using PCoA showed a strong similarity between groups of pigs of the same age regardless of herd. However, changes in microbiome composition did occur between pigs in different age groups (Figure 2 and 3). We expected that the composition and temporal patterns of the microbial communities would vary widely between pigs from the two herds at younger ages because they had been exposed to different sets of microbes in the environment. However, microbial ecosystems in each pig converged toward a profile characteristic of the gastrointestinal tract of adult pigs over amount of time under the same conditions. The presence of barcodes allowed us to pool samples together before sequencing and subsequently to segregate the DNA sequence output based on barcodes 60
72 (Parameswaran et al., 2007). By pooling bar coded samples before sequencing, we were able to look at groups as well as individual pigs. This allowed us to determine whether group analysis biased our interpretations because of very large shifts in a small subpopulation of samples, and subsequently to reduce effects of variations among individual samples on a group-based analysis. The same PCoA plot patterns generated by using individual samples and pooled group samples suggested that variations among individual samples existed within the same group. However, main component that distinguished the pigs was time (Figure 4). Since time was the most important driver of composition, we conclude that group-based analysis is reasonable given that the pigs in the study were all located in one pen. Perhaps the most interesting result was found using a heat map to display the OTUs by farm and pig age. When the OTUs were sorted by the number of times it was detected and then plotted in the heat map, we found a region of the map that represented OTUs that profoundly changed with age. As indicated in Figure 3, OTUs representing the bracket labeled B appear with the simultaneous decrease of OTUs in bracket A. These microbes clearly are those that would be encountered during succession as the pigs grew. Whether they contribute to fundamental metabolic functions within the GI tract that requires this shift over time remains unknown. 61
73 Chapter 4. Microbial Shifts in the Swine Distal Gut in Response to the Treatment with Antimicrobial Growth Promoter, Tylosin 62
74 Microbial Shifts in the Swine Distal Gut in Response to the Treatment with Antimicrobial Growth Promoter, tylosin Hyeun Bum Kim a, Klaudyna Borewicz a, Bryan A. White b, Randall S. Singer a, Srinand Sreevatsan a, Zheng Jin Tu c, Richard E. Isaacson a a Department of Veterinary and Biomedical Sciences, College of Veterinary Medicine, University of Minnesota, Saint Paul, MN 55108, USA b Department of Animal Sciences, University of Illinois, Urbana, IL 61801, USA c Minnesota Supercomputing Institute, University of Minnesota, Minneapolis, MN 55455, USA In review: Hyeun Bum Kim, Klaudyna Borewicz, Bryan A. White, Randall S. Singer, Srinand Sreevatsan, Zheng Jin Tu, Richard E. Isaacson (2012) Microbial shifts in the swine distal gut in response to the treatment with antimicrobial growth promoter, tylosin. Proceedings of the National Academy of Sciences. 63
75 Antimicrobials have been used extensively as growth promoters (AGPs) in agricultural animal production. However, the specific mechanism of action for AGPs has not yet been determined. The work presented here was to determine and characterize the microbiome of pigs receiving one AGP, Tylosin, compared to untreated pigs. We hypothesized that AGPs exerted their growth promoting effect by altering gut microbial population composition. We determined the fecal microbiome of pigs receiving Tylosin compared to untreated pigs using pyrosequencing of 16S rrna gene libraries. The data showed microbial population shifts representing both microbial succession and changes in response to the use of Tylosin. Quantitative and qualitative analyses of sequences showed that Tylosin caused microbial population shifts in both abundant and less abundant species. Our results established a baseline upon which mechanisms of AGPs in regulation of health and growth of animals can be investigated. Furthermore, the data will aid in the identification of alternative strategies to improve animal health and consequently production. Keywords: Antimicrobials, growth promoters, Tylosin, microbiome, pig 64
76 4.1 Introduction In the 1940s it was observed that animals fed dried mycelia of Streptomyces aureofaciens that naturally contained chlortetracycline exhibited enhanced growth (Jones and Ricke, 2003). Since the 1950 s, antimicrobials have been used in agricultural animal production for the treatment, control, and prevention of infectious diseases, as well as for growth promotion (Dibner and Richards, 2005; Niewold. 2007). The National Swine Survey showed that forty-one percent of feeds included one or more individual antimicrobials and 19% included combinations of antimicrobials. Tylosin and Bacitracin were most often used in feeds for grower and finisher pigs (Dewey et al., 1999; McEwen and Fedorka-Cray, 2002). Because usage of antimicrobials leads to the emergence of resistance to antimicrobials (Schwarz and Chaslus-Dancla, 2001; Phillips et al., 2004), efforts to reduce their usage with the goal of preserving the efficacy of current antimicrobials are being implemented. The specific mechanisms whereby antimicrobials act as growth promoters (AGPs) are unclear. Early studies demonstrated that oral antimicrobials did not have growthpromoting effects when given to germ-free animals (Coates et al., 1963). Therefore, it is likely that growth promotion is based on changes to the gut microbiota. Several mechanisms of how growth promoters act have been postulated including the prevention of sub-clinical infections and the reduction in microbial use of nutrients (Gaskins et al., 2002; Dibner and Richards, 2005). AGPs also could act by reducing the presence of opportunistic pathogens in animals fed AGPs. Increased immune mediators such as interleukin-1 induced by gut bacteria have been shown to reduce feed conversion in animals with a conventional microflora (Roura et al., 1992), which illustrate that the 65
77 host s response to the indigenous microflora could be a factor limiting growth efficiency. Direct effects of AGPs on the gut microflora might result in decreased competition for nutrients and a reduction in microbial metabolites that depress animal growth (Gaskins et al., 2002). Certain bacteria in the gut are known to be metabolically important for the animal growth. For example, cellulolytic bacteria in ruminants digest cellulose into fermentable glucose that serves as a substrate for further microbial fermentation and for use by the animal. Cellulose would not otherwise be utilized by the host. Therefore, it is highly likely that growth promotion could be mediated by selection of specific bacterial populations that contribute to the metabolism of the animal thereby enhancing feed conversion. It is our hypothesis that AGPs cause alterations of the gut microflora, and these changes bring increased feed efficiency to animals resulting in growth promotion. A first step to understanding the process of growth promotion is to identify and describe alterations in the gut microflora of the pig. Recently there have been three reports on microbial shifts in response to the use of AGPs using culture independent assessments (Rettedal et al., 2009; Allen et al., 2011; Looft et al., 2012). Overall, these studies were small in scale and employed animals held in infectious disease isolation facilities and did not replicate conditions comparable to how commercial pigs are reared. The work presented here was designed to better understand the effects that a single growth promoter had on the microbiome of pig feces using a longitudinal study design that employed pigs in typical commercial settings. Tylosin, a member of the macrolide family of antimicrobials, was selected for this study because it is thought to be the most 66
78 commonly used AGP. The results presented here demonstrate that Tylosin produces consistent and specific alterations of the distal intestinal microflora of the pig. 4.2 Materials and Methods Animals and Sample Collection Two independent commercial farms were used in this study. The building that housed the animals was the same for both farms containing 20 pens, and each pen contained 25 pigs. Two pens were selected for each of the trials to be described. Ten pigs from the two pens were randomly selected and ear tagged for identification. Pigs in one pen received Tylosin (40 ppm (40g/ton)) in their feed, while pigs in the other pen did not. Pigs were kept in the same pen during the entire sampling period without introduction or removal of any new pigs. Pigs in both trials were raised on the same standard commercial feed that mainly consisted of corn and soybean. Fresh fecal samples were individually collected from the rectum of each of the ear tagged animals. Samples were collected five times at 3-week intervals starting when the pigs were 10-weeks old. None of the pigs in either group received any additional antimicrobials. This study was approved by the Institutional Animal Care and Use Committee (IACUC) of the University of Minnesota (Protocol Number 0705A09361) Isolation of DNA Total DNA containing the fecal microbial communities was extracted from individual fecal samples using an established method (Yu and Morrison, 2004). Briefly, 67
79 community DNA was extracted from 0.25g aliquots of each fecal sample. The DNA extraction method employed two rounds of bead-beating in the presence of NaCl and sodium dodecyl sulfate, followed by sequential isopropanol precipitations. The precipitated nucleic acids were then treated with DNase-free RNase A, and the DNA was purified using the QIAgen DNA Mini Stool Kit (QIAGEN, Maryland, USA), according to manufacturer's recommendations. DNA quantity was measured using a NanoDrop 1000 spectrophotometer (Thermo Fisher Scientific Inc, Massachusetts, USA) PCR Amplicon Production and Sequencing PCR primers that flanked the V3 hypervariable region of bacterial 16S rrna genes were designed. The oligonucleotide primers included Roche A or B sequencing adapters at the 5' ends and template specific sequences at the 3' end. Barcodes were included between the Roche A sequencing adapter and the template specific sequences of the forward primer (TCB No , 454 Life Sciences, Connecticut, USA). The primer sequences were: 5' (Roche A) 10-base barcode - CCTACGGGAGGCAGCAG 3' (forward) and 5' (Roche B) ATTACCGCGGCTGCTGG 3' (reverse) (Muyzer et al., 1993; Parameswaran et al., 2007; Kim et al., 2011). The amplification mix contained 2.5 units of FastStart High Fidelity polymerase (Roche, Mannheim, Germany), 1X FastStart High Fidelity Reaction Buffer, 0.2mM of dntps, 0.4µM of each fusion primer, and 50ng of DNA in a reaction volume of 50µl. PCR conditions employed an initial denaturation step at 94 C for 2 minutes, followed by 20 cycles at 94 C for 30 seconds, 60 C for 30 seconds, and 72 C for 30 seconds. A final 7 minute extension step was at 72 C. The PCR amplicon products were separated by electrophoresis through a 1.5% agarose gels, 68
80 extracted from the gels, and cleaned using the QIAquick Gel Extraction Kit (QIAGEN, Maryland, USA). The quality of the product was assessed on a Bioanalyzer 2100 (Agilent, California, USA) using DNA1000 LabChip (Agilent Technologies, Waldbronn, Germany). Only PCR products without primer dimers and contaminant bands were used for pyrosequencing. The PCR products from different pigs in the same time group were pooled together in equimolar ratios based on the quantification results using the NanoDrop The pooled PCR amplicons were sequenced at the Biomedical Genomic Center at the University of Minnesota (Minnesota, USA) using a Roche 454 GS-FLX sequencer (454 Life Sciences, Connecticut, USA). Sequencing employed GS-FLX chemistry for farm 1 and titanium chemistry for farm Data Analysis To minimize effects of random sequencing errors, we eliminated (1) sequences that did not appropriately match the PCR primer and the barcode at the beginning of a read, (2) sequence reads with <50 bases after the proximal PCR primer if they terminated before reaching the distal primer, and (3) sequences that contained more than one undetermined nucleotide (N). Both the proximal and distal primers were trimmed from high-quality reads before database searches and similarity calculations were performed. In addition, LUCY, the quality score based trimming program, was used to eliminate other low-quality sequences. The LUCY end-trimming stringency of < 0.2% per-base error probability (equivalent to a phred quality score of > 27) was used (Chou and Holmes, 2001; Kunin et al., 2010). UCHIME as implemented in Mothur was used to identify chimeras (Schloss et al., 2009; Edgar et al., 2011). Phylogenetic assessments 69
81 were performed using RDP classifier with a bootstrap cutoff of 50%(Cole et al., 2009). Metastats (White et al., 2009)was used to detect differentially abundant genera in samples after each sequence read was assigned to a taxon by RDP classifier. Significance level of 0.05 was used. The high quality sequences were aligned using the NAST alignment tool (DeSantis et al., 2006; Schloss et al., 2009). Richness and diversity indices were generated using Mothur (version ) with an operational taxonomic unit (OTU) definition at an identity cutoff of 95% after having implemented a pseudo-single linkage algorithm to remove sequences that were likely due to pyrosequencing errors (Schloss and Handelsman, 2005; Schloss et al., 2009; Huse et al., 2010). Heat maps were generated using Mothur (version ) and Java TreeView (Saldanha. 2004; Schloss et al., 2009). OTUs obtained from Mothur were sorted from most to least abundance OTUs. Sequence abundance values within each OTU were normalized for comparisons of V3 OTU abundance between samples. Then the sequence abundance values were log 10 - transformed, and the heat map made using Java TreeView (Saldanha. 2004). 4.3 Results DNA Sequence Data and Quality Control The studies described were designed to detect changes in the fecal microbiome of pigs being raised in conventional production units over time. The study design employed 2 groups of pigs (10 pigs per group). One group received tylosin in their feed during the entire experimental period while the second group did not receive tylosin. The protocol was performed using two independent farms. DNA sequences in each group and farm were analyzed as pooled groups based on our previous results that demonstrated strong 70
82 similarities between the fecal microbiomes of pigs within the same pen (Kim et al., 2011). However, because samples from each pig had a bar code identifier, we were able to quantify the number of sequence reads per animal. A total of 504,204 and 1,543,479 DNA sequence reads were generated from farm 1 and farm 2 respectively. Over 86% and 94% of the total number of sequence reads from farm 1 and farm 2 passed the quality control implemented in this study resulting in 435,225 and 1,445,371 sequences for farm 1 and farm 2. The total number of sequence reads from farm 2 was 3.3 times larger than that of farm 1 because of the improved sequencing chemistry employed with samples from farm 2 (GS-FLX chemistry for farm 1 and titanium chemistry for farm 2). The average number of sequence reads generated per pig was 4,352 for farm 1, and 14,454 for farm 2. The median sequence read length for each group was bases with no ambiguous bases. The range of sequence reads was bases and when a homopolymer run was detected, the median length of the homopolymer was 5 bases (Table 4) Microbial Diversity The diversity of microbial communities using pooled sequence reads from all ten pigs in each group was measured using Shannon-Weaver and Simpson (1-D) diversity indices (Schloss et al., 2009). The diversity indices used represent how many different taxa are present in a sample, and higher numbers indicate higher diversity. The average Shannon-Weaver and Simpson (1-D) index values showed highly diverse microbial communities with mean values per group of 4.87 and 0.96 for farm 1, and 5.28 and 0.97 for farm 2. The range of these calculated values over the five sampling times (3 week 71
83 intervals starting at 10 weeks of age and ending 22 weeks of age) was for Shannon-Weaver and for Simpson (1-D). Both diversity indices were greater in younger animals than older animals (Table 5). 72
84 Table 4. Summary of sequence reads after quality control No of bases Farm 1 Tylosin Farm 1 No-Tylosin Farm 2 Tylosin Farm 2 No-Tylosin N * No of No of No of Polymer N Polymer N Polymer N Polymer bases bases bases Minimum %-tile %-tile Median %-tile %-tile Maximum No.of sequences 232, , , ,181 * N: Number of ambiguous bases in sequence reads Polymer: length of homopolymer runs in sequence reads 73
85 Table 5. Microbial diversity of each group of pigs. Pooled sequence reads from all ten pigs in each group were used in diversity calculations. Farm 1 2 Group Tylosin No- Tylosin Tylosin No- Tylosin Weeks of age No. of Sequence Reads No. of Observed OTUs Shannon Simpson (1-D) 10 45,576 1, ,302 1, ,450 1, ,870 1, ,350 1, ,449 1, ,709 1, ,730 1, ,943 1, ,846 1, ,949 2, ,804 3, ,165 3, ,283 2, ,989 3, ,649 1, ,617 3, ,116 3, ,407 2, ,392 4,
86 4.3.3 Microbial Shifts in Response to the Use of Tylosin as an AGP: Taxon-based Analysis A taxon-dependent analysis using the Ribosomal Database Project (RDP) classifier was conducted to describe the composition of the fecal microbiome between animals receiving Tylosin and those that did not receive Tylosin and how it changed over time (Cole et al., 2009). The results of phylum and class distributions are shown in Fig. 1. Two phyla, Firmicutes and Bacteroidetes, were the most dominant in the fecal samples regardless of age of pigs or treatment group, and comprised more than 92% of the total sequences. The proportion of sequences that could not be assigned to a phylum using RDP classifier ranged from %. Bacteria in the phylum Spirochaetes increased over time ranging from %. The other phyla represented less than 1% of the total at all time points. The proportion of bacteria in the phyla Firmicutes, Spirochaetes, and unclassified phyla increased as the pigs aged, while the proportion of bacteria in the phyla Bacteroidetes, Actinobacteria, and Proteobacteria decreased. These changes were consistently observed in both farms. When the relative abundance of bacteria at the phylum level was compared between tylosin and no-tylosin groups of the same age, there were no significant differences (Fig. 5A and 5B). Bacteria in the classes Clostridia, Erysipelotrichi, Bacilli, Bacteroidia, Spirochaetes, and unclassified classes made up 95.58% of the total bacteria at all times. Bacteria in other classes represented less than 1% at most time points. Two classes, Clostridia and Bacilli represented the most common classes within the phylum Firmicutes. The proportion of Clostridia increased as pigs got older while the proportion of Bacilli decreased. The increase in the proportion of Clostridia was greater than the 75
87 decrease in the proportion of Bacilli resulting in an overall increase in the population of Firmicutes over time. The class Bacteroidia was the major class in the phylum Bacteroidetes, and the proportion of Bacteroidia decreased over time (Fig. 5C and 5D). 76
88 Fig. 5. RDP classification of the sequences at phylum and class levels. RDP classifier was employed with a bootstrap cutoff of 50. Pooled sequence reads from all ten pigs in each group were used. (A) RDP classification of the sequence reads from farm 1 at phylum level. (B) RDP classification of the sequence reads from farm 2 at phylum level. (C) RDP classification of the sequence reads from farm1 at class level. (D) RDP classification of the sequence reads from farm 2 at class level. 77
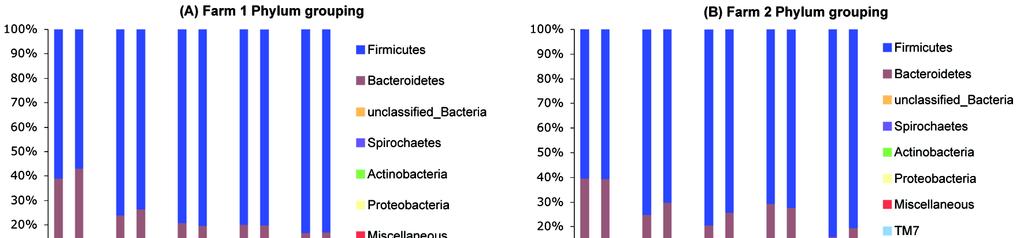

89 78
90 A total of 158 and 187 genera were identified from farm 1 and farm 2, respectively. Of the total number of genera identified in both farms, sixteen abundant genera were detected. The abundant genera were defined as having more than 1% of the total DNA sequences. The sixteen most abundant genera were: Anaerobacter, Prevotella, Streptococcus, Lactobacillus, Coprococcus, Sporacetigenium, Megasphaera and, Blautia, Oscillibacter, Subdoligranulum, Faecalibacterium, Dialister, Pseudobutyrivibrio, Roseburia, Sarcina, Butyricicoccus. These sixteen genera plus the unclassified-genera accounted for 90.3% and 90.5% of the total sequences from farms 1 and 2, respectively. One genus, Prevotella, was a member of phylum Bacteroidetes; the other fifteen genera belonged to the phylum Firmicutes. Among the sixteen abundant genera, the detection frequencies of the genera Anaerobacter, Streptococcus, Sporacetigenium, Oscillibacter, Roseburia and Sarcina showed increases over time, whereas those in the genera Prevotella, Lactobacillus, Coprococcus, Megasphaera, Blautia, Subdoligranulum, Faecalibacterium, Dialister, Pseudobutyrivibrio, and Butyricicoccus decreased (Table 6, 7 and 8). To compare how the composition of the fecal bacteria differed between treatment groups, Metastats was used to identify differentially abundant genera. While there were no differences between treatment groups at the phylum level, a total of twelve differentially abundant genera were identified from both farms at the genus level (Fig. 6A and 6B). These included six abundant (>1% of the total sequences) and six less abundant genera. The six abundant genera consisted of Prevotella, Lactobacillus, Sporacetigenium, Megasphaera, Blautia, and Sarcina, and the less abundant genera consisted of Barnesiella, Mitsuokella, Acetanaerobacterium, Anaerosporobacter, Succinivibrio, and 79
91 Eggerthella. Eight of the twelve differentially abundant genera belonged to the phyla Firmicutes and two of twelve belonged to Bacteroidetes. Each of the other two genera were in the phyla Proteobacteria, and Actinobacteria. Lactobacillus, Sporacetigenium, Acetanaerobacterium, and Eggerthella were detected more frequently in the Tylosin group than in No-Tylosin group. The others were present more frequently in the No- Tylosin group than the Tylosin group. Unclassified bacteria at the genus level also were differentially represented in pigs from both farms and were observed more in the No- Tylosin group. The same pattern of population distribution of the differentially abundant genera was observed from both farms at 22 weeks. The population distribution patterns of differentially abundant genera at 22 weeks began to emerge from 16 weeks and continuing through 19 weeks of age (Fig. 6A and 6B). 80
92 Table 6. Sixteen abundant genera in each farm Farm Phylum Genus Tylosin 10 Weeks 13 Weeks 16 Weeks 19 Weeks 22 Weeks No- Tylosin Tylosin No- Tylosin Tylosin No- Tylosin Tylosin No- Tylosin Tylosin No- Tylosin unclassified_bacteria 17.19% 22.32% 27.52% 18.50% 30.84% 29.58% 27.74% 28.55% 28.59% 30.36% Firmicutes Anaerobacter 0.62% 1.11% 3.21% 3.16% 10.90% 11.26% 15.53% 19.35% 23.87% 26.63% Bacteroidetes Prevotella 30.18% 29.11% 14.20% 16.13% 8.51% 7.14% 8.11% 6.74% 3.38% 3.64% Firmicutes Streptococcus 5.85% 5.65% 5.02% 4.73% 4.91% 6.88% 9.29% 5.15% 5.05% 2.45% Firmicutes Lactobacillus 17.73% 9.72% 13.26% 18.76% 8.36% 5.34% 7.67% 5.13% 4.44% 3.67% Firmicutes Coprococcus 3.45% 3.40% 4.61% 5.20% 5.87% 6.91% 5.04% 4.11% 4.04% 4.26% Firmicutes Sporacetigenium 0.41% 0.81% 1.00% 1.06% 4.03% 4.45% 5.72% 6.75% 10.55% 8.45% Firmicutes Megasphaera 1.35% 0.75% 1.54% 2.04% 1.25% 2.07% 0.48% 0.72% 0.01% 0.12% Firmicutes Blautia 3.96% 2.77% 4.09% 5.19% 2.26% 2.52% 1.95% 2.28% 0.84% 0.97% 1 Firmicutes Oscillibacter 0.85% 1.06% 1.07% 1.10% 1.90% 1.82% 1.76% 2.22% 2.28% 2.07% Firmicutes Subdoligranulum 2.35% 3.49% 3.63% 4.72% 2.12% 3.12% 0.94% 1.23% 0.59% 0.62% Firmicutes Faecalibacterium 3.46% 3.46% 2.75% 3.40% 1.55% 1.79% 0.79% 0.67% 0.18% 0.16% Firmicutes Dialister 1.07% 1.53% 2.45% 1.66% 0.49% 1.08% 0.21% 0.27% 0.05% 0.09% Firmicutes Pseudobutyrivibrio 1.83% 1.86% 2.59% 1.48% 1.66% 1.32% 0.69% 0.47% 0.55% 0.36% Firmicutes Roseburia 0.48% 0.58% 2.17% 0.66% 2.38% 2.58% 1.66% 2.05% 1.46% 1.70% Firmicutes Sarcina 0.05% 0.21% 0.07% 0.28% 1.22% 1.07% 2.43% 3.05% 2.58% 3.57% Firmicutes Butyricicoccus 2.06% 1.60% 2.82% 2.38% 1.32% 1.26% 0.68% 0.66% 0.56% 0.43% Miscellaneous genera 7.09% 10.55% 7.99% 9.54% 10.44% 9.82% 9.31% 10.60% 10.99% 10.45% Total % % % % % % % % % % 81
93 unclassified_bacteria 27.41% 24.93% 24.58% 27.44% 25.55% 28.59% 33.89% 34.82% 27.96% 33.84% Firmicutes Anaerobacter 0.09% 0.13% 0.77% 0.40% 9.03% 6.94% 13.38% 13.52% 28.49% 21.94% Bacteroidetes Prevotella 24.92% 23.00% 12.55% 15.66% 8.12% 11.62% 10.28% 9.27% 3.03% 3.96% Firmicutes Streptococcus 3.11% 3.56% 13.48% 8.58% 16.89% 12.14% 6.92% 8.41% 5.17% 5.96% Firmicutes Lactobacillus 8.55% 12.23% 12.52% 10.40% 10.14% 6.46% 5.53% 4.10% 4.28% 2.66% Firmicutes Coprococcus 4.96% 2.99% 3.57% 3.91% 4.18% 4.20% 4.66% 4.90% 4.72% 4.89% Firmicutes Sporacetigenium 0.03% 0.05% 0.25% 0.19% 2.21% 2.19% 4.35% 4.56% 8.59% 5.76% Firmicutes Megasphaera 5.50% 5.92% 4.44% 5.37% 1.94% 2.43% 1.01% 1.15% 0.17% 0.20% Firmicutes Blautia 2.09% 2.97% 2.92% 2.67% 2.65% 2.60% 1.21% 1.43% 0.72% 0.80% 2 Firmicutes Oscillibacter 1.76% 1.72% 1.40% 1.44% 1.46% 1.98% 3.10% 3.21% 1.81% 2.66% Firmicutes Subdoligranulum 1.64% 2.20% 2.64% 3.55% 2.11% 2.71% 0.85% 0.97% 0.42% 0.71% Firmicutes Faecalibacterium 2.37% 2.19% 2.70% 3.04% 1.84% 2.37% 1.19% 0.70% 0.34% 0.30% Firmicutes Dialister 2.58% 3.11% 4.25% 2.75% 1.98% 1.99% 0.96% 0.72% 0.29% 0.30% Firmicutes Pseudobutyrivibrio 2.59% 2.76% 2.43% 2.74% 1.09% 2.02% 0.55% 0.66% 0.33% 0.50% Firmicutes Roseburia 0.96% 0.86% 1.02% 1.76% 0.97% 1.03% 1.28% 1.41% 1.41% 0.94% Firmicutes Sarcina 0.00% 0.01% 0.02% 0.01% 0.23% 0.10% 0.86% 1.02% 2.49% 3.70% Firmicutes Butyricicoccus 1.44% 0.93% 1.14% 1.17% 0.95% 1.11% 0.48% 0.21% 0.28% 0.28% Miscellaneous genera 9.99% 10.44% 9.29% 8.92% 8.66% 9.52% 9.51% 8.93% 9.52% 10.60% Total % % % % % % % % % % 82
94 Table 7. Miscellaneous genera of the farm 1 Phylum Genus Tylosin 10 Weeks 13 Weeks 16 Weeks 19 Weeks 22 Weeks No- Tylosin Tylosin 83 No- Tylosin Tylosin No- Tylosin Tylosin No- Tylosin Tylosin No- Tylosin Firmicutes Ruminococcus 0.915% 0.552% 0.893% 0.835% 1.043% 0.877% 0.956% 0.840% 0.803% 0.703% Spirochaetes Treponema 0.079% 0.224% 0.107% 0.027% 0.488% 0.636% 1.080% 1.372% 1.728% 1.820% Firmicutes Lachnobacterium 0.187% 0.468% 0.521% 0.202% 1.052% 0.790% 0.648% 0.525% 0.690% 0.376% Firmicutes Dorea 0.608% 0.815% 0.906% 1.353% 0.334% 0.326% 0.229% 0.224% 0.164% 0.183% Firmicutes Clostridium 0.042% 0.080% 0.152% 0.125% 0.236% 0.241% 0.386% 1.033% 1.564% 1.154% Bacteroidetes Hallella 0.336% 0.762% 0.587% 0.555% 0.606% 0.679% 0.349% 0.337% 0.194% 0.143% Bacteroidetes Barnesiella 0.182% 0.432% 0.212% 0.350% 0.835% 0.501% 0.679% 0.577% 0.332% 0.412% Firmicutes Eubacterium 0.441% 0.651% 0.551% 0.737% 0.398% 0.440% 0.320% 0.419% 0.231% 0.281% Firmicutes Turicibacter 0.061% 0.174% 0.083% 0.064% 0.301% 0.519% 0.418% 0.704% 1.003% 1.087% Firmicutes Butyrivibrio 0.287% 0.637% 0.490% 0.902% 0.347% 0.612% 0.303% 0.343% 0.082% 0.075% Firmicutes Erysipelothrix 0.217% 0.338% 0.364% 0.481% 0.623% 0.522% 0.361% 0.349% 0.201% 0.279% Firmicutes Fastidiosipila 0.145% 0.181% 0.174% 0.131% 0.332% 0.337% 0.341% 0.471% 0.317% 0.376% Firmicutes Catenibacterium 0.654% 0.992% 0.264% 0.390% 0.149% 0.069% 0.039% 0.015% 0.041% 0.050% Proteobacteria Escherichia/Shigella 0.946% 1.440% 0.044% 0.010% 0.166% 0.003% 0.004% 0.004% 0.002% 0.008% Actinobacteria Collinsella 0.255% 0.256% 0.416% 0.629% 0.147% 0.201% 0.108% 0.152% 0.043% 0.053% Firmicutes Acetanaerobacterium 0.083% 0.116% 0.163% 0.242% 0.301% 0.331% 0.320% 0.256% 0.255% 0.171% Firmicutes Mitsuokella 0.268% 0.328% 0.146% 0.178% 0.276% 0.265% 0.156% 0.195% 0.032% 0.083% Firmicutes Anaerofilum 0.053% 0.169% 0.163% 0.141% 0.315% 0.281% 0.210% 0.241% 0.183% 0.171% Firmicutes Parasporobacterium 0.044% 0.012% 0.152% 0.034% 0.275% 0.111% 0.293% 0.215% 0.518% 0.228% Firmicutes Peptococcus 0.101% 0.046% 0.102% 0.121% 0.242% 0.204% 0.222% 0.213% 0.298% 0.321% Firmicutes Anaerosporobacter 0.026% 0.014% 0.050% 0.003% 0.092% 0.138% 0.197% 0.289% 0.425% 0.514% Actinobacteria Olsenella 0.112% 0.140% 0.168% 0.942% 0.057% 0.106% 0.033% 0.028% 0.006% 0.030%
95 Actinobacteria Bifidobacterium 0.042% 0.318% 0.171% 0.333% 0.149% 0.117% 0.093% 0.078% 0.121% 0.100% Firmicutes Anaerovibrio 0.009% 0.024% 0.036% 0.010% 0.168% 0.114% 0.172% 0.109% 0.149% 0.171% Firmicutes Papillibacter 0.061% 0.007% 0.011% 0.000% 0.082% 0.016% 0.172% 0.191% 0.151% 0.221% Firmicutes Allobaculum 0.066% 0.065% 0.088% 0.054% 0.160% 0.143% 0.066% 0.057% 0.039% 0.048% TM7 TM7_genera_ incertae _sedis 0.020% 0.053% 0.041% 0.003% 0.105% 0.151% 0.085% 0.133% 0.045% 0.105% Firmicutes Catonella 0.018% 0.070% 0.072% 0.067% 0.109% 0.159% 0.067% 0.059% 0.076% 0.043% Proteobacteria Desulfovibrio 0.129% 0.087% 0.072% 0.007% 0.050% 0.013% 0.056% 0.043% 0.097% 0.093% Firmicutes Oribacterium 0.015% 0.005% 0.008% 0.017% 0.040% 0.029% 0.060% 0.104% 0.164% 0.163% Actinobacteria Enterorhabdus 0.024% 0.010% 0.028% 0.017% 0.069% 0.056% 0.058% 0.069% 0.078% 0.053% Actinobacteria Adlercreutzia 0.018% 0.012% 0.008% 0.000% 0.053% 0.003% 0.071% 0.067% 0.108% 0.108% Firmicutes Hespellia 0.039% 0.031% 0.036% 0.007% 0.059% 0.045% 0.037% 0.054% 0.065% 0.063% Firmicutes Phascolarcto bacterium 0.020% 0.019% 0.017% 0.010% 0.069% 0.042% 0.079% 0.050% 0.058% 0.050% Proteobacteria Succinivibrio 0.018% 0.043% 0.044% 0.007% 0.021% 0.042% 0.093% 0.072% 0.017% 0.053% Actinobacteria Atopobium 0.050% 0.152% 0.014% 0.020% 0.004% 0.027% 0.012% 0.006% 0.009% 0.010% Bacteroidetes Tannerella 0.013% 0.055% 0.030% 0.003% 0.019% 0.013% 0.033% 0.069% 0.030% 0.033% Firmicutes Sharpea 0.077% 0.111% 0.011% 0.027% 0.011% 0.011% 0.004% 0.009% 0.006% 0.005% Bacteroidetes Xylanibacter 0.033% 0.043% 0.008% 0.017% 0.042% 0.024% 0.031% 0.030% 0.013% 0.013% Actinobacteria Slackia 0.020% 0.014% 0.014% 0.007% 0.027% 0.034% 0.017% 0.037% 0.030% 0.053% Firmicutes Mogibacterium 0.009% 0.017% 0.014% 0.040% 0.036% 0.042% 0.008% 0.022% 0.015% 0.035% Firmicutes Howardella 0.022% 0.068% 0.036% 0.044% 0.017% 0.013% 0.013% 0.009% 0.004% 0.005% Proteobacteria Campylobacter 0.009% 0.019% 0.033% 0.003% 0.051% 0.034% 0.019% 0.022% 0.019% 0.020% Spirochaetes Spirochaeta 0.018% 0.055% 0.019% 0.003% 0.015% 0.019% 0.040% 0.015% 0.011% 0.023% Actinobacteria Gordonibacter 0.000% 0.002% 0.019% 0.010% 0.027% 0.034% 0.012% 0.033% 0.043% 0.033% Firmicutes Weissella 0.022% 0.034% 0.017% 0.017% 0.023% 0.024% 0.004% 0.017% 0.037% 0.018% Bacteroidetes Parabacteroides 0.013% 0.012% 0.017% 0.034% 0.013% 0.008% 0.023% 0.019% 0.041% 0.030% Proteobacteria Lebetimonas 0.002% 0.010% 0.025% 0.003% 0.025% 0.053% 0.023% 0.032% 0.013% 0.013% 84
96 Bacteroidetes Bacteroides 0.009% 0.000% 0.014% 0.027% 0.004% 0.005% 0.017% 0.020% 0.035% 0.053% Bacteroidetes Paraprevotella 0.009% 0.012% 0.022% 0.024% 0.015% 0.008% 0.023% 0.013% 0.037% 0.020% Firmicutes Selenomonas 0.026% 0.014% 0.011% 0.007% 0.008% 0.061% 0.000% 0.050% 0.000% 0.003% Bacteroidetes Butyricimonas 0.013% 0.005% 0.014% 0.020% 0.021% 0.027% 0.015% 0.015% 0.019% 0.023% Firmicutes Acetivibrio 0.004% 0.007% 0.003% 0.010% 0.023% 0.016% 0.023% 0.032% 0.017% 0.030% Firmicutes Allisonella 0.024% 0.022% 0.019% 0.037% 0.013% 0.021% 0.006% 0.020% 0.000% 0.000% Firmicutes Acidaminococcus 0.039% 0.046% 0.036% 0.030% 0.008% 0.003% 0.000% 0.000% 0.000% 0.000% Firmicutes Ethanoligenens 0.002% 0.002% 0.022% 0.003% 0.025% 0.016% 0.029% 0.019% 0.022% 0.010% Actinobacteria Eggerthella 0.007% 0.014% 0.006% 0.003% 0.010% 0.008% 0.015% 0.017% 0.041% 0.015% Cyanobacteria Streptophyta 0.000% 0.010% 0.000% 0.013% 0.011% 0.024% 0.013% 0.022% 0.017% 0.015% Firmicutes Syntrophococcus 0.020% 0.027% 0.058% 0.013% 0.004% 0.003% 0.000% 0.002% 0.000% 0.000% Proteobacteria Helicobacter 0.018% 0.019% 0.025% 0.010% 0.008% 0.000% 0.004% 0.009% 0.002% 0.010% Firmicutes Alkaliphilus 0.000% 0.000% 0.003% 0.003% 0.015% 0.019% 0.004% 0.006% 0.024% 0.028% Proteobacteria Sutterella 0.009% 0.010% 0.006% 0.017% 0.013% 0.005% 0.010% 0.007% 0.019% 0.003% Firmicutes Anaerotruncus 0.007% 0.005% 0.008% 0.007% 0.010% 0.008% 0.013% 0.009% 0.009% 0.013% Firmicutes Schwartzia 0.000% 0.007% 0.006% 0.000% 0.034% 0.016% 0.012% 0.006% 0.000% 0.008% Firmicutes Sporobacterium 0.013% 0.007% 0.017% 0.007% 0.010% 0.003% 0.004% 0.013% 0.004% 0.008% Firmicutes Hydrogenoanaerobacterium 0.002% 0.000% 0.008% 0.003% 0.004% 0.005% 0.015% 0.009% 0.019% 0.008% Fibrobacteres Fibrobacter 0.002% 0.005% 0.000% 0.013% 0.011% 0.000% 0.012% 0.004% 0.022% 0.003% Tenericutes Anaeroplasma 0.002% 0.022% 0.000% 0.000% 0.011% 0.005% 0.006% 0.006% 0.013% 0.003% Bacteroidetes Porphyromonas 0.002% 0.000% 0.014% 0.000% 0.013% 0.000% 0.017% 0.007% 0.006% 0.005% Verrucomicrobia Subdivision5_genera _incertae_sedis 0.000% 0.000% 0.000% 0.000% 0.017% 0.027% 0.002% 0.009% 0.002% 0.008% Firmicutes Coprobacillus 0.002% 0.005% 0.003% 0.000% 0.019% 0.003% 0.008% 0.007% 0.009% 0.008% Firmicutes Shuttleworthia 0.004% 0.002% 0.036% 0.003% 0.004% 0.000% 0.002% 0.002% 0.000% 0.003% Firmicutes Parvimonas 0.002% 0.000% 0.000% 0.013% 0.000% 0.003% 0.006% 0.006% 0.009% 0.018% Synergistetes Pyramidobacter 0.011% 0.007% 0.008% 0.000% 0.000% 0.008% 0.006% 0.006% 0.000% 0.003% 85
97 Firmicutes Marvinbryantia 0.000% 0.012% 0.000% 0.010% 0.004% 0.005% 0.006% 0.004% 0.004% 0.003% Deferribacteres Mucispirillum 0.002% 0.029% 0.003% 0.000% 0.004% 0.005% 0.000% 0.000% 0.004% 0.000% Firmicutes Lactococcus 0.007% 0.012% 0.000% 0.007% 0.002% 0.003% 0.002% 0.009% 0.002% 0.003% Firmicutes Anaerococcus 0.004% 0.002% 0.006% 0.000% 0.002% 0.000% 0.002% 0.004% 0.017% 0.008% Firmicutes Sporobacter 0.000% 0.005% 0.000% 0.000% 0.006% 0.000% 0.008% 0.013% 0.004% 0.008% Proteobacteria Acinetobacter 0.004% 0.007% 0.000% 0.007% 0.004% 0.003% 0.006% 0.000% 0.009% 0.000% Proteobacteria Geopsychrobacter 0.002% 0.002% 0.008% 0.003% 0.004% 0.000% 0.004% 0.004% 0.000% 0.005% Tenericutes Asteroleplasma 0.009% 0.005% 0.003% 0.000% 0.000% 0.008% 0.000% 0.002% 0.002% 0.003% Firmicutes Finegoldia 0.000% 0.000% 0.000% 0.000% 0.000% 0.000% 0.004% 0.004% 0.009% 0.013% Proteobacteria Lawsonia 0.009% 0.000% 0.000% 0.010% 0.000% 0.000% 0.000% 0.006% 0.000% 0.000% Firmicutes Salsuginibacillus 0.000% 0.000% 0.000% 0.000% 0.010% 0.005% 0.006% 0.000% 0.002% 0.000% Firmicutes Proteocatella 0.000% 0.000% 0.000% 0.000% 0.002% 0.003% 0.002% 0.004% 0.011% 0.000% Actinobacteria Corynebacterium 0.000% 0.010% 0.003% 0.000% 0.000% 0.000% 0.000% 0.000% 0.000% 0.008% Firmicutes Pseudoramibacter 0.004% 0.002% 0.008% 0.000% 0.000% 0.000% 0.000% 0.000% 0.000% 0.000% Firmicutes Veillonella 0.000% 0.002% 0.000% 0.000% 0.008% 0.003% 0.000% 0.000% 0.002% 0.000% Bacteroidetes Alistipes 0.002% 0.002% 0.000% 0.003% 0.000% 0.000% 0.000% 0.000% 0.004% 0.003% Firmicutes Moryella 0.000% 0.000% 0.008% 0.000% 0.004% 0.003% 0.000% 0.000% 0.000% 0.000% Firmicutes Lactonifactor 0.000% 0.002% 0.006% 0.000% 0.006% 0.000% 0.000% 0.000% 0.000% 0.000% Firmicutes Anaerovorax 0.000% 0.000% 0.000% 0.000% 0.000% 0.003% 0.000% 0.000% 0.011% 0.000% Tenericutes Mycoplasma 0.000% 0.007% 0.000% 0.000% 0.000% 0.003% 0.000% 0.000% 0.002% 0.000% Chlamydiae Chlamydia 0.002% 0.010% 0.000% 0.000% 0.000% 0.000% 0.000% 0.000% 0.000% 0.000% Proteobacteria Anaerobiospirillum 0.000% 0.000% 0.000% 0.007% 0.000% 0.000% 0.002% 0.002% 0.000% 0.000% Firmicutes Anaerofustis 0.000% 0.000% 0.000% 0.000% 0.006% 0.000% 0.000% 0.000% 0.002% 0.003% Firmicutes Aerococcus 0.000% 0.000% 0.000% 0.000% 0.000% 0.000% 0.000% 0.007% 0.002% 0.000% Firmicutes Tindallia 0.000% 0.000% 0.000% 0.000% 0.000% 0.003% 0.000% 0.002% 0.002% 0.003% Firmicutes Enterococcus 0.000% 0.007% 0.000% 0.000% 0.000% 0.000% 0.000% 0.002% 0.000% 0.000% Firmicutes Soehngenia 0.000% 0.000% 0.000% 0.000% 0.000% 0.008% 0.000% 0.000% 0.000% 0.000% 86
98 Proteobacteria Roseateles 0.000% 0.005% 0.003% 0.000% 0.000% 0.000% 0.000% 0.000% 0.000% 0.000% Synergistetes Dethiosulfovibrio 0.000% 0.000% 0.000% 0.000% 0.000% 0.005% 0.000% 0.000% 0.002% 0.000% Firmicutes Peptoniphilus 0.000% 0.000% 0.003% 0.000% 0.000% 0.000% 0.000% 0.000% 0.002% 0.003% Actinobacteria Parascardovia 0.000% 0.000% 0.003% 0.000% 0.000% 0.003% 0.002% 0.000% 0.000% 0.000% Acidobacteria Gp % 0.000% 0.000% 0.000% 0.000% 0.000% 0.000% 0.002% 0.002% 0.003% Firmicutes Solobacterium 0.000% 0.000% 0.003% 0.003% 0.000% 0.000% 0.000% 0.000% 0.000% 0.000% Verrucomicrobia Akkermansia 0.000% 0.000% 0.000% 0.000% 0.000% 0.000% 0.000% 0.000% 0.000% 0.005% Synergistetes Aminobacterium 0.002% 0.000% 0.003% 0.000% 0.000% 0.000% 0.000% 0.000% 0.000% 0.000% Synergistetes Jonquetella 0.000% 0.000% 0.003% 0.000% 0.000% 0.000% 0.002% 0.000% 0.000% 0.000% Firmicutes Anaerobranca 0.000% 0.000% 0.000% 0.000% 0.000% 0.000% 0.000% 0.000% 0.002% 0.003% Firmicutes Centipeda 0.000% 0.000% 0.000% 0.000% 0.002% 0.003% 0.000% 0.000% 0.000% 0.000% Synergistetes Cloacibacillus 0.000% 0.000% 0.000% 0.000% 0.000% 0.000% 0.000% 0.000% 0.004% 0.000% Firmicutes Dethiosulfatibacter 0.000% 0.000% 0.000% 0.000% 0.002% 0.000% 0.000% 0.000% 0.002% 0.000% Proteobacteria Arcobacter 0.000% 0.000% 0.000% 0.000% 0.000% 0.000% 0.004% 0.000% 0.000% 0.000% Firmicutes Leuconostoc 0.000% 0.000% 0.000% 0.000% 0.004% 0.000% 0.000% 0.000% 0.000% 0.000% Actinobacteria Actinomyces 0.000% 0.000% 0.000% 0.000% 0.000% 0.000% 0.000% 0.004% 0.000% 0.000% Firmicutes Pelospora 0.000% 0.000% 0.000% 0.000% 0.000% 0.000% 0.000% 0.004% 0.000% 0.000% Firmicutes Lactovum 0.000% 0.000% 0.000% 0.003% 0.000% 0.000% 0.000% 0.000% 0.000% 0.000% Firmicutes Sedimentibacter 0.000% 0.000% 0.000% 0.000% 0.000% 0.003% 0.000% 0.000% 0.000% 0.000% Fusobacteria Fusobacterium 0.000% 0.000% 0.000% 0.000% 0.000% 0.003% 0.000% 0.000% 0.000% 0.000% Tenericutes Acholeplasma 0.000% 0.000% 0.000% 0.000% 0.000% 0.000% 0.000% 0.000% 0.000% 0.003% Bacteroidetes Paludibacter 0.000% 0.000% 0.000% 0.000% 0.000% 0.000% 0.000% 0.000% 0.000% 0.003% Bacteroidetes Fluviicola 0.000% 0.000% 0.000% 0.000% 0.000% 0.000% 0.000% 0.000% 0.000% 0.003% Actinobacteria Rhodococcus 0.000% 0.000% 0.000% 0.000% 0.000% 0.000% 0.000% 0.000% 0.000% 0.003% Proteobacteria Microvirgula 0.000% 0.000% 0.000% 0.000% 0.000% 0.000% 0.000% 0.000% 0.000% 0.003% Proteobacteria Cronobacter 0.000% 0.002% 0.000% 0.000% 0.000% 0.000% 0.000% 0.000% 0.000% 0.000% Proteobacteria Kluyvera 0.000% 0.002% 0.000% 0.000% 0.000% 0.000% 0.000% 0.000% 0.000% 0.000% 87
99 Bacteroidetes Chryseobacterium 0.000% 0.002% 0.000% 0.000% 0.000% 0.000% 0.000% 0.000% 0.000% 0.000% Proteobacteria Devosia 0.000% 0.002% 0.000% 0.000% 0.000% 0.000% 0.000% 0.000% 0.000% 0.000% Proteobacteria Klebsiella 0.000% 0.002% 0.000% 0.000% 0.000% 0.000% 0.000% 0.000% 0.000% 0.000% Proteobacteria Haemophilus 0.002% 0.000% 0.000% 0.000% 0.000% 0.000% 0.000% 0.000% 0.000% 0.000% Actinobacteria Gardnerella 0.002% 0.000% 0.000% 0.000% 0.000% 0.000% 0.000% 0.000% 0.000% 0.000% Actinobacteria Mobiluncus 0.000% 0.000% 0.000% 0.000% 0.000% 0.000% 0.000% 0.000% 0.002% 0.000% Firmicutes Sporotomaculum 0.000% 0.000% 0.000% 0.000% 0.000% 0.000% 0.000% 0.000% 0.002% 0.000% Bacteroidetes Olivibacter 0.000% 0.000% 0.000% 0.000% 0.000% 0.000% 0.000% 0.000% 0.002% 0.000% Firmicutes Sediminibacillus 0.000% 0.000% 0.000% 0.000% 0.000% 0.000% 0.002% 0.000% 0.000% 0.000% Proteobacteria Enhydrobacter 0.000% 0.000% 0.000% 0.000% 0.000% 0.000% 0.002% 0.000% 0.000% 0.000% Firmicutes Peptostreptococcus 0.000% 0.000% 0.000% 0.000% 0.000% 0.000% 0.000% 0.002% 0.000% 0.000% Actinobacteria Propionibacterium 0.000% 0.000% 0.000% 0.000% 0.000% 0.000% 0.000% 0.002% 0.000% 0.000% Proteobacteria Acidovorax 0.000% 0.000% 0.000% 0.000% 0.000% 0.000% 0.000% 0.002% 0.000% 0.000% Total 7.09% 10.55% 7.99% 9.54% 10.44% 9.82% 9.31% 10.60% 10.99% 10.45% 88
100 Table 8. Miscellaneous genera of the farm 2 10 Weeks 13 Weeks 16 Weeks 19 Weeks 22 Weeks No- No- No- No- No- Phylum Genus Tylosin Tylosin Tylosin Tylosin Tylosin Tylosin Tylosin Tylosin Tylosin Tylosin Firmicutes Ruminococcus % % % % % % % % % % Bacteroidetes Hallella % % % % % % % % % % Spirochaetes Treponema % % % % % % % % % % Firmicutes Clostridium % % % % % % % % % % Firmicutes Dorea % % % % % % % % % % Firmicutes Turicibacter % % % % % % % % % % Firmicutes Butyrivibrio % % % % % % % % % % Firmicutes Erysipelothrix % % % % % % % % % % Firmicutes Fastidiosipila % % % % % % % % % % Firmicutes Eubacterium % % % % % % % % % % Firmicutes Lachnobacterium % % % % % % % % % % Bacteroidetes Barnesiella % % % % % % % % % % Firmicutes Mitsuokella % % % % % % % % % % Firmicutes Acetanaerobacterium % % % % % % % % % % Firmicutes Anaerosporobacter % % % % % % % % % % Proteobacteria Desulfovibrio % % % % % % % % % % Firmicutes Anaerofilum % % % % % % % % % % Firmicutes Catenibacterium % % % % % % % % % % TM7 TM7_genera_incertae_sedis % % % % % % % % % % Firmicutes Parasporobacterium % % % % % % % % % % Actinobacteria Bifidobacterium % % % % % % % % % % Actinobacteria Collinsella % % % % % % % % % % Firmicutes Anaerovibrio % % % % % % % % % % 89
101 Actinobacteria Olsenella % % % % % % % % % % Proteobacteria Escherichia/Shigella % % % % % % % % % % Firmicutes Selenomonas % % % % % % % % % % Firmicutes Catonella % % % % % % % % % % Firmicutes Allobaculum % % % % % % % % % % Firmicutes Oribacterium % % % % % % % % % % Firmicutes Peptococcus % % % % % % % % % % Firmicutes Papillibacter % % % % % % % % % % Proteobacteria Succinivibrio % % % % % % % % % % Bacteroidetes Tannerella % % % % % % % % % % Firmicutes Phascolarctobacterium % % % % % % % % % % Actinobacteria Adlercreutzia % % % % % % % % % % Firmicutes Acidaminococcus % % % % % % % % % % Firmicutes Hespellia % % % % % % % % % % Bacteroidetes Bacteroides % % % % % % % % % % Actinobacteria Enterorhabdus % % % % % % % % % % Firmicutes Allisonella % % % % % % % % % % Bacteroidetes Parabacteroides % % % % % % % % % % Bacteroidetes Xylanibacter % % % % % % % % % % Proteobacteria Campylobacter % % % % % % % % % % Firmicutes Mogibacterium % % % % % % % % % % Actinobacteria Slackia % % % % % % % % % % Firmicutes Howardella % % % % % % % % % % Bacteroidetes Paraprevotella % % % % % % % % % % Firmicutes Ethanoligenens % % % % % % % % % % Spirochaetes Spirochaeta % % % % % % % % % % Firmicutes Acetivibrio % % % % % % % % % % 90
102 Firmicutes Sporobacterium % % % % % % % % % % Firmicutes Weissella % % % % % % % % % % Actinobacteria Atopobium % % % % % % % % % % Bacteroidetes Butyricimonas % % % % % % % % % % Actinobacteria Eggerthella % % % % % % % % % % Proteobacteria Lebetimonas % % % % % % % % % % Firmicutes Sharpea % % % % % % % % % % Verrucomicrobia Akkermansia % % % % % % % % % % Bacteroidetes Porphyromonas % % % % % % % % % % Firmicutes Hydrogenoanaero bacterium % % % % % % % % % % Tenericutes Anaeroplasma % % % % % % % % % % Firmicutes Coprobacillus % % % % % % % % % % Synergistetes Pyramidobacter % % % % % % % % % % Firmicutes Anaerotruncus % % % % % % % % % % Firmicutes Schwartzia % % % % % % % % % % Proteobacteria Sutterella % % % % % % % % % % Firmicutes Finegoldia % % % % % % % % % % Proteobacteria Helicobacter % % % % % % % % % % Cyanobacteria Streptophyta % % % % % % % % % % Proteobacteria Geopsychrobacter % % % % % % % % % % Firmicutes Anaerococcus % % % % % % % % % % Firmicutes Parvimonas % % % % % % % % % % Firmicutes Alkaliphilus % % % % % % % % % % Proteobacteria Lawsonia % % % % % % % % % % Actinobacteria Gordonibacter % % % % % % % % % % Firmicutes Marvinbryantia % % % % % % % % % % Firmicutes Syntrophococcus % % % % % % % % % % 91
103 Firmicutes Sporobacter % % % % % % % % % % Verrucomicrobia Subdivision5_genera _incertae_sedis % % % % % % % % % % Fibrobacteres Fibrobacter % % % % % % % % % % Deferribacteres Mucispirillum % % % % % % % % % % Firmicutes Lactococcus % % % % % % % % % % Firmicutes Enterococcus % % % % % % % % % % Proteobacteria Anaerobiospirillum % % % % % % % % % % Firmicutes Aerococcus % % % % % % % % % % Bacteroidetes Alistipes % % % % % % % % % % Proteobacteria Acinetobacter % % % % % % % % % % Firmicutes Shuttleworthia % % % % % % % % % % Firmicutes Sedimentibacter % % % % % % % % % % Synergistetes Dethiosulfovibrio % % % % % % % % % % Firmicutes Peptoniphilus % % % % % % % % % % Tenericutes Asteroleplasma % % % % % % % % % % Firmicutes Lactonifactor % % % % % % % % % % Actinobacteria Mobiluncus % % % % % % % % % % Firmicutes Proteocatella % % % % % % % % % % Firmicutes Anaerofustis % % % % % % % % % % Firmicutes Anaerovorax % % % % % % % % % % Firmicutes Veillonella % % % % % % % % % % Firmicutes Salsuginibacillus % % % % % % % % % % Actinobacteria Corynebacterium % % % % % % % % % % Synergistetes Cloacibacillus % % % % % % % % % % Spirochaetes Brachyspira % % % % % % % % % % Proteobacteria Actinobacillus % % % % % % % % % % Acidobacteria Gp % % % % % % % % % % 92
104 Firmicutes Anaerobranca % % % % % % % % % % Firmicutes Moryella % % % % % % % % % % Proteobacteria Roseateles % % % % % % % % % % Firmicutes Pseudoramibacter % % % % % % % % % % Firmicutes Solobacterium % % % % % % % % % % Firmicutes Dethiosulfatibacter % % % % % % % % % % Proteobacteria Cronobacter % % % % % % % % % % Firmicutes Tindallia % % % % % % % % % % Actinobacteria Actinomyces % % % % % % % % % % Tenericutes Mycoplasma % % % % % % % % % % Proteobacteria Arcobacter % % % % % % % % % % Proteobacteria Moraxella % % % % % % % % % % Fusobacteria Fusobacterium % % % % % % % % % % Firmicutes Leuconostoc % % % % % % % % % % Firmicutes Peptostreptococcus % % % % % % % % % % Proteobacteria Kluyvera % % % % % % % % % % Synergistetes Jonquetella % % % % % % % % % % Tenericutes Acholeplasma % % % % % % % % % % Chlamydiae Chlamydia % % % % % % % % % % Actinobacteria Parascardovia % % % % % % % % % % Firmicutes Staphylococcus % % % % % % % % % % Firmicutes Sediminibacillus % % % % % % % % % % Firmicutes Tepidibacter % % % % % % % % % % Bacteroidetes Paludibacter % % % % % % % % % % Bacteroidetes Chryseobacterium % % % % % % % % % % Proteobacteria Wolinella % % % % % % % % % % Proteobacteria Haemophilus % % % % % % % % % % 93
105 Actinobacteria Propionibacterium % % % % % % % % % % Firmicutes Alloiococcus % % % % % % % % % % Firmicutes Pelospora % % % % % % % % % % Firmicutes Soehngenia % % % % % % % % % % Firmicutes Sporotomaculum % % % % % % % % % % Firmicutes Centipeda % % % % % % % % % % Firmicutes Lutispora % % % % % % % % % % Bacteroidetes Fluviicola % % % % % % % % % % Proteobacteria Ochrobactrum % % % % % % % % % % Proteobacteria Enterobacter % % % % % % % % % % Synergistetes Aminobacterium % % % % % % % % % % Actinobacteria Streptomyces % % % % % % % % % % Firmicutes Lactovum % % % % % % % % % % Firmicutes Facklamia % % % % % % % % % % Firmicutes Holdemania % % % % % % % % % % Firmicutes Desulfotomaculum % % % % % % % % % % Firmicutes Gracilibacter % % % % % % % % % % Proteobacteria Paucimonas % % % % % % % % % % Proteobacteria Devosia % % % % % % % % % % Proteobacteria Enhydrobacter % % % % % % % % % % Proteobacteria Klebsiella % % % % % % % % % % Proteobacteria Citrobacter % % % % % % % % % % Proteobacteria Pasteurella % % % % % % % % % % Verrucomicrobia Verrucomicrobium % % % % % % % % % % Actinobacteria Saccharopolyspora % % % % % % % % % % Actinobacteria Friedmanniella % % % % % % % % % % Actinobacteria Rhodococcus % % % % % % % % % % 94
106 Actinobacteria Gardnerella % % % % % % % % % % Firmicutes Atopostipes % % % % % % % % % % Firmicutes Pilibacter % % % % % % % % % % Firmicutes Nosocomiicoccus % % % % % % % % % % Firmicutes Tissierella % % % % % % % % % % Firmicutes Anaerosphaera % % % % % % % % % % Firmicutes Pelotomaculum % % % % % % % % % % Firmicutes Anaerostipes % % % % % % % % % % Firmicutes Alkalibacter % % % % % % % % % % Bacteroidetes Reichenbachiella % % % % % % % % % % Bacteroidetes Olivibacter % % % % % % % % % % Bacteroidetes Flavobacterium % % % % % % % % % % Total 9.99% 10.44% 9.29% 8.92% 8.66% 9.52% 9.51% 8.93% 9.52% 10.60% 95


 Differentially abundant genera were indicated by arrows and color-coded.")
107 Figure 6. Differentially abundant genera between Tylosin and No-Tylosin groups. The heat map was created using genus based results after normalization. Yellow indicates abundant genera and black indicates less abundant genera. Each column represents groups and each row indicates genus. F1 and F2 indicate farm 1 and farm 2 respectively, and T and NT represent each Tylosin group and No-Tylosin group.. (A) Differentially abundant genera were indicated by arrows and color-coded. Genus names indicate by the color their relationship to the phylum level. (B) Twelve differentially abundant genera and unclassified genera. 96
108 4.3.4 Microbial Shifts in Response to the use of Tylosin as an AGP: OTU-based Analysis While most sequences were classified at the phylum and class levels, a high proportion of sequences could not be classified at the genus level. Therefore, A taxon independent analysis using OTUs as the unit of analysis was conducted for the in depth ecological analysis of the bacterial communities. We defined an OTU as having 95% sequence identity. Compared to a total of 158 and 187 genera identified in farm 1 and farm 2, a total of 5,499 and 12,637 OTUs were identified in farm 1 and farm 2, respectively. Of those OTUs, 421 and 870 OTUs on farm 1 and farm 2, respectively, were defined as core OTUs because they existed in all groups at all five time points in each farm. While core OTUs comprised only 7.68 and 6.88% of the total OTUs in farms 1 and 2, these core OTUs contained the majority of the sequences, 82.4 and 85.4% of the total sequences from farms 1 and 2. These results indicate that animals share a core set of bacteria that are the most prevalent microbes. This core represents a small number of species regardless of their ages. Therefore, the major variation of bacterial populations is mainly a result of the less dominant species present in different individuals. Representative sequences for each core OTU were retrieved and subjected to a taxonomic analysis using RDP classifier. As would be expected, most of the core OTUs belonged to the phyla Firmicutes and Bacterioidetes accounting for 86.22% and 87.01% of the total core OTUs in farms 1 and 2, respectively. Venn diagrams were generated to compare OTUs between groups at the same time points (Fig. 7). An average of and 68.60% of the total OTUs were shared between groups at the same age, and an average of and 98.47% of the total 97
109 sequence reads belonged to the shared OTUs in farm 1 and farm 2, respectively. Unique OTUs, which accounted for an average of and 31.40% of the total OTUs at the same age, contained just 2.11 and 1.53% of the total sequence reads in farm 1 and farm 2 (Fig. 7). While shared OTUs were comprised of both abundant and less abundant OTUs, unique OTUs to each group were mainly less abundant OTUs (Fig. 7). Sequence reads belonging to unique OTUs at different time points were subjected to analysis using RDP classifier. RDP classifier is a web based program that assigns 16S rrna sequences to phylogenetically consistent bacterial taxonomy. Unclassified bacteria at the genus level were the most abundant at and 63.89% of the total unique sequence reads to each group in farms 1 and farm 2. Among the OTUs classified at the genus level, Prevotella was the most abundant genus accounting for 7.67 and 9.04% of the total unique sequence reads in farms 1 and 2 (Table 9). To visualize the distribution of the different OTUs in the two treatment groups a heat map was prepared (Fig. 8A). The OTUs were ordered by abundance with the most abundant sequences being at the top of the heat map. Abundant OTUs were red colorcoded and white blanks indicated missing OTUs. Two regions of the heat map, labeled A and B contained close to 40% of the total OTU sequences. These regions were highlighted because of the apparent differences in their distributions between the pigs in the two treatment groups. The fecal microbiomes of pigs that were ten weeks of age had nearly identical heat map patterns regardless of treatment group. This would be expected since pigs only began to receive Tylosin at this time. However, by 16 weeks and continuing through 19 weeks of age, there was an obvious shift in microbial content in the feces in pigs treated with Tylosin with the depletion of OTUs in bracket B and an 98
110 increase in the OTUs in bracket A. When pigs reached 22 weeks of age, a similar shift was found in pigs that did not receive Tylosin (Fig. 8A). When the same process was used to analyze pigs from farm 2, a more complicated pattern emerged (Fig. 8B). We did detect differences in the compositions of the fecal microbiomes between the two treatment groups, but since the depth of sequence coverage was much greater for farm two and thus the ordering of the sequence abundance was different for farm two, the two farms could not be directly compared using heat maps for visualization. Dendrograms were prepared by using the Bray-Curtis index to compare the similarity of the bacterial communities between groups. While microbial population shifts in both abundant and less abundant genera in pig intestines were detected, the samples clustered based on sampling time point (Fig. 9). 99
111 Table 9. RDP classification of unique sequences to each group in farm 1 and 2 Farm Phylum Genus Tylosin 10 Weeks 13 Weeks 16 Weeks 19 Weeks 22 Weeks Notylosin Tylosin Notylosin % unclassified_bacteria % % % % % % % % % % % 7.713% 4.590% 2.790% 6.128% 6.742% 2.395% 4.082% 7.666% Bacteroidetes Prevotella % % 1 Spirochaetes Treponema 0.883% 2.013% 1.494% 0.000% 1.311% 5.580% 1.532% 5.337% 5.190% 1.413% 2.507% % 0.106% 0.000% 0.000% 1.175% 0.279% 0.094% 0.000% 1.413% 1.767% Actinobacteria Olsenella % 1 Firmicutes Ruminococcus 1.545% 0.106% 2.460% 1.894% 0.984% 0.441% 1.393% 0.936% 1.297% 1.099% 1.237% 1 Firmicutes Anaerobacter 0.552% 0.212% 0.000% 2.165% 0.984% 0.587% 0.975% 1.966% 2.096% 3.140% 1.193% 1 Bacteroidetes Hallella 0.221% 2.542% 0.088% 0.677% 1.148% 0.441% 2.368% 1.404% 1.297% 0.628% 1.083% 1 Firmicutes Lactobacillus 1.987% 1.165% 0.967% 1.218% 1.066% 0.881% 2.089% 0.281% 0.798% 0.314% 1.060% 1 Firmicutes Oscillibacter 0.662% 0.318% 0.703% 0.135% 1.148% 0.881% 1.393% 1.311% 2.295% 0.471% 0.972% 1 Firmicutes Faecalibacterium 2.759% 0.742% 0.527% 1.624% 0.902% 1.175% 0.836% 0.281% 0.000% 0.314% 0.884% 1 Firmicutes Butyricicoccus 0.883% 0.636% 0.351% 0.812% 1.311% 0.587% 1.532% 0.936% 1.497% 0.000% 0.884% 1 Firmicutes Streptococcus 0.883% 0.847% 0.615% 1.218% 0.328% 0.734% 0.836% 0.843% 0.898% 0.314% 0.740% 1 Firmicutes Megasphaera 1.325% 0.212% 0.527% 1.894% 0.738% 1.615% 0.418% 0.187% 0.000% 0.471% 0.685% 1 Firmicutes Coprococcus 1.214% 0.424% 0.791% 0.812% 0.820% 1.175% 0.279% 0.375% 0.499% 0.157% 0.663% 1 Firmicutes Blautia 1.104% 0.424% 0.176% 1.083% 1.475% 0.587% 0.836% 0.562% 0.100% 0.000% 0.652% 1 Firmicutes Dialister 0.883% 1.801% 0.439% 1.488% 0.082% 0.441% 0.139% 0.281% 0.000% 0.314% 0.563% 1 Firmicutes Subdoligranulum 0.110% 0.530% 0.351% 1.488% 0.410% 1.175% 0.279% 0.749% 0.100% 0.471% 0.530% 1 Firmicutes Roseburia 0.110% 0.106% 0.088% 0.541% 0.820% 0.587% 0.975% 0.187% 1.098% 0.314% 0.475% 1 Firmicutes Catenibacterium 0.442% 0.636% 0.088% 1.624% 0.492% 0.147% 0.836% 0.000% 0.200% 0.157% 0.431% 1 Bacteroidetes Barnesiella 0.442% 0.212% 0.088% 0.541% 0.574% 0.000% 0.557% 0.094% 0.798% 0.785% 0.398% 1 Firmicutes Anaerovibrio 0.110% 0.742% 0.615% 0.000% 0.410% 0.147% 0.975% 0.094% 0.299% 0.314% 0.376% 100 Tylosin Notylosin Tylosin Notylosin Tylosin Notylosin Average
112 1 TM7 TM7_genera_ 0.000% 0.000% 1.318% 0.135% 0.082% 0.000% 0.139% 0.000% 0.100% 2.355% 0.376% incertae_sedis 1 Firmicutes Butyrivibrio 0.110% 0.318% 0.967% 0.135% 0.082% 0.734% 0.557% 0.375% 0.000% 0.471% 0.365% 1 Firmicutes Sarcina 0.110% 0.212% 0.000% 0.135% 0.082% 0.587% 0.696% 1.217% 0.499% 0.157% 0.365% 1 Firmicutes Clostridium 0.000% 0.106% 0.176% 0.406% 0.000% 0.294% 0.139% 1.404% 0.399% 0.628% 0.353% 1 Firmicutes Selenomonas 0.000% 0.000% 0.000% 0.000% 0.000% 0.587% 0.000% 2.341% 0.000% 0.157% 0.331% 1 Firmicutes Mitsuokella 0.110% 0.212% 0.351% 1.083% 0.574% 0.294% 0.139% 0.281% 0.100% 0.000% 0.320% 1 Firmicutes Acetanaerobacterium 0.331% 0.530% 0.088% 0.406% 0.164% 0.000% 0.557% 0.187% 0.499% 0.314% 0.298% 1 Firmicutes Lachnobacterium 0.110% 0.742% 0.264% 0.135% 0.492% 0.147% 0.557% 0.000% 0.200% 0.157% 0.287% 1 Firmicutes Turicibacter 0.000% 0.212% 0.176% 0.271% 0.000% 0.441% 0.696% 0.281% 0.599% 0.314% 0.276% 1 Firmicutes Erysipelothrix 0.221% 0.318% 0.088% 0.677% 0.410% 0.294% 0.279% 0.187% 0.200% 0.157% 0.276% 1 Firmicutes Parasporobacterium 1.214% 0.000% 0.000% 0.000% 0.164% 0.147% 0.000% 0.000% 0.898% 0.000% 0.254% 1 Firmicutes Sporacetigenium 0.110% 0.106% 0.000% 0.135% 0.164% 0.000% 0.279% 0.468% 0.499% 0.942% 0.254% 1 Firmicutes Eubacterium 0.221% 0.212% 0.264% 0.271% 0.164% 1.028% 0.000% 0.281% 0.100% 0.157% 0.254% 1 Firmicutes Anaerofilum 0.000% 0.106% 0.176% 0.135% 0.410% 0.294% 0.279% 0.187% 0.399% 0.157% 0.221% 1 Firmicutes Anaerotruncus 0.000% 0.212% 0.176% 0.135% 0.328% 0.000% 0.836% 0.094% 0.200% 0.314% 0.221% 1 Proteobacteria Campylobacter 0.000% 0.000% 0.879% 0.000% 0.738% 0.000% 0.000% 0.094% 0.000% 0.000% 0.221% 1 Proteobacteria Sutterella 0.221% 0.318% 0.000% 0.000% 0.410% 0.000% 0.279% 0.000% 0.699% 0.000% 0.210% 1 Deferribacteres Mucispirillum 0.000% 1.165% 0.088% 0.000% 0.164% 0.294% 0.000% 0.000% 0.200% 0.000% 0.199% 1 Bacteroidetes Bacteroides 0.442% 0.000% 0.264% 0.000% 0.082% 0.294% 0.000% 0.375% 0.200% 0.314% 0.199% 1 Firmicutes Sharpea 1.325% 0.212% 0.176% 0.135% 0.000% 0.000% 0.000% 0.000% 0.000% 0.000% 0.188% 1 Firmicutes Fastidiosipila 0.110% 0.106% 0.264% 0.271% 0.082% 0.147% 0.139% 0.468% 0.100% 0.157% 0.188% 1 Firmicutes Pseudobutyrivibrio 0.552% 0.212% 0.088% 0.135% 0.328% 0.000% 0.418% 0.094% 0.000% 0.000% 0.188% 1 Firmicutes Dorea 0.110% 0.424% 0.000% 0.406% 0.410% 0.147% 0.139% 0.000% 0.100% 0.000% 0.177% 1 Bacteroidetes Parabacteroides 0.221% 0.106% 0.088% 0.000% 0.492% 0.000% 0.139% 0.000% 0.499% 0.000% 0.177% 1 Proteobacteria Succinivibrio 0.110% 0.000% 0.176% 0.000% 0.164% 0.000% 0.139% 0.000% 0.000% 1.570% 0.177% 1 Fibrobacteres Fibrobacter 0.000% 0.106% 0.000% 0.541% 0.492% 0.000% 0.139% 0.000% 0.399% 0.000% 0.177% 1 Bacteroidetes Tannerella 0.000% 0.106% 0.439% 0.000% 0.410% 0.147% 0.000% 0.000% 0.000% 0.471% 0.166% 101
113 1 Firmicutes Coprobacillus 0.000% 0.106% 0.088% 0.000% 0.492% 0.000% 0.139% 0.000% 0.200% 0.471% 0.155% 1 Firmicutes Peptococcus 0.000% 0.000% 0.088% 0.000% 0.246% 0.000% 0.836% 0.000% 0.200% 0.314% 0.155% 1 Firmicutes Acetivibrio 0.221% 0.106% 0.088% 0.135% 0.164% 0.147% 0.000% 0.375% 0.100% 0.157% 0.155% 1 Proteobacteria Enterobacteriales 0.000% 0.953% 0.000% 0.000% 0.082% 0.294% 0.000% 0.094% 0.000% 0.000% 0.144% 1 Actinobacteria Collinsella 0.110% 0.106% 0.000% 0.812% 0.000% 0.587% 0.000% 0.000% 0.000% 0.000% 0.133% 1 Proteobacteria Acinetobacter 0.000% 0.106% 0.000% 0.271% 0.164% 0.147% 0.418% 0.000% 0.299% 0.000% 0.133% 1 Tenericutes Anaeroplasma 0.000% 0.106% 0.000% 0.000% 0.328% 0.147% 0.000% 0.187% 0.399% 0.000% 0.133% 1 Firmicutes Lactococcus 0.110% 0.424% 0.000% 0.271% 0.000% 0.000% 0.000% 0.375% 0.000% 0.000% 0.122% 1 Bacteroidetes Butyricimonas 0.552% 0.000% 0.000% 0.135% 0.000% 0.147% 0.000% 0.000% 0.100% 0.471% 0.122% 1 Cyanobacteria Streptophyta 0.000% 0.424% 0.000% 0.541% 0.000% 0.441% 0.000% 0.000% 0.000% 0.000% 0.122% 1 Firmicutes Anaerosporobacter 0.000% 0.000% 0.000% 0.000% 0.000% 0.000% 0.139% 0.468% 0.200% 0.314% 0.110% 1 Firmicutes Shuttleworthia 0.221% 0.000% 0.351% 0.135% 0.000% 0.147% 0.139% 0.000% 0.100% 0.000% 0.110% 1 Hydrogenoanaero 0.000% 0.000% 0.088% 0.000% 0.000% 0.147% 0.696% 0.094% 0.100% 0.000% 0.099% Firmicutes bacterium 1 Actinobacteria Corynebacterium 0.000% 0.424% 0.088% 0.000% 0.000% 0.000% 0.000% 0.000% 0.000% 0.471% 0.088% 1 Actinobacteria Bifidobacterium 0.110% 0.000% 0.088% 0.135% 0.082% 0.000% 0.000% 0.094% 0.299% 0.000% 0.088% 1 Firmicutes Oribacterium 0.000% 0.000% 0.000% 0.000% 0.082% 0.000% 0.000% 0.562% 0.100% 0.000% 0.088% 1 Firmicutes Allisonella 0.110% 0.000% 0.088% 0.271% 0.164% 0.147% 0.000% 0.094% 0.000% 0.000% 0.088% 1 Bacteroidetes Paraprevotella 0.000% 0.000% 0.088% 0.000% 0.410% 0.000% 0.279% 0.000% 0.000% 0.000% 0.088% 1 Firmicutes Allobaculum 0.110% 0.212% 0.000% 0.000% 0.000% 0.000% 0.139% 0.187% 0.000% 0.157% 0.077% 1 Firmicutes Anaerovorax 0.000% 0.000% 0.000% 0.000% 0.082% 0.000% 0.000% 0.000% 0.499% 0.157% 0.077% 1 Firmicutes Anaerococcus 0.110% 0.000% 0.176% 0.000% 0.082% 0.000% 0.139% 0.187% 0.000% 0.000% 0.077% 1 Firmicutes Lactonifactor 0.000% 0.106% 0.176% 0.000% 0.246% 0.000% 0.000% 0.000% 0.100% 0.000% 0.077% 1 Firmicutes Acidaminococcus 0.110% 0.106% 0.000% 0.000% 0.328% 0.147% 0.000% 0.000% 0.000% 0.000% 0.077% 1 Firmicutes Veillonella 0.000% 0.106% 0.000% 0.000% 0.328% 0.147% 0.000% 0.000% 0.100% 0.000% 0.077% 1 Proteobacteria Escherichia/Shigella 0.000% 0.636% 0.000% 0.000% 0.082% 0.000% 0.000% 0.000% 0.000% 0.000% 0.077% 1 Tenericutes Asteroleplasma 0.000% 0.106% 0.000% 0.000% 0.000% 0.441% 0.000% 0.094% 0.100% 0.157% 0.077% 1 Proteobacteria Helicobacter 0.000% 0.000% 0.000% 0.000% 0.328% 0.000% 0.000% 0.000% 0.000% 0.314% 0.066% 102
114 1 Actinobacteria Enterorhabdus 0.000% 0.000% 0.000% 0.000% 0.082% 0.147% 0.139% 0.094% 0.100% 0.000% 0.055% 1 Firmicutes Aerococcus 0.000% 0.000% 0.000% 0.000% 0.000% 0.000% 0.000% 0.375% 0.100% 0.000% 0.055% 1 Firmicutes Sporobacter 0.000% 0.212% 0.000% 0.000% 0.000% 0.000% 0.000% 0.000% 0.100% 0.314% 0.055% 1 Bacteroidetes Xylanibacter 0.110% 0.212% 0.000% 0.000% 0.164% 0.000% 0.000% 0.000% 0.000% 0.000% 0.055% 1 Bacteroidetes Porphyromonas 0.331% 0.000% 0.176% 0.000% 0.000% 0.000% 0.000% 0.000% 0.000% 0.000% 0.055% 1 Proteobacteria Lawsonia 0.442% 0.000% 0.000% 0.135% 0.000% 0.000% 0.000% 0.000% 0.000% 0.000% 0.055% 1 Synergistetes Pyramidobacter 0.000% 0.106% 0.264% 0.000% 0.000% 0.147% 0.000% 0.000% 0.000% 0.000% 0.055% 1 Verrucomicrobia Subdivision5 _genera_incertae 0.000% 0.000% 0.000% 0.000% 0.246% 0.294% 0.000% 0.000% 0.000% 0.000% 0.055% _sedis 1 Tenericutes Mycoplasma 0.000% 0.318% 0.000% 0.000% 0.000% 0.147% 0.000% 0.000% 0.100% 0.000% 0.055% 1 Firmicutes Enterococcus 0.000% 0.318% 0.000% 0.000% 0.000% 0.000% 0.000% 0.094% 0.000% 0.000% 0.044% 1 Firmicutes Mogibacterium 0.000% 0.000% 0.000% 0.000% 0.000% 0.000% 0.000% 0.000% 0.399% 0.000% 0.044% 1 Firmicutes Parvimonas 0.000% 0.000% 0.000% 0.541% 0.000% 0.000% 0.000% 0.000% 0.000% 0.000% 0.044% 1 Firmicutes Anaerofustis 0.000% 0.000% 0.000% 0.000% 0.164% 0.000% 0.000% 0.000% 0.100% 0.157% 0.044% 1 Proteobacteria Desulfovibrio 0.000% 0.212% 0.088% 0.000% 0.000% 0.000% 0.000% 0.000% 0.100% 0.000% 0.044% 1 Actinobacteria Gordonibacter 0.000% 0.212% 0.000% 0.000% 0.000% 0.000% 0.000% 0.000% 0.000% 0.157% 0.033% 1 Firmicutes Soehngenia 0.000% 0.000% 0.000% 0.000% 0.000% 0.441% 0.000% 0.000% 0.000% 0.000% 0.033% 1 Firmicutes Finegoldia 0.000% 0.000% 0.000% 0.000% 0.000% 0.147% 0.000% 0.094% 0.000% 0.157% 0.033% 1 Firmicutes Peptoniphilus 0.000% 0.000% 0.088% 0.000% 0.000% 0.000% 0.000% 0.000% 0.100% 0.157% 0.033% 1 Firmicutes Catonella 0.000% 0.000% 0.088% 0.271% 0.000% 0.000% 0.000% 0.000% 0.000% 0.000% 0.033% 1 Firmicutes Schwartzia 0.000% 0.000% 0.176% 0.000% 0.082% 0.000% 0.000% 0.000% 0.000% 0.000% 0.033% 1 Firmicutes Pseudoramibacter 0.000% 0.000% 0.264% 0.000% 0.000% 0.000% 0.000% 0.000% 0.000% 0.000% 0.033% 1 Bacteroidetes Alistipes 0.110% 0.106% 0.000% 0.135% 0.000% 0.000% 0.000% 0.000% 0.000% 0.000% 0.033% 1 Proteobacteria Geopsychrobacter 0.000% 0.000% 0.000% 0.000% 0.164% 0.000% 0.000% 0.000% 0.000% 0.157% 0.033% 1 Synergistetes Jonquetella 0.000% 0.000% 0.264% 0.000% 0.000% 0.000% 0.000% 0.000% 0.000% 0.000% 0.033% 1 Actinobacteria Actinomyces 0.000% 0.000% 0.000% 0.000% 0.000% 0.000% 0.000% 0.187% 0.000% 0.000% 0.022% 1 Firmicutes Leuconostoc 0.000% 0.000% 0.000% 0.000% 0.164% 0.000% 0.000% 0.000% 0.000% 0.000% 0.022% 103
115 1 Firmicutes Phascolarctobacterium 0.000% 0.000% 0.000% 0.000% 0.082% 0.147% 0.000% 0.000% 0.000% 0.000% 0.022% 1 Spirochaetes Spirochaeta 0.110% 0.000% 0.000% 0.000% 0.082% 0.000% 0.000% 0.000% 0.000% 0.000% 0.022% 1 Proteobacteria Arcobacter 0.000% 0.000% 0.000% 0.000% 0.000% 0.000% 0.279% 0.000% 0.000% 0.000% 0.022% 1 Proteobacteria Roseateles 0.000% 0.212% 0.000% 0.000% 0.000% 0.000% 0.000% 0.000% 0.000% 0.000% 0.022% 1 Proteobacteria Anaerobiospirillum 0.000% 0.000% 0.000% 0.271% 0.000% 0.000% 0.000% 0.000% 0.000% 0.000% 0.022% 1 Synergistetes Dethiosulfovibrio 0.000% 0.000% 0.000% 0.000% 0.000% 0.000% 0.000% 0.000% 0.200% 0.000% 0.022% 1 Synergistetes Cloacibacillus 0.000% 0.000% 0.000% 0.000% 0.000% 0.000% 0.000% 0.000% 0.200% 0.000% 0.022% 1 Verrucomicrobia Akkermansia 0.000% 0.000% 0.000% 0.000% 0.000% 0.000% 0.000% 0.000% 0.000% 0.314% 0.022% 1 Fusobacteria Fusobacterium 0.000% 0.000% 0.000% 0.000% 0.000% 0.147% 0.000% 0.000% 0.000% 0.000% 0.011% 1 Actinobacteria Mobiluncus 0.000% 0.000% 0.000% 0.000% 0.000% 0.000% 0.000% 0.000% 0.100% 0.000% 0.011% 1 Actinobacteria Propionibacterium 0.000% 0.000% 0.000% 0.000% 0.000% 0.000% 0.000% 0.094% 0.000% 0.000% 0.011% 1 Actinobacteria Rhodococcus 0.000% 0.000% 0.000% 0.000% 0.000% 0.000% 0.000% 0.000% 0.000% 0.157% 0.011% 1 Actinobacteria Parascardovia 0.000% 0.000% 0.088% 0.000% 0.000% 0.000% 0.000% 0.000% 0.000% 0.000% 0.011% 1 Actinobacteria Gardnerella 0.110% 0.000% 0.000% 0.000% 0.000% 0.000% 0.000% 0.000% 0.000% 0.000% 0.011% 1 Actinobacteria Slackia 0.110% 0.000% 0.000% 0.000% 0.000% 0.000% 0.000% 0.000% 0.000% 0.000% 0.011% 1 Actinobacteria Eggerthella 0.000% 0.000% 0.000% 0.000% 0.000% 0.000% 0.000% 0.000% 0.100% 0.000% 0.011% 1 Firmicutes Weissella 0.000% 0.000% 0.000% 0.000% 0.000% 0.000% 0.000% 0.000% 0.100% 0.000% 0.011% 1 Firmicutes Dethiosulfatibacter 0.000% 0.000% 0.000% 0.000% 0.000% 0.000% 0.000% 0.000% 0.100% 0.000% 0.011% 1 Firmicutes Ethanoligenens 0.000% 0.106% 0.000% 0.000% 0.000% 0.000% 0.000% 0.000% 0.000% 0.000% 0.011% 1 Firmicutes Sporobacterium 0.000% 0.106% 0.000% 0.000% 0.000% 0.000% 0.000% 0.000% 0.000% 0.000% 0.011% 1 Firmicutes Syntrophococcus 0.000% 0.000% 0.088% 0.000% 0.000% 0.000% 0.000% 0.000% 0.000% 0.000% 0.011% 1 Firmicutes Marvinbryantia 0.000% 0.000% 0.000% 0.000% 0.000% 0.000% 0.000% 0.000% 0.000% 0.157% 0.011% 1 Firmicutes Hespellia 0.000% 0.000% 0.000% 0.000% 0.082% 0.000% 0.000% 0.000% 0.000% 0.000% 0.011% 1 Firmicutes Moryella 0.000% 0.000% 0.088% 0.000% 0.000% 0.000% 0.000% 0.000% 0.000% 0.000% 0.011% 1 Firmicutes Peptostreptococcus 0.000% 0.000% 0.000% 0.000% 0.000% 0.000% 0.000% 0.094% 0.000% 0.000% 0.011% 1 Firmicutes Tindallia 0.000% 0.000% 0.000% 0.000% 0.000% 0.000% 0.000% 0.000% 0.100% 0.000% 0.011% 1 Bacteroidetes Olivibacter 0.000% 0.000% 0.000% 0.000% 0.000% 0.000% 0.000% 0.000% 0.100% 0.000% 0.011% 104
116 1 Bacteroidetes Fluviicola 0.000% 0.000% 0.000% 0.000% 0.000% 0.000% 0.000% 0.000% 0.000% 0.157% 0.011% 1 Bacteroidetes Chryseobacterium 0.000% 0.106% 0.000% 0.000% 0.000% 0.000% 0.000% 0.000% 0.000% 0.000% 0.011% 1 Proteobacteria Lebetimonas 0.000% 0.000% 0.000% 0.000% 0.000% 0.000% 0.139% 0.000% 0.000% 0.000% 0.011% 1 Proteobacteria Acidovorax 0.000% 0.000% 0.000% 0.000% 0.000% 0.000% 0.000% 0.094% 0.000% 0.000% 0.011% 1 Proteobacteria Devosia 0.000% 0.106% 0.000% 0.000% 0.000% 0.000% 0.000% 0.000% 0.000% 0.000% 0.011% 1 Proteobacteria Enhydrobacter 0.000% 0.000% 0.000% 0.000% 0.000% 0.000% 0.139% 0.000% 0.000% 0.000% 0.011% 1 Proteobacteria Cronobacter 0.000% 0.106% 0.000% 0.000% 0.000% 0.000% 0.000% 0.000% 0.000% 0.000% 0.011% 1 Proteobacteria Kluyvera 0.000% 0.106% 0.000% 0.000% 0.000% 0.000% 0.000% 0.000% 0.000% 0.000% 0.011% 1 Proteobacteria Klebsiella 0.000% 0.106% 0.000% 0.000% 0.000% 0.000% 0.000% 0.000% 0.000% 0.000% 0.011% 1 Proteobacteria Haemophilus 0.110% 0.000% 0.000% 0.000% 0.000% 0.000% 0.000% 0.000% 0.000% 0.000% 0.011% Total % % % % % % % % % % % % unclassified_bacteria % % % % % % % % % % % 4.472% 9.414% 6.734% 8.150% 2.434% 6.000% 9.039% Bacteroidetes Prevotella % % % 2 Bacteroidetes Hallella 2.230% 1.786% 2.780% 2.121% 1.463% 2.545% 2.290% 1.881% 0.710% 0.958% 1.779% 2 Firmicutes Ruminococcus 1.443% 0.543% 1.807% 1.664% 1.423% 2.141% 5.791% 0.366% 2.079% 0.761% 1.677% 2 Firmicutes Oscillibacter 1.639% 1.242% 0.834% 1.040% 0.813% 1.616% 0.673% 1.985% 0.862% 3.521% 1.599% 2 Firmicutes Lactobacillus 0.721% 0.466% 0.973% 3.161% 1.463% 2.586% 0.808% 0.157% 0.304% 0.592% 1.214% 2 Firmicutes Anaerobacter 0.000% 0.000% 0.139% 0.250% 1.382% 0.525% 0.539% 2.142% 1.826% 2.310% 1.082% 2 Spirochaetes Treponema 0.131% 0.621% 0.625% 0.749% 1.301% 0.808% 2.626% 0.784% 0.304% 1.746% 1.029% 2 Firmicutes Coprococcus 1.902% 0.543% 0.695% 1.040% 0.569% 1.333% 0.875% 0.993% 0.609% 0.423% 0.863% 2 Firmicutes Roseburia 1.377% 0.466% 0.556% 1.997% 1.098% 0.566% 0.471% 0.418% 0.862% 0.592% 0.863% 2 Firmicutes Streptococcus 0.459% 0.388% 1.459% 0.666% 0.691% 1.576% 0.337% 1.411% 0.304% 0.845% 0.843% 2 Firmicutes Butyricicoccus 1.574% 0.311% 0.695% 0.832% 1.301% 2.263% 0.471% 0.261% 0.355% 0.197% 0.839% 2 Firmicutes Blautia 0.131% 2.640% 1.320% 0.790% 1.504% 0.889% 0.404% 0.313% 0.101% 0.225% 0.756% 2 Firmicutes Dialister 1.377% 0.388% 1.390% 0.541% 0.691% 1.535% 0.673% 0.784% 0.304% 0.141% 0.731% 2 Firmicutes Catenibacterium 0.197% 0.078% 0.347% 0.042% 2.642% 0.162% 0.404% 0.209% 2.535% 0.085% 0.692% 105
117 2 Firmicutes Megasphaera 0.459% 0.311% 0.695% 2.537% 0.407% 0.404% 0.135% 0.470% 0.000% 0.056% 0.561% 2 Firmicutes Subdoligranulum 0.459% 0.543% 0.486% 0.915% 0.325% 0.525% 0.606% 0.418% 0.355% 0.394% 0.497% 2 Firmicutes Fastidiosipila 0.066% 0.311% 0.208% 0.208% 0.528% 0.525% 0.337% 0.261% 1.927% 0.254% 0.468% 2 Firmicutes Faecalibacterium 0.459% 0.388% 0.417% 0.749% 0.325% 0.727% 0.202% 0.366% 0.406% 0.225% 0.429% 2 Firmicutes Mitsuokella 0.328% 0.311% 0.139% 0.915% 0.203% 0.889% 0.135% 0.627% 0.000% 0.310% 0.414% 2 Firmicutes Eubacterium 0.131% 3.028% 0.347% 0.208% 0.203% 0.242% 0.269% 0.261% 0.101% 0.338% 0.414% 2 Firmicutes Acetanaerobacterium 0.459% 0.311% 0.278% 0.083% 0.325% 0.323% 0.673% 0.366% 0.254% 0.789% 0.405% 2 Firmicutes Parasporobacterium 1.443% 0.000% 0.417% 0.083% 0.285% 0.808% 0.471% 0.000% 0.152% 0.225% 0.366% 2 Bacteroidetes Barnesiella 0.066% 1.165% 0.000% 0.333% 1.057% 0.566% 0.000% 0.209% 0.203% 0.028% 0.356% 2 Firmicutes Butyrivibrio 0.197% 1.242% 0.278% 0.250% 0.528% 0.202% 0.135% 0.470% 0.203% 0.197% 0.336% 2 Bacteroidetes Bacteroides 0.000% 1.708% 0.347% 0.000% 0.244% 0.040% 0.606% 0.104% 0.152% 0.592% 0.336% 2 Firmicutes Anaerosporobacter 0.590% 0.000% 0.417% 0.083% 0.163% 0.202% 0.269% 0.313% 0.304% 0.732% 0.332% 2 Firmicutes Lachnobacterium 0.000% 0.155% 0.695% 0.166% 0.041% 0.364% 0.404% 0.209% 0.304% 0.732% 0.332% 2 Firmicutes Sporacetigenium 0.000% 0.000% 0.000% 0.083% 0.366% 0.364% 0.404% 0.731% 0.761% 0.338% 0.327% 2 Bacteroidetes Tannerella 0.459% 0.311% 0.695% 0.000% 0.447% 0.000% 0.875% 0.627% 0.101% 0.113% 0.307% 2 Firmicutes Dorea 0.525% 0.155% 0.625% 0.250% 0.569% 0.000% 0.606% 0.000% 0.304% 0.085% 0.278% 2 Firmicutes Pseudobutyrivibrio 0.525% 0.078% 0.069% 0.499% 0.366% 0.525% 0.000% 0.157% 0.000% 0.197% 0.263% 2 Firmicutes Anaerofilum 0.459% 0.078% 0.695% 0.083% 0.244% 0.081% 0.000% 0.157% 0.811% 0.141% 0.254% 2 Bacteroidetes Parabacteroides 0.066% 0.000% 0.139% 0.000% 0.691% 0.162% 0.741% 0.313% 0.456% 0.056% 0.254% 2 Proteobacteria Succinivibrio 0.393% 0.000% 1.320% 0.000% 0.000% 0.162% 0.067% 0.627% 0.000% 0.282% 0.254% 2 Firmicutes Anaerovibrio 0.262% 0.311% 0.069% 0.250% 0.000% 0.162% 0.337% 0.575% 0.101% 0.254% 0.224% 2 Firmicutes Allobaculum 0.000% 0.000% 0.069% 0.499% 0.447% 0.404% 0.202% 0.209% 0.152% 0.000% 0.215% 2 Firmicutes Sarcina 0.000% 0.000% 0.000% 0.000% 0.203% 0.081% 0.135% 0.366% 0.203% 0.648% 0.210% 2 Firmicutes Turicibacter 0.066% 0.000% 0.000% 0.083% 0.041% 0.283% 0.135% 0.366% 0.456% 0.366% 0.205% 2 Firmicutes Oribacterium 0.066% 0.000% 0.069% 0.042% 0.244% 0.121% 0.067% 0.157% 0.101% 0.507% 0.176% 2 Firmicutes Selenomonas 0.000% 0.155% 0.486% 0.208% 0.244% 0.081% 0.875% 0.000% 0.000% 0.000% 0.171% 2 Firmicutes Clostridium 0.000% 0.000% 0.069% 0.000% 0.041% 0.040% 0.471% 0.418% 0.000% 0.479% 0.171% 106
118 2 Firmicutes Erysipelothrix 0.066% 0.155% 0.278% 0.499% 0.000% 0.242% 0.135% 0.052% 0.101% 0.085% 0.161% 2 Firmicutes Acetivibrio 0.000% 0.311% 0.208% 0.083% 0.081% 0.000% 0.202% 0.209% 0.355% 0.169% 0.151% 2 TM7 TM7_genera_ 0.000% 0.000% 0.139% 0.000% 0.081% 0.081% 0.404% 0.209% 0.203% 0.310% 0.151% incertae_sedis 2 Firmicutes Anaerotruncus 0.066% 0.155% 0.139% 0.166% 0.041% 0.283% 0.067% 0.157% 0.152% 0.113% 0.137% 2 Actinobacteria Collinsella 0.000% 0.000% 0.208% 0.000% 0.528% 0.000% 0.404% 0.000% 0.101% 0.085% 0.132% 2 Actinobacteria Olsenella 0.000% 0.078% 0.069% 0.582% 0.081% 0.081% 0.067% 0.000% 0.101% 0.085% 0.127% 2 Firmicutes Peptococcus 0.066% 0.311% 0.069% 0.000% 0.041% 0.283% 0.135% 0.000% 0.507% 0.000% 0.127% 2 Bacteroidetes Butyricimonas 0.328% 0.311% 0.139% 0.083% 0.041% 0.162% 0.000% 0.000% 0.101% 0.169% 0.127% 2 Firmicutes Hespellia 1.311% 0.000% 0.000% 0.042% 0.000% 0.040% 0.000% 0.052% 0.000% 0.000% 0.112% 2 Firmicutes Coprobacillus 0.000% 0.000% 0.139% 0.042% 0.000% 0.121% 0.471% 0.000% 0.456% 0.000% 0.107% 2 Firmicutes Hydrogeno 0.000% 0.078% 0.069% 0.125% 0.041% 0.040% 0.404% 0.313% 0.000% 0.085% 0.107% anaerobacterium 2 Deferribacteres Mucispirillum 0.131% 0.000% 0.278% 0.458% 0.000% 0.081% 0.067% 0.000% 0.000% 0.028% 0.102% 2 Proteobacteria Desulfovibrio 0.000% 0.078% 0.208% 0.083% 0.081% 0.081% 0.067% 0.313% 0.000% 0.113% 0.102% 2 Firmicutes Allisonella 0.000% 0.388% 0.069% 0.042% 0.203% 0.040% 0.067% 0.157% 0.101% 0.028% 0.098% 2 Firmicutes Sharpea 0.000% 0.000% 0.208% 0.042% 0.000% 0.081% 0.000% 0.104% 0.000% 0.310% 0.093% 2 Firmicutes Acidaminococcus 0.393% 0.000% 0.625% 0.000% 0.000% 0.000% 0.202% 0.000% 0.000% 0.028% 0.093% 2 Verrucomicrobia Subdivision5_ genera_incertae_ 0.000% 0.000% 0.000% 0.000% 0.000% 0.162% 0.000% 0.104% 0.000% 0.366% 0.093% sedis 2 Proteobacteria Sutterella 0.131% 0.000% 0.069% 0.000% 0.000% 0.525% 0.067% 0.052% 0.000% 0.000% 0.088% 2 Tenericutes Anaeroplasma 0.000% 0.233% 0.000% 0.374% 0.081% 0.000% 0.000% 0.052% 0.152% 0.000% 0.088% 2 Firmicutes Aerococcus 0.000% 0.155% 0.000% 0.125% 0.000% 0.323% 0.067% 0.000% 0.152% 0.000% 0.083% 2 Bacteroidetes Porphyromonas 0.000% 0.311% 0.069% 0.291% 0.041% 0.000% 0.067% 0.000% 0.051% 0.056% 0.083% 2 Synergistetes Pyramidobacter 0.000% 0.000% 0.000% 0.125% 0.000% 0.202% 0.067% 0.157% 0.101% 0.085% 0.083% 2 Firmicutes Anaerococcus 0.000% 0.000% 0.000% 0.000% 0.000% 0.283% 0.067% 0.000% 0.203% 0.113% 0.078% 2 Firmicutes Ethanoligenens 0.000% 0.078% 0.069% 0.042% 0.000% 0.242% 0.135% 0.000% 0.051% 0.085% 0.073% 2 Spirochaetes Brachyspira 0.000% 0.000% 0.000% 0.291% 0.000% 0.000% 0.000% 0.000% 0.000% 0.197% 0.068% 107
119 2 Proteobacteria Campylobacter 0.131% 0.155% 0.069% 0.000% 0.041% 0.121% 0.135% 0.052% 0.000% 0.056% 0.068% 2 Bacteroidetes Paraprevotella 0.000% 0.155% 0.069% 0.250% 0.041% 0.000% 0.067% 0.052% 0.051% 0.000% 0.063% 2 Firmicutes Veillonella 0.066% 0.000% 0.069% 0.374% 0.000% 0.000% 0.000% 0.000% 0.000% 0.028% 0.059% 2 Bacteroidetes Alistipes 0.000% 0.000% 0.347% 0.000% 0.122% 0.000% 0.067% 0.104% 0.051% 0.000% 0.059% 2 Proteobacteria Enterobacteriales 0.066% 0.000% 0.347% 0.000% 0.122% 0.000% 0.135% 0.000% 0.051% 0.000% 0.059% 2 Actinobacteria Slackia 0.131% 0.078% 0.000% 0.042% 0.041% 0.000% 0.000% 0.104% 0.051% 0.085% 0.054% 2 Actinobacteria Enterorhabdus 0.066% 0.000% 0.278% 0.000% 0.000% 0.040% 0.202% 0.052% 0.000% 0.028% 0.054% 2 Synergistetes Cloacibacillus 0.000% 0.000% 0.000% 0.000% 0.000% 0.162% 0.067% 0.157% 0.101% 0.028% 0.054% 2 Tenericutes Asteroleplasma 0.262% 0.078% 0.139% 0.042% 0.000% 0.081% 0.000% 0.052% 0.000% 0.000% 0.054% 2 Firmicutes Peptoniphilus 0.000% 0.000% 0.000% 0.042% 0.000% 0.081% 0.000% 0.104% 0.000% 0.141% 0.049% 2 Bacteroidetes Xylanibacter 0.066% 0.388% 0.000% 0.042% 0.000% 0.000% 0.067% 0.052% 0.051% 0.000% 0.049% 2 Verrucomicrobia Akkermansia 0.000% 0.000% 0.000% 0.000% 0.163% 0.000% 0.000% 0.000% 0.000% 0.169% 0.049% 2 Firmicutes Sporobacterium 0.000% 0.078% 0.000% 0.333% 0.000% 0.000% 0.000% 0.000% 0.000% 0.000% 0.044% 2 Fibrobacteres Fibrobacter 0.000% 0.000% 0.000% 0.125% 0.000% 0.081% 0.067% 0.000% 0.152% 0.000% 0.044% 2 Actinobacteria Corynebacterium 0.000% 0.000% 0.000% 0.083% 0.000% 0.000% 0.067% 0.000% 0.051% 0.113% 0.039% 2 Firmicutes Mogibacterium 0.131% 0.000% 0.000% 0.083% 0.000% 0.000% 0.000% 0.052% 0.152% 0.000% 0.039% 2 Proteobacteria Roseateles 0.131% 0.000% 0.278% 0.000% 0.000% 0.040% 0.067% 0.000% 0.000% 0.000% 0.039% 2 Actinobacteria Bifidobacterium 0.000% 0.000% 0.139% 0.000% 0.041% 0.000% 0.000% 0.000% 0.051% 0.085% 0.034% 2 Firmicutes Sporobacter 0.000% 0.311% 0.000% 0.000% 0.000% 0.040% 0.000% 0.000% 0.000% 0.056% 0.034% 2 Firmicutes Catonella 0.000% 0.078% 0.000% 0.042% 0.000% 0.162% 0.000% 0.000% 0.000% 0.028% 0.034% 2 Proteobacteria Helicobacter 0.000% 0.000% 0.000% 0.000% 0.000% 0.283% 0.000% 0.000% 0.000% 0.000% 0.034% 2 Proteobacteria Anaerobiospirillum 0.000% 0.000% 0.000% 0.125% 0.081% 0.081% 0.000% 0.000% 0.000% 0.000% 0.034% 2 Synergistetes Dethiosulfovibrio 0.000% 0.155% 0.000% 0.000% 0.000% 0.000% 0.000% 0.000% 0.254% 0.000% 0.034% 2 Firmicutes Lactococcus 0.066% 0.000% 0.139% 0.042% 0.041% 0.000% 0.067% 0.000% 0.000% 0.000% 0.029% 2 Proteobacteria Moraxella 0.000% 0.000% 0.000% 0.000% 0.000% 0.000% 0.000% 0.000% 0.304% 0.000% 0.029% 2 Proteobacteria Actinobacillus 0.066% 0.000% 0.000% 0.042% 0.122% 0.000% 0.000% 0.000% 0.000% 0.000% 0.024% 2 Cyanobacteria Streptophyta 0.000% 0.078% 0.000% 0.000% 0.041% 0.000% 0.000% 0.000% 0.051% 0.056% 0.024% 108
120 2 Fusobacteria Fusobacterium 0.000% 0.000% 0.000% 0.083% 0.000% 0.000% 0.000% 0.000% 0.000% 0.056% 0.020% 2 Actinobacteria Gordonibacter 0.000% 0.000% 0.000% 0.000% 0.000% 0.000% 0.000% 0.052% 0.000% 0.085% 0.020% 2 Actinobacteria Adlercreutzia 0.000% 0.000% 0.000% 0.000% 0.000% 0.040% 0.067% 0.052% 0.051% 0.000% 0.020% 2 Firmicutes Anaerovorax 0.000% 0.000% 0.000% 0.000% 0.041% 0.000% 0.000% 0.000% 0.000% 0.085% 0.020% 2 Firmicutes Papillibacter 0.000% 0.000% 0.000% 0.042% 0.000% 0.000% 0.000% 0.000% 0.051% 0.056% 0.020% 2 Firmicutes Peptostreptococcus 0.000% 0.000% 0.000% 0.000% 0.000% 0.040% 0.000% 0.000% 0.000% 0.085% 0.020% 2 Firmicutes Schwartzia 0.000% 0.000% 0.000% 0.083% 0.000% 0.000% 0.000% 0.052% 0.000% 0.028% 0.020% 2 Firmicutes Phascolarcto 0.000% 0.000% 0.000% 0.000% 0.000% 0.040% 0.135% 0.000% 0.000% 0.028% 0.020% bacterium 2 Spirochaetes Spirochaeta 0.000% 0.000% 0.000% 0.000% 0.000% 0.121% 0.000% 0.000% 0.000% 0.028% 0.020% 2 Proteobacteria Wolinella 0.000% 0.155% 0.000% 0.042% 0.041% 0.000% 0.000% 0.000% 0.000% 0.000% 0.020% 2 Actinobacteria Actinomyces 0.000% 0.000% 0.069% 0.000% 0.000% 0.000% 0.000% 0.000% 0.051% 0.028% 0.015% 2 Actinobacteria Mobiluncus 0.000% 0.000% 0.000% 0.042% 0.000% 0.000% 0.000% 0.000% 0.101% 0.000% 0.015% 2 Actinobacteria Eggerthella 0.000% 0.000% 0.000% 0.000% 0.041% 0.040% 0.000% 0.000% 0.000% 0.028% 0.015% 2 Firmicutes Weissella 0.000% 0.078% 0.000% 0.042% 0.000% 0.000% 0.000% 0.000% 0.000% 0.028% 0.015% 2 Firmicutes Alloiococcus 0.000% 0.000% 0.000% 0.000% 0.000% 0.000% 0.000% 0.000% 0.152% 0.000% 0.015% 2 Firmicutes Sediminibacillus 0.066% 0.000% 0.069% 0.000% 0.041% 0.000% 0.000% 0.000% 0.000% 0.000% 0.015% 2 Firmicutes Parvimonas 0.000% 0.078% 0.000% 0.000% 0.000% 0.040% 0.000% 0.000% 0.000% 0.028% 0.015% 2 Firmicutes Finegoldia 0.000% 0.000% 0.000% 0.042% 0.000% 0.000% 0.000% 0.000% 0.051% 0.028% 0.015% 2 Firmicutes Alkaliphilus 0.000% 0.000% 0.000% 0.000% 0.000% 0.000% 0.000% 0.052% 0.051% 0.028% 0.015% 2 Bacteroidetes Chryseobacterium 0.131% 0.000% 0.000% 0.000% 0.000% 0.000% 0.000% 0.052% 0.000% 0.000% 0.015% 2 Proteobacteria Lebetimonas 0.131% 0.000% 0.000% 0.000% 0.000% 0.000% 0.000% 0.000% 0.000% 0.028% 0.015% 2 Proteobacteria Lawsonia 0.000% 0.000% 0.000% 0.083% 0.000% 0.000% 0.000% 0.000% 0.051% 0.000% 0.015% 2 Proteobacteria Ochrobactrum 0.000% 0.000% 0.000% 0.000% 0.000% 0.000% 0.000% 0.000% 0.000% 0.085% 0.015% 2 Proteobacteria Acinetobacter 0.066% 0.000% 0.000% 0.000% 0.000% 0.040% 0.067% 0.000% 0.000% 0.000% 0.015% 2 Proteobacteria Enterobacter 0.000% 0.000% 0.208% 0.000% 0.000% 0.000% 0.000% 0.000% 0.000% 0.000% 0.015% 2 Tenericutes Acholeplasma 0.000% 0.000% 0.000% 0.000% 0.000% 0.000% 0.067% 0.000% 0.000% 0.056% 0.015% 2 Actinobacteria Streptomyces 0.000% 0.000% 0.000% 0.042% 0.000% 0.000% 0.000% 0.000% 0.051% 0.000% 0.010% 109
121 2 Firmicutes Facklamia 0.000% 0.000% 0.000% 0.042% 0.000% 0.000% 0.067% 0.000% 0.000% 0.000% 0.010% 2 Firmicutes Enterococcus 0.000% 0.155% 0.000% 0.000% 0.000% 0.000% 0.000% 0.000% 0.000% 0.000% 0.010% 2 Firmicutes Staphylococcus 0.000% 0.000% 0.000% 0.000% 0.000% 0.040% 0.000% 0.052% 0.000% 0.000% 0.010% 2 Firmicutes Salsuginibacillus 0.000% 0.000% 0.000% 0.000% 0.000% 0.040% 0.000% 0.000% 0.000% 0.028% 0.010% 2 Firmicutes Dethiosulfatibacter 0.000% 0.000% 0.000% 0.000% 0.041% 0.000% 0.000% 0.000% 0.000% 0.028% 0.010% 2 Firmicutes Syntrophococcus 0.066% 0.000% 0.000% 0.000% 0.000% 0.000% 0.000% 0.000% 0.051% 0.000% 0.010% 2 Firmicutes Pseudoramibacter 0.000% 0.000% 0.069% 0.000% 0.000% 0.000% 0.000% 0.052% 0.000% 0.000% 0.010% 2 Firmicutes Anaerofustis 0.000% 0.000% 0.000% 0.000% 0.000% 0.000% 0.000% 0.000% 0.000% 0.056% 0.010% 2 Firmicutes Tindallia 0.000% 0.000% 0.000% 0.000% 0.000% 0.000% 0.000% 0.000% 0.000% 0.056% 0.010% 2 Proteobacteria Arcobacter 0.066% 0.000% 0.000% 0.000% 0.041% 0.000% 0.000% 0.000% 0.000% 0.000% 0.010% 2 Proteobacteria Escherichia/Shigella 0.066% 0.000% 0.000% 0.000% 0.000% 0.000% 0.000% 0.000% 0.051% 0.000% 0.010% 2 Proteobacteria Cronobacter 0.000% 0.000% 0.000% 0.000% 0.000% 0.000% 0.135% 0.000% 0.000% 0.000% 0.010% 2 Proteobacteria Pasteurella 0.000% 0.000% 0.000% 0.083% 0.000% 0.000% 0.000% 0.000% 0.000% 0.000% 0.010% 2 Synergistetes Jonquetella 0.000% 0.000% 0.000% 0.000% 0.000% 0.000% 0.000% 0.000% 0.101% 0.000% 0.010% 2 Tenericutes Mycoplasma 0.066% 0.000% 0.000% 0.000% 0.000% 0.000% 0.067% 0.000% 0.000% 0.000% 0.010% 2 Actinobacteria Saccharopolyspora 0.000% 0.000% 0.000% 0.000% 0.000% 0.000% 0.000% 0.000% 0.051% 0.000% 0.005% 2 Actinobacteria Atopobium 0.000% 0.000% 0.000% 0.000% 0.000% 0.000% 0.067% 0.000% 0.000% 0.000% 0.005% 2 Firmicutes Leuconostoc 0.000% 0.000% 0.069% 0.000% 0.000% 0.000% 0.000% 0.000% 0.000% 0.000% 0.005% 2 Firmicutes Atopostipes 0.000% 0.000% 0.000% 0.000% 0.000% 0.000% 0.000% 0.052% 0.000% 0.000% 0.005% 2 Firmicutes Nosocomiicoccus 0.000% 0.000% 0.000% 0.000% 0.000% 0.000% 0.000% 0.000% 0.051% 0.000% 0.005% 2 Firmicutes Holdemania 0.000% 0.000% 0.000% 0.042% 0.000% 0.000% 0.000% 0.000% 0.000% 0.000% 0.005% 2 Firmicutes Howardella 0.000% 0.000% 0.000% 0.000% 0.000% 0.000% 0.000% 0.052% 0.000% 0.000% 0.005% 2 Firmicutes Sedimentibacter 0.000% 0.000% 0.000% 0.000% 0.041% 0.000% 0.000% 0.000% 0.000% 0.000% 0.005% 2 Firmicutes Anaerosphaera 0.000% 0.000% 0.000% 0.000% 0.000% 0.000% 0.000% 0.000% 0.000% 0.028% 0.005% 2 Firmicutes Desulfotomaculum 0.000% 0.000% 0.069% 0.000% 0.000% 0.000% 0.000% 0.000% 0.000% 0.000% 0.005% 2 Firmicutes Marvinbryantia 0.000% 0.000% 0.000% 0.000% 0.000% 0.000% 0.067% 0.000% 0.000% 0.000% 0.005% 2 Firmicutes Shuttleworthia 0.000% 0.000% 0.000% 0.000% 0.041% 0.000% 0.000% 0.000% 0.000% 0.000% 0.005% 110
122 2 Firmicutes Alkalibacter 0.000% 0.000% 0.000% 0.000% 0.000% 0.000% 0.067% 0.000% 0.000% 0.000% 0.005% 2 Bacteroidetes Flavobacterium 0.000% 0.000% 0.000% 0.000% 0.041% 0.000% 0.000% 0.000% 0.000% 0.000% 0.005% 2 Proteobacteria Geopsychrobacter 0.000% 0.000% 0.000% 0.000% 0.000% 0.000% 0.000% 0.052% 0.000% 0.000% 0.005% 2 Proteobacteria Paucimonas 0.000% 0.000% 0.000% 0.000% 0.000% 0.040% 0.000% 0.000% 0.000% 0.000% 0.005% 2 Proteobacteria Alysiella 0.000% 0.000% 0.000% 0.000% 0.000% 0.000% 0.000% 0.000% 0.000% 0.028% 0.005% 2 Proteobacteria Mesorhizobium 0.000% 0.000% 0.069% 0.000% 0.000% 0.000% 0.000% 0.000% 0.000% 0.000% 0.005% 2 Proteobacteria Devosia 0.000% 0.078% 0.000% 0.000% 0.000% 0.000% 0.000% 0.000% 0.000% 0.000% 0.005% 2 Proteobacteria Erythrobacter 0.000% 0.000% 0.000% 0.000% 0.000% 0.040% 0.000% 0.000% 0.000% 0.000% 0.005% 2 Proteobacteria Enhydrobacter 0.000% 0.000% 0.000% 0.000% 0.000% 0.040% 0.000% 0.000% 0.000% 0.000% 0.005% 2 Proteobacteria Kluyvera 0.000% 0.000% 0.000% 0.000% 0.041% 0.000% 0.000% 0.000% 0.000% 0.000% 0.005% 2 Proteobacteria Klebsiella 0.000% 0.000% 0.069% 0.000% 0.000% 0.000% 0.000% 0.000% 0.000% 0.000% 0.005% 2 Proteobacteria Haemophilus 0.000% 0.000% 0.000% 0.000% 0.000% 0.000% 0.000% 0.000% 0.000% 0.028% 0.005% 2 Planctomycetes Rhodopirellula 0.000% 0.000% 0.000% 0.000% 0.000% 0.000% 0.000% 0.000% 0.000% 0.028% 0.005% 2 Total % % % % % % % % % % % 111
123 Figure 7. Distribution of OTUs and sequences between Tylosin and No-Tylosin groups. Venn diagrams were created using OTUs Numbers indicate the number of OTUs and numbers in parenthesis represent a number of sequence reads. 112


124 113


125 (A) (B) Figure 8. Distribution of OTUs in the two treatment groups in the farm 1 and 2. The heat map for the farm 1 and 2 were created using OTUs with an OTU definition at a similarity cutoff of 93%. Each column represents groups and each row indicates OTUs. OTUs were sorted with the most abundant OTUs displayed at the top and the least abundant OTUs at the bottom. T and NT indicate Tylosin and No-Tylosin group, respectively, and numbers indicates weeks of age. Abundant OTUs were red color-coded and white blanks indicate missing OTUs. (A): Farm 1, (B): Farm 2 114
126 Figure 9. Dendrograms of community structure similarity (Bray-Curtis index). Dendrograms were generated using the Bray-Curtis index calculated at a 5% sequence difference by using Mothur (version ). T and NT indicate Tylosin and No-Tylosin group 115
127 4.4 Discussion We hypothesized that the beneficial effects of tylosin would be mediated by compositional changes of the pig gut bacterial communities (Chapman and Johnson, 2002; Dibner and Richards, 2005; Lin. 2011; Looft et al., 2012). This hypothesis is partly based on the understanding that AGPs lack growth promoting effects in germ-free animals (Coates et al., 1955; Coates et al., 1963) and because many antimicrobials with different modes of action promote animal growth. The work presented here was designed to better understand the effects that a single AGP, Tylosin, has on the fecal microbiome of the pig. We showed that Tylosin consistently and specifically altered the microbiome of feces of pigs. Using 16S rrna gene sequencing we previously showed profound changes in the pig fecal microbiome over time (Kim et al., 2011). Here we showed that Tylosin results in significant changes in specific genera and OTUs and that some of these changes occur at unique times within the growth of pigs (Fig. 8A). What is most striking are the changes in the less abundant OTUs over time (See groups bracketed with A and B in Fig. 8A). Prior to exposure to Tylosin, the fecal microbiomes of pigs in the two groups were quite similar. However, there was a pronounced shift in the distribution and quantity of microbes in regions A and B with treatment with Tylosin being correlated with a shift of OTUs in the B region of the heat map to the A region (Fig. 8A). However, as the untreated pigs reached maturity, their fecal microbiomes, particularly in the A and B regions become more like pigs in the Tylosin treatment group. Our interpretation of these results is that Tylosin speeds the development or maturation of the unique adult-like fecal microbiome but that eventually pigs in the non-treatment groups finally catch up. 116
128 Thus, one mechanism whereby AGPs act is to speed up the maturation of the fecal microbiome. However, we acknowledge the fact that these results might be unique to tylosin and to animals in similar housing facilities and consuming similar feeds. There was no significant difference in the proportion of taxonomic groupings of the fecal microbiomes at the phylum level regardless of treatment group at all sampling times. However, there were statistical differences when measured at the genus level. A total of twelve differentially abundant genera were observed in both farms at the genus level (Fig. 6). Lactobacillus, Sporacetigenium, Acetanaerobacterium, and Eggerthella were detected more frequently in the Tylosin group than in No-Tylosin group, and the others were present more frequently in the No-Tylosin group than the Tylosin group. In previous studies using pigs as an animal model certain species of Lactobacillus have been shown to increase in concentration in AGP-treated pigs (Collier et al., 2003; Rettedal et al., 2009; Looft et al., 2012). In this study we also detected a relative increase in the concentration of the genus Lactobacillus. A positive relation between the increase in abundance of Lactobacillus spp. population and an increase in weight gain has been shown in other animal models (Dumonceaux et al., 2006; Lin. 2011). Sporacetigenium, Acetanaerobacterium, and Eggerthella were more abundant in pigs with Tylosin treatment. In vitro studies showed that Sporacetigenium and Acetanaerobacterium spp ferment mono-, di-, or oligosaccharides into acetic acid, ethanol, hydrogen and carbon dioxide (Chen and Dong, 2004; Chen et al., 2006). Sporacetigenium spp also has been identified as one of common bacterial population in fermentation reactors where the main volatile fatty acids were acetic acid and propionic acid (Ren et al., 2007). It should be noted that about 5-20% of the total energy of the pigs 117
129 is provided by fermentation end products including acetic and propionic acids in the cecum and colon (Gaskins et al., 2002). Eggerthella spp is a gram positive bacteria, which is known to be involved in metabolism of catechin and lignan that are plant origin (Kutschera et al., 2011; Mabrok et al., 2012). However, physiological and functional roles of Eggerthella in the intestines of food animals are unknown. In comparing the results reported here with those from other studies using AGPs, differences in the microbial population shifts did occur (Collier et al., 2003; Rettedal et al., 2009; Looft et al., 2012). It is unclear why these differences occurred, but is likely related to differences in the AGP used. The AGP used in our study was Tylosin, while the other three studies used combination of chlortetracycline with different AGPs. Likewise, we elected to use feces as the collected sample so that we could repeatedly sample the same pigs, while Rettedal et al and Collier et al collected tissue or digesta in their studies. We also elected to use commercial pigs in a production setting instead of experimental isolation facilities where access to different sets of microbes in different environments might be responsible for this inconsistency. Furthermore, in our study two farms were used and the microbial shifts between the two farms were quite similar. Venn diagrams were generated to make qualitative comparisons between Tylosin and No-Tylosin groups at the same age. It should be noted that almost all the sequences were shared between Tylosin and No-Tylosin groups at the same age. An average of and 98.47% of the total bacterial sequences belonged to the shared OTUs. These OTUs represented an average of and 68.60% of the total OTUs in farm 1 and farm 2, respectively (Fig. 7). This indicates that unique OTUs to each group were more likely to be found as less abundant OTUs because unique OTUs that accounted for average of 118
130 33.52 and 31.40% of the total OTUs at the same age contained just 2.11 and 1.53% of the bacterial sequences in farm 1 and farm 2 (Fig. 7). This is consistent with the data visualization based on heat maps where the greatest number of differences appear towards the bottom of the heat maps. Given that unique OTUs are less abundant OTUs, abundant and beneficial functions from less abundant microbes can be considered (Walker. 2007; Arumugam et al., 2011). Sequence reads belonging to OTUs unique to each Tylosin and No-Tylosin groups were subjected to the RDP classifier analysis. RDP classifier analysis indicated that the majority of unique OTUs were unclassified bacteria at genus level accounting for and 63.89% of the total unique sequence reads in farm 1 and farm 2. However, it remains unknown at this point whether unclassified bacteria contributed to fundamental metabolic functions within gastrointestinal tract of the animals. 119
131 Chapter 5 Effects of the Antibiotic Tylosin on C-reactive Protein Levels and Carriage of Salmonella enterica in the Pig 120
132 Effects of the Antibiotic Tylosin on C-reactive Protein Levels and Carriage of Salmonella enterica in the Pig Hyeun Bum Kim 1, Randall S. Singer 1, Klaudyna Borewicz 1, Bryan A. White 2, Srinand Sreevatsan 1, Timothy J. Johnson 1, Luis A. Espejo 3, Richard E. Isaacson 1* 1 Department of Veterinary and Biomedical Sciences, College of Veterinary Medicine, University of Minnesota, Saint Paul, MN, USA 2 Department of Animal Sciences, University of Illinois, Urbana, IL, USA 3 Department of Veterinary Population Medicine, College of Veterinary Medicine, University of Minnesota, Saint Paul, MN, USA Submitted to Applied and Environmental Microbiology 121
133 Antibiotic growth promoters (AGPs) have been used in agricultural animal production for about 60 years. AGPs are thought to promote the reduction of opportunistic pathogens and infections in livestock and consequently improve animal health. The objectives of this study were to evaluate if the AGP, Tylosin, reduced the levels of serum C-reactive protein (CRP), a measure of generalized infection and inflammation and whether it lowered the prevalence and load of Salmonella enterica in commercial pigs. The level of CRP in each pig decreased as pigs aged. However, the serum CRP concentrations of the Tylosin treated and non-treated pigs were within range previously observed in clinically normal pigs. There was no significant correlation identified between the levels of CRP and Tylosin treatment. The prevalence of S.enterica in pigs and the number of S. enterica in feces also decreased as pigs got older, but there was no correlation between Tylosin treatments and Salmonella status. 122
134 5.1 Introduction Antibiotics have been used in animal agriculture for more than 50 years and have contributed to the improvement of livestock health and productivity (Kil and Stein, 2010). Antibiotics are routinely used to treat or prevent infections of food animals. Antibiotics fed to livestock at sub-therapeutic doses also act to promote growth by improving feed efficiency (Coates et al., 1963; Cromwell. 2001; Gaskins et al., 2002; Kil and Stein, 2010). The antibiotic Tylosin belongs to the macrolide class of antibiotics, which also includes erythromycin, spiramycin, tilmicosin, and tulathromycin. Tylosin is active against most Gram-positive bacteria, Mycoplasma spp, and a limited number of gram negative-bacteria (Giguere et al., 2006; Stone et al., 2009). In swine production, Tylosin is one of the most commonly used antibiotic growth promoters (AGPs) (Dewey et al., 1999) and is used for the treatment of several diseases including atrophic rhinitis and proliferative enteropathy (Giguere et al., 2006). The use of antibiotics at sub-therapeutic levels exposes bacteria to the compounds over extended periods of time, and this has been demonstrated to contribute to the selection and maintenance of antibiotic resistant bacteria (Dawson et al., 1984; Bager et al., 1997). Because of the importance of antibiotics in the treatment of infections, particularly life-threatening infections, uses that are not for the direct treatment of infections have been considered by some as non-judicious usage. Recently the Food and Drug Administration Center for Veterinary Medicine issued documents stating that AGPs should be phased out of animal agriculture in the U.S (Guidance for industry #209 and #213) (FDA. 2012). 123
135 Despite the debate about the potential risks associated with AGPs, AGPs continue to be used. This is because animals that receive AGPs are believed to be healthier, to have reduced sub-clinical diseases, and to grow more efficiently, all of which may result in animals of more uniform size at the time of slaughter (Casewell et al., 2003). Pigs fed AGPs also have shown reduced morbidity and mortality especially under high disease conditions in young pigs (Kil and Stein, 2010). Pigs that are healthier and of a more uniform size at the time of slaughter might lead to decreased processing errors and reduced carcass contamination, thereby improving human health through fewer foodborne infections (Hurd et al., 2008; Hurd et al., 2012). Therefore, improvements in the health of food animals could significantly reduce human health risks from foodborne pathogens (Singer et al., 2007).. There is a need to better understand the relationship between the use of AGPs and animal health. We investigated the effects of the AGP, Tylosin, in the pig. We hypothesized that tylosin would reduce generalized infection and inflammation and the prevalence of common pathogens in the pig, and as a result, Tylosin would lead to improved health of these animals. Our hypothesis was tested by evaluating if Tylosin reduced levels of serum C-reactive protein (CRP), a measure of generalized infection and inflammation (Gaskins et al., 2002; Petersen et al., 2004). In addition, we evaluated whether the pigs fed Tylosin had a lower prevalence and load of the common zoonotic pathogen, Salmonella enterica. 5.2 Materials and Methods Study Design 124
136 Pigs in two commercial farms located in southwest Minnesota, U.S.A. were used in this study. Pigs were kept in a wean-to-finish barn. This site was selected because pigs could be housed in one building for the whole experimental period without relocation and would be exposed to the same set of microbes. The barns contained 20 pens and each pen had 25 pigs. Pigs were kept in the same pen during the entire sampling period without introduction of any new pigs. A cohort of 60 pigs in four pens (15 pigs per pen) per farm were randomly selected and used in this study. Pairs of each two pens were adjacent and each pair was across the alley. Beginning at 10 weeks of age, pigs in pens #1 and #2 were given feed containing Tylosin (40 ppm) while pigs in pens #3 and #4 received feed without Tylosin. At 16 weeks of age, pigs in group #1 were removed from Tylosin, and pigs in groups #3 began to receive Tylosin. The presence or absence of the Tylosin in the feed was confirmed using a KIS TM test kit (Charm Sciences, Inc, Massachusetts, U.S.A.) at 16 and 22 weeks of age. None of the pigs in either group received any additional therapeutic or non-therapeutic antibiotics. This study was approved by the Institutional Animal Care and Use Committee (IACUC) of the University of Minnesota (Protocol Number 0705A09361) Sample Collection Pigs were ear-tagged for identification, and fresh fecal samples from each of the pigs in the cohort were individually collected from the rectum of the pig. Samples were collected five times over their growth period at 3-week intervals starting when the pigs were 10 weeks old. For measurement of quantity of serum CRP, four pigs in each pen 125
137 from farm 2 were randomly selected and blood was collected five times over their growth period at 3-week intervals starting when the pigs were 10-week old Measurement of Serum C-reactive Protein Concentration To evaluate changes of health status of pigs, the quantity of CRP was measured with a commercial pig CRP ELISA quantification Kit (GenWay, California, U.S.A.) according to the manufacturer's instructions (Chen et al., 2003) Detection and Quantification of Salmonella Salmonella in feces was quantified using a most probable number protocol as previously described (Davies et al., 2000). One gram of feces was serially diluted fivefold in tetrathionate broth (TTB) (Remel, Kansas, U.S.A.). One ml of each dilution was incubated at 41 C for 24 hours in triplicate. One hundred µl was then transferred to 900 µl Rappaport-Vassiliadis R10 broth (Remel, Kansas, U.S.A.) and incubated for 24 hours at 37 o C. Growth from the Rappaport-Vassiliadis R10 broth was streaked on XLT4 agar plates (BD, Maryland, U.S.A.) and incubated at 37 C for 24 hours. Suspect S. enterica colonies were confirmed as S. enterica using API 20E strips (biomerieux SA, Marcy- I Etoiele, France), and by PCR using primers specific for the gene inva (Forward:invA ACAGTGCTCGTTTACGACCTGAAT and Reverse:invA AGACGACTGGTACTGATCGATAAT) (Singer et al., 2006). The PCR mixtures contained 12.5 µl of GoTaq Green Master Mix (Promega, Wisconsin, U.S.A.), 0.2 µm of the primer pairs, and 2 µl of DNA template in a 25µl reaction. Cycling conditions started with an initial denaturation at 95 C for 2 minutes followed by 30 cycles of 95 C for 30 seconds, 126
138 60 C for 30 seconds, and 72 C for 1 minute. A final 7 minutes extension was incubated at 72 C (Chiu and Ou, 1996) Pulsed Field Gel Electrophoresis (PFGE) and Serotyping PFGE was performed as previously described using S. enterica isolates obtained from the pig feces (Ribot et al., 2006). Briefly, PFGE agarose plugs containing whole S. enterica DNA were prepared using SeaKem Gold Agarose (Lonza, Maine, U.S.A.) and the plugs were digested for 18 hours using 50 units of the restriction enzyme XbaI (Roche Diagnostics, Indiana, U.S.A.). The plugs were then placed in a 1% agarose gel and separated by electrophoresis for 18 hours using a CHEF-DR II system (Bio-Rad, California, U.S.A.). The electrophoresis conditions were as follows: initial switch time value of 2.2 seconds, final switch time of 63.8 seconds at a gradient of 6V/cm and included angle of 120. After the electrophoresis, the gel was stained with ethidium bromide solution (50 ug/ml) for 20 minutes. A digital TIFF image of the gel was obtained using an Epichemi 3 Darkroom (Ultra-Violet Products Ltd, Cambridge, UK). DNA from S. enterica serovar Braenderup H9812 was used as a molecular size standard (Hunter et al., 2005). The S. enterica PFGE banding patterns were analyzed using BioNumerics version 6.0 (Applied Maths, Sint-Martens-Latem, Belgium). A dendrogram was generated using the Dice coefficient and UPGMA with the analysis parameters based on 0.5% of optimization and band matching tolerance. Representative isolates from each PFGE type were submitted to National Veterinary Services Laboratories for serotyping (Gaul et al., 2007). 127
139 5.2.6 IncA/C Plasmid Detection in S. enterica Isolates and Measurement of Minimal Inhibitory Concentration (MIC) PCR was used to screen for the IncA/C plasmid replicon using previously described primer sets (Johnson et al., 2007). Template DNA was prepared from S. enterica isolates using a boiling lysis procedure (Johnson and Stell, 2000). The PCR mixture contained 1.25U of Go Tag Flexi DNA Polymerase (Promega, Wisconsin, U.S.A.), 0.2 µm of primer pairs, and 2 µl of DNA template in a 25µl reaction. PCR was performed using an initial denaturing step at 94 C for 5 min, followed by 30 cycles of 94 C for 30 sec, 60 C for 30 sec, and 72 C for 90 sec. The amplified products were separated by electrophoresis in 2% agarose gels at 200V for 1 hr, stained with ethidium bromide, and visualized using an Epichemi 3 Darkroom (Ultra-Violet Products Ltd, Cambridge, UK). The measurement of susceptibility to Tylosin was performed using a broth microdilution method as described by the Clinical and Laboratory Standards Institute (CLSI document M31-A3) (CLSI. 2008). Antibiotic susceptibility testing for 14 other antibiotics was conducted using a broth microdilution method using the NARMS panel (CMV1AGNF, TREK Diagnostic Systems, Ohio, U.S.A.). MIC breakpoints were based on Clinical and Laboratory Standards Institute recommendations (Burton et al., 1996; Rajic et al., 2004; Doran et al., 2006; CLSI. 2011). Escherichia coli ATCC was used for quality control purposes (CLSI. 2011) Statistical Analysis 128
140 Logistic regression with repeated measurements was used to model the probability of Salmonella infection. The initial model included treatment, time, and farm as explanatory variables and all possible 2-way interactions; however interaction terms were eliminated using backward elimination when no statistical significance (p-value >0.05) was found. Compound symmetry was chosen to model the correlation structure between different measurements on the same individual by time using quasi-likelihood information criterion (QIC)(Pan. 2001). The model was fitted using the Genmod procedure in SAS/STAT v.9.2 (SAS Institute Inc, North Carolina, U.S.A.). Two different ANOVA with repeated measurements were used to model 1) the estimated number of Salmonella cells after natural logarithmic transformation, and 2) the serum concentration of CRP. The initial models included treatment, time, farm, and all possible 2-way interactions as explanatory variables. Reduction of models was performed using backward elimination of non-significant interaction terms with a p-value>0.05. Main effects including treatment, time and farm were forced to stay in the model, because they were the variables of interest. Compound symmetry was used to model the working correlation structure of observations within each subject used and it was chosen using the Akaike s information criterion. Model assumptions were evaluated using residual plots. Adjustment for multiple comparisons was performed using the Tukey-Kramer procedure. Models were fitted using the Mixed procedure in SAS/STAT v.9.2 (SAS Institute Inc, North Carolina, U.S.A.). 5.3 Results Serum C-reactive Protein 129
141 The level of serum CRP was measured as a biomarker of generalized infection and inflammation. Overall, CRP levels decreased over the sampling times. However, no significant association was found between the levels of CRP and treatment with Tylosin (Figure 10). The serum CRP concentrations of both groups of pigs were within the range previously observed in clinically normal pigs (< 80ug/ml) (Chen et al., 2003). Figure 10. Serum C-reactive protein concentration Four pigs from each group in Farm 2 were bled at the same time points for the measurement of the CRP level in serum. The quantity of CRP was measured with a commercial pig CRP ELISA quantitation Kit Detection of S. enterica Shedding Pigs and Quantification of Salmonella Load 130
142 The prevalence of pigs shedding Salmonella was more frequent in younger pigs than older pigs in both farms regardless of treatment with Tylosin (Figure 11). A logistic regression model with repeated measurements showed that there was a decrease of the odds of Salmonella shedding over the sampling time period (P<0.01). The prevalence of pigs with Salmonella shedding was higher in farm 2 than farm 1. No statistically significant association was found between the prevalence of pigs shedding Salmonella and Tylosin treatment. MPN analysis demonstrated that the number of S. enterica in fecal samples was greater in younger age pigs than older pigs. In general, the concentration of S. enterica in pig decreased over time regardless of Tylosin treatment (Figure 12). No statistically significant association was found between level of S. enterica and Tylosin treatment or farm. However, variation of the natural logarithmic transformed S. enterica MPN was associated with time (P<0.01). 131
143 Figure 11. Number of Salmonella shedding pigs Salmonella shedding pigs were identified by Salmonella isolation at the end of MPN procedure and confirmed by PCR. (A) Farm 1: Number of Salmonella shedding pigs in Farm 1, (B) Farm 2: Number of Salmonella shedding pigs in Farm 2 132
144 Figure 12. MPN per Salmonella shedding pig in each group Measurement of Salmonella load employed a MPN procedure. (A) Farm 1: MPN per Salmonella shedding pig in Farm 1, (B) Farm 2: MPN per Salmonella shedding pig in Farm 2 133
145 5.3.3 Salmonella PFGE and Serotyping To evaluate how treatment with Tylosin affected S. enterica diversity within the pigs, PFGE and serotyping were used to characterize each S. enterica isolate. Five PFGE types were identified from farm 1, and two PFGE types were identified from farm 2 (Figure 13). Seven representatives of each PFGE type were serotyped (Gaul et al., 2007). Of these serotypes, both farms shared only S. Typhimurium. We found that S. Infantis was the most abundant serotype in farm 1 comprising % of the total S. enterica isolates followed by S. Typhimurium at % and S. Livingstone at 15.38%. In farm 2, two different S. enterica PFGE patterns belonged to different serotypes, S. Typhimurium and S. Manhattan. Each S. enterica serotype comprised % and 48.15% of the S. enterica isolates in farm 2. Four pigs shed different S. enterica PFGE types and S. enterica serotypes at different time points indicating co-circulation with different types of S. enterica during the sampling periods. Overall, the same Salmonella PFGE types and Salmonella serotypes were detected from the same pigs throughout the experimental period regardless of Tylosin treatment. 134

146 Figure 13. Salmonella PFGE and Serotyping A dendrogram were generated using the Dice coefficient and UPGMA with the analysis parameters based on 0.5% of optimization and band matching tolerance. Salmonella PFGE types were serotyped at the National Veterinary Services Laboratories in Iowa U.S.A. Percentage indicates proportion of each serotype within farm. F1: Farm 1, F2: Farm 2 135
ESCHERICHIA COLI RESISTANCE AND GUT MICROBIOTA PROFILE IN PIGS RAISED WITH DIFFERENT ANTIMICROBIAL ADMINISTRATION IN FEED
 ESCHERICHIA COLI RESISTANCE AND GUT MICROBIOTA PROFILE IN PIGS RAISED WITH DIFFERENT ANTIMICROBIAL ADMINISTRATION IN FEED Caroline Pissetti 1, Jalusa Deon Kich 2, Heather K. Allen 3, Claudia Navarrete
USA Product Label CLINTABS TABLETS. Virbac. brand of clindamycin hydrochloride tablets. ANADA # , Approved by FDA DESCRIPTION
 VIRBAC CORPORATION USA Product Label http://www.vetdepot.com P.O. BOX 162059, FORT WORTH, TX, 76161 Telephone: 817-831-5030 Order Desk: 800-338-3659 Fax: 817-831-8327 Website: www.virbacvet.com CLINTABS
Antibiotics & Resistance
 What are antibiotics? Antibiotics & esistance Antibiotics are molecules that stop bacteria from growing or kill them Antibiotics, agents against life - either natural or synthetic chemicals - designed
THE HUMAN MICROBIOME: THE INFECTION PREVENTIONIST S BEST FRIEND
 THE HUMAN MICROBIOME: THE INFECTION PREVENTIONIST S BEST FRIEND Michigan Communicable Disease Conference May 4, 2017 Richard A. Van Enk, Ph.D., CIC Director, Infection Prevention and Epidemiology vanenkr@bronsonhg.org
towards a more responsible antibiotics use in asian animal production: supporting digestive health with essential oil compounds TECHNICAL PAPER
 TECHNICAL PAPER towards a more responsible antibiotics use in asian animal production: supporting digestive health with essential oil compounds www.provimi-asia.com Towards a more responsible use of antibiotics
Martin Chénier, Ph.D. Microbiology. Antibiotics in Animal Production: Resistance and Alternative Solutions
 Faculty of Agricultural and Environmental Sciences Department of Food Science, Department of Animal Science Martin Chénier, Ph.D. Microbiology Antibiotics in Animal Production: Resistance and Alternative
Recommended for Implementation at Step 7 of the VICH Process on 15 December 2004 by the VICH Steering Committee
 VICH GL27 (ANTIMICROBIAL RESISTANCE: PRE-APPROVAL) December 2003 For implementation at Step 7 - Final GUIDANCE ON PRE-APPROVAL INFORMATION FOR REGISTRATION OF NEW VETERINARY MEDICINAL PRODUCTS FOR FOOD
مادة االدوية المرحلة الثالثة م. غدير حاتم محمد
 م. مادة االدوية المرحلة الثالثة م. غدير حاتم محمد 2017-2016 ANTIMICROBIAL DRUGS Antimicrobial drugs Lecture 1 Antimicrobial Drugs Chemotherapy: The use of drugs to treat a disease. Antimicrobial drugs:
Tylvax TIMES MORE POWERFUL. One step ahead. Tylvalosin (as tartrate) Poultry and Swine Division Agrovet Market Animal Health
 Poultry and Swine Division Agrovet Market Animal Health") Tylvax One step ahead Tylvalosin (as tartrate) The minimum inhibitory concentration (MIC) of tylvalosin is 10 times lower than tylosin against Mycoplasma hyopneumoniae. In reference values tylvalosin MIC
Tylvax One step ahead Tylvalosin (as tartrate) The minimum inhibitory concentration (MIC) of tylvalosin is 10 times lower than tylosin against Mycoplasma hyopneumoniae. In reference values tylvalosin MIC
A Unique Approach to Managing the Problem of Antibiotic Resistance
 A Unique Approach to Managing the Problem of Antibiotic Resistance By: Heather Storteboom and Sung-Chul Kim Department of Civil and Environmental Engineering Colorado State University A Quick Review The
Lecture 6: Fungi, antibiotics and bacterial infections. Outline Eukaryotes and Prokaryotes Viruses Bacteria Antibiotics Antibiotic resistance
 Lecture 6: Fungi, antibiotics and bacterial infections Outline Eukaryotes and Prokaryotes Viruses Bacteria Antibiotics Antibiotic resistance Lecture 1 2 3 Lecture Outline Section 4 Willow and aspirin Opium
Interpretation At-a-Glance
 3425 Corporate Way Duluth, GA. 30096 Patient: Jane Doe DOB: September 16, 1960 Sex: F MRN: Order Number: E1210572 Completed: October 05, 2013 Received: September 21, 2013 Collected: September 20, 2013
Reprinted in the IVIS website with the permission of the meeting organizers
 Reprinted in the IVIS website with the permission of the meeting organizers FOOD SAFETY IN RELATION TO ANTIBIOTIC RESISTANCE Scott A. McEwen Department of Population Medicine, Ontario Veterinary College,
Information note regarding the Danish and EU restrictions of non-therapeutical use of antibiotics for growth promotion
 12.08.2009 Information note regarding the Danish and EU restrictions of non-therapeutical use of antibiotics for growth promotion Denmark is a major animal food producer in Europe, and the worlds largest
Drd. OBADĂ MIHAI DORU. PhD THESIS ABSTRACT
 UNIVERSITY OF AGRICULTURAL SCIENCES AND VETERINARY MEDICINE ION IONESCU DE LA BRAD IAŞI FACULTY OF VETERINARY MEDICINE SPECIALIZATION MICROBIOLOGY- IMUNOLOGY Drd. OBADĂ MIHAI DORU PhD THESIS ABSTRACT RESEARCHES
Introduction to Chemotherapeutic Agents. Munir Gharaibeh MD, PhD, MHPE School of Medicine, The university of Jordan November 2018
 Introduction to Chemotherapeutic Agents Munir Gharaibeh MD, PhD, MHPE School of Medicine, The university of Jordan November 2018 Antimicrobial Agents Substances that kill bacteria without harming the host.
Part II SUMMARY OF PRODUCT CHARACTERISTICS. Each tablet contains 25 mg Clindamycin (as Clindamycin Hydrochloride)
") Clindacyl 25mg Tablets Vm 08007/4104 Part II SUMMARY OF PRODUCT CHARACTERISTICS 1. NAME OF THE VETERINARY MEDICINAL PRODUCT CLINDACYL 25 MG TABLETS 2. QUALITATIVE AND QUANTITATIVE COMPOSITION Each tablet
Clindacyl 25mg Tablets Vm 08007/4104 Part II SUMMARY OF PRODUCT CHARACTERISTICS 1. NAME OF THE VETERINARY MEDICINAL PRODUCT CLINDACYL 25 MG TABLETS 2. QUALITATIVE AND QUANTITATIVE COMPOSITION Each tablet
Antibiotic Resistance
 Preparing for the Battle Antibiotic Resistance Joy Jiao Systems Biology, Harvard University World Health Organization Global Report on Antibiotic Resistance, 01: resistance to common bacteria has reached
Principles of Antimicrobial therapy
 Principles of Antimicrobial therapy Laith Mohammed Abbas Al-Huseini M.B.Ch.B., M.Sc, M.Res, Ph.D Department of Pharmacology and Therapeutics Antimicrobial agents are chemical substances that can kill or
Approved by the Food Safety Commission on September 30, 2004
 Approved by the Food Safety Commission on September 30, 2004 Assessment guideline for the Effect of Food on Human Health Regarding Antimicrobial- Resistant Bacteria Selected by Antimicrobial Use in Food
Burton's Microbiology for the Health Sciences. Chapter 9. Controlling Microbial Growth in Vivo Using Antimicrobial Agents
 Burton's Microbiology for the Health Sciences Chapter 9. Controlling Microbial Growth in Vivo Using Antimicrobial Agents Chapter 9 Outline Introduction Characteristics of an Ideal Antimicrobial Agent How
Antibiotic Resistance The Global Perspective
 Antibiotic Resistance The Global Perspective Scott A. McEwen Department of Population Medicine, University of Guelph, Guelph, ON N1G 2W1; Email: smcewen@uoguleph.ca Introduction Antibiotics have been used
An#bio#cs and challenges in the wake of superbugs
 An#bio#cs and challenges in the wake of superbugs www.biochemj.org/bj/330/0581/bj3300581.htm ciss.blog.olemiss.edu Dr. Vassie Ware Bioscience in the 21 st Century November 14, 2014 Who said this and what
Q1. (a) Clostridium difficile is a bacterium that is present in the gut of up to 3% of healthy adults and 66% of healthy infants.
 Clostridium difficile is a bacterium that is present in the gut of up to 3% of healthy adults and 66% of healthy infants.") Q1. (a) Clostridium difficile is a bacterium that is present in the gut of up to 3% of healthy adults and 66% of healthy infants. C. difficile rarely causes problems, either in healthy adults or in infants.
Q1. (a) Clostridium difficile is a bacterium that is present in the gut of up to 3% of healthy adults and 66% of healthy infants. C. difficile rarely causes problems, either in healthy adults or in infants.
Microbiology : antimicrobial drugs. Sheet 11. Ali abualhija
 Microbiology : antimicrobial drugs Sheet 11 Ali abualhija return to our topic antimicrobial drugs, we have finished major group of antimicrobial drugs which associated with inhibition of protein synthesis
Human Food Safety of Veterinary Drugs. Bettye K. Walters, DVM
 Human Food Safety of Veterinary Drugs Bettye K. Walters, DVM Bettye.walters@fda.hhs.gov Pertinent International Resources Organization for Economic Co-Operation and Development (OECD) Understanding the
ANTIBIOTICS USED FOR RESISTACE BACTERIA. 1. Vancomicin
 ANTIBIOTICS USED FOR RESISTACE BACTERIA 1. Vancomicin Vancomycin is used to treat infections caused by bacteria. It belongs to the family of medicines called antibiotics. Vancomycin works by killing bacteria
CHOICES The magazine of food, farm and resource issues
 CHOICES The magazine of food, farm and resource issues Third Quarter 23 A publication of the American Agricultural Economics Association Lessons from the Danish Ban on Feed- Grade Antibiotics by Dermot
INTRODUCTION TO ANIMAL AND VETERINARY SCIENCE CURRICULUM. Unit 1: Animals in Society/Global Perspective
 Chariho Regional School District - Science Curriculum September, 2016 INTRODUCTION TO ANIMAL AND VETERINARY SCIENCE CURRICULUM Unit 1: Animals in Society/Global Perspective Students will gain an understanding
Author - Dr. Josie Traub-Dargatz
 Author - Dr. Josie Traub-Dargatz Dr. Josie Traub-Dargatz is a professor of equine medicine at Colorado State University (CSU) College of Veterinary Medicine and Biomedical Sciences. She began her veterinary
The Microbiome of Food Animals and the Effects of Antimicrobial Drugs
 Microbial Ecology Group The Microbiome of Food Animals and the Effects of Antimicrobial Drugs Paul S. Morley DVM, PhD, DACVIM Professor of Epidemiology and Infection Control / Colorado State University
Global Overview on Antibiotic Use Policies in Veterinary Medicine
 Global Overview on Antibiotic Use Policies in Veterinary Medicine Dr Shabbir Simjee Global Regulatory & Technical Advisor Microbiology & Antimicrobials Elanco Animal Health Basingstoke, England simjeess@elanco.com
Antibiotics. Antimicrobial Drugs. Alexander Fleming 10/18/2017
 Antibiotics Antimicrobial Drugs Chapter 20 BIO 220 Antibiotics are compounds produced by fungi or bacteria that inhibit or kill competing microbial species Antimicrobial drugs must display selective toxicity,
Changing Practices to Reduce Antibiotic Resistance
 Changing Practices to Reduce Antibiotic Resistance Jean E. McLain, Research Scientist and Assistant Dean University of Arizona College of Agriculture and Life Sciences and Department of Soil, Water and
funded by Reducing antibiotics in pig farming
 funded by Reducing antibiotics in pig farming The widespread use of antibiotics (also known as antibacterials) in human and animal medicine increases the level of resistant bacteria. This makes it more
Jefferson County High School Course Syllabus
 A. Course Large Animal Science B. Department CTE- Agriculture C. Course Description Jefferson County High School Course Syllabus Large Animal Science is an applied course in veterinary and animal science
Randall Singer, DVM, MPVM, PhD
 ANTIBIOTIC RESISTANCE Randall Singer, DVM, MPVM, PhD Associate Professor of Epidemiology Department of Veterinary and Biomedical Sciences University of Minnesota Overview How does resistance develop? What
Antimicrobial use in poultry: Emerging public health problem
 Antimicrobial use in poultry: Emerging public health problem Eric S. Mitema, BVM, MS, PhD CPD- Diagnosis and Treatment of Poultry Diseases FVM, CAVS, 6 th. August, 2014 AMR cont Antibiotics - Natural or
COMMITTEE FOR MEDICINAL PRODUCTS FOR VETERINARY USE
 European Medicines Agency Veterinary Medicines and Inspections EMEA/CVMP/211249/2005-FINAL July 2005 COMMITTEE FOR MEDICINAL PRODUCTS FOR VETERINARY USE DIHYDROSTREPTOMYCIN (Extrapolation to all ruminants)
Potential Impacts of Antibiotics in the Environment
 Potential Impacts of Antibiotics in the Environment Amy Pruden Assistant Professor, Civil Engineering, Colorado State University 11 12 R1 R2 10 13 D 9 14 8 15 C R3 R4 7 16 B 6 17 5 A 4 1 3 2 H CNH 2 H
Responsible Use of Veterinary Products. Bettye K. Walters, DVM
 Responsible Use of Veterinary Products Bettye K. Walters, DVM Bettye.walters@fda.hhs.gov Pertinent International Resources Organization for Economic Co-Operation and Development (OECD) Understanding the
Position Statement. Responsible Use of Antibiotics in the Australian Chicken Meat Industry. 22 February What s the Issue?
 22 February 2018 Position Statement Responsible Use of Antibiotics in the Australian Chicken Meat Industry What s the Issue? Antimicrobial resistance (AMR) The use of antibiotics in both humans and animals
Selective toxicity. Antimicrobial Drugs. Alexander Fleming 10/17/2016
 Selective toxicity Antimicrobial Drugs Chapter 20 BIO 220 Drugs must work inside the host and harm the infective pathogens, but not the host Antibiotics are compounds produced by fungi or bacteria that
How your body decides if bacteria are friends or foes
 How your body decides if bacteria are friends or foes How would you feel about: A child eating food that dropped on the ground? A child sucking their thumbs? Take antibiotics without knowing the true reason
Antimicrobial Therapy
 Chapter 12 The Elements of Chemotherapy Topics - Antimicrobial Therapy - Selective Toxicity - Survey of Antimicrobial Drug - Microbial Drug Resistance - Drug and Host Interaction Antimicrobial Therapy
Enteric Clostridia 10/27/2011. C. perfringens: general. C. perfringens: Types & toxins. C. perfringens: Types & toxins
 C. perfringens: general Enteric Clostridia Formerly called C. welchii Thick rods, forming spores Non motile Grow fast Habitats: Soil and sewage and in the intestines of animals and humans Double zone hemolysis
THE BOVINE MILK MICROBIOME. Mark McGuire
 THE BOVINE MILK MICROBIOME Mark McGuire FLOW OF MILK FROM A FARM TO PROCESSOR HOW TO ASSESS PRESENCE OF BACTERIA? Culture-dependent methods Culture-independent methods Rely on molecular techniques and
Visit ABLE on the Web at:
 This article reprinted from: Lessem, P. B. 2008. The antibiotic resistance phenomenon: Use of minimal inhibitory concentration (MIC) determination for inquiry based experimentation. Pages 357-362, in Tested
2017 NAMI Meat Industry Summit, San Diego, CA April 3-5, Keith E. Belk
 2017 NAMI Meat Industry Summit, San Diego, CA April 3-5, 2017 Keith E. Belk Professor & Monfort Chair Center for Meat Safety & Quality Department of Animal Sciences Colorado State University Fort Collins
ANTIBIOTICS IN AQUACULTURE: A (FISH) VETERINARIAN S PERSPECTIVE
 VETERINARIAN S PERSPECTIVE") ANTIBIOTICS IN AQUACULTURE: A (FISH) VETERINARIAN S PERSPECTIVE HUGH MITCHELL, MS, D.V.M. AQUATACTICS FISH HEALTH KIRKLAND, WA HUGHM@AQUATACTICS.COM MISSION STATEMENT OF A FOODFISH VET PRACTICE: To assist
ANTIBIOTICS IN AQUACULTURE: A (FISH) VETERINARIAN S PERSPECTIVE HUGH MITCHELL, MS, D.V.M. AQUATACTICS FISH HEALTH KIRKLAND, WA HUGHM@AQUATACTICS.COM MISSION STATEMENT OF A FOODFISH VET PRACTICE: To assist
Antimicrobials & Resistance
 Antimicrobials & Resistance History 1908, Paul Ehrlich - Arsenic compound Arsphenamine 1929, Alexander Fleming - Discovery of Penicillin 1935, Gerhard Domag - Discovery of the red dye Prontosil (sulfonamide)
Aabo, Søren; Ricci, Antonia; Denis, Martine; Bengtsson, Björn; Dalsgaard, Anders; Rychlik, Ivan; Jensen, Annette Nygaard
 Downloaded from orbit.dtu.dk on: Sep 04, 2018 SafeOrganic - Restrictive use of antibiotics in organic animal farming a potential for safer, high quality products with less antibiotic resistant bacteria
Classification of Bacteria
 Classification of Bacteria MICROBIOLOGY -TAXONOMY Taxonomy is the system to classify living organisms Seven groups kingdom, phylum or div, class, order, family, genus, species Binomial system of nomenclature
COMMITTEE FOR VETERINARY MEDICINAL PRODUCTS
 The European Agency for the Evaluation of Medicinal Products Veterinary Medicines and Information Technology EMEA/MRL/728/00-FINAL April 2000 COMMITTEE FOR VETERINARY MEDICINAL PRODUCTS STREPTOMYCIN AND
Mechanisms and Pathways of AMR in the environment
 FMM/RAS/298: Strengthening capacities, policies and national action plans on prudent and responsible use of antimicrobials in fisheries Final Workshop in cooperation with AVA Singapore and INFOFISH 12-14
Lecture 11 Wednesday, September 19, 2012
 Lecture 11 Wednesday, September 19, 2012 Phylogenetic tree (phylogeny) Darwin and classification: In the Origin, Darwin said that descent from a common ancestral species could explain why the Linnaean
FACT SHEETS. On the Danish restrictions of non-therapeutical use of antibiotics for growth promotion and its consequences
 12 July 2010 FACT SHEETS On the Danish restrictions of non-therapeutical use of antibiotics for growth promotion and its consequences Denmark is a major livestock producer in Europe, and the worlds largest
A-l. Students shall examine the circulatory and respiratory systems of animals.
 Animal Science A-l. Students shall examine the circulatory and respiratory systems of animals. 1. Discuss the pathway of blood through the heart and circulatory system. 2. Describe and compare the functions
Agricultural Research Division, American Cyanamid Company, Princeton, NJ 08540
 1 Antibiotics Use in Agriculture: An Overview Richard H. Gustafson Downloaded via 148.251.232.83 on October 16, 2018 at 00:12:00 (UTC). See https://pubs.acs.org/sharingguidelines for options on how to
Correlation of. Animal Science Biology & Technology, 3/E, by Dr. Robert Mikesell/ MeeCee Baker, 2011, ISBN 10: ; ISBN 13:
 Correlation of Animal Science Biology & Technology, 3/E, by Dr. Robert Mikesell/ MeeCee Baker, 2011, ISBN 10: 1435486374; ISBN 13: 9781435486379 to Indiana s Agricultural Education Curriculum Standards
SUMMARY OF PRODUCT CHARACTERISTICS
 SUMMARY OF PRODUCT CHARACTERISTICS 1. NAME OF THE VETERINARY MEDICINAL PRODUCT Linco-Sol 400 mg/g powder for use in drinking water for pigs and chickens 2. QUALITATIVE AND QUANTITATIVE COMPOSITION Active
SUMMARY OF PRODUCT CHARACTERISTICS
 SUMMARY OF PRODUCT CHARACTERISTICS 1. NAME OF THE VETERINARY MEDICINAL PRODUCT COLICEN 4.000.000 UI/ml solution for use in drinking water/milk 2. QUALITATIVE AND QUANTITATIVE COMPOSITION Each ml contains:
An Optimist s View on How We Will Maintain Broiler Gut Health and Performance in Today s NAE, Food Safety and Regulatory Climate
 An Optimist s View on How We Will Maintain Broiler Gut Health and Performance in Today s NAE, Food Safety and Regulatory Climate Chuck Hofacre, DVM, MAM, PhD The University of Georgia And Southern Poultry
SUMMARY OF PRODUCT CHARACTERISTICS
 SUMMARY OF PRODUCT CHARACTERISTICS 1. NAME OF THE VETERINARY MEDICINAL PRODUCT Metrobactin 500 mg tablets for dogs and cats (AT, BE, BG, CY, CZ, DE, EL, ES, FR, HR, HU, IE, IT, LU, NL, PL, PT, RO, SI,
Bacteriology. Mycology. Genova Diagnostics Europe Parkgate House 356 West Barnes Lane New Malden, Surrey. KT3 6NB. Order Number:
 Genova Diagnostics Europe Parkgate House 356 West Barnes Lane New Malden, urrey. KT3 6NB Bacteriology Lactobacillus species 3+ Escherichia coli 4+ Bifidobacterium 3+ gamma haemolytic treptococcus NP 4+
SUMMARY OF PRODUCT CHARACTERISTICS. Lincomycin (as Lincomycin hydrochloride) Neomycin (as Neomycin sulphate) Excipients Disodium edetate
 Neomycin (as Neomycin sulphate) Excipients Disodium edetate") SUMMARY OF PRODUCT CHARACTERISTICS AN: 00221/2013 1. NAME OF THE VETERINARY MEDICINAL PRODUCT Lincocin Forte S Intramammary Solution 2. QUALITATIVE AND QUANTITATIVE COMPOSITION Active substances Lincomycin
SUMMARY OF PRODUCT CHARACTERISTICS AN: 00221/2013 1. NAME OF THE VETERINARY MEDICINAL PRODUCT Lincocin Forte S Intramammary Solution 2. QUALITATIVE AND QUANTITATIVE COMPOSITION Active substances Lincomycin
Diagnosis, treatment and control: dealing with coccidiosis in cattle
 Vet Times The website for the veterinary profession https://www.vettimes.co.uk Diagnosis, treatment and control: dealing with coccidiosis in cattle Author : Adam Martin Categories : Vets Date : January
Reintroducing bettongs to the ACT: issues relating to genetic diversity and population dynamics The guest speaker at NPA s November meeting was April
 Reintroducing bettongs to the ACT: issues relating to genetic diversity and population dynamics The guest speaker at NPA s November meeting was April Suen, holder of NPA s 2015 scholarship for honours
SELECT NEWS. Florfenicol Monograph: Injectable & Oral Therapy for Swine
 SELECT NEWS Florfenicol Monograph: Injectable & Oral Therapy for Swine Did you know that? Florfenicol is one of the most powerful antibiotics currently available in veterinary medicine with one of the
Pharm 262: Antibiotics. 1 Pharmaceutical Microbiology II DR. C. AGYARE
 Pharm 262: 1 Pharmaceutical Microbiology II Antibiotics DR. C. AGYARE Reference Books 2 HUGO, W.B., RUSSELL, A.D. Pharmaceutical Microbiology. 6 th Ed. Malden, MA: Blackwell Science, 1998. WALSH, G. Biopharmaceuticals:
Enteric Clostridia. C. perfringens: general
 Enteric Clostridia C. perfringens: general Formerly called C. welchii Thick rods, forming spores Non motile Grow fast Habitats: Soil and sewage and in the intestines of animals and humans Toxins More than
Safety of Lactic Starter Cultures used in Algerian Dairy Industry Case Study: Antibiotic Resistance
 Leksir et al. 52 Journal Academica Vol. 3(2), pp. 52-58, August 11 2013 - Food Science - ISSN 2161-3338 online edition www.journalacademica.org 2013 Journal Academica Foundation Full Length Research Paper
SUMMARY OF PRODUCT CHARACTERISTICS. 1. NAME OF THE VETERINARY MEDICINAL PRODUCT Vetrisulf powder for oral solution for chickens, turkeys and geese
 SUMMARY OF PRODUCT CHARACTERISTICS 1. NAME OF THE VETERINARY MEDICINAL PRODUCT Vetrisulf powder for oral solution for chickens, turkeys and geese 2. QUALITATIVE AND QUANTITATIVE COMPOSITION One g contains:
Antibiotic Resistance in Bacteria
 Antibiotic Resistance in Bacteria Electron Micrograph of E. Coli Diseases Caused by Bacteria 1928 1 2 Fleming 3 discovers penicillin the first antibiotic. Some Clinically Important Antibiotics Antibiotic
SUMMARY OF PRODUCT CHARACTERISTICS
 SUMMARY OF PRODUCT CHARACTERISTICS 1. NAME OF THE VETERINARY MEDICINAL PRODUCT DOXYPRIM 40% soluble powder 2. QUALITATIVE AND QUANTITATIVE COMPOSITION Active substance: Doxycycline hyclate 400.0 mg Excipients:
Raw Meat Diet. Transcript:
 Transcript: Raw Meat Diet Hi, this is Dr. Karen Becker, and today we re going to discuss why dogs and cats can eat raw meat. This is probably the most common question I get, especially from uneducated
Effect of EM on Growth, Egg Production and Waste Characteristics of Japanese Quail Abstract Introduction Experimental Procedures
 Effect of EM on Growth, Egg Production and Waste Characteristics of Japanese Quail S. Chantsavang, P. Piafupoa and O. Triwutanon Department of Animal Science, Kasetsart University, Bangkok, Thailand Abstract
4.5. Special precautions for use Special precautions to be taken by person administering the veterinary medicinal product to animals
 1.B1. SUMMARY OF PRODUCT CHARACTERISTICS 1. NAME OF THE VETERINARY MEDICINAL PRODUCT AMOXYCOL Soluble Powder 2. QUALITATIVE AND QUANTITATIVE COMPOSITION Active substances: Amoxicillin trihydrate 640.0
Supplementary Fig. 1: 16S rrna rarefaction curves indicating mean alpha diversity (observed 97% OTUs) for different mammalian dietary categories,
 for different mammalian dietary categories,") Supplementary Fig. 1: 16S rrna rarefaction curves indicating mean alpha diversity (observed 97% OTUs) for different mammalian dietary categories, error bars indicating standard deviations. Odontocetes
Supplementary Fig. 1: 16S rrna rarefaction curves indicating mean alpha diversity (observed 97% OTUs) for different mammalian dietary categories, error bars indicating standard deviations. Odontocetes
What is antimicrobial resistance?
 What is antimicrobial resistance? Gérard MOULIN gerard.moulin@anses.fr French agency for food, environmental and occupationnal safety National agency for veterinary Medicinal Products BP 90203-35302 FOUGERES
Consequences of Antimicrobial Resistant Bacteria. Antimicrobial Resistance. Molecular Genetics of Antimicrobial Resistance. Topics to be Covered
 Antimicrobial Resistance Consequences of Antimicrobial Resistant Bacteria Change in the approach to the administration of empiric antimicrobial therapy Increased number of hospitalizations Increased length
Mr. Heggie Page 1 of 7
 CONTENT STANDARD 13.0 : PARTICIPATE IN LEADERSHIP TRAINING THROUGH MEMBERSHIP IN FFA PERFORMANCE STANDARD 13.1 : RECOGNIZE THE TRAITS OF EFFECTIVE LEADERS AND PARTICIPATE IN LEADERSHIP TRAINING THROUGH
MID 23. Antimicrobial Resistance. Consequences of Antimicrobial Resistant Bacteria. Molecular Genetics of Antimicrobial Resistance
 Antimicrobial Resistance Molecular Genetics of Antimicrobial Resistance Micro evolutionary change - point mutations Beta-lactamase mutation extends spectrum of the enzyme rpob gene (RNA polymerase) mutation
Antimicrobial Resistance: Do we know everything? Dr. Sid Thakur Assistant Professor Swine Health & Production CVM, NCSU
 Antimicrobial Resistance: Do we know everything? Dr. Sid Thakur Assistant Professor Swine Health & Production CVM, NCSU Research Focus Antimicrobial Resistance On farm, Slaughter, Retail, Human Sample
TERMS OF REFERENCE (June 1997, Reviewed 17/9/97) BACKGROUND. (opinion expressed on 05 February 1998)
 BACKGROUND. (opinion expressed on 05 February 1998)") Report of the Scientific Committee for Animal Nutrition on the Efficacy and Risk for Users of the Therapeutic Macrolides Antibiotics Tylosin and Spiramycin Used as Feed Additives (opinion expressed on
Report of the Scientific Committee for Animal Nutrition on the Efficacy and Risk for Users of the Therapeutic Macrolides Antibiotics Tylosin and Spiramycin Used as Feed Additives (opinion expressed on
Antimicrobial Resistance
 Antimicrobial Resistance Consequences of Antimicrobial Resistant Bacteria Change in the approach to the administration of empiric antimicrobial therapy Increased number of hospitalizations Increased length
Antimicrobial Resistance Acquisition of Foreign DNA
 Antimicrobial Resistance Acquisition of Foreign DNA Levy, Scientific American Horizontal gene transfer is common, even between Gram positive and negative bacteria Plasmid - transfer of single or multiple
Antibiotics: mode of action and mechanisms of resistance. Slides made by Special consultant Henrik Hasman Statens Serum Institut
 Antibiotics: mode of action and mechanisms of resistance. Slides made by Special consultant Henrik Hasman Statens Serum Institut This presentation Definitions needed to discuss antimicrobial resistance
Finnzymes Oy. PathoProof Mastitis PCR Assay. Real time PCR based mastitis testing in milk monitoring programs
 PathoProof TM Mastitis PCR Assay Mikko Koskinen, Ph.D. Director, Diagnostics, Finnzymes Oy Real time PCR based mastitis testing in milk monitoring programs PathoProof Mastitis PCR Assay Comparison of the
SUMMARY OF PRODUCT CHARACTERISTICS
 SUMMARY OF PRODUCT CHARACTERISTICS 1. NAME OF THE VETERINARY MEDICINAL PRODUCT Oxycare 20 %w/v LA Solution for Injection 2. QUALITATIVE AND QUANTITATIVE COMPOSITION Active Substance: Oxytetracycline (Equivalent
Exclusion zone for harmful bacteria! Aviguard FOR BROILERS, LAYERS, TURKEYS AND GAMEBIRDS
 Exclusion zone for harmful bacteria! Aviguard FOR BROILERS, LAYERS, TURKEYS AND GAMEBIRDS Where to use Aviguard Aviguard should be used whenever there is a need for establishment or re-establishment of
RESPONSIBILITIES OF THE PRESCRIBING VETERINARIAN
 APPENDIX 15 AUSTRALIAN VETERINARY ASSOCIATION (AVA) CODE OF PRACTICE FOR PRESCRIPTION AND USE OF PRODUCTS WHICH CONTAIN ANTIMICROBIAL AGENTS [Adopted 7 May 2008] INTRODUCTION The purpose of this Code of
SUMMARY OF PRODUCT CHARACTERISTICS
 SUMMARY OF PRODUCT CHARACTERISTICS 1. NAME OF THE VETERINARY MEDICINAL PRODUCT Marbocare 20 mg/ml solution for injection for cattle and pigs (UK, IE, FR) Odimar 20 mg/ml solution for injection for cattle
International Food Safety Authorities Network (INFOSAN) Antimicrobial Resistance from Food Animals
 Antimicrobial Resistance from Food Animals") International Food Safety Authorities Network (INFOSAN) 7 March 2008 INFOSAN Information Note No. 2/2008 - Antimicrobial Resistance Antimicrobial Resistance from Food Animals SUMMARY NOTES Antimicrobial
International Food Safety Authorities Network (INFOSAN) 7 March 2008 INFOSAN Information Note No. 2/2008 - Antimicrobial Resistance Antimicrobial Resistance from Food Animals SUMMARY NOTES Antimicrobial
Objectives. Antibiotics uses in food animals 3/25/2018. California Dairy Productions. Antimicrobial Resistance in the Animal Production Environment
 Antimicrobial Resistance in the Animal Production Environment Xunde Li Western Institute for Food Safety and Security Department of Population Health and Reproduction University of California Davis Objectives
Course Curriculum for Master Degree in Internal Medicine/ Faculty of Veterinary Medicine
 Course Curriculum for Master Degree in Internal Medicine/ Faculty of Veterinary Medicine The Master Degree in Internal Medicine/Faculty of Veterinary Medicine is awarded by the Faculty of Graduate Studies
MICRO-ORGANISMS by COMPANY PROFILE
 MICRO-ORGANISMS by COMPANY PROFILE 2017 1 SAPROPHYTES AND PATHOGENES SAPROPHYTES Not dangerous PATHOGENES Inducing diseases Have to be eradicated WHERE ARE THERE? EVERYWHERE COMPANY PROFILE 2017 3 MICROORGANISMS
Risk management approaches to antimicrobial resistance in the U.S. and abroad
 Risk management approaches to antimicrobial resistance in the U.S. and abroad Expectations, results and conundrums H. Morgan Scott DVM, PhD E.J. Frick Professor of Veterinary Medicine Department of Diagnostic
USA Product Label LINCOCIN. brand of lincomycin hydrochloride tablets. brand of lincomycin hydrochloride injection, USP. For Use in Animals Only
 USA Product Label http://www.vetdepot.com PHARMACIA & UPJOHN COMPANY Division of Pfizer Inc. Distributed by PFIZER INC. 235 E. 42ND ST., NEW YORK, NY, 10017 Telephone: 269-833-4000 Fax: 616-833-4077 Customer
The Future of Antibiotic Alternatives
 The Future of Antibiotic Alternatives @Elanco #feedthe9 Grady Bishop Sr. Director Market Access Elanco 1 The Global Landscape our WHY 2 Today s 3 Food Security Realities 3 The Protein Gap 4 The impact