Request for General Studies Designation for: BIO 113 Dinosaurs
|
|
|
- June Park
- 6 years ago
- Views:
Transcription

1
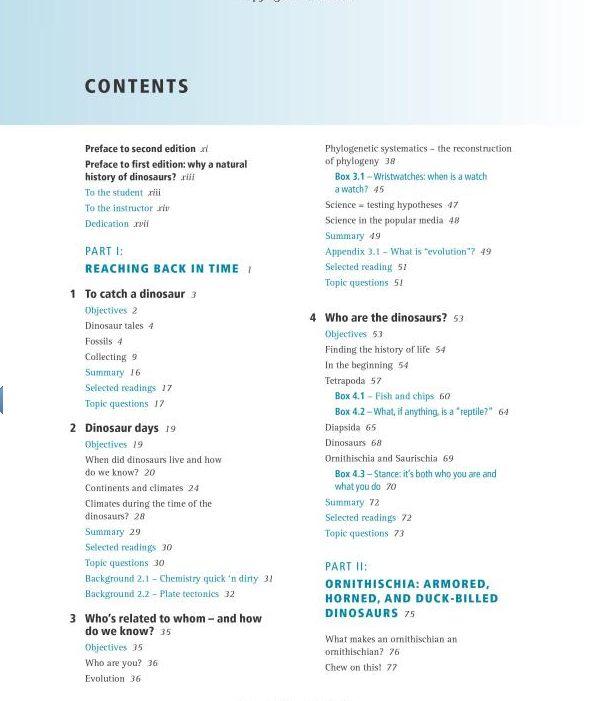
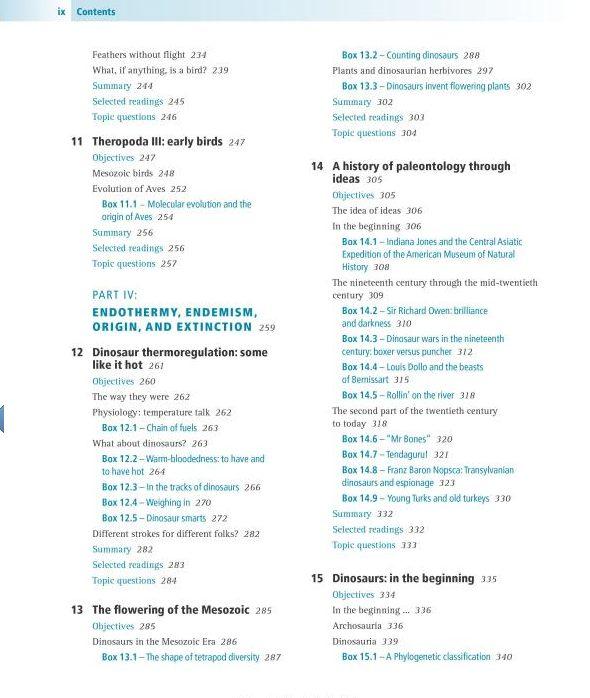
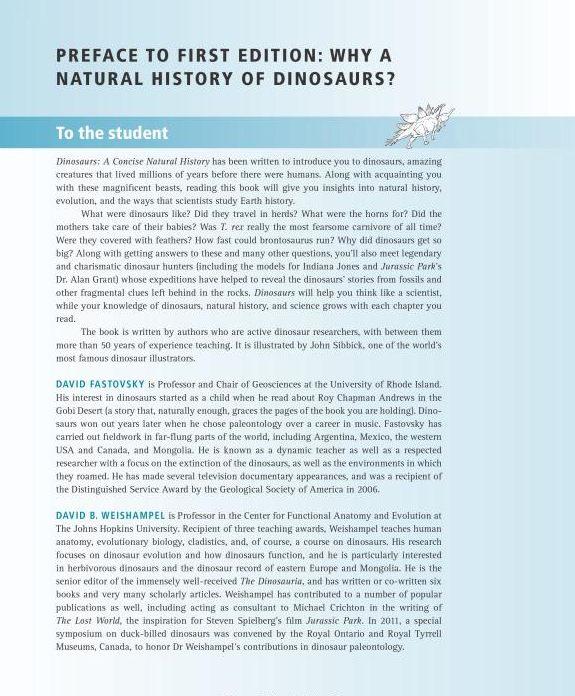
2 Request for General Studies Designation for: BIO 113 Dinosaurs Course Description: Principles of evolution, ecology, behavior, anatomy and physiology using dinosaurs and other extinct life as case studies. Geological processes and the fossil record. Cannot be used for major credit in the biological sciences. Fee. Included Documents: Course Proposal Cover Form Course Catalog Description (this page) Criteria Checklist for General Studies SG designation, including descriptions of how the course meets the specific criteria Proposed Course Syllabus Table of contents (and preface) from the textbook (Fastovsky & Weishampel, 2nd ed.) Selected lab handouts and worksheets
3 Natural Sciences [SQ/SG] Page 4 Proposer: Please complete the following section and attach appropriate documentation. YES NO ASU--[SG] CRITERIA I. - FOR ALL GENERAL [SG] NATURAL SCIENCES CORE AREA COURSES, THE FOLLOWING ARE CRITICAL CRITERIA AND MUST BE MET: 1. Course emphasizes the mastery of basic scientific principles and concepts. 2. Addresses knowledge of scientific method. Identify Documentation Submitted Syllabus; Textbook table of contents; specific lab handouts (see page 5 below) Syllabus; see page 5 below 3. Includes coverage of the methods of scientific inquiry that characterize the particular discipline. Syllabus; Lab handouts; see page 6 below 4. Addresses potential for uncertainty in scientific inquiry. Syllabus; see page 6 below 5. Illustrates the usefulness of mathematics in scientific description and reasoning. Syllabus; Lab handouts; see page 6 below Syllabus: laboratory 6. Includes weekly laboratory and/or field sessions that provide schedule; see page 7 hands-on exposure to scientific phenomena and methodology below in the discipline, and enhance the learning of course material. 7. Students submit written reports of laboratory experiments for constructive evaluation by the instructor. 8. Course is general or introductory in nature, ordinarily at lower-division level; not a course with great depth or specificity. Syllabus; Lab worksheets; see page 7 below Syllabus; Textbook table of contents; see page 8 below II. - AT LEAST ONE OF THE ADDITIONAL CRITERIA THAT MUST BE MET WITHIN THE CONTEXT OF THE COURSE: See page 8 below A. Stresses understanding of the nature of basic scientific issues. B. Develops appreciation of the scope and reality of limitations in scientific capabilities. See page 8 below C. Discusses costs (time, human, financial) and risks of scientific inquiry. Only to a limited extent
4 Natural Sciences [SQ/SG] Page 5 [SG] REQUIREMENTS CANNOT BE MET BY COURSES: Presenting a qualitative survey of a discipline. Focusing on the impact of science on social, economic, or environmental issues. Focusing on a specific or limiting but in-depth theme suitable for upper-division majors. Course Prefix Number Title Designation BIO 113 Dinosaurs SG Explain in detail which student activities correspond to the specific designation criteria. Please use the following organizer to explain how the criteria are being met. Criteria (from checksheet) How course meets spirit (contextualize specific examples in next column) Please provide detailed evidence of how course meets criteria (i.e., where in syllabus) 1. Course emphasizes the mastery of basic scientific principles and concepts. 2. Addresses knowledge of scientific method. The course will emphasize understanding evolutionary principles including natural selection, adaptation, and phylogenetic relationships. Various other topics in animal biology will be explored as well, including basic principles of anatomy and physiology (including the relationship between diet and anatomy, adaptations for flight, and thermoregulation), growth and and development, ecology, and animal behavior (including social behavior, parental care, and sexual selection). The basic process of the scientific method is explicitly covered in the lecture portion of the class; the scientific method is applied throughout course as we ask how we our understanding of extinct organisms comes about and address specific controversies. See lecture and lab schedules of syllabus and table of contents of textbook. Labs will specifically address the following: stratigraphy and isotope dating (Lab 3); natural selection (with a simulation experiment), and phylogenetic analysis (Lab 4); Species diversity and community structure (Labs 5-6); allometry and effects of size (Lab 13, though I plan on expanding this lab). In addition, all of the labs focused on diversity ask students to provide adaptive interpretations for morphology and relate the evolution of particular traits to phylogenies. Relevant lab handouts are attached. Week 1 of lecture schedule. Laboratory worksheets will require students to formulate and adaptive and phylogenetic hypotheses. The field trip and followup labs (Labs 5-6) will involve students collecting data to test specific hypotheses about the distribution of fossil marine invertebrates. Page 5
5 Natural Sciences [SQ/SG] Page 6 Criteria (from checksheet) How course meets spirit (contextualize specific examples in next column) Please provide detailed evidence of how course meets criteria (i.e., where in syllabus) 3. Includes coverage of the methods of scientific inquiry that characterize the particular discipline. 4. Addresses potential for uncertainty in scientific inquiry. 5. Illustrates the usefulness of mathematics in scientific description and reasoning This course in is especially well suited for this, since we will frequently ask how we know about various aspects of dinosaur biology. It will include how fossils are dated, how exinct organisms are reconstructed, how we determine evolutionary relationships, how we can determine diet and lifestyles of extinct organisms. Again, this course is especially well suited for addressing uncertainty, as there is much we don t and can t know. Our views of dinosaurs have changed dramatically in the past decades, even the way they are reconstructed. Comparisons of traditional and more modern views will be made extensively in lecture and to a lesser extent in lab (by for example comparing older and newer models). There will also be substantial emphasis on distinguishing what is conjecture vs. what is known more definitively. Mathematical approaches will be used in phylogenetic analysis, estimating the age of rocks (using half life decay), characterizing community structure (based on fossils collected during field trip), descriptive statistics and basic hypothesis testing (using graphs with standard errors), extrapolating dinosaur mass from scale models, and allometric relationships of body size and other morphological characteristics. Stratigraphy and dating will be investigated using real and simulated data to determine relative and absolute ages (Lab 3). Phylogenetic thinking (i.e., evolutionary relationships) will be introduced in lecture and Lab 4, and emphasized in all subsequent labs. In Lab 8, students compare tooth measurements of dinosaurs & modern animals to determine probable diets. Relevant lab handouts are attached. Lecture includes topics such as warm-blooded dinosaurs, social behavior and extinctions where there is much debate. Lab worksheets ask students to consider which aspects of the models are likely to be well-supported by evidence and which are more conjectural. The lab analyzing the field-collected fossils includes very basic statistical analysis for measuring variation and comparisons. Relevant lab handouts are attached. Quantitative approaches are included in Labs 3 (radioisotope problems), Lab 4 (natural selection and phylogenetic analysis), Lab 6 (analysis of fossils collected on field trip), Lab 8 (tooth shape comparisons as they relate to diet), Lab 13 (estimation of dinosaur mass by scaling from models and allometric relationships between body mass and leg size) and Lab 15 (evolutionary changes in primate brain size). Relevant lab handouts are attached. Page 6
6 Natural Sciences [SQ/SG] Page 7 Criteria (from checksheet) How course meets spirit (contextualize specific examples in next column) Please provide detailed evidence of how course meets criteria (i.e., where in syllabus) 6. Includes weekly laboratory and/or field sessions that provide hands-on exposure to scientific phenomena and methodology in the discipline, and enhance the learning of course material. 7. Students submit written reports of laboratory experiments for constructive evaluation by the instructor. Labs will meet every week, except for one week in which students take a self-guided tour and answer questions at the Arizona Museum of Natural History (which lets them observe complete dinosaur skeletons and other fossils we don t have in lab). Hands on work will involve observations of actual fossils, fossil casts (replicas), field collection of invertebrate fossils (near Payson, AZ), observations of skeletons and skulls of living species, as well as scale models of extinct animals. Even in the 3 labs involving mostly scale models, students will be asked to think phylogenetically and to question the accuracy and validity of aspects of the models. Written reports include a lab report that is completed at home using data collected on the field trip and subsequent lab. All other labs have worksheets that require written answers; these are due either at the end of the lab or in the following lab period. See Lab schedule and Assignments and grading sections of syllabus. Techniques include field excavations of invertebrate fossils using defined plots, direct measurements (using calipers) of fossil, fossil replicas, and modern animal specimens (e.g. Labs 5, 6, 8, and 15), as well as opportunities to directly handle various actual invertebrate and vertebrate fossils and replicas. Syllabus: Assignments and grading section. Relevant lab worksheets are attached Page 7
7 Natural Sciences [SQ/SG] Page 8 Criteria (from checksheet) How course meets spirit (contextualize specific examples in next column) Please provide detailed evidence of how course meets criteria (i.e., where in syllabus) 8. Course is general or introductory in nature, ordinarily at lower-division level; not a course with great depth or specificity Students will need to know only the broadest groups of dinosaurs and other extinct vertebrates, and will not be expected to know detailed classification or dinosaur diversity. Instead, emphasis will be placed on understanding various geological and biological principles as they pertain to dinosaurs. These include plate tectonics and geological cycles, stratigraphy and radioisotope dating, evolution including natural selection, adaptation, speciation, macroevolution, extinctions, and phylogenies ecomorphology (how anatomy relates to ecology & lifestyle), anatomical principles, physiology (the warm vs cold blooded debate will be especially emphasized), and behavior. The current textbook is specifically written for a general audience. See textbook preface and table of contents. Note that only three labs (9-11) emphasize diversity. The 4-5 weeks of lecture devoted to dinosaur diversity is integrated with discussions of biological principles best illustrated by that group of dinosaurs (e.g. the role of sexual selection in the evolution of horned dinosaurs). No previous course work will be required and the course will not count towards any of the majors in the natural sciences. There will not be any comprehensive lab practical exams that test dinosaur identification (only weekly quizzes). A. Stresses understanding of the nature of basic scientific issues. See items 3 and 4 above See items 3 and 4 above B. Develops appreciation of the scope and reality of limitations in scientific capabilities. C. Discusses costs (time, human, financial) and risks of scientific inquiry. Studying past life has many inherent limitations that will be addressed throughout this course. Students will be expected to consider what aspects of an organism s biology as well supported by evidence and which are mere conjecture. Will be covered in a limited way in lecture. See item 4 above Specific topics that touch on this are the time and effort involved in extracting and preparing fossils (lecture photos and video) and dissiculties and costs of the Central Asiatic Expeditions of the 1920s (video). Page 8
8 Arizona State University West Campus BIO 113: Dinosaurs Fall 201x Course Syllabus Instructor: Dr. Udo M. Savalli Office: FAB N138A; Office hours:! [5-6 hours to be determined depending on schedule], or by appointment or Course web site: (Also accessible via Blackboard) Required Text & Supplies: D.E. Fastovsky & D.B. Weishampel Dinosaurs: A Concise Natural History, 2nd ed. Cambridge Univ. Press.! 4 Scantron forms: 882-E (100 item) Description: Principles of evolution, ecology, behavior, anatomy and physiology using dinosaurs and other extinct life as case studies. Geological processes and the fossil record. Cannot be used for major credit in the biological sciences. Fee. General studies: SG. Course Objectives and Expected Learning Outcomes: Dinosaurs are familiar to all even though they have been extinct for 65 million years. In this class we will study what we know and what we don t know about dinosaurs. In particular, we will emphasize the techniques used to study dinosaurs and how we can use modern species to better understand what dinosaurs might have been like. Students will understand the scientific method and how it can be applied to testing hypotheses about long-extinct animals.! Students will understand key scientific principles in evolution, ecology, animal behavior, anatomy, physiology, physics, and geology. Of particular importance are the theories of evolution and continental drift and how they inform our interpretation of the fossil record. Laboratories will use a combination of actual fossils, modern animal analogs, and scale models to study the biology of not only dinosaurs, but also other extinct organisms and evolutionary processes. Students will derive simple phylogenies, and use phylogenetic hypotheses to trace the evolution of particular characteristics. Concepts such as homology and convergent evolution will be stressed. Students will understand the geological cycle and the processes of fossilization and the biases inherent in the fossil record. Students will apply methods of relative and absolute (radioisotope) dating to simulated data to determine the age of fossils. Students will collect data from models to understand allometry and how body size affects various aspects of an organism s biology. Weekend field trip: A half-day field trip to a fossil collecting site near Payson, AZ will be required. Closed-toed shoes are required. Transportation to and from the field site is the responsibility of the students. If you have a medical condition that places you at an increased risk of harm, please bring documentation and suggestions for minimizing risk to the instructor. Only students enrolled in the course may attend the field trip; friends and family are not permitted for insurance reasons and to ensure a disruption-free learning environment.
9 Independent Museum Assignment: In lieu of a regular laboratory, students will also be expected to independently complete an assignment at the Arizona Museum of Natural History in Mesa, AZ. Students can complete this assignment at any time of their choosing prior to its due date. Transportation to and from the museum is the responsibility of the students. Students are welcome to bring friends and family members with them to the museum so they may show off their newly gained knowledge. Assignments & Grading: Grades will be based on a combination of both lecture and laboratory performance. Lecture exams will be based on the material presented in lecture and your readings (but not laboratory material). Exams will be primarily multiple choice using Scantron forms. Use or accessing of cell phones, PDAs and similar electronic devices is strictly prohibited during exams. Lab quizzes: Students will take a brief quiz online via Blackboard prior to each laboratory. Each quiz will cover material learned in the previous lab as well as the materials provided for the upcoming lab. Video worksheets: On occassion, a video may be shown during class. During the video students will be expected to fill out a worksheet. Students missing lecture on a day with a video will not be able to make up the worksheet unless they have an excusable absence. Laboratory worksheets and problem sets: Students will complete worksheets analyzing and interpreting the results of laboratory investigations. Students are expected to provide statistical summaries of data where appropriate. Depending on the nature of the laboratory, some assignments will be completed entirely in lab and turned in at the end of lab. In other cases, there will be additional analysis and problem sets that students must complete after lab. Course Grading: Course grades will be based upon an average score of the following: pts each! 300 Comprehensive Final Exam! In-class video pts each! pts each! lab worksheets/problem 30 pts each! laboratory 20 pts each! 220 Independent museum worksheet! 30 TOTAL! 880 Course Grades will be based on the following scale:! %! A+! "93 - <98%! A! "90 - <93%! A! "88 - <90%! B+! "83 - <88%! B! "80 - <83%! B! "77 - <80%! C+! "70 - <77%! C! "60 - <70%! D! 0 - <60%! E Missed Examinations: Students missing exams or assignments will get a grade of 0 except for exceptional circumstances (such as illness or death in the immediate family; written documentation will be required). If a religious observance or University sanctioned activity prevents students from taking an exam on a specified day, students must make alternative arrangements with the instructor prior to the exam. Unless the student can arrange to take a lecture exam before it is returned to the class (usually the next class period), makeups (for excused absences only) will be given at a day and time determined by the instructor.
10 Late Assignments: Assignments are due at the start of class on the day indicated on the assignment or announced in class. Work turned in after the due date and time will be severely penalized (minimum of 10% per day) and will not be accepted at all once assignments have been graded and returned to students. Exceptions may be made for serious illness or other extenuating and documented circumstances, at the instructor s discretion. Attendance: Attendance is essential to success in this class. If you miss a lecture class it is your responsibility to get notes from a classmate as well as any announcements and handouts (most handouts can be downloaded from the course web site). Laboratory attendance is mandatory to pass this course! Due to the nature of these laboratories, missed laboratory sessions cannot be made up. Students will not receive credit for any assignments pertaining to the missed lab. Should medical or personal reasons, religous observances, or Universitysanctioned activity prevent you from attending the laboratory, a written note from a doctor or other written evidence must be submitted. In such a case the worksheet or other assignment may be accepted or excused (with the course grade prorated). Please contact the instructor ahead of time (or if that is not possible, as soon as possible afterwards), if you must miss a laboratory period. Students missing more than three laboratories for any reason will not pass this class. Students arriving late or leaving early will lose points on the relevant assignments. Classroom behavior: Students that disrupt the class such as by excessive talking may be asked to leave. Be sure to turn off any cell phones before coming to class: students whose cell phones ring or who are talking on a cell phone during class may be asked to leave; repeated offenses are subject to additional grade penalties. Students with special circumstances (e.g. sick family member) that requires phone access or leaving early should inform the instructor before class begins. Students are expected to exhibit the same behavior on field trips as they would in a classroom. Threatening or violent behavior that interferes with a safe learning environment, damages property, or prevents the conduct of the class will not be tolerated. Students that engage in such behavior will be asked to leave and may face withdrawal from the class and their actions reported to the ASU Police and Office of Student Rights and Responsibilities. Withdrawal Policy: It is the students responsibility to withdraw themselves from the course should this be necessary. The deadline for unrestricted withdrawal is [November 2]. Incomplete Policy: An incomplete grade (I) will only be given to a student that has completed a substantial portion of the class with a grade of C or higher and who is unable to complete the course requirements due to illness or extenuating non-academic circumstances. Documentation will be required. Disabilities: Students that need accomodation for disabilities must be registered with the Disability Resource Center and submit appropriate documentation from the DRC. Cheating will NOT be tolerated! Although students are encouraged to colaborate during laboratories, all take home assignments, exams and quizzes must represent one s own work unless indicated otherwise by the instructor. At a minimum, students should expect a grade of 0 for any assignment in which students violated the code of academic integrity. For more information, students should consult the ASU Student Academic Integrity Policy at:!!
11 BIO 113 Lecture Schedule (Dates Based on Fall 2011)! Week of:! Topic! Reading*! Aug 19! Course Introduction! 1! Aug 22-26! What are dinosaurs? Scientific method; History of dinosaur exploration!1, 14! Aug 29-Sep 2! How fossils are formed; Stratigraphy and the age of rocks! 1-2! Sep 7-9! Geological History of Earth; Plate tectonics! 2!! Sep 5: Labor Day No Class! Sep 12-16! Principles of evolution; Understanding evolutionary trees! 3! Sep 19-23! Vertebrate anatomy: skeletons and movement! 4!! EXAM 1: September 21! Sep 26-30! Vertebrate relationships: dinosaurs and their relatives! 4, 15! Oct 3-7! Dinosaur diets; Dinosaur diversity: armored dinosaurs! (75-84); 5! Oct 10-14! The sex lives of dinosaurs; Dinosaur diversity: horned dinosaurs! 6! Oct 17-21! Dinosaur diversity: duckbills; raising babies! 7! Oct 24-28! EXAM 2: October 24!! Dinosaur diversity: the primitive long-necks! 8! Oct 31-Nov 4! Dinosaur diversity: the giants and the problem of being big! 8! Nov 7-9! Dinosaur diversity: the meat eaters! 9!! Nov 11: Veteran s Day No Class! Nov 14-18! Feathered dinosaurs and the origin of birds! 10-11! Nov 21-23! Dinosaur physiology: the warm-blooded debate! 12!! Nov 25: Thanksgiving No Class!Nov 28-Dec 2! Dinosaur ecology: how they influenced their environment! 13!! EXAM 3: December 2! Dec 5! The Cretaceous-Tertiary extinction! 15! Dec 12! FINAL EXAM: 9:50-11:40 pm *Chapters (pages) in Fastovsky & Weishampel Dinosaurs: A Concise Natural History
12 BIO 113 Laboratory Schedule (Dates Based on Fall 2011) Date: Topic Assignments Aug 24 Introduction and laboratory safety None Aug 31 Rocks and fossils In-class worksheet Sep 7 Estimating the age of rocks Radioisotope dating problem set Sep 14 Phylogenetic methods Phylogenetic analysis problem set Sep 21 No lab (field trip on following weekend) Sep 24 Sep 28 Weekend fossil hunting trip Variation and diversity in a fossil community: analysis of field trip data Invertebrate fossil community worksheet Oct 5 The vertebrate skeleton In-class worksheet Oct 12 Diet and tooth morphology In-class worksheet Oct 19 Dinosaur relatives and the dawn of dinosaurs In-class worksheet Oct 26 The herbivorous dinosaurs: Ornithischians and Sauropods In-class worksheet Nov 2 The meat-eating dinosaurs: Theropods In-class worksheet Nov 9 Archaeopteryx and the evolution of birds In-class worksheet Nov 16 Nov 23 Estimating the mass of dinosaurs Self-guided tour of the Arizona Museum of Natural History Mass estimation worksheet & problem set Independent Worksheet Nov 30 Human evolution Estimating brain size worksheet
13
14
15
16
17
18
19

20
21 Page 1 Supplemental Documentation For Bio 113 SG Designation This document contains selected Lab Handouts and Lab Worksheets in support of General Studies Natural Sciences (SG) classification for BIO 113. These were used for LSC 294 (Special Topics: Dinosaurs). I have only included those labs and worksheets that specifically document specific criteria on the Natural Sciences (SG) checklist, rather than the entirety of the course. Contents:! Lab (topic):! Page: Lab 3 Handout & Worksheet (Stratigraphy and dating)! 2 Lab 4 Handout & Worksheet (Natural selection & phylogenetics)! 16 Lab 5 Handout (Fossil collecting field trip)! 34 Lab 6 Handout (Analysis of a fossil community)! 36 Lab 8 Handout & Worksheet (Diets and teeth)! 44 Lab 9 Worksheet (Prehistoric reptile diversity)! 59 Lab 10 Worksheet (Herbivorous dinosaur diversity)! 65 Lab 11 Worksheet (Carnivorous dinosaur diversity)! 71 Lab 13 Handout & Worksheet (Size and allometry)! 77 Lab 15 Handout & Worksheet (Human evolution)! 88
22 LSC 294 Dinosaurs! Page 1 Introduction. Lab 3 Aging Rocks As scientists began to study the earth and fossils in the 18 th and 19 th centuries, it was noticed that rocks often formed layers (strata) of different types, and that certain fossils were often specific to particular layers of rocks. The study of such layering is called stratigraphy. The key implication of this layering of fossils is that different fossils are of different ages. Thus, the layering of rocks and their fossils gives a picture of the history and evolution of life. To understand this history, it is important to know how old fossils are. There are two types of dating in use. Relative dating determines the chronological sequence of sediments and fossils, that is, which are older and which are younger, while absolute dating establishes the actual age, in years, of particular layers of rock. Historically, relative dating was established long before we were able to determine the age of rocks, and remains the basis for naming the geological time periods. As geologists studied these layers of rocks and fossils, they noticed that there were times when there were abrupt and widespread changes in the kinds of fossils present. This enabled them to begin to categorize geological time into eons, eras, periods, epochs, and so forth. It has only been in the early to mid 20th century, with the development of radiometric dating, that it has been possible to assign dates to these time periods. Geologists divide the history of earth first into four eons (Table 1). The Hadean represents the earliest part of Earth s history, before we have evidence of life. Next is the Archean eon, from 3.8 to 2.5 billion years ago, in which life consisted of very simple organisms and oxygen was still scarce. The Proterozoic eon covers relatively simple organisms, but the presence of oxygen and more complex cells. Finally, the most recent eon is the Phanerozoic, which covers the time when complex animal life was abundant, beginning 540 mya (million years ago). Everything prior to the Phanerozoic is sometimes simply lumped together as the Precambrian. The Phanerozoic eon is subdivided into three eras: the Paleozoic, from 540 to 245 mya, the Mesozoic, from 245 to 65 mya, and the Cenozoic, which extends into the present. Dinosaurs (excluding birds) existed only in the Mesozoic era. Each era is further subdivided into periods. The Mesozoic era, for example, is subdivided into the Triassic, Jurassic, and Cretaceous periods. Periods can be further subdivided into epochs. Except during the Cenozoic, epochs are usually just named early, middle, and late (or lower, middle, and upper). Epochs are subdivided into stages. On a more regional level, particular layers of rocks that share common characteristics and of the same age are called formations.


23 LSC 294 Dinosaurs! Page 2 Figure 1. The geological time scale. Relative Dating. Relative dating relies on the natural layering, or stratification, of rocks. The oldest rocks will be at the bottom, with the newer layers deposited on top of the older layers. The position within a series of layers can determine the age of a layer of rock relative to the other layers. By itself, this method, called lithostratigraphy, only allows for the relative ages of fossils from a single location, although sometimes individual layers of rock can be recognized and followed for up to 100s of miles. To compare (correlate) the ages of distant sites, geologists use indicator fossils. These are distinctive, abundant organisms that are widespread (often in marine envi-
24 LSC 294 Dinosaurs! Page 3 ronments) and that change quickly over time. The presence of the same indicator fossils in rocks at two different locations indicates that the rocks are of the same age. This method is called biostratigraphy. While any kind of fossil can be used as an indicator, the most useful are often small (often microscopic) marine organisms (such as diatoms, conodonts, etc.), pollen and other plant parts, and the teeth of small mammals. Biostratigraphy can indicate the relative age of rocks even from different areas of the globe but does not provide information about the absolute age of the rocks. Exercise 1: Biostratigraphy and Geological Time Scales. 1. You will work in groups of 2-3 students for this exercise. Each group should occupy their own lab bench. 2. Obtain a set of 24 sheets that each illustrate a schematic view of selected strata from four regions: Europe (France, Germany, Russia), Great Britain (England and Wales), Eastern North America (New York to the southern Appalachians) and Western North America (Texas to South Dakota), as well as location and time period labels. These sheets represent key geological strata described from the late 1700s into the very early 1900s. 3. Begin by placing the four location headings at one end of the lab bench. These will represent the top of the four location columns of your geological chart. Europe and Great Britain should be on one side of the bench, with the United States on the other side. 4. Now begin placing the sheets in their geological sequence, beginning with Europe and Great Britain. You can place sheets adjacent to one another if the lower strata of one sheet contains the same fossils as the upper strata of the sheet below. In this way, you can chronologically link strata from different locations. If strata do not have linking fossils, you should not connect them, as there may be a gap or you may have the wrong sequence. Use the British strata (aligned by shared indicator fossils) to help span the gaps in the European strata. 5. For the American strata, use shared fossils (indicator fossils) to align them horizontally with their corresponding European strata. Note that there may be gaps in the sequences of strata. 6. Determine the geological eras and periods represented by the strata. Note that historical descriptions on the back of the European and some British sheets will give clues to the names of the time periods they represent. 7. Once you have successfully completed your geological strata chart, have your instructor check it.
.")

25 LSC 294 Dinosaurs! Page 4 Exercise 2: Interpreting a Stratigraphic Sequence. 1. The diagram at right illustrates the stratigraphy of fossils of foraminiferans tiny single-celled organisms with distinctive shells from the Oligocene to Miocene epochs (of the Cenozoic Era). Some of the foraminiferans and the time intervals (stages) they indicate are shown in the chart below. Figure 2. Stratigraphy of a marine deposit. Total height is 10 m. 2. Using colored pencils, draw horizontal lines across the stratigraphic sequence at the right to indicate the boundaries between the different stages (Lattorfian, etc.). 3. During which stage, the Aquitanian or Burdigalian, were sediments deposited more rapidly? (Hint: the rate at which sediments are deposited determines the thickness of the strata.) 4. During which stage(s) was Bolivina marginata (illustrated at left) present? 5. Do any of the foraminiferans show a gap in their distribution (i.e., have a period in which they are absent between times when they are present)? If so, sketch any that do. 6. What might be a biological (not geological) reason to explain such a gap in distribution?
26 LSC 294 Dinosaurs! Page 5 Absolute Dating: Basics of Radioactive Decay. Absolute or numerical dating or chronostratigraphy involves the use of radiometric dating: the determination of the age of the rocks, in years using the amounts of various radioactive isotopes. To understand this technique, we must first cover some background. All matter on earth is composed of fundamental units called atoms. Each atom has a nucleus composed of one or more protons and some number of neutrons, each with the same weight of 1 atomic unit. These are surrounded by very tiny electrons. There are 92 naturally occurring types of atoms; each type is referred to as an element (there have been an additional 26 or so elements synthesized briefly in particle accelerators but not seen in nature). All matter is thus composed of various combinations of these elements. For example, water, H 2 O, is composed of two elements: hydrogen and oxygen (with two hydrogen atoms attached to one oxygen atom). The elements differ from one another by the number of protons in the nucleus of the atom. For example, carbon always has 6 protons and oxygen always has 8 protons. Isotopes are atoms of the same element (that is, they have the same number of protons), but differ in the number of neutrons. Unlike protons, neutrons do not have much effect on the chemical properties of atoms, but they do affect their weight. For example, the element carbon (C) has 6 protons (by definition), and can have 6, 7, or 8 neutrons. Thus, there are three possible isotopes of carbon: 12 C, 13 C, and 14 C (note that the atomic mass the combined number of protons and neutrons is written as a superscript before the symbol for the element). Some isotopes are stable atoms, while others are unstable: they undergo a process of radioactive decay in which they release energy and subatomic particles. As they decay, atoms can release neutrons or protons or convert protons into neutrons and vice versa. Thus, radioactive decay results in a change their atomic mass and/or a change into a different element. For example, 12 C is a stable isotope of carbon and does not decay, but 14 C is a radioactive isotope and decays into 14 N (nitrogen) by converting one of its neutrons into another proton (thus giving it 7 protons and making it a nitrogen atom). 14 N is stable and does not undergo any further decay. Radioactive decay is useful for dating rocks because radioisotopes decay at known rates. The decay of individual atoms is actually a random process with a certain fixed probability. Thus, a more or less constant proportion of atoms will decay in any given time period, rather than a fixed amount. If there are fewer atoms to begin with, fewer atoms will decay. This rate of decays is described as the half-life, the amount of time it takes one half of the isotope to decay (this is a constant, and is independent of how much isotope one starts with) (Figure 3). The half-life of 14 C is is 5730 years. If one starts with 10 g of pure 14 C, after 5730 years there will be 5 g remaining, and after a total of 11,460 years there will be 2.5 g remaining. After this time, one would have 7.5 g of 14 N
27 LSC 294 Dinosaurs! Page 6 Figure 3. Isotope decay curves. As the parent (starting radioisotope) decays, it decreases in amount at the same rate as the daughter product isotope increases. This is Fig. 2.1 of your text. instead. If the starting amount and current amount of isotope, as well as its half-life, are known, these can be used to determine the date when the isotope became part of the mineral (or organism for 14 C). For example, if the ratio of 14 C relative to the amount of 12 C (typically around 1 14 C atom per 1 trillion carbon atoms) in a sample of old wood is ⅛ of the normal atmospheric amount (New 14 C is generated at a roughly constant rate in the upper atmosphere by cosmic rays interacting with nitrogen atoms), then the age of the wood is approximately 3 half-life periods (! of! of!), or about 17,000 years since the tree died and stopped taking up carbon. Exercise 2: Radioactive decay simulation. 1. Complete the following simulation in class. Do not leave until it has been checked by your instructor. You may work with a lab partner 2. We will simulate the radioactive decay of atoms using coins. Heads will represent the parent radioisotope, and tails will represent the stable product. Begin with 100 (theoretical) coins that are all heads (radioisotopes). You will flip the coin to determine if it has undergone radioactive decay. Since each coin has a 50% chance of coming up tails, you would expect about half of each set of coins to decay. Each bout of coin flipping thus represents one half life. 3. Flip each of these coins once, noting if the result is head or tail. (You will probably not have 100 coins available, so instead just use one coin that you flip 100 times, but record the number of heads and tails for the first half life period. 4. Any coins that came up tails will remain tails (since these represent a stable isotope). For each head that you flipped, flip those coins again, and once again note the number of heads and tails.
28 LSC 294 Dinosaurs! Page 7 5. Repeat the process for 8 more generations (or until you have no more heads), flipping only the heads again. 6. Calculate the cumulative number of tails by adding the number generated in the current generation by the total generated in the previous generation (if you have no more heads, the the cumulative number of tails should be 100). 7. In the graph below, plot the change in the number of parent radioisotopes (heads) and number of stable daughter isotopes (tails) per half lives. # of Half lives # Heads (parent radioisotopes) # Tails (stable daughter isotopes Cumulative number of tails
29 LSC 294 Dinosaurs! Page 8 Absolute Dating: Calculating the Age of Rocks. Usually it is not practical to figure out how many halvings are involved to reach a particular concentration since it will often not be a whole number, and in fact may be much less than 1 for isotopes with long half-lives. Instead, we will calculate time using an inverse growth equation (this is similar to a compounding interest problem, but with declining proportions): (equation 1)" t = 1 " ln # % D $ P +1 & ( ' where t is the time since the mineral s formation from magma or lava,! is the decay rate, ln is the natural logarithm, D is the amount of daughter isotope, that is currently present (has accumulated), while P is the amount of parent isotope, that remains. The decay rate is the probability that a particular atom of the isotope will undergo radioactive decay in one year. It is inversely related to the half life: the higher the decay rate, the shorter the half life. The isotopes of value depend on the age of the rocks in question. For dinosaurcontaining rocks, 14 C is not suitable because its half-life is too short. Not enough is left to detect after such a long time. Furthermore, it is relatively uncommon to have the original carbon remain in bones and other fossils of that age. A number of other isotopes do have suitably long half-lives and are elements regularly found in minerals (Table 2). 1 Table 2. Radioisotopes commonly used for dating, including the half life and decay rate per atom per year and the range of time over which it can be used. Parent Isotope Daughter Product Half Life (years) Decay rate per year 1 Useable range (years) Carbon, 14 C Nitrogen, 14 N x 10-4 <60,000 Potassium, 40 K Argon, 40 Ar 1.3 billion 5.33 x >100,000 Uranium, 234 U Thorium, 230 Th 250, x 10-6 >1 million Uranium, 235 U Lead, 207 Pb 0.7 billion 9.90 x >100 million Uranium, 238 U Lead, 206 Pb 4.5 billion 1.54 x >100 million Thorium, 232 Th Lead, 208 Pb 14 billion 4.95 x >300 million Rubidium, 87 Rb Strontium, 87 Sr 49 billion 1.41 x >100 million For most of these radioisotopes, their original concentration at the time the mineral formed is unknown. However, the resulting decay product would not have been pre- 1 Very large or very small numbers are best represented in scientific notation, in which a number is multiplied by 10 raised to a certain power. For example, 100 = To convert scientific notation to normal numbers, simply move the decimal point to the right by the exponent number of places, or to the left if the exponent is negative. Thus, 6,200,000 can be written 6.2 x 10 6 and can be written as 4.3 x To type scientific notation in MS Excel, use E+ to represent x10. Thus, 1.5 x 10 5 would be typed as 1.5E+5
30 LSC 294 Dinosaurs! Page 9 sent in the mineral at the time it formed, so it can be used to count the amount of the isotope that has already decayed. For example, the radioisotope of potassium, 40 K, decays into argon, 40 Ar with half life of 1.3 billion years. Argon is a noble gas, meaning it does not react with other elements and would not be chemically bonded within minerals. Any 40 Ar present in a mineral would be the result of radioactive decay that took place after the rock cooled to a solid (since when liquid, any argon that is formed would easily escape). The ratio of 40 K to 40 Ar can thus be used to measure how much radioactive decay has taken place. One major limitation of radioisotope dating is that it measures the time since the formation of igneous (and in some cases, metamorphic) rock that established the elements present in the mineral. This means that sedimentary rocks usually cannot be dated directly. Radioisotopes applied to sedimentary rocks would give the date when the parent material, the igneous rock, was initially formed, which could be hundreds of millions of years before it broke down through erosion to form sediments. Therefore, except for fossils preserved in volcanic ash sediments (or sediments with other types of volcanic inclusions), we cannot date the sediments of fossils directly, but have to date the nearest layers of igneous rock to put upper and lower limits on the sedimentary dates. Exercise 3: Radioisotope problems. 1. Complete the following problems in class. Do not leave until they have been gone over or checked by your instructor. You will then need to complete the problem set on your own time. 2. If your calculator does not do natural logarithms (ln), then you can use MS Excel to calculate them. In any cell, type: " " =LN(#) " except instead of #, type the number you want to take the natural log of, or the address of the cell that contains the number. 3. A sample of igneous rock contains 350,000 uranium 238 U atoms and 23,000 Lead 206 Pb atoms. Using equation 1 and the data in table 2, calculate the age of this sample. Show your work. " Show your work by setting up the equation 1 and then substituting the appropriate numbers (you do not have to show long hand arithmetic).
31 LSC 294 Dinosaurs! Page Instead of measuring the actual number of atoms (which is often impossible), it is common to simply measure the ratio of the amount of daughter isotope relative to the parent isotope. This ratio can then be substituted for D / P in equation 1. If a mineral sample has exactly equal amounts of 40 K and 40 Ar then exactly! of the potassium has undergone decay (assuming all of the Argon is the product of the decay of 40 K). Verify the half life of 40 K using the inverse growth equation and yearly decay rate given in Table 2. If the amount of 40 K and 40 Ar are equal, then D / P = 1. Show your work.

32 Name:! Page 1 LSC 294 Dinosaurs! Due in Lab on Sep 14 Part 1. Relative Dating. Lab 3 Fossil Dating Problem Set 1. At right are illustrated strata from three different locations along with some of the indicator fossils found in each. For each pair of major fossils shown below, circle to indicate if the fossil on the right is of the same age, younger, or older than the one on the right. is older than / same age as / younger than is older than / same age as / younger than is older than / same age as / younger than is older than / same age as / younger than is older than / same age as / younger than

33 Name:! Page 2 LSC 294 Dinosaurs! Due in Lab on Sep Four outcrops of rock are examined in different locations of a state. The rock types and the fossils they contain are illustrated in the adjacent diagram. Which fossil would be the best choice to use as an index fossil for these rocks? Explain your answer. Part 2. Half Life. 3. If 12.5 g of 235 U remain after 2.8! 10 9 years, how much of the radioactive isotope was in the original sample? You will need to know the half-life of 235 U, given in Table 2 of the lab handout. 4. Uranium-234, 234 U, has a half-life of 250,000 years. How much of an 848 g sample of 234 U would be left after 1.5 million years?


 of 0.0612.")
 of 0.043.")

34 Name:! Page 3 LSC 294 Dinosaurs! Due in Lab on Sep 14 Part 3. Absolute Dating. 5. The diagram below left shows a number of strata, including one which contains the skull of Tyrannosaurus. A second location some distance away is shown at the right, which contains several additional fossils. Layer 16 at the left location is basalt that contains a 207 Pb to 235 U ratio (D/P) of Layer 2 at the right location contains volcanic ash that has an 40 Ar to 40 K ratio (D/P) of Layer 9, also the right location, is a granite that contains 1.74 x times as much 230 Th as 234 U. A. Provide a date for each of the igneous rock layers using the appropriate radioisotope decay data from the lab handout (show your work): " Layer 16: " Layer 9: " Layer 2:

35 Name:! Page 4 LSC 294 Dinosaurs! Due in Lab on Sep 14 B. Based on the stratigraphic data illustrated in the figures and your calculations of the geological age of several rock layers, give the minimum and maximum possible ages of the Tyrannosaurus skull. C. Which methodology (biostratigraphy, chronostratigraphy, or lithostratigraphy was used to determine the age of the sedimentary rock layer below the Tyrannosaurus?
36 LSC 294 Dinosaurs! Page 1 Lab 4 Evolution & Phylogenetic Analysis Part I Natural Selection One of Charles Darwin s most important contributions was proposing a mechanism for producing evolutionary change. Darwin noted that all animals can produce far more offspring than can be supported in an environment with limited resources, so there must be a struggle for existence as organisms compete for resources. Given that not all individuals in a population are alike, some individuals likely have characteristics that make the more successful at surviving or reproducing, that is, they are more fit. This survival of the fittest is the essence of Natural Selection and a cornerstone to understanding evolution. Traits that are produced by natural selection are called adaptations. Adaptations are traits that were beneficial to an organism s ancestors, and usually are still beneficial to that organism. Exercise 1: Simulation of Natural Selection. 1. To illustrate the process of natural selection, we will perform a simulation of predation over several generations. Students will work in pairs. 2. The environment will be simulated using pieces of multicolored fabric that reflects the complexity of many real environments. Each group should spread one such piece of fabric flat on their lab bench. 3. The prey are a small, flat, round insect, represented by disks of colored paper. The prey species is quite variable in color. Each group should obtain 5 vials of prey, each of a different color. 4. Select 10 prey items from each color (thus 50 items total) and mix them together in the small dish provided. Randomly spread them out over your colored fabric. 5. One student in the group will be a predatory insect-eating dinosaur. Unlike what is usally shown on TV, it is not necessary to roar to scare your prey before attacking. Use the forceps to capture prey one at a time and place the captured prey in the dish. While one student captures prey, the other should keep track of the number of prey captured. 6. Continue capturing prey as quickly as you can until you have captured 25 prey. 7. You will need to allow the prey to reproduce so you don t drive them to extinction. Color pattern is heritable, so each prey insect will produce one offspring that are the same color as the parent (these insect reproduce asexually).

37 LSC 294 Dinosaurs! Page 2 8. Since only those insects that were not eaten can reproduce, you must count the number of each color left alive on your fabric. Add an equal number of the same colors to your fabric to represent reproduction and increase the population back to Repeat the predation of 25 prey, followed by reproduction, for a total of 3 generations. 10. Record the results and answer the questions on the worksheet for this lab. Part II Phylogenetic Analysis One of the first questions that is asked when a new dinosaur is discovered is how is it related to other dinosaurs? The answer to that question can allow us to fill in missing information and understand how dinosaurs evolved. Much of the study of dinosaurs is preoccupied with understanding their relationships. The evolutionary history of a group of or ganisms can be represented by a branching phylogenetic tree (or dendrogram). Because closely related organisms will probably have more characteristics in common than will more distantly related organisms, it might seem that the best way to unravel phylogenetic history would be to group together those organisms that are most similar to each other. An approach based on overall similarity has some drawbacks, however. Most importantly, not all similarity is due shared ancestry. Convergent evolution, the independent evolution of similar characteristics due to similar environments, can produce close similarities in otherwise Fig. 1. Convergent evolution: from top to bottom: ichthyosaur, shark, and dolphin. only distantly related organisms. Consider, for example, ichthyosaurs (extinct marine reptiles), sharks (cartilaginous fish), and dolphins (mammals) (Fig. 1). Their similar streamlined shapes, dorsal, pectoral and tail fins are the result of convergent evolution since they each evolved from very different ancestors (a land reptile, a primitive fish, and a mammal, respectively). Their superficial similarity does not indicate that they are closely related. The primary modern method by which phylogenetic trees are derived is called cladistics. The goal of cladistic analysis is to determine the true sequence of branching
38 LSC 294 Dinosaurs! Page 3 that occurred during evolutionary history. It does this by only using those traits that provide useful phylogenetic information. A phylogenetic tree that is derived through cladistic analysis is called a cladogram. How do we decide which characters are phylogenetically informative? We start by trying to eliminate similarities due to convergent evolution. Such traits may be identified by differences in how they develop or in their internal structure. The skeletal structure of a shark s fin is very different from that of either the dolphin s or ichthyosaur s fin. Similarly, although dolphin and ichthyosaur tails have a similar shape, dolphin flukes are flattened horizontal and move vertically, while ichthyosaur tail fins are vertically flattened and move laterally. But convergent traits are not the only types of similarities that can lead to incorrect conclusions. Consider, for example, the phylogenetic relationships among four groups: lizards, monkeys, humans, and horses. The first three all have five toes in their hind foot, while horses have only a single toe. Does this mean that lizards and humans are more closely related than are humans and horses? No: the presence of five toes in the foot is an ancestral (or primitive) trait; the earliest amphibians also had five toes in their hind foot, and lizards, monkeys, and humans have simply retained this ancestral number of toes. Horses, meanwhile, have lost all but one of their toes during the course of their evolutionary history. In cladistic analysis, only derived traits, that is, those traits that first originated within the group of interest, are used. How do we determine if a trait is ancestral or derived? The best method is to use an outgroup, a closely related species that is known to be outside the group of interest. In the above example, amphibians would be an outgroup because we know (based on other evidence) that they are outside of the group that contains lizards, monkeys, horses and humans. In other words, the last common ancestor of these species and lizards goes even further back. Any trait that is shared with the outgroup is considered to be ancestral for the group of interest (called the ingroup), while the alternate version not shared with the outgroup is considered to be derived. Thus the presence of five toes is ancestral, since that trait evolved even before the common ancestor or the species being studied (as indicated by its presence in the amphibian outgroup). The reduction in the number of toes in horses is derived since it happened after the common ancestor of all four species being studied. In summary, cladistics doesn t rely on simple similarity, but instead is restricted to using shared traits that are homologous and derived. Homologous traits can often (but not always) be recognized by similar underlying structures and development. Derived traits are identified by using outgroups: the derived state is the one that is different from the outgroup.
39 LSC 294 Dinosaurs! Page 4 To determine the relationships of horses, monkeys, and humans, suitable derived homologous traits include the presence of hair, mammary glands, opposable thumbs, and reduction of toes, none of which are found in amphibians. Monkeys and humans are united because they share the derived character of the opposable thumb, found in neither in horses nor lizards. This allows us to group them together in a clade. Similarly, monkeys, humans and horses all share mammary glands and hair, allowing these three species to be united into a clade as well. Note that clades can be nested within each other. From these traits, we can construct the following cladogram: In addition to illustrating the evolutionary history of these four groups, the above cladogram also indicates the evolutionary transitions that produced the shared, derived traits. In interpreting such cladograms, what is important is the pattern of branching, that is the specific clades (natural evolutionary groups) that are produced. Any node (point at which lineages diverge; this represents the most recent common ancestor) can be rotated, and the entire cladogram can be rotated. However, each of the clades ([human+monkey], [human+monkey+horse]) are the same. For example, all of the following cladograms represent the same exact evolutionary hypothesis: These cladograms represents a hypothesis about the evolutionary relationships of these four taxa, but of course it is not the only possible relationship. Fourteen other combinations of relationships are possible among just these four species. How then do we choose which is best (most likely to be correct). Why is this one better than any of the others? The best approach is to examine each of the possible cladograms by mapping the evolutionary transitions onto them. Consider the following alternative hypothesis, in which horses and humans form a clade (centaurs?):
, or evolved in the common ancestor of")
40 LSC 294 Dinosaurs! Page 5 In order to account for distribution of traits among these taxa, the opposable thumb must have either evolved twice independently (as illustrated), or evolved in the common ancestor of monkeys, humans and horses, but was subsequently lost in horses. This phylogenetic hypothesis requires more evolutionary transitions than the first cladogram, and thus is considered less likely to be correct (though not impossible). In other words, the cladogram that requires the fewest evolutionary transitions to account for all of the characters is considered to be the most parsimonious and is the preferred hypothesis. Evaluating alternative cladograms is almost always done by computer, since the number of possible cladograms increases rapidly as more species are included (for example, adding just one more species to our analysis increases the number of possible cladograms to 105). In the following examples and problems, we will use a data set of character states to derive a phylogeny for several hypothetical species. In order to simplify the process and make it possible to solve without computer analysis, we can assume that all traits are homologous with no convergent evolution. Thus, our primary goal will be to determine which character states are ancestral and which are derived. Exercise 2: Cladistic Analysis of Frogs. 1. We will work as a class on the following hypothetical problem. Be sure to fill in the table and phylogeny. Fig. 2. Key to the characteristics of 2. The first step is to examine the species and present a character matrix. The illustration at right Aridabatrachus frogs. is a composite frog identifying all of the relevant traits. The species are illustrated on the following page. Record the character states of each of the frog by filling out the table that follows. In most cases (except where indicated otherwise in the footnotes), simply indicate if the trait is present or absent. 3. Once you have completed the table, identify which state is ancestral versus derived for each
41 LSC 294 Dinosaurs! Page 6 character. This will require comparisons to the outgroup. In this example, Verdibatrachus maricopa is the outgroup and is used to identify the ancestral states. You may find it helpful to highlight the derived states in the table below. Character V maricopa (outgroup) A. gilensis A. pinalis A. pima A. yumensis A. cochisus Eyes Eardrum Claws Warts Dorsal ridges Webbed toes Tail
42 LSC 294 Dinosaurs! Page 7 4. Now you will begin to produce the actual cladogram (phylogenetic tree) for these frogs. Start by drawing a shallow V. The left branch of the V will represent the outgroup (it is common practice to place more primitive species on the left side and more derived species to the right, but it is not absolutely necessary). The right branch will represent one of the other species. V. maricopa (outgroup) 5. Next, identify a derived trait that is shared by only two species. Such a trait indicates that those two species are each other s closest relatives and should descend from a recent common ancestor (share a single node on the tree). For example, only A. gilensis and A. pinalis have large eyes. Add these species to the right side of the cladogram as shown below: V. maricopa (outgroup) A. gilensis A. pinalis Large eyes


43 LSC 294 Dinosaurs! Page 8 6. Include the derived homologous traits that unite this clade with labeled crossbars. They are placed on the lineage just before the node representing the most recent common ancestor since those traits must have appeared before the point of divergence. Note that only the transition to the derived state is included. The evolution of the ancestral state would fall outside of this phylogenetic tree. 7. Continue by looking for any other pairs of species that share a unique synapomorphy. These too will form a sister group, but it may not be immediately certain where they will fit relative to all of the other clades. Look for species that shares traits with A. gilensis and A. pinalis. This species or group can be added as a sister group to the A. gilensis and A. pinalis clade. Continue to add species, but note that the cladogram may not have a purely ladder-like structure. By definition, no branches should be drawn off of the left (outgroup) branch. Mark all evolutionary transitions on your cladogram. Fig. 3. Structural features of gastropod shells. Exercise 3: Cladistic Analysis of Gastropod Shells. 1. In this exercise you will proceed as we did above, but you will work in pairs to determine the phylogenetic relationships of the sea shells that are at your table. 2. To help locate the characters involved, you will need to know some terminology, illustrated at right (Fig. 3). 3. The identification of the five species in lab are shown below (Fig. 4). The moon shell is the outgroup. Fig. 4. The five species in lab are, from left to right: Moon shell; Strombus; Fighting Conch; Spiral Babylon; and Horn Shell.
44 LSC 294 Dinosaurs! Page 9 4. For each species of shell, note the following characteristics to use in your analysis. Record the results in the character matrix on your worksheet. Outer lip: thin or thickened (relative to shell thickness) Shell: smooth or with horizontal grooves Protruding bumps on shoulder: absent or present Aperature shape: elongated (at least 3x the width) or oval (length < 2x width) Color inside aperature: white or pinkish Spire: short (barely extends above shoulder) or long and pointed 5. Use these data to derive a phylogeny for these species and record your results on the worksheet. Exercise 4: Additional Cladistic Problems. 1. Practice applying cladistics reasoning to the additional questions on the worksheet for this lab. If there is insufficient time, you may complete these at home. Part III Taxonomy Once we have some idea of an animal s relationships, we can then classify it. The traditional classification system is one developed in the 1700s by Linneaus. This system places organisms into nested groups, which each group being assigned a specific level, or rank, in the hierarchy. The major ranks, in descending order of size and generality, are Kingdom, Phylum, Class, Order, Family, Genus, and Species. Under such a system, the dinosaur Tyrannosaurus rex would be classified as:! Kingdom Animalia!! Phylum Chordata (vertebrates and some close relatives)!!! Class Reptilia (reptiles)!!!! Order Theropoda (the predatory dinosaurs)!!!!! Family Tyrannosauridae!!!!!! Genus Tyrannosaurus!!!!!!! Species rex Note that the last two categories, genus (plural genera) and species (same for both plural and singular) make up a species scientific name, or binomial. The scientific name is always italicized (or underlined if handwritten) and only the genus name is capitalized, as such: Tyrannosaurus rex. Because differences between species are often too subtle to be recognizable from a few fossils, it is common to talk about dinosaurs just using their genus name.
 and Aves (birds) obscure the fact that birds evolved from within the reptile group and that some reptiles are more closely related to birds")
 names specific branches on a phylogenetic tree, but does not assign those names to any ranks (such as phylum or order).")
.")
45 LSC 294 Dinosaurs! Page 10 This system is falling out of favor by modern paleontologists, however, because it is rather limited in its ability to accurately reflect evolutionary relationships. For example, the traditional classes Reptilia (reptiles) and Aves (birds) obscure the fact that birds evolved from within the reptile group and that some reptiles are more closely related to birds than to other reptiles. Modern phylogenetic classification (which is controversial) names specific branches on a phylogenetic tree, but does not assign those names to any ranks (such as phylum or order). It also makes sure to name only monophyletic groups. A group is monophyletic if every member shares a common ancestor and if all of the descendents of that common ancestor are included in the group (Fig. 5A). In contrast, a polyphyletic group is one in which the common ancestor of the members of the group would not be included (Fig. 5C). This usually happens when organisms are grouped together based on convergent characteristics. A paraphyletic group is one in which the common ancestor is included, but the group omits some of the descendants of that common ancestor. For example, reptiles is paraphyletic because the common ancestor of turtles, crocodiles, lizards and snakes would also be considered a reptile, one group that descended from that same ancestor, the birds, is excluded (Fig. 5B). Fig. 5. The shaded areas indicate the types of taxonomic groups. A = monophyletic; B = paraphyletic; C = polyphyletic. A Mammals Birds Crocodiles Lizards Turtles B Mammals Birds Crocodiles Lizards Turtles C Mammals Birds Crocodiles Lizards Turtles Exercise 5: Types of Taxonomic Groups Problem. 1. Identify the monophyletic, paraphyletic, and polyphyletic groups in the phylogeny on the worksheet for this lab.
46 Name:! Page 1 LSC 294 Dinosaurs! 30 points Lab 4 Evolution & Phylogenetic Analysis Worksheet Part 1. Natural Selection Simulation. 1. Fill in the following table with the results from your Natural Selection simulation, indicating the number of each color that survived and reproduced. Generation 0 (start) Prey Color No. % No. % No. % No. % Graph the results of the selection experiment below, using a line graph. Use colored pencils to represent each of the prey colors. Don t forget to add the appropriate numbers to the axes.
47 Name:! Page 2 LSC 294 Dinosaurs! 30 points 3. Which color prey declined in abundance? If more than one, which color declined most rapidly? 4. Were any prey colors lost from your population? If not, how many generations of predation would you estimate it would take before one of the color variants was lost? 5. Which prey colors increased in abundance? 6. Is the decline or increase of certain colors related to the common colors present in your fabric? If so, explain your results. 7. How might the results be different if you carried out these experiments using a solid-color background (such as solid green) instead of the patterned fabric? 8. Imagine a new mutation that produced an individual with a purple color. Do you think this trait would spread successfully in your population? Explain why or why not?
48 Name:! Page 3 LSC 294 Dinosaurs! 30 points Part 2. Gastropod Shells. 9. Fill in the following character matrix for the gastropod shells that you observed in lab. Character Moon shell (outgroup) Strombus Fighting conch Spiral Babylon Horn shell Outer lip thickness Shell texture Shoulder bumps Aperature shape Aperature color Spire 10. Complete the following cladogram for the sea shell species included in the above matrix. In addition to adding the species, you should also indicate all of the evolutionary transitions to the derived states (as was done for the fish cladogram in class).
49 Name:! Page 4 LSC 294 Dinosaurs! 30 points Part 3. Sauropod Dinosaurs. Imagine that you time travelled back to the Jurassic Period and you have discovered several new species of sauropod dinosaurs in the genus Brachiosaurus, based on characteristics that were not preserved in the fossil record. Determine their phylogenetic relationships based on the following characteristics:! Eyes are large or small! Dorsal spines present or absent! Claws present or absent! Stripes present or absent! Tail spikes present or absent The four species of Brachiosaurus, plus an outgroup, Giraffatitan microcculus, are as follows:
50 Name:! Page 5 LSC 294 Dinosaurs! 30 points 11. Fill in the following character matrix for these dinosaurs, including the outgroup, Giraffatitan microcculus. Fill in all cells: do not leave blanks. Character Giraffatitan microcculus (outgroup) Brachiosaurus nychus Brachiosaurus spinus Brachiosaurus tigris Brachiosaurus echinus Eye size Dorsal spines Claws Stripes Tail spike 12. Complete the following cladogram for the Brachiosaurus species included in the above matrix. In addition to adding the species, you should also indicate all of the evolutionary transitions to the derived states.
51 Name:! Page 6 LSC 294 Dinosaurs! 30 points Part 4. Utahraptor Dinosaurs. In addition to your trip to the Jurassic, you also made a stop in the Cretaceous and observed some Utahraptors. Determine their phylogenetic relationships based on the following characteristics:! Teeth are long (shown) or short! Nose horn present or absent! Brow horns present or absent! Throat wattle present or absent! Arms long or short (shown)! Spots present or absent! Tail curled (shown) or straight The four species of Utharaptor, plus an outgroup, Arizonaraptor, are as follows:
52 Name:! Page 7 LSC 294 Dinosaurs! 30 points 13. Fill in the following character matrix for these dinosaurs, including the outgroup, Arizonasaurus microdonta. Fill in all cells: do not leave blanks. Character Arizonasaurus microdonta (outgroup) Utahraptor spirocauda Utahraptor nasicornis Utahraptor diablo Utahraptor punctatus Tooth length Nose horn Brow horns Throat wattle Arm length Spots Tail shape 14. Complete the following cladogram for the Utahraptor species included in the above matrix. Also indicate all of the evolutionary transitions to the derived states.
, indicate on the")

53 Name:! Page 8 LSC 294 Dinosaurs! 30 points Part 5. Classification. 15. For the following phylogeny of 12 species (numbered 1-12), indicate on the blanks below if the shaded groups (indicated by the letters A-D) are monophyletic, paraphyletic, or polyphyletic. A B C D A: B: C: D:
54 LSC 294 Dinosaurs FIELD TRIP INFORMATION When? This field trip is a required part of this class and will be held on Saturday, September 24 th. It is in lieu of a regular lab which will not be held that week. Where? We will be traveling to an area northeast of Payson, AZ, where we will look for marine invertebrate fossils at one or more sites. These sites are of the Naco Formation, Pennsylvanian Period, and were deposited about 310 million years ago. At that time, this area was covered by shallow tropical seas. We hope to find brachiopods, bryozoans, and crinoids (Echinodermata). The elevation is approximately 1700 m (5600 ft). Traveling Information We will minimize the number of vehicles, ideally no more than 3 We will meet at 8:00 am in Parking Lot 7 behind the CLCC building. The one-way distance is about 115 miles (roughly 2.3 hours driving time). Expect to return to campus around 4:00 pm (but delays are possible) Assignment We will collect fossils in a systematic fashion that will be elaborated on in the field. You need to make sure to collect all of the fossils from your assigned plots and place them in a labelled container. The fossils we collect will be identified and counted in next week s lab. We will use these collected fossils to ask questions on the abundance and distribution of various fossil species that we find and collect. Furthermore, we will make measurements of selected types to investigate allometric changes in shape in relation to body size. An additional guide and worksheet will be posted at a later date to cover the in-class work. Directions We will all meet at ASU and try to remain together as we travel to the site. However, if anyone does get separated, I have included the directions here. Make your way to Hwy 87 (Beeline Hwy) in Scottsdale or Mesa and take this road north all the way to Payson. In the town of Payson, turn right at Hwy 260 (east), and note your odometer reading. Continue east for around 14.8 mi and look for a small green sign on the right that says simply Paleo Site. The highway should be divided at this point unless construction is forcing the use of only one side. Turn right here into a fairly large parking area below highway level. If you reach the turnoff for Kohl s Ranch you have gone about 1 mile too far. We may also visit an additional site in the nearby National Forest, possibly as an optional extension for anyone interested. This will involve travel on well-maintained dirt roads that should pose no difficulty for passenger cars.
55 LSC 294 Dinosaurs What to bring Required: Water: at least 2 quarts (there is none available at the fossil sites) Sturdy closed-toed walking or hiking shoes Sunscreen and/or longsleeved shirts and hats (UV intensity is greater at this elevation) Notebook (any size, but small ones are more convenient; we will provide clipboards) Pens or pencils Fossil identification guide Recommended: Leather or work gloves Small container or ziplock bag for holding fossils that you collect for yourself, outside of the sampling area Sunglasses or other eye protection (we will also provide safety goggles) Optional (we will provide some magnifiers and tools as well): Hand magnifying lens Geologist s or similar pick, small garden trowel, or small crowbar Camera
56 LSC 294 Dinosaurs! Page 1 Lab 6 Analysis of Diversity and Variation in a Fossil Community Introduction. Last weekend we travelled to a site that exposed a shale-limestone bed of the Naco Formation. This formation is dominated by marine invertebrate fossils, including brachiopods, molluscs, and echinoderms. All three of these groups are bottom dwelling, more or less sessile (i.e. attached to rocks or the bottom) and are filter feeders, straining small food particles from the water. Although free-swimming animals that feed on larger prey no doubt existed in this environment, they are rare as fossils, perhaps due to their mobility or lack of hard shells. We collected fossils from two different locations and today we will identify the fossils and analyze the results. The first step is to identify what you collected. Use the Fossil Guide Handout to help identify the fossils you obtained. Do not hesitate to ask for assistance if you are having trouble identifying something. Exercise 1: Fossil Identification. 1. Sort through your fossils and identify each type you collected. It may help to place them in piles of the same type. 2. Count the number of individuals of each species that you had in your collection (do not count any fossils you collected for yourself outside the defined sampling area). Also include broken or fragmentary fossils. 3. Record the results in Table 1 at the end of this handout, and then record the results on the board (or class computer). Be sure to specify the identify of any fossils not listed on the table and confirm the identification with your instructor. 4. Once all students have recorded their data, record the class data on Table 2 at the end of the handout. Each person s set of specimens is a single sample. 5. Add up the number of specimens for each species across all samples in the column at right. Add up the number of individual fossils and number of species collected in each sample. Determine the cumulative number of species (combined number of species in that and all previous samples) for each sample as you read from left to right. (For example, if sample 1 had species A, B, and C, and sample 2 had species B and D, the cumulative number of species after sample 2 would be 4) 6. You will use these data to analyze species diversity and community differences as described below. 7. Present your findings as a short (3-4 page) report in the format of a scientific paper. Your paper should have a brief introduction, methods, results, and discussion section. Details on the organization of a scientific paper is available as a separate handout on the course web page.
57 LSC 294 Dinosaurs! Page 2 Analysis 1 Species Sampling Curves One of the first questions we can ask about our community is how well we have sampled it. Do our samples represent a relatively complete sample (sampling biases not withstanding) or might we expect to find many additional species with more sampling effort. One simple way to address this question is by drawing a species-area or speciessample curve. In such a graph, the cumulative number of species produced with the addition of each sample is plotted against sample number. The shape of the curve provides and indication of the completeness of the sample. As more and more samples are added, there should be fewer and fewer new species as the area becomes more throroughly sampled. If the graph still has an upward slope (as shown below left), this suggests that the maximum number of species has not been reached. If, on the other hand, the curve has reached and maintained a plateau (below right), then it is likely that the habitat or geological formation has been adequately sampled for all but very rare species and that many new species are unlikely to be added. Cumulative No. of Species Increasing Cumulative No. of Species Plateau Sample Number Sample Number For your analysis you should graph the species-sample curve using the class data from both areas. You may neatly hand draw the graph but it is perferable to make your graphs using Excel or other graphing software (there are numerous online tutorials to help you with the graphing functions in Excel, which vary with version). The discussion of your paper should use these graphs to determine if the site was well-sampled. Analysis 2 Species Diversity in an Ancient Community As you peruse the class data on the abundance of different species of invertebrates, you may notice that some species are much more common than others. This is a common observation in modern communities as well. One way to describe this pattern is with a graph that plots the relative rank of abundance, from most to least abundant, against the relative abundance (as a percentage of the total) for each species, plotted on a log scale. If the graph forms a relatively straight line that decreases evenly (as shown below left), this indicates that the relative abundance of species is fairly even. In other words, the common species is not that much more common than the least common species. On the other hand, if the curve is skewed, so that it appears hollowed or concave (dropping steeply at first and then levelling off; see below right), then that indicates that one or a few species are much more abundant than the others, while most of the rest are relatively rare. Such a community will appear to be less diverse than a community with the same total number of species but with a more even number of each. In modern communities, highly skewed distributions are often associated with disturbed areas.
58 LSC 294 Dinosaurs! Page 3 Relative Abundance (%) (log scale) Even Abundance Abundance Rank Relative Abundance (%) (log scale) Skewed Abundance Abundance Rank The first step is to organize the data. Use the totals across all samples (right hand column of Table 2). Sort the species from most to least abundant (total number of individuals), and then assign each species a rank, from 1 for the most abundant, 2 to the second-most abundant, and so on and record in Table 3. Calculate the relative abundance by dividing the number of individuals by the total number of individual fossils of all species combined. Multiply by 100 to convert to a percentage. To plot the rank-abundance curves, you will need to tell Excel (or other graphing software) to use a log scale on the vertical (Y) axis (do not plot the horizontal (X) axis on a log scale). Since the exact method of producing a log scale on the axis varies among versions of Excel, you should check appropriate online tutorials for your version if you need help. Alternatively, if you are unable to get the log scale to work, or if you are hand drawing the graphs, you can instead take the log 10 of each of the relative abundance data and then plot these data on a linear scale. In the discussion of the paper, visually evaluate these graphs to determine if the rank-abundance relationship reflects a relative even or a skewed abundance. Analysis 3 Sampling Comparisons When we sampled the fossils, we collected from two different types: directly from the uneroded cliff side, and from the loose material that had previously eroded out. This allows us an opportunity to study the way that erosion may alter the fossil record and change how we perceive prehistoric communities. We will examine two measures of these communities: species richness (the number of species) and the number of individuals observed. Descriptive Statistics In order to compare communities, we must first describe them statistically. We will need to describe both the central tendency of a set of data, that is, what is a typical value for that sample, and its variablity. The two most common measures of central tendency are the mean (numerical average) and median, which is the middle value when the values are ranked from lowest to highest. For example, for the following values: 1, 2, 2, 4, 6: The mean (usually written X ) equals ( )/5 = 3 The median equals 2 The nature of the particular data determine whether the mean or median is the preferred measurement for analysis, but this is beyond the scope of this class.
59 LSC 294 Dinosaurs! Page 4 We use several different measures to describe the variability of a sample. The simplest is the range, from the lowest to highest value. This measurement is very sensitive to sample size, so is of limited use. More commonly, either the standard deviation or the standard error are used to describe the variability of a data set. The standard deviation equation is as follows: where s is the standard deviation, x is the value of each sample, is the mean of all of the samples, N is the sample size (number of samples) and! is the summation sign. Using the numbers from the above example, the standard deviation would be calculated as: With larger samples, calculating standard deviation by hand can be tedious, but can be calculated in MS Excel quite easily using the formula =Stdev(array) where array is the list of numbers or cell addresses that you want to calculate the standard deviation of. One standard deviation above and below the mean encompasses about 65% of the data, while two standard deviations encompass about 96% of the data. The standard error is closely related to the standard deviation, and is calculated by the formula: Although the standard deviation is more widely used, the standard error has the advantage of being useful for a quick-and-dirty statistical test (see below). Inferential Statistics Beyond simply describing data, we will also want to test specific hypotheses. For example, we may wish to determine if two species differ in some way. If we measure several individuals from each species and discover that their means are not exactly identical, this by itself does not allow us to determine if a difference actually exists; the observed difference may simply be due to chance given the variability in the data. Statistical tests use the variability of data (such as the standard deviation) to determine the probability that any difference or relationship observed in the data is due simply to chance. Scientific hypothesis testing generally takes a conservative approach: it is better to conclude no effect when in actuality there is one than to conclude there is an effect when in actuality there is none. Thus, statistical tests measure the probablity (P-value or simply P) that any observed difference or trend is due only to random chance. Unless that probability is very low, we conclude that there is no difference. How low a prob-
60 LSC 294 Dinosaurs! Page 5 ability is low enough? The (arbitrary) standard cutoff point is 0.05 or less. In other words, we conclude that there is no difference unless there is less than a 5% chance of making an error if we do conclude there is a difference. Many different statistical tests have been developed that can be applied to a wide variety of data, but these generally require specialized statistical software and are beyond this course. Instead, we will use a quick and dirty approach to comparing means. This involves plotting the means of the two groups being compared and adding the standard error using error bars extending above and below the mean. The rule of thumb in this case is that if the error bars do not overlap (figure below left), then we can conclude that any difference between the means is unlikely due to random chance and that the difference is real (we say that the difference is statistically significant ). If, on the other hand, the error bars do overlap (below right), so that the upper bar of the lower mean extends above the lower error bar of the higher mean, then we cannot conclude that there is any difference (there might be, but the data are not strong enough to be sure) Treatment 1 Treatment 2 0 Treatment 1 Treatment 2 Draw bar graphs, as shown above, to compare the number of species in each of the two sampled areas. Add Standard Error bars to help determine if the difference is statistically significant. (Note: if using Excel, you need add the values of the calculated standard errors under the custom option or else draw them in by hand. Do not use the standard error option in Excel, as this will not give the correct result.) Draw a second graph in the same way to compare the number of individual fossils in the two areas. Discuss whether the different areas (that represent eroded vs. uneroded fossils) differ in either species number or total fossil density. What are the implications for any differences that you detected?
61 LSC 294 Dinosaurs! Page 6 Table 1. Record the data from your individual sample in this table. For each species, record the number of individual fossils that you collected from the sampling plot. Group Species No. Collected Group Species No. Collected Molluscs Myalina Bellerophon Composita Bryozoans Fenestrella bryozoan Encrusting bryozoan Branching bryozoan Brachiopods Derbya Cleiothyrdina Anthracospirifer Echinoderms Crinoid stems/disks Eirmocrinus calyx parts Linoproductus Other Anitiquatonia
62 LSC 294 Dinosaurs! Page 7 Table 2. Record the class data in this table. Sample Number & Initials Area 1: Area 2: Organism Totals Myalina Wilingia Bellerophon Composita Derbya Cleiothyrdina Anthracospirifer Juresania Echinaria Linoproductus Anitiquatonia Fenestrella bryozoan Encrusting bryozoan Branching bryozoan Crinoid stems/disks Eirmocrinus parts Other: Other: Other: No. of individual fossils per sample No. of species per sample Cumulative no. of species
63 LSC 294 Dinosaurs! Page 8 Table 3. Use this table to organize the class abundance data (totals for all samples) and to calculate the relative abundance. If you are unable to plot these data on a logarithmic scale, you may instead plot the logs of the abundance data (right column, optional). Rank Total Abundance Relative Abundance (% of total) Log 10 of Relative Abundance
64 LSC 294 Dinosaurs! Page 1 Introduction. Lab 8 Dinosaur Teeth and Diets As with most other aspects of dinosaur biology, we must infer their diets indirectly using cues left in the fossil record. Even then, we can often get no more specific than plants or insects or meat. In the broadest terms, we can categorize dinosaurs as herbivores if they eat primarily plants, carnivores if they eat mostly other animals, especially other vertebrates, insectivores if they eat mostly insects, and piscivores if they eat mostly fish. Dinosaurs with a mixed diet of both plant and animal matter are called omnivores. Evidence for dinosaur diets comes in a variety of forms. One of the strongest pieces of evidence is when the actual stomach contents are fossilized and recognizable. This mostly happens when the prey has hard bones, scales, or shells that have been swallowed more or less intact, but fossil plant fragments have also been found in stomach regions of herbivores. Such fossils are rare, and it is not always clear if the stomach contents represent typical food. Tooth marks and broken teeth left in prey animals are also valuable clues to the diets of carnivores. The larger species in particular may leave distinctive wounds in their victims bones that can be matched by size and shape to their maker. In most cases, however, it is not be possible to determine if the carnivore actually killed the prey animal or merely scavenged it after it had died. A third clue to diet is the fossilized feces, or coprolites, left behind. Microscopic analysis of coprolites can reveal bone or plant fragments that allow diet to be determined. The difficult part is matching the coprolite to its maker. Most often this is not possible unless its contents and size are likely to fit only one particular species known from the area. For example, some very large coprolites containing bone fragments with teeth marks have been attributed to Tyrannosaurus, the only large predator known from the same time and place. The most widely available clues to an animal s diet are its bones and especially its teeth. While tooth structure would obviously be related to diet, other aspects of the skeleton can also provide clues. For example, chewing requires complex musculature and proper alignment of teeth that is reflected in the position of the jaw joint and areas of muscle attachment. Digesting vegetable matter is a slow process and requires a large gut to house the plant matter being digested. The shape of the ribs and pelvis can indicate a large gut and implies an herbivorous diet. On the other hand, large sharp claws might indicate the need to attack other large animals and thus a carnivorous diet.
65 LSC 294 Dinosaurs! Page 2 In today s lab we will start by examining the teeth of modern animals to discover how tooth structure relates to diet and feeding mode. You will then have an opportunity to examine actual and replica dinosaur teeth to determine their likely diet. Herbivore Food. Although it may seem sufficient to simply consider plants as the diets of herbivores, we often want to know more than that. The types of plants an herbivore fed on is related to its stance and mobility and its habitat. For example, did an herbivore feed on plants that grew close to the ground or did it reach high into trees? Were the plants it fed on easily digestible and nutritious, or where they low quality? While we often cannot easily answer such questions, we can get an idea of the range of possibilities if we know the kinds of plants available in an environment. Therefore, we will begin by taking a brief survey of the major types of plants available during the Mesozoic Period. The Mesozoic plants can be broken down into two main groups. The more primitive (and paraphyletic) group of plants reproduces using microscopic spores and, during the Mesozoic, consisted mostly of relatively low-growing herbaceous or shrub-like plants. These include the lycopods (club mosses), horsetails, and ferns. A more derived group of plants reproduce using seeds. These are the cycads, ginkgoes, gnetophytes, conifers, bennettites, and flowering plants (angiosperms). All but the seed ferns and bennettites have surviving members, and these are briefly described below: Lycopods (club mosses) related to ferns and horsetails, these plants are inconspicuous, low-growing creepers. While some where tree-sized during the Paleozoic Era, those from the Mesozoic onward were small and low-growing. Horsetails As with the club mosses, they were dominant tree-like plants during the Paleozoic, but were supplanted by the seed plants. The Mesozoic and modern forms were very similar, forming slender reed-like stalks. True ferns A familiar group of plants that are mostly low-growing herbaceous plants, although some are tree-sized. Although ferns extend back to the Paleozoic Era, they underwent considerable diversification during the Cretaceous Period and may have been the most common browse for low-feeding dinosaurs. Seed ferns Although their leaves resemble those of ferns, they are actually a type of seed plant, perhaps most closely related to cycads. They declined during the Mesozoic Period and are now extinct. Cycads Cone-bearing seed plants with stout trunks and superficially palm-like leaves. Only a few species persist today, but during the Jurassic Period they were very common and diverse.
 surviving forms, such as Ephydra and Welwitschia, are very unusual plants of deserts and tropics.")

66 LSC 294 Dinosaurs! Page 3 Gnetophytes Gnetophytes are known from the Permian Period on, and were fairly common during the Cretaceous Period. They may be related to the extinct Bennettites and to flowering plants. The few (about 70) surviving forms, such as Ephydra and Welwitschia, are very unusual plants of deserts and tropics. Ginkgoes Trees with fruit-like seeds and distinctively shaped leaves. There is only one surviving species (native to China), but they were quite diverse throughout much of the Mesozoic Era. Conifers These are the familiar pine, juniper, and firs trees that produce seeds in cones. Very common and diverse, they were the dominant plants during the Triassic and Jurassic, but declined in the Cretaceous following the diversification of the flowering plants. Figure 1. Major types of Mesozoic plants. All but the bennettites have living and/or fossil representatives in lab. Flowering Plants (Angiosperms) The last group of plants to evolve, they did not appear until the Cretaceous Period. They have flowers to attract insect (mostly) pollinators and seeds are encased in fruit to attract animal dispersers. This is the most diverse group of plants and accounts for about 90% of modern species. Overall, during the Triassic and Jurassic Periods, forests were dominated by the conifers, cycads and, to a lesser extent, ginkgoes. Horsetails, club mosses, and especially ferns would have made up much of the lower plant growth. The dinosaurs of the Jurassic would have never encountered a flowering plant. Beginning in the Cretaceous, flowering plants came to increasingly dominate, gradually replacing most of the other plant groups (except ferns) by the end of the Cretaceous.
67 LSC 294 Dinosaurs! Page 4 Exercise 1: Plant Diversity. 1. Examine the live, preserved, fossil, and model plants on display. 2. Complete questions 1-3 on the worksheet as you refer to the plants. Diet and Skulls of Modern Animals. Vertebrates exhibit two main ways in which they process food with their mouths. Modern reptiles and birds mostly just bite off portions of food and swallow. This requires a jaw that can produce cutting edges but does not require any grinding surfaces. Alternatively, most mammals, especially the herbivores, can chew their food. Chewing requires the presence of grinding surfaces. Animal-based food such as insects or vertebrates is easily digested and so swallowing large pieces or whole prey is not much impediment to digestion. Whether an animal chews or simply crops off some food and swallows has significant implications for the arrangement of teeth and structure of the skull Plant material is more difficult to digest, and usually involves the assistance of bacteria in the gut. In order to improve access to plant material by bacteria, herbivores need to physically break down plant material. Herbivores that bite and swallow can improve the break-down of plant material by swallowing gravel or rocks (called gastroliths) to form grinding surfaces inside the stomach (or gizzard). Among modern species, this is common practice for herbivorous birds (such as chickens, geese, and ostriches) and crocodilians (which probably use the rocks more for buoyancy than digestion). Gastroliths have been found associated with a variety of herbivorous dinosaurs. Mammalian herbivores, on the other hand, chew their food. To chew food requires not just specialized grinding teeth, but also complex jaw musculature and cheeks to keep the food from falling out. Chewing food before swallowing means that it can be accessed by digestive enzymes more rapidly than if swallowed intact, and speeds the digestive process. In mammals, the cheek teeth (premolars and molars) are the primary chewing surface. The different requirements of cropping versus chewing also affects other parts of the skull, such as the location of the jaw articulation. In meat eaters, bites are intended to cut, much like scissors. And like scissors, the jaw hinge is in-line with the blades of teeth. In contrast, chewing requires the upper and lower jaws to be in contact along the entire length of grinding teeth. This is accomplished by having the jaw joint at a different level than the tooth row (Fig. 2).
68 LSC 294 Dinosaurs! Page 5 While herbivores need their cheek teeth to chew, they must first bite off parts of the plant. This requires different, nipping teeth or structures at the front of the mouth. Consequently, chewing herbivores have nipping teeth or a beak at the front of the mouth, and grinding teeth along the sides. In between these sets of teeth there is a gap called a diastema. This pattern is easily observed in many herbivorous mammals. Figure 2. Cutting versus chewing action of dinosaur jaws. Exercise 2: Diet and Skull Structure in Mammals and Dinosaurs. 1. Study the skulls of several carnivorous mammals that are available. These include dog and coyote (Canis spp.), bobcat (Lynx rufus), Sea lion (Zalophus californianus) Identify the tooth rows and note that the jaw hinge is in-line with the tooth rows. 2. Carefully articulate the mandible to see its normal action. Note how the back teeth meet before the front teeth. Pay special attention to the blade-like teeth near the back of the mouth and note how they slide close by each other like the blades of scissors. 3. Now study the skulls of several herbivorous mammals, including a deer (Odocoileus virginianus), horse (Equus caballus) and a large rodent such as beaver (Castor canadensis). In each of these skulls, identify the nipping or cropping teeth, the diastema, and the grinding cheek teeth. 4. Follow the line of the cheek teeth back and note that the jaw joint is not in line with the teeth. Where practical, carefully manipulate the jaw to observe how the cheek teeth come into flat contact with each other. 5. Examine the skulls of a collared peccary (also called javelina; Pecari tajacu) and chimpanzee. Examine the arrangement of the teeth and the position of the jaw joint to determine their probable diets. 6. Examine the small scale skulls of several dinosaurs. Based on the characteristics of their skulls, do you think they were carnivorous or herbivorous? 7. Complete questions 4-5 on the worksheet as you refer to the skulls.
69 LSC 294 Dinosaurs! Page 6 Diet, Feeding Style and Tooth Structure. Modern animals exhibit great variation in their tooth structure. In particular, most reptiles have relatively simple teeth with a single point (cusp). There is little variation in the shape of the teeth within a reptile s mouth, although they may vary in size. In contrast, mammals have more complex and varied teeth with several different tooth types. Mammal cheek teeth often have complex structure with multiple cusps or ridges. Unlike reptile teeth, mammal teeth are not continuously replaced but have only two generations. Still other modern animals, such as birds and turtles, lack teeth altogether and have a horny beak instead. Herbivorous mammals have evolved a variety of complex grinding surfaces on individual cheek teeth to produce effective grinding surfaces. The teeth of reptiles and dinosaurs are too simple to produce such complex patterns on individual teeth. Despite this, several groups of dinosaurs, notably the ornithopods (duckbills) and ceratopsians (horned dinosaurs), have evolved the ability to chew their food. Although their teeth are individually relatively simple, they produce grinding surfaces by having numerous small teeth packed together into dental batteries. The following are some of the different diets of large vertebrates (this is by no means comprehensive, especially for smaller vertebrates!), and the functional characteristics of teeth and other structures associated with that diet. Tooth characteristics vary not just with diet, but also with how prey is eaten. For herbivores, plants can be cropped and swallowed or the plant material can be chewed. For carnivores, prey may be swallowed whole or chunks may be sliced off. Hard-shelled Prey Animals that eat hard-shelled prey (such as crabs, clams, snails, etc.) often have very thick, blunded teeth that can crush shells without the teeth breaking. Modern examples: Spotted pinfish, Sheepshead, Caiman Lizard. Swallow Small Prey (such as fish) Whole Fish and other aquatic prey are slippery and usually swallowed whole. Therefore, the teeth are essentially designed to grab and pierce rather than to cut. They are conical and pointed and may have a bit of curvature. Similar (but much smaller) teeth are found in insect eaters. Modern examples: American alligator, Nile crocodile, dolphin, sea lion. Slicing Flesh of Large Prey Animals eating flesh of other large animals (i.e., too large to swallow whole) need to shear and cut their food. Mammals with such a diet usually use the close sliding of upper and lower cutting teeth to shear food (see above), but other vertebrates rely on teeth that are laterally flattened, curved, and often with serrated edges. (Note: alligators and crocodiles do eat large prey, but do not slice prey. Instead, they grab on and twist their body to tear off chunks). Examples: dog or jackal (note cheek teeth), monitor lizard, sharks.

70 LSC 294 Dinosaurs! Page 7 Plant shearing/cropping Animals that eat plants without chewing must simply shear or cut off pieces of plant matter. Their teeth are therefore usually simple spatulate, blade shaped or spoon-shaped structures arranged in close rows that together form a serrated edge. Modern example: Iguana. Plant chewing Teeth must form a grinding surface, either by having multiple cusps or ridges (mammals) or having a battery of teeth close together which produce such a surface. Modern examples: deer, horse, beaver. Beaks Toothless beaks are quite versatile and can be used to cutting off plants (turtles), shearing flesh (turtles, birds), or crushing seeds (birds). It can be difficult to determine the diet of animals with beaks and no teeth. Modern examples: snapping turtle, hawk, pheasant. Exercise 3: Grinding Surfaces and Dental Batteries. 1. Although mammals show a great deal of variation in tooth structure, the fact that they only have two tooth generation (which allows teeth to become more precisely aligned), their complex jaw musculature, and their complex multi-cusped teeth means that they are not the best models for the simpler jaws and teeth of dinosaurs. Nonetheless, they can be used to illustrate basic principles. 2. Examine the cheek teeth of the deer (Odocoileus virginanus), horse (Equus caballus) and beaver (Castor canadensis) or other rodent and note the various bumps and ridges that form grinding surfaces. 3. Several groups of dinosaurs have evolved the ability to chew. One of these is the hadrosaurs, or duck-billed dinosaurs. Examine an individual tooth and note that it is relatively simple in structure: an individual tooth does not produce much chewing surface. 4. Next, examine the replica of a part of an Edmontosaurus jaw (a kind of hadrosaur). Look for the layers of individual teeth. Only the top layer is in use, with other teeth waiting below to replace them. The surface forms a broad grinding plate, broadly grooved in the center where it meets the other jaw (see Fig. 3). (A section of an actual hadrosaur jaw is also available, with grooves that held the teeth.) Figure 3. Small section of a hadrosaur dental battery 5. Complete questions 6-8 on the worksheet as you refer to the skulls and teeth.
71 LSC 294 Dinosaurs! Page 8 Exercise 4: Diet and Tooth Structure of Vertebrates. 1. Examine the teeth of an herbivorous lizard, the green iguana (Iguana iguana) using a dissecting scope to better see their structure. Unlike the mammals, iguanas simply crop off some vegetation and swallow: they do not chew. 1. Examine the teeth of animals that swallow their prey, such as fish, whole. Study the skulls of the sea lion, dolphin, alligator and crocodile. 2. Now examine the teeth of animals that eat hard-shelled prey, such as mollusks. We have available the jaws of two fish and the snail-eating Caiman Lizard. How do their teeth differ from those of the fish eaters? 3. Eating prey that is too large to swallow typically requires chunks of flesh to be sliced off. This is done with the narrow cheek teeth in carnivores such as dogs (note that some cheek teeth also have a flattened portion to grind and crush food). Also study the shape of the teeth in the water monitor lizard (a dissection scope may be of help). 4. The fossil teeth of three different species of mosasaurs (large sea-going lizards) are available in lab. Based on your observations of modern animals, what do these teeth suggest about the diets of these mosasaurs? 5. Examine the teeth of an herbivorous lizard, the green iguana (Iguana iguana) using a dissecting scope to better see their structure. Unlike the mammals, iguanas simply crop off some vegetation and swallow: they do not chew. 6. Examine the various teeth (real fossils and replicas) of dinosaurs that are on display. For each, try to determine if it was herbivorous or carnivorous, and how it processed its meals medium-sized carnivorous dinosaur (for some smaller teeth, you may wish to use a dissecting scope). Note the overall shape as seen from the side as well as in cross-section. Look for any ridges or serrations. 7. Examine the jaws and beaks of the alligator snapping turtle, eagle, pheasant, and ostrich. The first two of these are carnivorous, while the latter two are herbivorous. What characteristics of their beaks might give a clue to diet? 8. Complete questions 9-13 on the worksheet as you refer to the skulls and teeth. Quantification of Tooth Shape. While some of the differences in tooth shape observed in lab are quite obvious, differences in shape can also be much more subtle. Detailed measurements can be used to characterize shapes and reveal differences that are not obvious with simple observation.
72 LSC 294 Dinosaurs! Page 9 Such quantification also removes more subjective judgement and is thus more repeatable and testable. We will measure teeth to compare tooth shape of two predator feeding styles: swallowing prey (such as fish) whole or slicing flesh. As you may have noticed, grasping teeth tend to be relatively slender and round in cross section, while slicing teeth are flattened laterally (side to side) to form blade-like edges. Since there is considerable variation in such shape, quantification of tooth shape can help resolve ambiguous cases. Since animals vary greatly in size, so too will their teeth vary in size. Therefore, absolute measurements of single dimensions are not very useful. For example, a tooth with a thickness of 3 mm could be very thin or very thick, depending on the overall size of the tooth. To compare among species, we instead want to use dimensionless indicators of shape. This is commonly in the form of the ratio of two measurements (more complex statistical procedures can combine many different measurements at once). To compare the ratio of the width (measured from front to back) to the depth (thickness, measured side to side), divide the width by the depth. A tooth that is perfectly round in cross section would have a W:D ratio of 1, while a narrow, blade-like tooth would have a W:D ratio that is much greater than 1. Exercise 5: Quantifying Tooth Shape. 1. Use the electronic dial calipers to measure the length and width of various teeth that are loose or in skulls. The calipers give measurements in millimeters (mm). 2. Measure width from front to back at the widest part of the tooth (but not at any supporting bone), as shown by the arrow on the shark s tooth at right. 3. Measure the depth of the same tooth as the thickness from the inside to outer edge at its thickest point. We will not measure length. 4. For each tooth, calculate the width to depth (W:D) ratio by dividing the width by the depth. 5. Measure the teeth of a variety of modern animals, as indicated on your worksheet. For the teeth of dogs or coyotes, measure the triangular-shaped cheek teeth, as the slicing teeth and the long canines as grabbing teeth. Although the shark teeth are fossils, they are very similar in shape to comparable modern species. 6. Measure the fossil teeth of various carnivorous dinosaurs and determine the W:D ratio. Use the W:D ratio to determine their likely feeding style.
73 ! LSC 294 Dinosaurs Name:! Page 1 Lab 8 Worksheet Part 1. Prehistoric Plant Diversity. 1. Examine the various groups of plants available in lab and briefly describe their main characteristics here. Where applicable, note if extinct forms (based on fossils or models) seem to differ in a substantial way from the modern forms available in lab. Plant Group Lycopod Describe overall growth form Describe leaf shape Describe texture (e.g. soft, tough) Do fossils differ from modern forms? Horsetail none Ginkgo tree Fern Seed Fern (Similar to fern?) Cycad Gnetophyte Conifer Flowering plant 2. Plant nutritional value and digestibility is often related to how tough a plant is. Soft, tender plants are typically of higher nutritional value and easier to digest than tough or fibrous plants (since the lignin and cellulose that make plants tough are largely undigestible). Based on your observations of the various groups of plants, which do you think were probably the best quality food source for herbivorous dinosaurs?

 using the following color key:! Blue = grinding teeth; Green = diastema; Red = cropping teeth Peccary; diet =!")
74 ! LSC 294 Dinosaurs Name:! Page 2 3. Which plants do you think were probably relatively poor food sources for dinosaurs? Part 2. Diet and Skull Structure. 4. For each of the following skulls, indicate if you think the animal is a carnivore, herbivore, or omnivore based on its overall structure (tooth arrangements, jaw joint location). On each drawing, draw a straight line through the level of the tooth row and place an X at the point where the jaw articulates with the skull. Color in the key regions (if present) using the following color key:! Blue = grinding teeth; Green = diastema; Red = cropping teeth Peccary; diet =! Chimpanzee; diet = Bobcat; diet =! Horse; diet =
75 ! LSC 294 Dinosaurs Name:! Page 3 5. Based on the characteristics of their skulls (small scale models), what do you think were the likely diets of the following dinosaurs? Dinosaur Diastema Present? Jaw hinge is above/below/or at same level as tooth row? Likely Diet (herbivorous or carnivorous)? Allosaurus Ceratosaurus Cryolophosaurus Nigersaurus Oviraptor Pachycephalosaurus Styracosaurus or Anchiceratops Part 3. Grinding Surfaces and Dental Batteries. 6. Briefly describe or sketch the differences in the grinding surfaces of the teeth of a deer, a horse, and a rodent. 7. Sketch the appearance of a single tooth of the green iguana (your drawing should be larger than life size!).
76 ! LSC 294 Dinosaurs Name:! Page 4 8. In the space below, sketch the replica of Edmontosaurus jaw section so that you provide a lateral view. Label at least one each of the following on your drawing: worn tooth, fresh tooth, replacement tooth, and grinding surface. Part 4. Diet, Feeding Style and Tooth Structure. 9. How do the teeth of a sea lion differ from that of their relatives, such as dogs and cats? How do you think sea lions eat their prey (chew it, swallow it hole, bite off chunks)? 10. Compare the tooth shapes of the three species of mosasaur available in lab with those of various modern predatory animals. For each, what do you think its likely diet was?! Mosasaurus beaugei! Liodon anceps! Globidens aegypticus 11. Based on your observations of various teeth above, what do you think the diet was for each of the following species represented by teeth in lab?! Spinosaurus! Tyrannosaurus! Rebbachisaurus! Camarasaurus! Triceratops! Ankylosaurus
77 ! LSC 294 Dinosaurs Name:! Page One of the species list in Question 11 also has its teeth arranged in batteries like hadrosaurs? Which do you think it is, based on tooth morphology? (Hint: consider tooth wear) 13. Based on your observations, what is one characteristic that may distinguish the beaks of carnivorous animals from those of herbivorous animals? Part 5. Diet, Feeding Style and Tooth Shape. 14. Take a set of measurements from a single tooth of each of the modern species that slices its prey, as indicated in the table below. Calculate the W:D ratio for each species, and the range and mean W:D ratios for each feeding type. Slicing Chunks Off Prey Species Tooth width (mm) Tooth depth (mm) W:D ratio Dog or coyote cheek tooth Water Monitor Lizard Serratolamna Shark Palaeocarcharodon Shark Otodus Shark Squalicorax Shark Range (min max): Mean:
78 ! LSC 294 Dinosaurs Name:! Page Take a set of measurements from a single tooth of each of the modern species that swallows prey whole, as indicated in the table below. Calculate the W:D ratio for each species, and the range and mean W:D ratios for each feeding type. Grasping Prey & Swallowing Whole Species Tooth width (mm) Tooth depth (mm) W:D ratio California Sea lion Pacific White-sided Dolphin American Alligator Nile Crocodile Dog or coyote canine Range (min max): Mean: 16. Take a set of measurements from each of the fossil (real or replica) dinosaur and mosasaur teeth listed in the table below. Calculate the W:D ratio for each species and by comparing to the data in Questions 14-15, determine the likely feeding style (swallowing whole or slicing) for each species. Fossil Species Species Tooth width (mm) Tooth depth (mm) W:D ratio Feeding Style Liodon anceps mosasaur Unid. Dromeosaur Spinosaurus Richardoestesia Tyrannosaurus Nanotyrannus 17. Some paleontologists have suggested that Nanotyrannus may be juveniles of Tyrannosaurus. How do their tooth shapes compare and what does this suggest to you about the validity of this hypothesis?
79 ! LSC 294 Dinosaurs Name:! Page 1 Lab 9 Worksheet Part 1. Reptile Identification.! For each of the following prehistoric non-dinosaurian reptiles, describe one or two morphological characteristics that distinguish that reptile from other members of the same group (characteristics that can distinguish the different groups are given in the lab guide). You may use posture (such as if it has erect or sprawling limbs) only if it is a fundamental part of the design, but you should not use differences in poses that an animal would regularly take in life (such as if a pterosaur is standing or flying). Do not use color differences (since color is speculative). You may use size only if all models in the group are made to the same scale. For example, for Dimetrodon you should identify structural differences visible on the models that distinguish it from the other members of its group, Edaphosaurus and Varanops. PELYCOSAURIA! Dimetrodon THERAPSIDA! Placerias! Inostrancevia CYNODONTIA! Procynosuchus TESTUDINES! Odontochelys ICHTHYOSAURIA! Ichthyosaurus! Shonisaurus LEPIDOSAURIA! Tylosaurus
80 ! LSC 294 Dinosaurs Name:! Page 2 Part 1. Continued PLACODONTIA! Henodus PLESIOSAURIA! Liopleurodon! Plesiosaurus! Rhomaleosaurus! Elasmosaurus BASAL ARCHOSAUROMORPHS! Champsosaurus! Tanystropheus! Euparkeria PHYTOSAURIA! Smilosuchus AETOSAURIA! Paratypothorax RAUISUCHIA! Postosuchus! Arizonasaurus
81 ! LSC 294 Dinosaurs Name:! Page 3 Part 1. Continued CROCODYLOMORPHA! Kaprosuchus! Dakosaurus! Sarchosuchus RHAMPHORYNCHOIDEA! Rharmphorhynchus PTERODACTYLOIDEA! Pterandon! Anhanguera! Tapejara! Quetzalcoatlus Part 2. Convergent Evolution! Identify three separate examples of convergent evolution among the animals you observed in lab. Identify three pairs of species that share one or more distinctive morphological features, but whose evolutionary relationships suggest that morphological feature evolved independently. Be sure to list the convergent species and identify at least one feature they have in common:! Convergence Example 1:! Convergence Example 2:! Convergence Example 3:
82 ! LSC 294 Dinosaurs Name:! Page 4 Part 3. Functional Interpretations A. Among therapsids and cynodonts, Inostrancevia, Trochosaurus, Procynosuchus, and Exaeretodon are carnivorous while Moshcops, Ischigualastia, Placerias, Dicynodon, and Lystrosaurus are all herbivorous. Study the models of these animals and determine if there are any consistent morphological differences between the herbivores and carnivores (for example, do they tend to have different body shapes or postures or head size?) B. Suggest a function for the distinctive shell of Henodus (Placodontia). With which modern animals is it convergent? C. Which ichthyosaur had the largest eyes (relative to body size)? Why might it have had such large eyes? D. Mosasaurs arrived in late Cretaceous and appeared to the take the place of some plesiosaurs which went extinct. Which Pleisiosaurs do you think they replaced (i.e., which were they most similar to)? E. Ichthyosaurs went extinct in the middle Cretaceous and their ecological niche (role) may have been filled by one of the plesiosaurs. Which plesiosaur would have been most likely to have a diet similar to ichthyosaurs? F. One of the the large semiaquatic Cretaceous crocodilians ate mostly fish, while the other hunted turtles and dinosaurs. What morphological differences between them is most likely to reflect this dietary difference? Explain why.
83 ! LSC 294 Dinosaurs Name:! Page 5 Part 3, continued G. Compare the shape and posture of terrestrial crocodylomorphs such as Montealtosuchus and Kaprosuchus with semiaquatic species such as Deinosuchus and Sarcosuchus. Why does their body shape and posture differ? H. Some of the Pterosaurs in lab, such as Tupuxuara, Tapejara, and Pteranodon, have prominant head crests. Suggest one hypothesis for the function of these head crests. Part 4. Synapsid Evolution! The phylogenetic tree at right shows the evolutionary relationships of most (but not all) of the Synapsida that you observed in lab. For each of the characters listed below, indicate where on the phylogeny that character most likely evolved by marking a horizontal line in the indicated color at the appropriate branches on the phylogenetic tree. As an example, the origin of hair (as illustrated by the models, at least), is indicated by the black bar. Your evolutionary transitions should minimize the number of changes required, but some traits will nonetheless have evolved multiple times. Some transitions may not have occurred. Amphibia are the outgroup, and should be considered carnivorous.!! Transitions: A. Transition(s) from herbivory to carnivory use red B. Transition (s) from carnivory to herbivory use green C. Transition (s) from sprawling to upright posture use blue D. Transition(s) from long to short tail use black Henkelotherium Exaeretodon Procynosuchus Trochosaurus Inostrancevia Dicynodon Placerias Moschops Dimetrodon Edaphosaurus Amphibia Are the sail backs of Dimetrodon and Edaphosaurus likely to be homologous or analagous?
84 ! LSC 294 Dinosaurs Name:! Page 6 Part 4. Diapsid Evolution! The phylogenetic tree at right shows the evolutionary relationships of selected Lepidosauromorphs that you observed in lab. For each of the characters listed below, indicate where on the phylogeny that character most likely evolved by marking a horizontal line in the indicated color at the appropriate branches on the phylogenetic tree. Your evolutionary transitions should minimize the number of changes required, but some traits will nonetheless have evolved multiple times. Hyperodapedon and Scutosaurus are the outgroups. Elasmosaurus Hydrotherosaurus Dolichorhynchops Muraenosaurus Plesiosaurus Attenborosaurus Rhomaleosaurus Liopleurodon Kronosaurus Nothosaurus Placodus Henodus Megalainia Mosasaurus Tylosaurus Hyperodapedon! Transitions: A. Origin of semi-aquatic habits (streamlined with webbed feet) use purple B. Origin of fully aquatic lifestyle (flippers instead of feet use blue C. Increased neck length use red D. Decreased neck length use green E. Increased head size (relative to body size) use gray F. Decreased head size (relative to body size) use yellow Scutosaurus
85 ! LSC 294 Dinosaurs Name:! Page 1 Lab 10 Worksheet Part 1. Dinosaur Identification.! For each of the dinosaurs, describe one or two morphological characteristics that distinguish that dinosaur from other members of the same group. Do not use color differences (since color is speculative). You may use size only if all models in the group are made to the same scale. STEGOSAURIA! Stegosaurus! Kentrosaurus! Miragaia ANKYLOSAURIA! Minmi! Edmontonia! Polacanthus! Ankylosaurus PACHYCEPHALOSAURIA! Pachycephalosaurus CERATOPSIA! Psittacosaurus! Protoceratops! Styracosaurus! Triceratops
86 ! LSC 294 Dinosaurs Name:! Page 2 HYPSILOPHODONTIDAE! Hypsilophodon IGUANODONTIA! Tenontosaurus! Iguanodon! Ouranosaurus HADROSAURIDAE! Maiasaura! Brachylophosaurus! Edmontosaurus! Parasaurolophus! Corythosaurus PROSAUROPODA! Plateosaurus
87 ! LSC 294 Dinosaurs Name:! Page 3 SAUROPODA! Amargasaurus! Nigersaurus! Apatosaurus! Diplodocus! Camarasaurus! Brachiosaurus! Alamosaurus Part 2. Functional Interpretations A. If species are too similar in their ecology and resource use, the intense competition may drive one or the other species extinct. Compare when most of the Stegosauria in lab lived to when most of the Ankylosauria lived. What does this suggest to you about how much the two groups would compete with each other if they co-occur? B. Based on phylogeny and distribution of fossils, on which continent did ceratopsian originate? (Hint: on which continent are the most primitive or basal species found?) Did they migrate once or more than once to additional continents?
88 ! LSC 294 Dinosaurs Name:! Page 4 C. Of the six species of North American Ceratopsidae, what is the maximum number that co-existed at the same time? D. Do the species of Ceratopsidae that occurred together million years ago tend to be similar to each other (relative to the other Ceratopsidae) or do they look more different from one another? What does this suggest to you about the function of their horns and shields? E. Do the species of Ceratopsidae that occurred together million years ago tend to be similar to each other (relative to the other Ceratopsidae) or do they look more different from one another? What does this suggest to you about the function of their horns and shields? F. Why might it have been especially important for Leaellynasaura to have large eyes? (Hint: consider its geographic distribution.) G. How might Iguanodontians and Hadrosaurids have defended themselves against predators. Suggest at least two forms of predator defense as suggested by the fossil record for these groups? H. Do basal, primitive sauropods (such as Cetiosaurus, Spinophorosaurus, Shunosaurus, and Mamenchisaurus) occur earlier or later in the geological record than the more derived Neosauropoda? Is this what you would have expected?
89 ! LSC 294 Dinosaurs Name:! Page 5 I. The sauropods Apatosaurus, Diplodocus, Camarasaurus, and Brachiosaurus all coexisted in the same area around 150 million years ago. How might they have partitioned their resources to reduce the amount of competition? Indicate how or where each species most likely foraged. Apatosaurus Diplodocus Camarasaurus Brachiosaurus J. Identify one characteristic shown on the models that distinguishes the sauropods known as Titanosauria (see phylogeny in lab guide) from other sauropods. Part 3. Phylogenetic Patterns A. Assuming that the ancestral state for dinosaurs was to be bipedal and carnivorous (as in Herrerasaurus), indicate on the phylogeny at which points an herbivorous diet evolved (use green) and at which points a quadrupedal posture evolved (use blue). You should select the transistion points so as to minimize the number of required transitions while still correctly accounting for the distribution of diets. Remember that the Theropoda are also bipedal and carnivorous. Theropoda Sauropoda Prosauropoda Herrerasauridae Hadrosauridae Iguanodontia Hypsilophodontidae Pachycephalosauridae Ceratopsia Scelidosaurus Ankylosauridae Stegosauridae
90 ! LSC 294 Dinosaurs Name:! Page 6 Scelidosaurus B. On the phylogeny at right, indicate the following evolutionary transitions: Origin of tail clubs use red Origin of tail spikes use green Origin of shoulder spikes use blue Wuerhosaurus Stegosaurus Miragaia Lexovisaurus Kentrosaurus Huayangosaurus Minmi C. Based on the same phylogeny at right, is the lack of shoulder spikes in Wuerhosaurus, Stegosaurus, and Miragaia an ancestral or derived characteristic, compared to other stegosaurs? Sauropelta Edmontonia Polacanthus Saichania Euoplocephalus Ankylosaurus D. On the phylogeny below right, indicate the following evolutionary transitions: Origin of enlarged head shield use red Origin of nose horns use blue Origin of brow horns use green E. On the same phylogeny at right, two subfamilies of Ceratopsids have been labeled. Identify at least one derived characteristic that distinguishes the subfamily Centrosaurinae Psittacosaurus Archaeoceratops Protoceratops Leptoceratops Achelosaurus Pachyrhinosaurus F. Identify at least one derived characteristic that distinguishes the subfamily Chasmosaurinae Centrosaurinae Chasmosaurinae Styracosaurus Chasmosaurus Torosaurus Triceratops
91 ! LSC 294 Dinosaurs Name:! Page 1 Lab 11 Worksheet Part 1. Dinosaur Identification.! For each of the dinosaurs, describe one or two morphological characteristics that distinguish that dinosaur from other theropods. Do not use color differences (since color is mostly speculative). You may use size only if all models in the group are made to the same scale. HERRERASAURIDS! Herrerasaurus (compare to basal theropods such as Coelophysoids) COELOPHYSOIDS! Coelophysis! Dilophosaurus CERATOSAURIA! Carnotaurus! Ceratosaurus CARNOSAURS! Allosaurus! Giganotosaurus! Acrocanthosaurus! Concavenator! Megalosaurus
92 ! LSC 294 Dinosaurs Name:! Page 2 SPINOSAURIDAE! Spinosaurus! Baryonyx COMPSOGNATHIDAE! Sinosauropteryx TYRANNOSAUROIDEA! Guanlong! Dilong! Alectrosaurus! Tyrannosaurus ORNITHOMIMIDAE! Gallimimus OVIRAPTOSAURIA! Oviraptor! Caudipteryx THERIZINOSAURIDAE! Therizinosaurus! Nothronychus
93 ! LSC 294 Dinosaurs Name:! Page 3 DEINONYCHOSAURIA! Velociraptor! Deinonychus! Microraptor! Anchiornis Part 2. Functional Interpretations A. Suggest a function for the head crests (composed of thin bone but probably covered in keratin) for the dinosaurs Dilophosaurus and Cryolophosaurus. B. Why do you think several large theropods such as Carnotaurus and Tyrannosaurus have such reduced forelimbs? C. Study the heads and especially the snouts of Spinosaurus and Baryonyx. What animal from a previous lab do these most closely resemble? What does this suggest their diet may be? D. Which dinosaurs from a previous lab do the Therizinosaurs (especially Therizinosaurus) most resemble in overall shape and posture? What does this suggest about their diet?
94 ! LSC 294 Dinosaurs Name:! Page 4 E. Suggest two functions for the elongated claws of Therizinosaurs such as Nothronychus. F. Tyrannosaurus had a powerful, heavily built skull (more robust than that of other similar sized carnivores such as Spinosaurus or Giganotosaurus) and teeth that were rounder in cross section rather than flattened. What does this suggest to you about what and how it ate? G. What does the greatly enlarged toe claw of dromeosaurs such as Deinonychus suggest about the type and size of prey that it normally consumed? Explain your reasonging. H. Examine the feathers on the arms and tails of dinosaurs such as Caudipteryx and Oviraptor. Their arms are far too short to have an aerodynamic function, so what other function might these feathers have? I. Microscopic analysis of feathers from two dinosaur fossils has revealed their likely color pattern in life. Models of both of these species are present in lab. Locate and identify these species. Based on the color of the model or photograph (as appropriate), what do you think the function of their color patterns was?
95 ! LSC 294 Dinosaurs Name:! Page 5 Part 3. Phylogenetic Patterns A. Assuming that Herrerasaurus (not shown on the phylogeny) represents the ancestral state, indicate on the phylogeny at which points the following characteristics evolved. You should select the transistion points so as to minimize the number of required transitions while still correctly accounting for the distribution of traits.! Origin of greatly reduced forelimbs use red Origin of head crests use blue Utahraptor Guanlong Protoceratosaurus Dilong Alectrosaurus Albertosaurus Ailoramus Tyrannosaurus Daspletosaurus Giganotosaurus Acrocanthosaurus Allosaurus Sinraptor Spinosaurus Baryonyx Carnotaurus Majungatholus Ceratosaurus Dilophosaurus Cryolophosaurus Coelophysis
96 ! LSC 294 Dinosaurs Name:! Page 6 B. On the phylogeny at right, indicate the following evolutionary transitions: Velociraptor Origin of herbivory use green Origin of slashing claw use red! (Hint: be sure to verify accuracy of models) Deinonychus Utahraptor Microraptor Anchiornis Gigantoraptor Oviraptor Caudipteryx Beipiaosaurus Nothronychus Therizinosaurus Gallimimus Guanlong Dilong Albertosaurus Tyrannosaurus Sinosauropteryx Allosaurus Origin of feathers use blue! Hint: feathers are a complex trait that likely evolved only once, so indicate the most recent possible point of origin; the lack of feathers on models is not necessarily evidence of lack C. Name four dinosaurs that should have feathers based on their phylogenetic position but were not reproduced as being feathered.
97 LSC 294 Dinosaurs! Page 1 Introduction. Lab 13 Dinosaur Size and Allometry Body size is one of the most important of biological variables, and reaches its most extreme size in dinosaurs. Body size affects the amount of food an animal needs, how fast it can move, how much heat it generates, and how it supports itself. Some of the impacts of size relate to how different aspects of three dimensional objects scale. Thus, it is of considerable importance to know how big dinosaurs were in life. Unfortunately, we don t have dinosaurs in the flesh, so it is not possible to directly weigh dinosaurs. Instead, paleontologists have developed several techniques to estimate their weight based on their skeletons. These techniques require researches to make numerous assumptions, so there can be considerable variation in the estimates provided by different researches, depending on the kinds of assumptions they make. It is an art as much as a science. The main technique to estimate dinosaur mass involves determining the volume of the dinosaur. Traditionally, this was done using scale models made by professional sculptors working with a scaled down replica of the skeleton. The modeler would apply the probable arrangement of muscles and other tissue to produce a three-dimensional replica. The volume can then be determined by the displacement of water. More recently, a version of this technique is done using virtual models build with 3D computer software. The accuracy of this technique is dependent on both the accuracy of the scale model and accuracy of the estimate of dinosaur densities. We will be using this technique with some of the scale models of dinosaurs that we had in class. The second method involves extrapolation from the size of the limb bones. Dinosaurs must support themselves on their legs, and the bigger the dinosaur, the more massive the leg needed to support the dinosaur. Large animals need proportionately thicker legs than do small animals. This is because as the length of an animal increases, its mass increases by the cube of the length increase, but the strength of bone only increases by the square of its diameter (since strength is determined by its cross-sectional area). In order for bone strength to keep up with mass, bones must get proportionately thicker in larger animals. By measuring the diameter of the dinosaur s bones, one can extrapolate from living animals to estimate how much weight they supported. Of course, this assumes that bone strength is directly proportional to its cross-sectional area, and that the animals are using their limbs in a similar fashion. However, large animals may be less agile or active, and thus apply less stress to their legs.

98 LSC 294 Dinosaurs! Page 2 Part 1 Determining the Scale of Models. In order to be able to extrapolate from dinosaur models, we must first determine the scale of the model. Scale is based on linear dimensions, that is lengths. Scale is usually written as a fraction, such as 1 / 20, but can sometimes be written as a ratio, e.g. 1:20. For example, a 1 / 20 scale model of a 10 m long dinosaur would be 0.5 m long. To determine the length of an actual dinosaur based on a model of known scale, simply divide the length of the model by its scale. Thus, a 20 cm long model that is 1/50 scale would represent a dinosaur that is (20/0.02 =) 1000 cm or 10 m long. Since many manufacturers do not make models to a specific scale, and even when they do it may vary, we will need to determine the scale of each model. We will do this by comparing the length of the model to the length of the actual dinosaur, as estimated from fossils (even lengths are rarely certain since most fossil skeletons are incomplete as well as uncertainty about soft tissue such as vertebral disks). One challenge will be to control for the effect of the body positions of the models. The published lengths are the lengths of the axial skeleton, from the snout to the tip of the tail with the animal straightened out. Most models, however, have more varied poses, with the neck and tail bent or curled. Thus, to measure the models, it is important to measure roughly along the the vertebral column rather than a straight-line length (see Figure 1). Figure 1. Measure dinosaur length along the black line Exercise 1: Determining Scale. 1. You and your lab partner should obtain five different dinosaur models. Try to get models that represent a diversity of clades. 2. Measure your model along its vertebral column, from the snout to the tail tip, as if it were straight. One useful technique is to use a soft wire that can conform to the animal s shape and then be straightened out to measure against a ruler. Extra long twist ties or pipe cleaners work well for this. Hold the wire or similar at one end of the animal, and lay it against the side of the model along its length, bending it as necessary to conform to the shape of the model (see above figure). Mark the spot on the wire where it reached the opposite end of the model, either with your fingers or by sharply bending the wire at that point. 3. Straighten the wire and measure the length to the point you marked using a metric ruler. 4. Convert the model s length from centimeters or millimeters into meters.
99 LSC 294 Dinosaurs! Page 3 5. Look up the actual length of the dinosaur, in meters, using the tables from T. R. Holz 2007 Dinosaurs encyclopedia (Random House). The tables in lab are updated tables that are posted online and were last revised December To determine scale, divide the length of the dinosaur (in meters) by the length of the model (converted to meters). This gives you the denominator of the scale. Round to the nearest whole number. 7. Record your data in Question 1 of the worksheet. Part 2 Estimating Mass by Volume Displacement. We will estimate the volume of the models using the displacement of water. By measuring the amount of water displaced by a fully submerged model, we can determine the volume of the model. Since the scale of the model is based on a linear measurement, the volume will scale to the linear scale raised to the third power. Thus, if a 1 / 20 scale model has a volume of 50 ml, the volume of the actual dinosaur would be 50 ml x 20 x 20 x 20 or about 400,000 ml (400 liters). Finally, volume can be fairly easily converted into mass, since most vertebrates are typically slightly less dense than water: about 0.95 g/ml, and we will assume that dinosaurs were similar. (It is possible that theropods and sauropods, with their extensive air sacs, were a bit less dense, while heavily armored dinosaurs like ankylosaurs were a bit more dense than this.) This method assumes that the shape of the models, such as the thickness of legs or neck or tail, is fairly accurate. While models created by paleontologists reflect the latest thought about muscle arrangements and other tissues, the replicas we use in class will not be that accurate, and compromises for strength and aesthetics may have been made. Exercise 2: Estimating Dinosaur Mass. 1. Use the same five dinosaurs for which you estimated the scale. 2. At the sinks in the lab are large bottles with a tube emerging from the side, and in the sink should be a graduated cylinder. 3. Using a beaker, fill the bottle until water starts coming out of the side tube (make sure the spout points into the sink!). 4. Once water is no longer flowing out of the tube, place an empty graduated cylinder beneath the tube opening so that it catches any water coming out. 5. Gently submerge the model in the bottle of water so that it is completely submerged. Avoid splashing or making waves.. No part of the model should be out of the water, and your hands or other objects should not be submerged. It may
.")
100 LSC 294 Dinosaurs! Page 4 help to use the eraser end of a pencil to hold the end of the model just below water level. 6. Examine the graduated cylinder to determine how much water was displaced. You should read the volume of the cylinder before removing the dinosaur from the bottle (since this can cause extra water to spill out). If the cylinder overflowed, or if any water spilled out, you will need to repeat Steps Record your results for Question 2 of the worksheet. 8. Repeat the procedure for each of your dinosaurs, being sure to refill the bottle and empty the graduated cylinder between each. 9. Determine the volume of the actual dinosaur by multiplying the volume of the model by cube the inverse (denominator) of its scale. Thus, the volume of a 1 / 20 scale model should be multiplied by 20 3 to obtain the volume of the dinosaur in ml. 10. To convert the volume of the dinosaur to mass, multiply your volume (in ml) by 0.95 to obtain their weight in grams. 11. Convert grams into kilograms by dividing by 1000 g/kg. This is your estimated weight. 12. Record your results on the worksheet. You will then need to compare your results to those that have been made by paleontologists. You can use internet resources and books to locate these values. It may be helpful to know that one ton (US) is 907 kg, although the use of ton (or tonne) in the scientific literature usually refers to a metric ton or 1000 kg. Part 3 Dinosaur Allometry. Everything about the biology of an animal is influenced by its body size, including its physiology (e.g., heart rate, respiratory rate, metabolic Figure 2. Juvenile and adult rate, growth rate), anatomy (e.g., organ mass, blood Maiasaura skeletons scaled volume, surface area), and ecology (e.g., diet, home range to the same length size, life span, population density). As organisms increase in size, either during individual development or in the evolution of a species, the size and function of different parts typically grow at different rates. Such a difference in shape associated with changes in size is called allometry. The opposite of allometry is isometry, where changes in size produce no changes in shape or proportions. For example, the dinosaur models are (hopefully) isometric
.")
101 LSC 294 Dinosaurs! Page 5 representations of the adult form of dinosaurs. On the other hand, dinosaur growth is allometric: juveniles tend to have proportionately larger heads and eyes and shorter limbs than adults, as seen in Maiasaura (Figure 2). Similarly, species tend to show allometric variation as well. Compare the skeletons of two Ornithopods, Maiasaura (2500 kg) and Othnielosaurus (30 kg) (Figure 3). When the skeletons are drawn to the same length, the differences in shape are obvious, with Maiasaura having a proportionately larger head, shorter neck, longer arms, deeper body, shorter tail, and thicker legs. Figure 3. Maiasaura and Othnielosaurus skeletons, rescaled to the same length Overall, the study of allometry is the study of how one variable changes as another, such as size, does. The general equation for allometric relationships is: Y = ax z. The letter a indicates a constant that essentially converts X to Y (it can be used to convert among different units of measurement, for example). The exponent z is the scaling factor: it indicates how much faster (or slower) one variable (Y) changes in response to changes in the other (X). Unfortunately, unless the exponent z is 1 (which indicates isometry), the relationship between X and Y will a curved line instead of a straight line. (For example, in scaling the model size (Y) to actual dinosaur size (X), a would be the model s scale, while z would be 1.) Since curved lines are more difficult to describe and visualize mathematically, we can alter the equation to form a line by taking the logarithm of both sides: logy =z log X + log a Note that log a is still a constant (the intercept of the line), so we can replace it with another letter, such as m. If we plot log Y against log X, we will obtain a straight line with slope z, the scaling factor. Instead of taking logarithms, we can plot X and Y on a logarithmic scale (which can easily be done in software such as Excel. The allometric relationship that we will study in this lab is the relationship between body mass and leg size. The strength of an animal s bones is related to the bone s crosssectional area. The cross-sectional area of a bone is related to its diameter by the equation! / 2 r 2. Note that! / 2 is the constant a in the allometric equation, while the scaling factor is 2. An animal s mass (and thus the strength needed to support it) increases with the volume, which is a cube of linear size (z = 3). For example, imagine two dinosaurs of identical shape, but in which the larger is twice the length of the smaller. The larger dinosaur would have 4 times (2 2 ) the cross-sectional area of its leg bones, but would have 8 times (2 3 ) the volume, and thus mass. Thus, its leg bones would be inadequate to
102 LSC 294 Dinosaurs! Page 6 support its proportionately greater mass. This means that as animals increase in size, they cannot simply be scaled up from small to large, but instead need proportionately thicker legs. This relationship is complicated by the fact that larger animals tend to undergo fewer strenuous activities, such as running or jumping, that puts stress on the bone, and thus they would not need quite as thick legs as their mass would suggest. In mammals, for example, the the relationship between mass and leg diameter (a linear measure of size) is as follows:! mass = a(leg diameter) 2.63 Note that the scaling factor (exponent) is less than 3, indicating that leg diameter does not increase as rapidly as expected based on the geometric increase in volume/ mass. This is because large animals such as elephants do not gallop and jump in the way a small gazelle might and thus puts less stress on its legs relative to body size. Since we do not have dinosaur leg bones available in lab for study, we will once again use models to test the relationship between leg size and body mass in dinosaurs (and thus assume that the legs of the models adequately represent the thickness of the legs and leg bones of dinosaurs). By plotting the relationship between body mass (based on your estimates from above) and leg diameter (which you will measure), we can determine the exponent of the relationship between these variables. Conversely, if we know the relationship between leg diameter and mass for dinosaurs as a whole, we can estimate the mass of dinosaurs known from just single leg bones. Exercise 3: Measuring Leg Diameter. 1. The analysis will require the use of the class data, but each group is responsible for the same five dinosaurs examined in Exercise For each dinosaur, determine if it is primarily quadrupedal (the Sauropods and most Ornithischians except the Hypsilophodontids) or bipedal (Prosauropoda and Theropoda). 3. Using calipers, measure the diameter, in mm, of the hind leg at the middle of the lower leg (the tibia). (Normally, the femur is measured but as this segment is much more muscled, there is greater potential for variability when measuring models rather than bones). 4. If the dinosaur is quadrupedal, also measure the diameter of the forearm (ulna and radius). 5. Add the diameters for each of the 2 (bipedal) or 4 (quadrupedal) limbs together to obtain the total limb diameter.
103 LSC 294 Dinosaurs! Page 7 6. Convert the model diameter to the diameter of the actual dinosaur limb by dividing by the scale (or multiplying by the denominator of the scale). Convert mm into centimeters. 7. Record the data for leg diameter in Question 7 of your worksheet. 8. Enter the data for the dinosaur (not model) mass and total limb diameter on the Excel spreadsheet on the class computer. These data will be posted tonight on the course web page. Exercise 4A: Analyzing The Relationship Between Leg Diameter and Dinosaur Mass. 1. This analysis will require the use of the class data which will be available as an Excel file on the course web page. 2. If not already done, enter the data in columns, with each row representing one species (species data must be aligned across rows). The two data columns are total leg diameter and mass of the dinosaur (not the model). 3. Highlight the two columns of numerical data and select the XY Scatterplot graphing option, specifically the option without lines. You should get a graph with the diameter on the X-axis and the mass on the Y axis. In all likelihood, the points will not form a straight line but instead have a J-shaped relationship. Go through the various option panes, which allow you to label axes, position your graph, etc. 4. When your graph is completed it will have points but not a best-fit line to illustrate the relationship. To add this, right-click or option-click on one of the data points and select Add trendline from the menu. 5. Under the Type tab, select the Power option. Then select the Options tab and click the Set intercept button (keep it set to 0), the Display equation button, and the Display R-squared value button. 6. If all goes well, your graph should have a curved best-fit line along with the equation for that line, in the format of: Y = ax z, where a and z are represented by specific numbers. Y represents the dinosaur s mass, while X represents the total leg diameter. The number in front of the X is the constant a which serves to, among other things, convert units (cm to kg); we will not concern ourselves with this. 7. The key number in this equation is the scaling factor (the exponent to which X is raised). Ideally, this will be a number between 2 and 3. A 2 would indicate that mass is increasing as a square of the leg diameter. Since the leg diameter is linear, and mass is dependent on volume, this is lower than what we would expect. If the exponent is 3, this means that mass increases as the cube of leg diameter
104 LSC 294 Dinosaurs! Page 8 which would be expected if stresses on the leg increased directly proportional to the mass. In mammals, the exponent is 2.63 since large animals engage in less limb-stressing activity such as jumping. 8. The final number of interest is the R 2 value. This is a statistical measure that determines how strong our data are: how well the points fit the line. R 2 ranges from 0-1, with 0 meaning no relationship at all and 1 meaning the points fall perfectly on a line. The R 2 value determines the proportion (multiply by 100 to convert to %) of the variation in body mass that can be explained by variation in leg diameter. The higher the R 2 value, the more confidence we can have in our equation. Exercise 4B: Alternative Analysis of The Relationship Between Leg Diameter & Dinosaur Mass. 1. As an alternative to the analysis above (if you are having trouble with Excel) is to take the logarithms of mass and leg diameter and plot these on the graph instead of the actual masses and diameter. 2. Collect your data as described above. You will need to plot and analyze these data with Excel as described above, but in this case you should select the linear trendline option. In this case, the number before X is the scaling factor.
105 Name:! LSC 294 Dinosaurs! 20 points Lab 13 Worksheet Part 1. Determining Scale 1. Record the data and calculations from your estimates of dinosaur mass in the table below. Species (a) Model Length (cm) (b) Model Length (m) (c) Dinosaur Length (m) (d) Model Scale 1. (c/b) Part 2. Estimating Dinosaur Mass 2. Record the data and calculations from your estimates of dinosaur mass in the table below. Species (d) Model Scale (e) Volume of Water (ml) (f) Volume of Dinosaur (e)(1/d) 3 (g) Mass of Dinosaur (g) 0.95(f) (h) Mass of Dinosaur (kg) (g)/1000
106 LSC 294 Dinosaurs! Page 2 3. Obtain at least two separate scientific estimates of the mass of each your dinosaur species. List these estimates and the sources of information in the table below.! For books or print articles, give the author s name, title of book, and year published.! For web sites, give the name of the site and the URL of the page with the information.! Mass estimates should be in kg. If given a choice, use the average mass rather than the largest known individual. Species Source (Give two per species) Mass estimate (kg) 4. Do the body mass estimates from the two sources tend to agree with each other or are they different. If different, what may account for this difference? 5. How close were your estimates of mass compared to those done by professional paleontologists? 6. What are at least two reasons why your estimates differed from published or online estimates?
107 LSC 294 Dinosaurs! Page 3 Part 3. Dinosaur Allometry 7. Record the leg diameter data in the table below. Record the data from Question 1, column h and this question, column l on the Excel spreadsheet on the class computer. Species (d) Model Scale (i) Model Hindlimb Diameter (j) Model Forelimb Diameter (k) Total Model Limb Diameter 2i (+2j)* (l) Total Dinosaur Limb Diameter k/d (cm) * use forelimb data only for quadrupedal species 8. Plot the relationship between dinosaur mass and leg diameter (or alternatively, between log(dinosaur mass) and log(leg diameter)) using Excel. Attach the printout of the graph as a separate page. Be sure to include the best-fit line (trendline). 9. Write the equation for the curve or line from the graph in Question 8: 10. What is the scaling factor that you obtained from the relationship between dinosaur mass and leg diameter? 11. Is the scaling factor what you expected or is it too large or too small? If it is not what you expected, what might account for this deviation? 12. What was the R 2 value for the data you plotted in Question 8? What can you conclude about the reliability of your estimates for the scaling factor?
108 LSC 294 Dinosaurs! Page 1 Introduction. Lab 15 Human Evolution Humans are not dinosaurs, of course, and did not live with dinosaurs. Nonetheless, it can be informative to study our evolution to gain a better understanding of the evolutionary process and how we interpret the fossil record. Because of the interest in our own ancestry, much effort has gone into finding human fossils. Thus, we have a great deal of evidence that is resolved at much finer levels of time and space than is typically possible for dinosaurs. Humans belong to the Class Mammalia, Order Primates, and so we will begin our study of human evolution with a brief survey of primate diversity. Humans exhibit many distinctive features that distinguish us from the closely related apes, such as bipedalism, very large brain, and reduced body hair. In this lab we will explore the diversity of our extinct and extant relatives. Part 1: Primate Diversity Primates have an arboreal (tree-dwelling) lifestyle and many of their characteristics are adaptations to that lifestyle. Key features associated with climbing include grasping hands and feet with flexible thumb and toe for grasping, flat nails rather than claws on at least some (and usually all) digits, shoulder and elbow joints that permit a high degree of forelimb rotation, and large, forward-facing eyes that provide binocular vision. Primates tend to be omnivorous or fruit-eaters, and thus have squarish molars with rounded bumps. Their snouts are usually shortened. Primates have large brains and usually complex social behavior; parental care is extensive and thus primates usually only have one or two offspring at a time. The first primate fossils date from the late Cretaceous period. These primates were small, squirrel-like mammals (probably somewhat like the modern tree shrews). Traditionally, primates were divided into two groups, the prosimians and the anthropoids. The prosimians are anatomically primitive and generally show less extensive development of the primate features. The anthropoids are the more derived monkeys and apes. Although the anthropoids make up a monophyletic group, the prosimians are paraphyletic and this grouping, while still convenient, is no longer used in formal classifications (instead, primates are formally divided into the Strepsirhini and Haplorhini). Since the study of primates is only incidental to the topic of this course and we have limited material available, we will stick with the traditional sub-divisions of prosimians and anthropoids.


 and three of the great apes. The apes (Fig.")
109 LSC 294 Dinosaurs! Page 2 The prosimians (Fig. 1) tend to have smaller brains and longer snouts than the anthropoids, and most are relatively small. Key distinguishing features are the presence of nostrils surrounded by moist skin and lower incisors modified into a tooth comb. This group includes lemurs, bush babies, and lorises that occur in Africa, Madagascar, and Asia. Figure 1. Examples of various prosimians. The anthropoids have nostrils surrounded by dry, hairy skin, blade-like incisors, a shortened snout and the back of the orbit is composed of a bone wall. This group includes the marmosets, monkeys (Fig. 2) and apes (Fig. 3). Figure 2. Examples of various anthropoid monkeys. Figure 3. The lesser apes (represented by the siamang) and three of the great apes. The apes (Fig. 3) are a derived subgroup of athropoids characterized by a relatively large size and loss of the tail. There are two groups of apes. The lesser apes are the gibbons. They are smaller and move about by swinging from their arms. The great apes are
110 LSC 294 Dinosaurs! Page 3 larger and include the orangutan (Pongo pygmaeus) from southeast Asia and the gorilla (Gorilla gorilla), chimpanzee (Pan troglodytes) and bonobo (or pygmy chimp, P. paniscus) from Africa. Exercise 1: Primate Diversity. 1. Study the photographs of the various primate groups presented on the course web site. 2. The bush babies and lemurs are examples of prosimians. Look for primate features such as forward-facing eyes and opposable toes. Look closely for prosimian characteristics such as a proportionately smaller head and a narrow, protruding snout. 3. Examine the skull of a ruffed lemur, Varecia variegata. Note its relatively elongated shape. Look at the back of the orbit to see that it is open (as is typical of most mammals). The lower incisors (front teeth) project directly forward to form a grooming comb, a characteristic of most prosimians. 4. Compare the prosimians to the photographs of the Anthropoidea, the monkeys and apes. Look for the larger head and shortened snout in most anthropoids (although a long snout has secondarily evolved within the baboons, a group of terrestrial Old World monkeys). Look closely to see that the anthropoid nose lacks a moist pad and is usually hairy. 5. The remaining skulls all represent members of the the Old World monkeys and apes. In particular, compare the skull of a vervet monkey (Cercopithecus aethiops) and hamadryas baboon (Papio hamadryas) with that of the ruffed lemur and note the differences. In particular, look for normal blade-like lower incisors and a solid bone wall behind the orbit. These are characteristics shared by all of the anthropoids. Also note the larger, more rounded brain case. 6. Examine and be able to distinguish the skulls of the vervet monkey, hamadryas baboon (Papio hamadryas), Orangutan (Pongo pygmaeus), Gorilla (Gorilla gorilla) and Common Chimpanzee (Pan troglodytes).
111 LSC 294 Dinosaurs! Page 4 Part 2: Hominid Relationships. Humans and our extinct ancestors are collectively referred to as hominids, reflecting an early tendency to place only humans in the family Hominidae. (Recent practice is to include the other great apes in that same family.) Anatomical and molecular data place the chimpanzees as the sister group to the hominids and suggest a divergence from a common ancestor about 6 million years ago. In comparison to the apes, humans have a number of derived features that make them quite distinct. These include an upright, bipedal posture and the associated skeletal changes (S-shaped vertebral column, modification of pelvis, femur, feet, etc.), a very large brain (3x larger than chimps), a flat face without a protruding snout, a fully opposable thumb with much greater dexterity, greatly reduced body hair, permanently enlarged breasts, a mostly hidden estrous cycle (no obvious heat ), and extremely complex social behavior with extended pair bonds, long parental care, language, and complex culture. The adaptive significance of many of these traits is uncertain and controversial. Exercise 2: Human-Chimpanzee Comparison. 1. Examine the skulls (both male and female) and skeletons of the common chimpanzee (Pan troglodytes) and modern human (Homo sapiens). 2. Compare the skulls and note any differences. Features to look for include the size of the cranium, jaw projection, shape of tooth row, and location of the foramen magnum. 3. Compare the skeletons and note any differences. Pay particular attention to differences associated with the upright posture of humans, such as the shape of the vertebral column and rib cage, relative lengths of limb bones, and shapes of the pelvis and foot. 4. Fill out the worksheet with your observations of the chimpanzee and human skeletons.


112 LSC 294 Dinosaurs! Page 5 Part 3: Homind Evolution. The hominid fossil record has, unsurprisingly, been of considerable interest, and a great deal of effort has been focussed on finding additional hominid specimens. As a result, we know a great deal about our ancestry, although a great many questions remain unanswered. Hominid discoveries have tended to occur in reverse-chronological order of their geological age, with recent forms having been known for much longer than older forms, but here we will present an overview in roughly the sequence in which these species occurred in geological time. Earliest Putative Hominids A number of recent finds in northeastern Africa have begun to push the hominid clock further back. Best known is Ardipithecus ramidus, recently described from fairly extensive fossil material (but unfortunately not represented in lab). It lived 4.4 million years ago (mya) in woodland. It probably climbed trees, but without the specialized grasping and swinging adaptations of chimpanzees, and when on the ground it likely walked bipedally. Its brain size was comparable to that of a chimpanzee. Despite its age it shows a number of differences from chimpanzees, including small, less sharp canine teeth in males and generalized walking (rather than the specialized knuckle-walking of chimps), suggesting that many of the chimpanzee characteristics are derived and evolved since the divergence from the common ancestor. Several other early species have been named, but their remains are very fragmentary and will not be covered here. Australopithecine Radiation Beginning about 4 million years ago, hominids (the australopithecines) began to diversify and spread into other regions of Africa. Two main types co-occurred: the slender, lightly-built Australopithecus were relatively small. Although they were bipedal, they were not very efficient walkers and may have spent time in trees. They had relatively small ape-sized brains. A more robust group in the genus Paranthropus were larger, more heavily built and had robust skulls and teeth for a more strictly vegetarian diet. The robust lineage eventually went extinct. Several species are known from each genus, and some occurred at the same time and in the same region.

 was Homo erectus. (It is closely related and similar to an African species, H. ergaster.) H.")
 was similar in size to modern humans, but had a smaller brain (but larger than H. habilis), heavy brow ridges, and a more projecting jaw. H. erectus went extinct about 300,000 years ago in Asia (and possibly as recently as 50,000 years ago on Java).")
 Meanwhile, in Africa, H.")

113 LSC 294 Dinosaurs! Page 6 Origin of Homo The genus Homo is characterized by an increased brain size, decreased jaw and tooth size, and decreased sexual dimorphism. The earliest member of this genus is H. habilis, which appeared about 2.4 mya and in many ways was intermediate between Australopithecus and later Homo species. It is also the earliest hominid to be associated with stone tools. H. habilis most likely evolved directly into or gave rise to H. ergaster, a slightly younger (1.9 mya), larger-brained species. Diversification of Homo The most successful hominid species (in terms of evolutionary longevity) was Homo erectus. (It is closely related and similar to an African species, H. ergaster.) H. erectus was the first hominid to leave Africa about 1.8 mya and spread to Europe and Asia. H. erectus (and H. ergaster) was similar in size to modern humans, but had a smaller brain (but larger than H. habilis), heavy brow ridges, and a more projecting jaw. H. erectus went extinct about 300,000 years ago in Asia (and possibly as recently as 50,000 years ago on Java). A closely related dwarf species, H. floresiensis, popularly known as the hobbit, persisted on some Indonesian islands until as recently as 12,000 years ago! (And some claim that the Orang Pendek, a mysterious ape-like creature purportedly sighted in Sumatra, is a relict population of H. erectus or H. floresiensis.) Meanwhile, in Africa, H. ergaster probably gave rise to H. heidelbergensis, which in turn gave rise to both H sapiens and H. neanderthalensis, the latter of which lived in Europe until about 30,000 years ago. Modern Humans Modern humans, H. sapiens, first appeared in Ethiopia about 160,000 years ago and gradually spread from there to the Middle East, Europe, and Asia. As they did so, they appears to have replaced the local hominids (H. erectus, H. neanderthalensis). Modern humans are about the same size but less robust than their relatives, and lack the heavy brow ridges. They had much more sophisticated behavior, with superior tools, creativity, and art. The timelines and relationships of the hominid species are summarized in Figure 4, below.
114 LSC 294 Dinosaurs! Page 7 Figure 4. Hominid relationships. Left: the approximate duration of the main hominid species as indicated by the fossil record. Right: the presumed relationships of the major groups of hominids. Exercise 3: Fossil Hominids. 1. Examine the skull reproductions of some of the most important and best known fossil hominids. 2. Identify each of these specimens to genus and species. 3. Fill in the table and chart on the worksheet.
115 LSC 294 Dinosaurs! Page 8 Part 4: Hominid Brain Size. One aspect of hominid biology that has been of particular interest is the evolution of the large human brain. In the 1800s and early 1900s it was thought that the large brain must have evolved first and then later came other human adaptations such as a shorter jaw and upright posture. This all changed with the discovery of small-brained, upright walking Australopithecines in Africa beginning in the 1950s. Although hominid brains are not preserved directly, their size can be estimated by the volume of the brain case of the skull (similar approaches can be applied to dinosaur brains). Modern techniques include digital reconstructions from CT scans of fossils, but the traditional approach we will use in lab works as well. Exercise 4: Estimating Hominid Brain Size. 1. Obtain two or three hominid skull reproductions (or a hominid and the chimpanzee skull). Although these skulls are designed for teaching and do not attempt to accurately render the interior spaces, they can still provide a reasonable approximation of volume. 3. Using a funnel, fill the entire brain case by pouring beans (or whatever other material has been made available to you) into the foramen magnum. You should carefully shake your skull to allow the beans to settle. 4. Once you have completely filled your skull, carefully and without spilling, pour the contents into an empty graduated cylinder. 5. Note the level of the material in the cylinder and record your results on the worksheet and on the board or computer. 6. Be sure you have recorded the entire class data before leaving.
116 ! LSC 294 Dinosaurs Name:! 20 points Lab 15 Worksheet Part 1. Primate Diversity 1. Compare the ruffed lemur skull to the vervet monkey and baboon skulls. Fill out the following table, comparing the characteristics indicated. Trait Ruffed Lemur Vervet Monkey Hamadryas Baboon Shape of cranium (brain case) Relative length of snout Post-orbital wall Number of upper and lower teeth Shape/position of incisors Size of cheek teeth 2. For each of the following primate skulls, identify one or two characteristics that you can used to distinguish them from the other anthropoid species in lab. Vervet Monkey Hamadryas Baboon Chimpanzee Orangutan Gorilla
117 LSC 294 Dinosaurs! Human Evolution Lab 3. Compare the chimpanzee and human skulls and skeletons that are available in lab. Fill out the following table, comparing the characteristics indicated: Trait Chimpanzee Human Skull: Size and shape of cranium Jaw projection Size of canines Shape of cheek teeth rows (parallel sided vs. a curved U shape) Orientation of foramen magnum Post-cranial skeleton: Shape of vertebral column Length/shape of rib cage Length of humerus vs femur Shape of illium (upper portion) of the pelvis Shape of phalanges Big toe on foot Page 2
118 LSC 294 Dinosaurs! Human Evolution Lab 4. Examine the replicas of fossil hominids available in the lab. For each, try to identify derived characteristics that distinguish it from its closest ancestor (typically the species above it in the table below. For Australpithecus afarensis, compare it to that of the chimpanzee skull. Characteristics to look at include the shape and size of the cranium, the size of the mandible, the shape and size of the teeth, the presence of brow ridges or sagittal crests, jaw projection, etc. Species Derived Characteristics (Compare to chimpanzee, Pan troglodytes) 1. Australopithecus afarensis (Compare to A. afarensis) 2. Australopithecus africanus (Compare to A. africanus) 3. Paranthropus aethiopicus (Compare to A. africanus) 4. Paranthropus boisei (Compare to A. africanus) 5. Homo habilis (Compare to H. habilis) 6. Homo erectus (Compare to H. erectus) 7. Homo neanderthalensis (Compare to H. neanderthalensis) 8. Homo sapiens Page 3
119 LSC 294 Dinosaurs! Human Evolution Lab 5. The figure below represents a simplified phylogeny and timeline for hominids (not all species are shown). The time for each species is indicated by the shaded bars. Indicate the position of each of the hominid species you observed in lab by writing in the species number from the previous table (Question 4) inside the head silhouettes. Page 4
 data from your measurement and from the other students into the table below.")
 Mean Cranial Capacity (ml) Pan troglodytes 6.0? Australopithecus afarensis 3.")
120 LSC 294 Dinosaurs! Human Evolution Lab 6. Record the cranial capacity (brain size) data from your measurement and from the other students into the table below. If a species brain case was measured more than once, record the average of the measurements instead. Species Age When First Appeared (million years) Mean Cranial Capacity (ml) Pan troglodytes 6.0? Australopithecus afarensis 3.9 Australopithecus africanus 3.0 Homo habilis 1.9 Homo erectus 1.8 Homo neanderthalensis 0.3 Homo sapiens Cro Magnon Man 0.16 Homo sapiens Modern 0 Page 5
Evolution of Birds. Summary:
 Oregon State Standards OR Science 7.1, 7.2, 7.3, 7.3S.1, 7.3S.2 8.1, 8.2, 8.2L.1, 8.3, 8.3S.1, 8.3S.2 H.1, H.2, H.2L.4, H.2L.5, H.3, H.3S.1, H.3S.2, H.3S.3 Summary: Students create phylogenetic trees to
Evolution on Exhibit Hints for Teachers
 1 Evolution on Exhibit Hints for Teachers This gallery activity explores a variety of evolution themes that are well illustrated by gallery specimens and exhibits. Each activity is aligned with the NGSS
Living Dinosaurs (3-5) Animal Demonstrations
 Animal Demonstrations") Living Dinosaurs (3-5) Animal Demonstrations At a glance Students visiting the zoo will be introduced to live animals and understand their connection to a common ancestor, dinosaurs. Time requirement One
Living Dinosaurs (3-5) Animal Demonstrations At a glance Students visiting the zoo will be introduced to live animals and understand their connection to a common ancestor, dinosaurs. Time requirement One
Adaptations: Changes Through Time
 Your web browser (Safari 7) is out of date. For more security, comfort and Activitydevelop the best experience on this site: Update your browser Ignore Adaptations: Changes Through Time How do adaptations
Interpreting Evolutionary Trees Honors Integrated Science 4 Name Per.
 Interpreting Evolutionary Trees Honors Integrated Science 4 Name Per. Introduction Imagine a single diagram representing the evolutionary relationships between everything that has ever lived. If life evolved
Planet of Life: Creatures of the Skies & When Dinosaurs Ruled: Teacher s Guide
 Planet of Life: Creatures of the Skies & When Dinosaurs Ruled: Teacher s Guide Grade Level: 6-8 Curriculum Focus: Earth Science Lesson Duration: Three class periods Program Description Ancient creatures
Mr. Bouchard Summer Assignment AP Biology. Name: Block: Score: / 20. Topic: Chemistry Review and Evolution Intro Packet Due: 9/4/18
 Name: Block: Score: / 20 Topic: Chemistry Review and Evolution Intro Packet Due: 9/4/18 Week Schedule Monday Tuesday Wednesday Thursday Friday In class discussion/activity NONE NONE NONE Syllabus and Course
Origin and Evolution of Birds. Read: Chapters 1-3 in Gill but limited review of systematics
 Origin and Evolution of Birds Read: Chapters 1-3 in Gill but limited review of systematics Review of Taxonomy Kingdom: Animalia Phylum: Chordata Subphylum: Vertebrata Class: Aves Characteristics: wings,
Your web browser (Safari 7) is out of date. For more security, comfort and the best experience on this site: Update your browser Ignore
 is out of date. For more security, comfort and the best experience on this site: Update your browser Ignore") Your web browser (Safari 7) is out of date. For more security, comfort and the best experience on this site: Update your browser Ignore Activitydevelop EXPLO RING VERTEBRATE CL ASSIFICATIO N What criteria
Your web browser (Safari 7) is out of date. For more security, comfort and the best experience on this site: Update your browser Ignore Activitydevelop EXPLO RING VERTEBRATE CL ASSIFICATIO N What criteria
How Do Species Adapt to Different Environments?
 Objectives Introduction Period Name Other members of lab team How Do Species Adapt to Different Environments? Organisms have traits that help them to survive in different habitats. Fish can live in water
Bio 1B Lecture Outline (please print and bring along) Fall, 2006
 Fall, 2006") Bio 1B Lecture Outline (please print and bring along) Fall, 2006 B.D. Mishler, Dept. of Integrative Biology 2-6810, bmishler@berkeley.edu Evolution lecture #4 -- Phylogenetic Analysis (Cladistics) -- Oct.
Bio 1B Lecture Outline (please print and bring along) Fall, 2006 B.D. Mishler, Dept. of Integrative Biology 2-6810, bmishler@berkeley.edu Evolution lecture #4 -- Phylogenetic Analysis (Cladistics) -- Oct.
Chapter 22 Darwin and Evolution by Natural Selection
 Anaerobic Bacteria Photosynthetic Bacteria Dinosaurs Green Algae Multicellular Animals Flowering Molluscs Arthropods Chordates Jawless Fish Teleost Fish Amphibians Insects Reptiles Mammals Birds Land Plants
Inferring #1 This diagram shows the beak of several different species of birds. Make observations about the beaks and answer the questions.
 Observing #1 1. Record a qualitative observation of the scene in the illustration. 2. Record a quantitative observation of the scene in the illustration. 3. Observation or inference? The house collapsed.
Biology Day 75. Monday, March 16 Tuesday, March 17, Do)Now:& Video'Notes:'Galapagos'Part'C '
Now:& Video'Notes:'Galapagos'Part'C '") Biology Day 75 Monday, March 16 Tuesday, March 17, 2015 Do)Now:& Video'Notes:'Galapagos'Part'C ' 1. Write'today s'flt'' 2. Define:'natural'selecCon.''' 3. What'is'the'selecCng'agent'in'natural' seleccon?'
Biology Day 75 Monday, March 16 Tuesday, March 17, 2015 Do)Now:& Video'Notes:'Galapagos'Part'C ' 1. Write'today s'flt'' 2. Define:'natural'selecCon.''' 3. What'is'the'selecCng'agent'in'natural' seleccon?'
A R T I C L E S STRATIGRAPHIC DISTRIBUTION OF VERTEBRATE FOSSIL FOOTPRINTS COMPARED WITH BODY FOSSILS
 A R T I C L E S STRATIGRAPHIC DISTRIBUTION OF VERTEBRATE FOSSIL FOOTPRINTS COMPARED WITH BODY FOSSILS Leonard Brand & James Florence Department of Biology Loma Linda University WHAT THIS ARTICLE IS ABOUT
Evolution. Evolution is change in organisms over time. Evolution does not have a goal; it is often shaped by natural selection (see below).
.") Evolution Evolution is change in organisms over time. Evolution does not have a goal; it is often shaped by natural selection (see below). Species an interbreeding population of organisms that can produce
Evolution Evolution is change in organisms over time. Evolution does not have a goal; it is often shaped by natural selection (see below). Species an interbreeding population of organisms that can produce
Evolution as Fact. The figure below shows transitional fossils in the whale lineage.
 Evolution as Fact Evolution is a fact. Organisms descend from others with modification. Phylogeny, the lineage of ancestors and descendants, is the scientific term to Darwin's phrase "descent with modification."
Red Eared Slider Secrets. Although Most Red-Eared Sliders Can Live Up to Years, Most WILL NOT Survive Two Years!
 Although Most Red-Eared Sliders Can Live Up to 45-60 Years, Most WILL NOT Survive Two Years! Chris Johnson 2014 2 Red Eared Slider Secrets Although Most Red-Eared Sliders Can Live Up to 45-60 Years, Most
May 10, SWBAT analyze and evaluate the scientific evidence provided by the fossil record.
 May 10, 2017 Aims: SWBAT analyze and evaluate the scientific evidence provided by the fossil record. Agenda 1. Do Now 2. Class Notes 3. Guided Practice 4. Independent Practice 5. Practicing our AIMS: E.3-Examining
Geo 302D: Age of Dinosaurs LAB 4: Systematics Part 1
 Geo 302D: Age of Dinosaurs LAB 4: Systematics Part 1 Systematics is the comparative study of biological diversity with the intent of determining the relationships between organisms. Humankind has always
Evolution by Natural Selection
 Evolution by Natural Selection 225 Permian Seed Plants Flowering Plants Birds Land Plants Mammals Insects Reptiles Teleost Fish Amphibians Chordates Molluscs Arthropods Dinosaurs 180 Triassic Jawless Fish
Introduction to phylogenetic trees and tree-thinking Copyright 2005, D. A. Baum (Free use for non-commercial educational pruposes)
") Introduction to phylogenetic trees and tree-thinking Copyright 2005, D. A. Baum (Free use for non-commercial educational pruposes) Phylogenetics is the study of the relationships of organisms to each other.
Introduction to phylogenetic trees and tree-thinking Copyright 2005, D. A. Baum (Free use for non-commercial educational pruposes) Phylogenetics is the study of the relationships of organisms to each other.
Title: Phylogenetic Methods and Vertebrate Phylogeny
 Title: Phylogenetic Methods and Vertebrate Phylogeny Central Question: How can evolutionary relationships be determined objectively? Sub-questions: 1. What affect does the selection of the outgroup have
8/19/2013. Topic 4: The Origin of Tetrapods. Topic 4: The Origin of Tetrapods. The geological time scale. The geological time scale.
 Topic 4: The Origin of Tetrapods Next two lectures will deal with: Origin of Tetrapods, transition from water to land. Origin of Amniotes, transition to dry habitats. Topic 4: The Origin of Tetrapods What
Origin and Evolution of Birds. Read: Chapters 1-3 in Gill but limited review of systematics
 Origin and Evolution of Birds Read: Chapters 1-3 in Gill but limited review of systematics Review of Taxonomy Kingdom: Animalia Phylum: Chordata Subphylum: Vertebrata Class: Aves Characteristics: wings,
Introduction to Cladistic Analysis
 3.0 Copyright 2008 by Department of Integrative Biology, University of California-Berkeley Introduction to Cladistic Analysis tunicate lamprey Cladoselache trout lungfish frog four jaws swimbladder or
With original illustrations by Brian Regal, Tarbosaurus Studio. A'gJ" CAMBRIDGE UNIVERSITY PRESS
 David E. Fastovsky University of Rhode Island David B. Weishampel Johns Hopkins University With original illustrations by Brian Regal, Tarbosaurus Studio A'gJ" CAMBRIDGE UNIVERSITY PRESS Preface xv CHAPTER
Geo 302D: Age of Dinosaurs. LAB 7: Dinosaur diversity- Saurischians
 Geo 302D: Age of Dinosaurs LAB 7: Dinosaur diversity- Saurischians Last lab you were presented with a review of major ornithischian clades. You also were presented with some of the kinds of plants that
LABORATORY #10 -- BIOL 111 Taxonomy, Phylogeny & Diversity
 LABORATORY #10 -- BIOL 111 Taxonomy, Phylogeny & Diversity Scientific Names ( Taxonomy ) Most organisms have familiar names, such as the red maple or the brown-headed cowbird. However, these familiar names
Differences between Reptiles and Mammals. Reptiles. Mammals. No milk. Milk. Small brain case Jaw contains more than one bone Simple teeth
 Differences between Reptiles and Mammals Reptiles No milk Mammals Milk The Advantage of Being a Furball: Diversification of Mammals Small brain case Jaw contains more than one bone Simple teeth One ear
Course # Course Name Credits
 Curriculum Outline: Course # Course Name Credits Term 1 Courses VET 100 Introduction to Veterinary Technology 3 ENG 105 English Composition 3 MATH 120 Technical Mathematics 3 VET 130 Animal Biology/ Anatomy
Your web browser (Safari 7) is out of date. For more security, comfort and the best experience on this site: Update your browser Ignore
 is out of date. For more security, comfort and the best experience on this site: Update your browser Ignore") Your web browser (Safari 7) is out of date. For more security, comfort and the best experience on this site: Update your browser Ignore Activityapply ADAPTIVE RADIATIO N How do species respond to environmental
Your web browser (Safari 7) is out of date. For more security, comfort and the best experience on this site: Update your browser Ignore Activityapply ADAPTIVE RADIATIO N How do species respond to environmental
Dinosaurs and Dinosaur National Monument
 Page 1 of 6 Dinosaurs and Dinosaur National Monument The Douglass Quarry History of Earl's Excavation... Geology of the Quarry Rock Formations and Ages... Dinosaur National Monument protects a large deposit
Modern Evolutionary Classification. Lesson Overview. Lesson Overview Modern Evolutionary Classification
 Lesson Overview 18.2 Modern Evolutionary Classification THINK ABOUT IT Darwin s ideas about a tree of life suggested a new way to classify organisms not just based on similarities and differences, but
Darwin and the Family Tree of Animals
 Darwin and the Family Tree of Animals Note: These links do not work. Use the links within the outline to access the images in the popup windows. This text is the same as the scrolling text in the popup
When Dinosaurs Ruled the Earth
 Buffalo Geosciences Program: Lesson Plan #2 When Dinosaurs Ruled the Earth Objectives: By the end of the program, the participants should be able to understand the earth and its creatures during the Triassic,
Do the traits of organisms provide evidence for evolution?
 PhyloStrat Tutorial Do the traits of organisms provide evidence for evolution? Consider two hypotheses about where Earth s organisms came from. The first hypothesis is from John Ray, an influential British
Evolution by Natural Selection
 Evolution by Natural Selection 2006-2007 DOCTRINE TINTORETTO The Creation of the Animals 1550 But the Fossil record OBSERVATION Anaerobic Bacteria Photosynthetic Bacteria Dinosaurs Green Algae Multicellular
Non-fiction: Sea Monsters. A new wave of fossils reveals the oceans prehistoric giants.
 Sea Monsters By Stephen Fraser A new wave of fossils reveals the oceans prehistoric giants. Way back when Tyrannosaurus rex shook the ground, another giant reptile lurked in the prehistoric oceans. A 50-foot
Fishes, Amphibians, Reptiles
 Fishes, Amphibians, Reptiles Section 1: What is a Vertebrate? Characteristics of CHORDATES Most are Vertebrates (have a spinal cord) Some point in life cycle all chordates have: Notochord Nerve cord that
Evolution in Action: Graphing and Statistics
 Evolution in Action: Graphing and Statistics OVERVIEW This activity serves as a supplement to the film The Origin of Species: The Beak of the Finch and provides students with the opportunity to develop
AP Biology. AP Biology
 Evolution by Natural Selection 2006-2007 DOCTRINE TINTORETTO The Creation of the Animals 1550 But the Fossil record OBSERVATION mya Quaternary 1.5 Tertiary 63 Cretaceous 135 Jurassic 180 Triassic 225 Permian
Welcome to Darwin Day!
 Welcome to Darwin Day! Considered to be the father of evolutionary ideas Sailed upon the HMS Beagle for 5 years around the world Gathered data and specimens from South America Galapagos Islands, as well
SKELETONS: Museum of Osteology Tooth and Eye Dentification Teacher Resource
 SKELETONS: Museum of Osteology Tooth and Eye Dentification Teacher Resource Grade Levels: 3 rd 5 th Grade 3 rd Grade: SC.3.N.1.1 - Raise questions about the natural world, investigate them individually
Population Dynamics: Predator/Prey Teacher Version
 Population Dynamics: Predator/Prey Teacher Version In this lab students will simulate the population dynamics in the lives of bunnies and wolves. They will discover how both predator and prey interact
Ch 1.2 Determining How Species Are Related.notebook February 06, 2018
 Name 3 "Big Ideas" from our last notebook lecture: * * * 1 WDYR? Of the following organisms, which is the closest relative of the "Snowy Owl" (Bubo scandiacus)? a) barn owl (Tyto alba) b) saw whet owl
Carnivore An animal that feeds chiefly on the flesh of other animals.
 Name: School: Date: Bipedalism A form of terrestrial locomotion where an organism moves by means of its two rear limbs, or legs. An animal that usually moves in a bipedal manner is known as a biped, meaning
Evolution of Tetrapods
 Evolution of Tetrapods Amphibian-like creatures: The earliest tracks of a four-legged animal were found in Poland in 2010; they are Middle Devonian in age. Amphibians arose from sarcopterygians sometime
Your web browser (Safari 7) is out of date. For more security, comfort and the best experience on this site: Update your browser Ignore
 is out of date. For more security, comfort and the best experience on this site: Update your browser Ignore") Your web browser (Safari 7) is out of date. For more security, comfort and the best experience on this site: Update your browser Ignore Activityengage HU NTERS IN THE AIR What characteristics helped pterosaurs
Your web browser (Safari 7) is out of date. For more security, comfort and the best experience on this site: Update your browser Ignore Activityengage HU NTERS IN THE AIR What characteristics helped pterosaurs
Skulls & Evolution. 14,000 ya cro-magnon. 300,000 ya Homo sapiens. 2 Ma Homo habilis A. boisei A. robustus A. africanus
 Skulls & Evolution Purpose To illustrate trends in the evolution of humans. To demonstrate what you can learn from bones & fossils. To show the adaptations of various mammals to different habitats and
JEFFERSON COLLEGE COURSE SYLLABUS VAT113 PRINCIPLES OF CLINICAL MEDICINE I
 JEFFERSON COLLEGE COURSE SYLLABUS VAT113 PRINCIPLES OF CLINICAL MEDICINE I 4 Credit Hours Prepared by: Dana Nevois, RVT Revised 06/08 John Keck, Dean of Career & Technical Education VAT113 PRINCIPLES OF
Resources. Visual Concepts. Chapter Presentation. Copyright by Holt, Rinehart and Winston. All rights reserved.
 Chapter Presentation Visual Concepts Transparencies Standardized Test Prep Introduction to Vertebrates Table of Contents Section 1 Vertebrates in the Sea and on Land Section 2 Terrestrial Vertebrates Section
Beak Of Finches Lab Answer Key
 BEAK OF FINCHES LAB ANSWER KEY PDF - Are you looking for beak of finches lab answer key Books? Now, you will be happy that at this time beak of finches lab answer key PDF is available at our online library.
Adaptation. Survival of the Fittest
 Adaptation Survival of the Fittest It s all about traits Acquired Traits Happen After Birth Scars Pierced Ears Learning a Skill Changing Appearance It s all about traits Inherited Traits Programmed at
Jurassic Food Web. Early Childhood Learning Objective
 Jurassic Food Web Early Childhood Learning Objective Language Development: Listening and understanding, speaking and communicating Literacy: Phonological awareness Science: Scientific knowledge Creative
Life in the Paleozoic
 Life in the Paleozoic Ocean Planet & The Great Migration Paleozoic Late Middle Early 543-248 Myr P r e c a m b r i a n Eon P h a n e r o z o i c Proterozoic Archean Hadean Geologic Time Scale Era Period
DINOSAUR TOUR PROGRAM PLAN FOR DOCENTS
 DINOSAUR TOUR PROGRAM PLAN FOR DOCENTS The following is a suggested format for this program. Please feel free to bring your own experiences and creativity to the program. Flexibility is encouraged. PROGRAM
NATURAL SELECTION SIMULATION
 ANTHR 1-L BioAnthro Lab Name: NATURAL SELECTION SIMULATION INTRODUCTION Natural selection is an important process underlying the theory of evolution as proposed by Charles Darwin and Alfred Russell Wallace.
Evolution by Natural Selection
 Evolution by Natural Selection 2006-2007 DOCTRINE But the Fossil record OBSERVATION Quaternary 1.5 Tertiary 63 Cretaceous 135 Jurassic 180 Triassic 225 Permian 280 Carboniferous 350 Devonian 400 Silurian
NAME: DATE: SECTION:
 NAME: DATE: SECTION: MCAS PREP PACKET EVOLUTION AND BIODIVERSITY 1. Which of the following observations best supports the conclusion that dolphins and sharks do not have a recent common ancestor? A. Dolphins
Bio 312, Spring 2017 Exam 1 ( 1 ) Name:
 Name:") Bio 312, Spring 2017 Exam 1 ( 1 ) Name: Please write the first letter of your last name in the box; 5 points will be deducted if your name is hard to read or the box does not contain the correct letter.
Bio 312, Spring 2017 Exam 1 ( 1 ) Name: Please write the first letter of your last name in the box; 5 points will be deducted if your name is hard to read or the box does not contain the correct letter.
King Fahd University of Petroleum & Minerals College of Industrial Management
 King Fahd University of Petroleum & Minerals College of Industrial Management CIM COOP PROGRAM POLICIES AND DELIVERABLES The CIM Cooperative Program (COOP) period is an essential and critical part of your
Unit 7: Adaptation STUDY GUIDE Name: SCORE:
 Unit 7: Adaptation STUDY GUIDE Name: SCORE: 1. Which is an adaptation that makes it possible for the animal to survive in a cold climate? A. tail on a lizard B. scales on a fish C. stripes on a tiger D.
INQUIRY & INVESTIGATION
 INQUIRY & INVESTIGTION Phylogenies & Tree-Thinking D VID. UM SUSN OFFNER character a trait or feature that varies among a set of taxa (e.g., hair color) character-state a variant of a character that occurs
JEFFERSON COLLEGE COURSE SYLLABUS VAT113 PRINCIPLES OF CLINICAL MEDICINE I. 4 Credit Hours. Prepared by: Dana Nevois, MBA, BS, RVT
 JEFFERSON COLLEGE COURSE SYLLABUS VAT113 PRINCIPLES OF CLINICAL MEDICINE I 4 Credit Hours Prepared by: Dana Nevois, MBA, BS, RVT Minor Revision or Update by: Dana Nevois, MBA, BS, RVT Date: August 16,
Biology 1B Evolution Lecture 11 (March 19, 2010), Insights from the Fossil Record and Evo-Devo
, Insights from the Fossil Record and Evo-Devo") Biology 1B Evolution Lecture 11 (March 19, 2010), Insights from the Fossil Record and Evo-Devo Extinction Important points on extinction rates: Background rate of extinctions per million species per year:
Biology 1B Evolution Lecture 11 (March 19, 2010), Insights from the Fossil Record and Evo-Devo Extinction Important points on extinction rates: Background rate of extinctions per million species per year:
LABORATORY EXERCISE 7: CLADISTICS I
 Biology 4415/5415 Evolution LABORATORY EXERCISE 7: CLADISTICS I Take a group of organisms. Let s use five: a lungfish, a frog, a crocodile, a flamingo, and a human. How to reconstruct their relationships?
Jefferson County High School Course Syllabus
 A. Course Large Animal Science B. Department CTE- Agriculture C. Course Description Jefferson County High School Course Syllabus Large Animal Science is an applied course in veterinary and animal science
Field Trip: Harvard Museum of Natural History (HMNH)
") Field Trip: Harvard Museum of Natural History (HMNH) Objectives To observe the diversity of animals. To compare and contrast the various adaptations, body plans, etc. of the animals found at the HMNH.
Field Trip: Harvard Museum of Natural History (HMNH) Objectives To observe the diversity of animals. To compare and contrast the various adaptations, body plans, etc. of the animals found at the HMNH.
Shedding Light on the Dinosaur-Bird Connection
 Shedding Light on the Dinosaur-Bird Connection This text is provided courtesy of the American Museum of Natural History. When people think of dinosaurs, two types generally come to mind: the huge herbivores
Sample Questions: EXAMINATION I Form A Mammalogy -EEOB 625. Name Composite of previous Examinations
 Sample Questions: EXAMINATION I Form A Mammalogy -EEOB 625 Name Composite of previous Examinations Part I. Define or describe only 5 of the following 6 words - 15 points (3 each). If you define all 6,
Biodiversity and Extinction. Lecture 9
 Biodiversity and Extinction Lecture 9 This lecture will help you understand: The scope of Earth s biodiversity Levels and patterns of biodiversity Mass extinction vs background extinction Attributes of
Effects of Natural Selection
 Effects of Natural Selection Lesson Plan for Secondary Science Teachers Created by Christine Taylor And Mark Urban University of Connecticut Department of Ecology and Evolutionary Biology Funded by the
LABORATORY EXERCISE 6: CLADISTICS I
 Biology 4415/5415 Evolution LABORATORY EXERCISE 6: CLADISTICS I Take a group of organisms. Let s use five: a lungfish, a frog, a crocodile, a flamingo, and a human. How to reconstruct their relationships?
Life s Natural History = a record of Successions & Extinctions. Anaerobic Bacteria. Photosynthetic Bacteria. Green Algae. Multicellular Animals
 Evolution by Natural Selection (Chapter 22) DOCTRINE TINTORETTO The Creation of the Animals 1550 The Fossil record OBSERVATION mya Quaternary 1.5 Tertiary 63 Cretaceous 135 Jurassic 180 Triassic 225 Permian
CLADISTICS Student Packet SUMMARY Phylogeny Phylogenetic trees/cladograms
 CLADISTICS Student Packet SUMMARY PHYLOGENETIC TREES AND CLADOGRAMS ARE MODELS OF EVOLUTIONARY HISTORY THAT CAN BE TESTED Phylogeny is the history of descent of organisms from their common ancestor. Phylogenetic
Tuesday, December 6, 11. Mesozoic Life
 Mesozoic Life Review of Paleozoic Transgression/regressions and Mountain building events during the paleoozoic act as driving force of evolution. regression of seas and continental uplift create variety
Name Class Date. After you read this section, you should be able to answer these questions:
 CHAPTER 14 4 Vertebrates SECTION Introduction to Animals BEFORE YOU READ After you read this section, you should be able to answer these questions: How are vertebrates different from invertebrates? How
Name: GEOL 104 Dinosaurs: A Natural History Video Assignment. DUE: Wed. Oct. 20
 GEOL 104 Dinosaurs: A Natural History Video Assignment DUE: Wed. Oct. 20 Documentaries represent one of the main media by which scientific information reaches the general public. For this assignment, you
What is the evidence for evolution?
 What is the evidence for evolution? 1. Geographic Distribution 2. Fossil Evidence & Transitional Species 3. Comparative Anatomy 1. Homologous Structures 2. Analogous Structures 3. Vestigial Structures
The Cretaceous Period
 The Cretaceous Period By Doug and Claudia Mann Illustrated by David Cobb Copyright 2007 www.fossils-facts-and-finds.com Mesozoic Era Triassic Jurassic Cretaceous The Cretaceous Period: Flowers Bloom For
UNIT III A. Descent with Modification(Ch19) B. Phylogeny (Ch20) C. Evolution of Populations (Ch21) D. Origin of Species or Speciation (Ch22)
 B. Phylogeny (Ch20) C. Evolution of Populations (Ch21) D. Origin of Species or Speciation (Ch22)") UNIT III A. Descent with Modification(Ch9) B. Phylogeny (Ch2) C. Evolution of Populations (Ch2) D. Origin of Species or Speciation (Ch22) Classification in broad term simply means putting things in classes
UNIT III A. Descent with Modification(Ch9) B. Phylogeny (Ch2) C. Evolution of Populations (Ch2) D. Origin of Species or Speciation (Ch22) Classification in broad term simply means putting things in classes
2 nd Term Final. Revision Sheet. Students Name: Grade: 11 A/B. Subject: Biology. Teacher Signature. Page 1 of 11
 2 nd Term Final Revision Sheet Students Name: Grade: 11 A/B Subject: Biology Teacher Signature Page 1 of 11 Nour Al Maref International School Riyadh, Saudi Arabia Biology Worksheet (2 nd Term) Chapter-26
BIO 1116 General Biology Lab
 BIO 1116 General Biology Lab Name: Instructor Name: Lab Day: Section: A or B (Circle One) Lab #2: Bacteriology Exercise 1: Characteristics of Bacteria Lab Study A: Colony Morphology 1. What are the most
Vertebrates. Vertebrate Characteristics. 444 Chapter 14
 4 Vertebrates Key Concept All vertebrates have a backbone, which supports other specialized body structures and functions. What You Will Learn Vertebrates have an endoskeleton that provides support and
Natural Selection Goldfish Crackers lab
 # Name Date Natural Selection Goldfish Crackers lab Introduction: Evolution is the change over time in the genetic makeup of a population. Natural selection is important in understanding this process,
Early Birds: Early Birds: Fossils and Feathers A Reading A Z Leveled Y Benchmark Book Word Count: 1,240. Fossils and Feathers BENCHMARK Y
 Early Birds: Fossils and Feathers A Reading A Z Leveled Y Benchmark Book Word Count: 1,240 BENCHMARK Y Early Birds: Fossils and Feathers Written by Alfred J. Smuskiewicz Visit www.readinga-z.com for thousands
ANTHR 1L Biological Anthropology Lab
 ANTHR 1L Biological Anthropology Lab Name: DEFINING THE ORDER PRIMATES Humans belong to the zoological Order Primates, which is one of the 18 Orders of the Class Mammalia. Today we will review some of
Pre-lab Homework Lab 8: Natural Selection
 Lab Section: Name: Pre-lab Homework Lab 8: Natural Selection 1. This week's lab uses a mathematical model to simulate the interactions of populations. What is an advantage of using a model like this over
d. Wrist bones. Pacific salmon life cycle. Atlantic salmon (different genus) can spawn more than once.
 can spawn more than once.") Lecture III.5b Answers to HW 1. (2 pts). Tiktaalik bridges the gap between fish and tetrapods by virtue of possessing which of the following? a. Humerus. b. Radius. c. Ulna. d. Wrist bones. 2. (2 pts)
Lecture III.5b Answers to HW 1. (2 pts). Tiktaalik bridges the gap between fish and tetrapods by virtue of possessing which of the following? a. Humerus. b. Radius. c. Ulna. d. Wrist bones. 2. (2 pts)
EBOOK REAU2013_sample SAMPLE
 EBOOK REAU2013_sample Contents About This Book 4 Notes For Teachers and Parents 5-6 Address Book 7 Online Libraries and References 8 Dinosaur Facts 9 More Dinosaur Facts 10 Dinosaur Fossils 11 The Age
S7L2_Genetics and S7L5_Theory of Evolution (Thrower)
") Name: Date: 1. Single-celled organisms can reproduce and create cells exactly like themselves without combining genes from two different parent cells. When they do this, they use a type of A. asexual reproduction.
Name: Date: 1. Single-celled organisms can reproduce and create cells exactly like themselves without combining genes from two different parent cells. When they do this, they use a type of A. asexual reproduction.
The Divergence of the Marine Iguana: Amblyrhyncus cristatus. from its earlier land ancestor (what is now the Land Iguana). While both the land and
. While both the land and") Chris Lang Course Paper Sophomore College October 9, 2008 Abstract--- The Divergence of the Marine Iguana: Amblyrhyncus cristatus In this course paper, I address the divergence of the Galapagos Marine
Chris Lang Course Paper Sophomore College October 9, 2008 Abstract--- The Divergence of the Marine Iguana: Amblyrhyncus cristatus In this course paper, I address the divergence of the Galapagos Marine
The Theory of Evolution
 The Theory of Evolution Darwin Notes Pt. 2 Charles Darwin Darwin was born in 1809 in England. He was from a strong Christian family. Age 16, Darwin was sent by his father to study medicine He left and
Population Dynamics: Predator/Prey Teacher Version
 Population Dynamics: Predator/Prey Teacher Version In this lab students will simulate the population dynamics in the lives of bunnies and wolves. They will discover how both predator and prey interact
Name Date Class. From the list below, choose the term that best completes each sentence.
 Name Date Class Structure and Function of Vertebrates Review and Reinforce Birds Understanding Main Ideas Answer the following questions. 1. What are four characteristics that all birds share? 2. What
Charles Darwin. The Theory of Evolution
 The Theory of Evolution Darwin Notes Pt. 2 Charles Darwin Darwin was born in 1809 in England. He was from a strong Christian family. Age 16, Darwin was sent by his father to study medicine He left and
Get the other MEGA courses!
 www.thesimplehomeschool.com Simple Schooling BUGS MEGA course is ten weeks of all about bugs! This course grabs your student s attention and never lets go! Grades K-3 Get the other MEGA courses! Simple
Biology. Slide 1of 50. End Show. Copyright Pearson Prentice Hall
 Biology 1of 50 2of 50 Phylogeny of Chordates Nonvertebrate chordates Jawless fishes Sharks & their relatives Bony fishes Reptiles Amphibians Birds Mammals Invertebrate ancestor 3of 50 A vertebrate dry,
Supplement A: Phenomena Information Packet (1 of 6)
") Supplement A: Phenomena Information Packet (1 of 6) Fit of Continents Three hundred years ago, a man named Abraham Ortelium noticed that maps of the world showed continents that seemed like they would
Supplement A: Phenomena Information Packet (1 of 6) Fit of Continents Three hundred years ago, a man named Abraham Ortelium noticed that maps of the world showed continents that seemed like they would