Cortical Areas Involved in Horizontal OKN in Cats: Metabolic Activity
|
|
|
- Christian Gardner
- 5 years ago
- Views:
Transcription
1 The Journal of Neuroscience, April 1989, g(4): 1150-l 162 Cortical Areas Involved in Horizontal OKN in Cats: Metabolic Activity Susan J. Herdman, Ronald J. Tusa,2 and Carolyn 6. Smith3 Department of Otolaryngology-Head and Neck Surgery, and 2Department of Neurology, Johns Hopkins Hospital, Baltimore, Maryland 21205, and 3Laboratory of Cerebral Metabolism, National Institute of Mental Health, Bethesda, Maryland Cerebral cortex improves optokinetic responses to high target velocities, but the specific cortical areas involved are unknown. Using the 14C-deoxyglucose technique, we compared local rates of cerebral glucose utilization in cats viewing a moving optokinetic nystagmus (OKN) drum (experimental group) with those in cats viewing a stationary OKN drum (control group). In the experimental group, glucose utilization was increased in areas 17 and 18 and in 4 areas in suprasylvian cortex (21 a, 21 b, PMLS, and VLS). There were no changes in glucose utilization in areas 7, 19, 20a, 20b, ALLS, AMLS, DLS, PLLS, the posterior suprasylvian area, and the splenial visual area. The increases in glucose utilization in areas 17 and 18 were most significant in the granular layers (inner Ill and IV). In areas 21 a, 21 b, PMLS, and VLS, the increases in glucose utilization extended from layers II through V. There was also a regional distribution of the increase in glucose utilization within each of these areas in the experimental animals. The increase in glucose utilization did not include the rostra1 portion of PMLS or the borders between areas PMLS and 2 1 a, and VLS and 2 1 b. In addition, there was a smaller increase in glucose utilization at the borders between areas 17 and 18 than in other portions of these 2 areas. The results indicate that areas 17, 18, 21a, 21 b, PMLS, and VLS may be involved in the cortical modulation of horizontal OKN. The laminar distribution of label within the cortical areas corresponds with the distribution of projections from the dorsal lateral geniculate nucleus to areas 17 and 18, and from areas 17 and 18 to PMLS. The regional distribution of the metabolic activity within areas 17,18, and PMLS coincides with that portion of cortex expected to be excited by either the spatial frequency of the stimulus or the retinalslip velocity (drum velocity minus slow phase eye velocity) occurring during the eye movements. In the cat, cerebral cortex improves optokinetic responses at high stimulus velocities (Montarolo et al., 1981; Hoffmann, 1982; Strong et al., 1984; Ventre, 1985). Extensive unilateral ablation of suprasylvian cortex involving areas PMLS, PLLS, Received Feb. 10, 1988; revised June 27, 1988; accepted Sept. 8, This work was supported by the Foundation for Physical Therapy and the Wilmer Core Grant EY We wish to thank Drs. James M. Sprague, Gary Rubin, and Louis Sokoloff and Alison Tannenbaum, J. D. Brown, and Jane Jehle for their thoughtful assistance. Correspondence should be addressed to Susan J. Herdman, Ph.D., Department of Otolatyngology-Head and Neck Surgery, Carnegie 485, Johns Hopkins Hospital, 600 N. Wolfe Street, Baltimore, MD Copyright Society for Neuroscience /89/ $02.00/O AMLS, ALLS, DLS, VLS, and 7, or bilateral lesions of areas decreases the velocity of slow phase eye movements of optokinetic nystagmus (OKN) (Montarolo et al., 1981; Ventre, 1985). In addition, areas PMLS, AMLS, 21a, 21b, 17, and 18 project to subcortical structures (the nucleus of the optic tract and the dorsal terminal nucleus) involved in the generation of OKN (Berson and Graybiel, 1980; Schoppmann, 1981; Marcotte and Updyke, 1982). The purpose of this study was to further define the specific cortical areas involved in OKN. We used the quantitative I%- deoxyglucose technique to measure local rates of cerebral glucose utilization in cats during the generation of an optokinetic response. These results were compared with values obtained from cats viewing a stationary OKN drum. Previous studies have evaluated the metabolic activity of cat visual cortex using the 2-deoxyglucose technique, but these studies were strictly qualitative and examined only cortical areas 17-l 9 (Albus, 1979; Flood and Coleman, 1979; Lang and Henn, 1980; Schoppmann and Stryker, 1981; Singer, 1981; Tootell et al., 1981; Wagner et al., 1981; Thompson et al., 1983; Albus and Sieber, 1984; Lowe1 et al., 1987). In our study, we have quantitatively examined the metabolic activity of all known cortical visual areas lying within occipital, temporal, and parietal cortex in awake behaving cats viewing an OKN drum. We found that only 6 regions of cortex-corresponding to areas 17, 18, 2 la, 21 b, PMLS, and VLS- had an increase in glucose utilization in cats generating horizontal OKN. In the second paper we will describe the effects of unilateral ablation of areas 17, 18, 21a, 21b, PMLS, and VLS on OKN, VOR, and VOR gain plasticity (Tusa et al., 1989). Preliminary reports of this research have been presented elsewhere (Herdman and Tusa, 1984, 1986). Materials and Methods GeneraI experimental procedures. Nine adult, male cats ( kg) were used in this study. Plexiglas head holders and eye coils were implanted under sterile conditions while the animals were anesthetized with intravenously administered sodium pentobarbital The cats were treated postoperatively with ophthalmic ointment and penicillin administered intramuscularly for 1 week. Five days after surgery, oculomotor responses were tested in each cat using the magnetic-field search coil technique (Robinson, 1963). This recording system has a resolution of 1.5 min of arc and is linear within a 40 range with an error of less than 6%. The head holder was used to immobilize the cat s head so that the eyes were level with the horizon. Awake cats were restrained by placing their bodies in a canvas bag inside a loose-fitting box to which their head plates were bolted. The eye movement recording system was calibrated by rotating the magnetic field coils around the stationary cat at a known speed (Robinson, 1976). Measurements for calibration were taken during moments of steady eye fixation. In the experimental group, OKN responses were elicited by rotating
2 The Journal of Neuroscience, April 1989, 9(4) 1151 a full-field drum around the cat s head. The stimulus was a full-field OKN drum that contained a random pattern of black circles that subtended a visual angle of 8 16 against a white background. A 2-dimensional FFT of the image was computed using Fourier Prospective II for the IBM PC (Alligator Transforms, Costa Mesa. CA). The bandwidths were then computed on the basis of a horizontal slice through the origin of the 2-dimensional FFT. The stimulus had a contrast that approached 1 and a spatial frequency at half-maximum amplitude of cycles/deg and at l/loth maximum amplitude of 0.38 cycles/deg. The steady-state optokinetic slow phase eye velocities at drum speeds ranging from 5 to 120Ysec (accelerated at 0.1 S /sec/sec) were determined for each cat. The drum velocity that elicited the maximum slow phase eye velocity of OKN during binocular viewing was then used during the deoxyglucose experiment. During the deoxyglucose experiment, the OKN drum was rotated at a constant velocity in a clockwise direction only. The mean drum velocity used was 45 /sec. In the control group, the cats viewed the same OKN drum, but the drum was held stationary. Spontaneous saccades were monitored during the deoxyglucose experiment for later calculation of the frequency, retinal slip velocity, and direction of saccades. The ambient lighting was the same for both the experimental and the control groups. Determination of local rates of cerebral glucose utilization. Local rates of cerebral glucose utilization were determined by means of the autoradiographic 14C-deoxyglucose method in 3 control and 4 experimental cats (Sokoloff et al., 1977). In 2 other cats the deoxyglucose technique was used, but the results were not quantitated. The results from these 2 cats were used for mapping purposes only. While the cats were anesthetized with halothane and nitrous oxide gas, polyethylene catheters were inserted into one femoral artery and vein. The free ends of both catheters were tunneled subcutaneously from the groin to a subcutaneous pocket in the animal s back. The tissues around the incisions were infiltrated with a long-acting topical anesthetic (2% marcaine with epinephrine, 6 hr effective duration). In addition, pledgets soaked with the anesthetic were placed in the incision. The incisions were closed and the general anesthesia stopped. The animals were then returned to their home cages and allowed to recover from the anesthesia for 3 hr. At the end of this time the topical anesthetics were reapplied, and the free ends of the catheters were removed from the subcutaneous pocket. The animals were then positioned in the OKN drum. To eliminate the novelty effect of the stimulus (Hand, 198 l), the cats viewed rotating OKN drum (experimental group) or a stationary drum (control group) for 5 min before the injection of the deoxyglucose. A pulse of 2-deoxy-D-14C-glucose (100 &i/kg body weight; specific activity, mci/mmol, New England Nuclear) contained in 1 ml of normal saline was injected intravenously and the animals were stimulated for 45 min. Decreases in slow-phase eye velocity in the experimental cats or decreases in the frequency of spontaneous saccades in the control cats were used as an indicator that the animal s alertness was decreasing. Novel auditory stimuli were used to help maintain the animals alertness. Plasma glucose and deoxyglucose concentrations were determined in arterial blood samples taken sequentially during the experiment. At the end of the 45 min period, the cats were injected intravenously with a lethal dose (50 mg/kg body weight) of sodium pentobarbital and then perfused for 1 min with normal saline followed by perfusion for 1 min with 3.3% formalin (phosphate buffered, ph 7.4). This perfusion procedure does not alter the quantitative aspects of the labeling (Hand, 1981). The brain was then blocked in a stereotaxic apparams. Each block of tissue was frozen in isopentane chilled to -40 C with drv ice and was stored at - 70 C. Coronal sections. 20 urn thick, were cut in a cryostat maintained at - 18 C. Every Sth section was picked up on a gelatin-coated slide and immediately dried on a hot plate heated to 60 C. The tissue sections, along with calibrated 14Cmethylmethacrylate standards were then placed in x-ray cassettes and autoradiographs were prepared on SB5 film (Kodak) (Sokoloff et al., 1977). After development of the autoradiographs, the tissue sections were stained with thionine for histological examination. Autoradiographs were scanned and digitized with a Photoscan System P densitometer (Optronics International, Chelmsford, MA) (Goothee et al., 1980). Rates of glucose utilization were determined as described previously (Sokoloff et al., 1977). A value of was used as the lumped constant (Sokoloff, 1982). The cytoarchitectural boundaries and laminae of areas 17-l 9 were based on the histological descriptions of Otsuka and Hassler (1962). The locations of the other visual cortical areas (7, 20a, 20b, 21a, 2 lb, PMLS, PLLS, AMLS, ALLS, DLS, VLS, PS, and SVA) were based on the maps of Tusa et al. (1978, 1979), Tusa and Palmer (1980), Palmer et al. (1978), and Rosenquist (1985). For each cortical area, rates of glucose utilization were determined within a representative portion of cortex extending from the top of layer I to the junction of the gray and white matter. For each cortical area, measurements were repeated through a series of 6-25 coronal sections depending on the extent of the area. One reading was made for each area in each section. The local rates of glucose utilization in the supragranular (II, outer III), infragranular (V, VI), and granular (inner III, IV) layers for areas 17 and 18 were also determined. Analysis of the distribution of label by individual layers in areas 17 and 18 was not possible because the resolution of the quantitative 14C-deoxyglucose technique is limited to 200 pm (Smith, 1983). Statistical analysis. Each cortical area in the experimental cats and in the control cats was analyzed for differences in rates of glucose utilization between the right and the left hemispheres with a paired t test. Because several cortical areas were measured in each animal, the Bonferroni correction for multiple comparisons was applied (Miller, 1966). Each cortical area was also analyzed for statistically significant differences in rates of glucose utilization between the experimental and the control groups with the Student s t test and the Bonferroni correction. Preparation of cortical flat maps. The locations of the label in the digitized autoradiographs were fitted onto a 2-dimensional reconstruction of cat cortex according to the techniques of Van Essen and Maunsell (1980) and Ungerleider and Desimone (1986). This was done by photographing autoradiographs of coronal sections spaced every l-2 mm. A wire outline of each photographed coronal section was then made. On each wire outline we marked the location of regions with a statistically significant increase in metabolic activity, the sulci and the lips of the fundi. The wire outlines were then soldered onto orthogonal wires with the appropriate spacing maintained between each section. This 3-dimensional model of the cat brain was then flattened into a 2-d& mensional map. In order to do this, the model was cut on the medial surface along a horizontal line from the splenium of the corpus callosum to the occipital pole. In some cats, additional cuts had to be. made near the anterior ectosylvian sulcus. In order to determine to what extent the regions of increased glucose utilization correspond with visual cortical areas defined electrophysiologically, a 2dimensional reconstruction was also made of the published electrophysiological maps of cat cerebral cortex (Tusa et al., 1981). Results Eye velocity In the experimental cats, the mean slow-phase eye velocity was 16.4 f 2.2 /sec (mean f SD) and the mean retinal-slip velocity (drum velocity minus eye velocity) for slow phase eye movements was 29.5 f S.O /sec. The mean retinal-slip velocity during quick-phase eye movements was Vsec. All experimental cats made slow phase optokinetic eye movements for the entire 45 min deoxyglucose experiment. In the control cats, the mean retinal-slip velocity during spontaneous saccades was t 8.7 /sec, and the same number of saccades were made in both directions. The frequency of saccades in the control cats was l/20 the frequency of the quick phases made by the cats in the experimental group. Local rates of glucose utilization Rates of glucose utilization were determined in 20 cortical regions in 4 experimental and 3 control cats. When interhemispheric comparisons were made, only area PMLS in the control animals showed a statistically significant difference (p < 0.05, paired t test) (Table 1). In the supragranular layers of area 17 and in area 20b in the control cats and in the granular layers of area 17 in the experimental cats, the differences between the 2 sides approached statistical significance (p -C 0.1). In all cases, the differences between the 2 sides were less than 6.6%. This percentage difference is within the inherent error of the deoxyglucose technique, which can be as high as 1 O-l 5% (L. Sokoloff, personal communication). Additionally, when the Bonferroni correction for multiple comparisons was applied, none of the side-to-side differences were significant. Because of the low per-
3 f a3
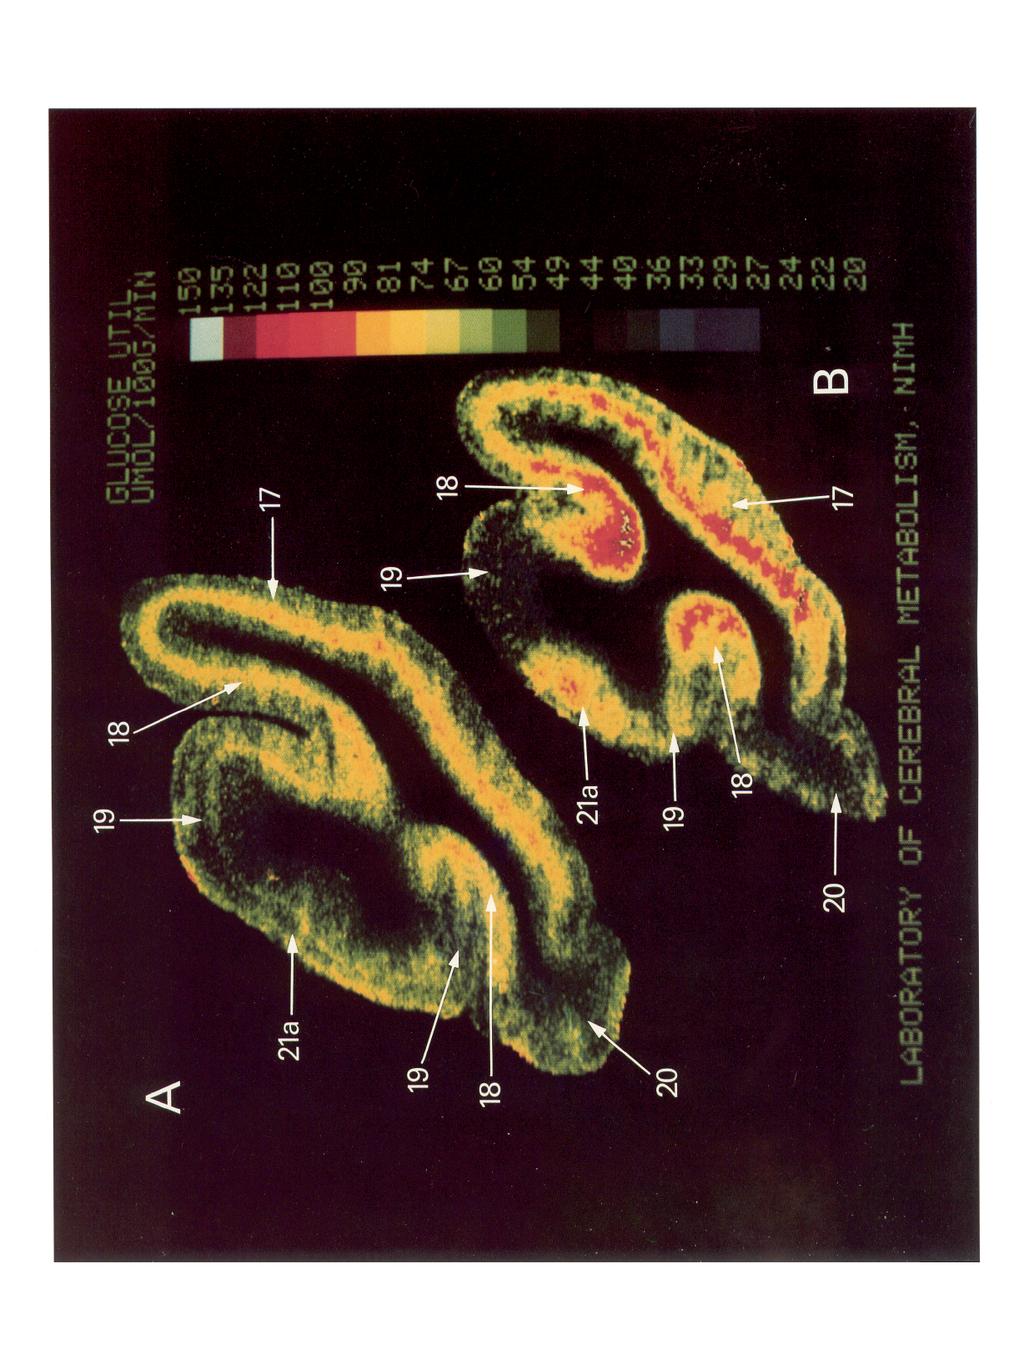
4 The Journal of Neuroscience, April 1989, 9(4) 1153 centage difference, as well as the results of the statistical analyses, side-to-side differences were not considered further, and the means of the left and right values from each animal were averaged. When the metabolic activity of the areas in the experimental group was compared with the metabolic activity of the areas in the control group (Table 2), the granular layers of areas 17 and 18, the infragranular layers of area 18, and areas PMLS, 2 1 b, and 2 1 a had a significant increase in the rates of glucose utilization in the experimental group compared with the control group (p < 0.05, Student s t test). The differences between the 2 groups for each area ranged from 13 to 36%. There was also an increase in glucose utilization in area VLS and in the infragranular layers of area 17 in the experimental group compared with control group that approached statistical significance (p < 0.09) and that represented a 12-22% difference between the 2 groups. For area PS, there was a large percentage difference (18%) between the experimental and the control group, but this difference did not approach statistical < 0.26). In areas 20b, 20a, ALLS, SVA, AMLS, 19,7, DLS, PLLS, and the supragranular layers of areas 17 and 18, no statistically significant differences were found between the experimental and the control groups (p > 0.20) and the percentage differences were small. When the Bonferroni correction for multiple comparisons was applied, only the increase in glucose utilization in the granular layers of areas 17 and 18 was statistically significant. With the Bonferroni correction for multiple comparisons, a 0.05 level of significance is reached at a p value that is less than Representative autoradiographs prepared from brain sections from a cat in the control group (Fig. 1A) and from a cat in the experimental group (Fig. 1B) taken at a comparable level are shown in Figure 1. In the control cat, the label was distributed primarily in the cortical mantle in areas 17 and 18. Based on a comparison of the autoradiograph with the thionine stain of the same tissue section, this label was located in the granular layers (inner portion of III, and layer IV) of cortex. In the experimental cat (Fig. lb), there was an increase in glucose utilization in the granular and infragranular layers of areas 17 and 18 and there were also increases in glucose utilization in 4 areas in suprasylvian cortex, one of which (area 21 a) is shown in this figure. Based on a comparison of the autoradiographs to the thionine stain of the same tissue sections, the increase in glucose utilization in the suprasylvian areas extended through layers II-V. Regional distribution of glucose utilization in cortical areas Portions of the 6 cortical areas in an experimental cat that had an increase in glucose utilization are illustrated in Figure 2. The boundaries of areas 17 and 18 on the line drawings were based on thionine-stained tissue sections (Otsuka and Hassler, 1962). The boundaries of the other cortical areas on the line drawings were based on published electrophysiological mapping studies t Table 1. Interhemispheric utilization Cortical area comparison of local rates of glucose Glucose utilization bmol/ 100 gm/min) Left Riaht Control animals (n = 3) 17 infragranular * granular k supragranular k infragranular k granular & supragranular k k a k b 42.6 k WA 50.7 k a 54.8 k 2.6a 54.2 f b 51.7 k ALLS 50.2 f AMLS PLLS 45.8 f PMLS 54.7 k PS t f 4.2 VLS 54.0 k k 3.0 DLS k 1.8 LJ Difference (%j Experimental animals (n = 4) 17 infragranular f granular AI supragranular k infragranular granular e supragranular a k a 39.4 k f b SVA 46.0 t 4.4b 46.9 k a 68.8 f I!z b k ALLS Ifr AMLS PLLS 47.2 k PMLS 66.3 k f PS 50.8 k 4.gb 51.2 k VLS 65.1 k k DLS 46.4 k IL Values for glucose utilization are the means + SE. The number of animals in each group is listed in the parentheses. Side-to-side comparisons were carried out separately for the experimental and the control groups. Data were analyzed for statistical significance by means of a paired t test. Side-to-side differences for each area are also given as percentages. I n = 2; 6 n = 3 Figure 1. Representative autoradiograph from a cat in the control group (A) and a cat in the experimental group (B) taken at comparable levels. These autoradiographs have been digitized with an image-processing system and color-coded for local rates of glucose utilization. The color bar provides a scale that indicates actual rates of glucose utilization (in Fmol glucose/100 gm tissue/min), with white indicating the highest level of utilization. In the control animal (A), the label was distributed in the middle of the cortical mantle in areas 17 and 18. In the experimental cat (B), there was an increase in the rate of glucose utilization in the granular and infragranular layers in areas 17 and 18 and in 4 suprasylvian areas, one of which is shown in here (2 1 a).
 contain portions of the 6 cortical areas that had an increase in glucose utilization in the experimental cats.")
5 1154 Herdman et al. * Cortical I Metabolic Activity lcm in Cat, Figure 2. Regional distribution of glucose utilization in cortex of a stimulated cat. These digitized autoradiographs (A-c) contain portions of the 6 cortical areas that had an increase in glucose utilization in the experimental cats. In this figure, the colors do not represent actual rates of glucose utilization, but the order of the colors is the same as that shown in Figure 1, in which lower rates are represented in black, blue, and green and higher rates in yellow, red, and white. The boundaries of the cortical areas are indicated on the line drawings (A -C ). The boundaries of areas 17
6 The Journal of Neuroscience, April 1989, 9(4) 1155 (Tusa et al., 198 1). All of the regions with relatively high metabolic activity within cerebral cortex (as indicated by the red color) lie within areas 17, 18, 21a, 2 1 b, PMLS, and VLS or within a region that corresponds with auditory cortex (Au) (Reale and Imig, 1980). There was no evidence of a columnar organization in the distribution of the label within the 6 visual areas. Within each of these cortical areas in the experimental cats there appeared to be a regional distribution in the metabolic activity. The increase in the rate of glucose utilization did not include the portion of PMLS in the fundus of the suprasylvian sulcus (Fig. 2, B, C ) nor the borders between areas 21a and PMLS, or between areas VLS and 2 1 b (Fig. 2B). A relatively smaller increase in metabolic activity, compared with the rest of areas 17 and 18, occurred at the border between areas 17 and 18. This is more clearly illustrated in the enlarged section in Figure 3. No regional distribution of metabolic activity was noted in the control cats. Figure 3 shows enlarged views of digitized autoradiographs at the 17/ 18 border and the 18/ 19 border from an experimental cat along with the same sections stained with thionine. The rate of glucose utilization was relatively less within the portion of area 17 adjacent to the 17/l 8 border (Fig. 3B). This portion of cortex with a lower rate of glucose utilization overlaps the histological transition zone (Humphrey et al., 1985a) at the 17/ 18 border and extends into area 17. This relative decrease in glucose utilization extended along the entire rostrocaudal length of the 17/ 18 border, although it was most obvious from Horsley-Clarke Pl-P4, which is at or near the representation of area centralis in most cats (Tusa et al., 1978). There is also a histological transition zone between areas 18 and 19 (Humphrey et al., 1985b). Glucose utilization decreases at the beginning of this transition zone within area 18 and decreases further at the end of transition zone in area 19 (Fig. 30). Two-dimensional reconstructions Two-dimensional reconstructions of cerebral cortex from 2 representative cats from the experimental group are shown in Figure 4, A, B. The regions in which metabolic activity was higher in the experimental cats compared with the control cats are shaded. The borders of the regions of high metabolic activity were marked based on large (> 15%) decreases in metabolic activity compared with the adjacent cortex. In each of the 2-dimensional reconstructions, the caudal portion of the cerebral hemisphere is to the left, the most rostra1 section is to the right, the corpus callosum (CC) is at the top, and entorhinal (Erh) and paramygdala (Pam) cortices are at the bottom of the figure. The thin solid lines indicate the contour lines of each coronal section. The thick solid lines indicate the lips of each sulcus, and the dashed lines indicate the fundus of each sulcus. The reconstructions in Figure 4, A, B, should be compared with the 2-dimensional reconstruction of the electrophysiological maps of Tusa et al. (198 1) shown in Figure 4C. The region a in the maps of metabolic activity (Fig. 4, A, B) corresponds to areas 17 and 18 (Fig. 4Q while regions b, c, d, and e roughly lie within areas 21a, PMLS, 21 b, and VLS. The same number Table 2. Comparison of local rates of glucose utilization between control and experimental cats Cortical area Glucose utilization (pmol/ 100 gm/min) Differ- Control Experimental ence (n = 3) (n = 4) P (o/o) 18 granular 68.9 k k granular 70.1? * PMLS * b 51.6? a 56.8 k infragranular 53.7 k rk VLS 53.9 f k infragranular 54.1 f ? supragranular 52.5 f k PB 43.3 f k b a 45.3 t ALLS k SVA i AMLS 50.9 k ? supragranular 54.2 k k k k a 42.3 Z!I t DLS 47.4 k k PLLSb 46.5 k k The values of glucose utilization are the means * SE. Structures are rank-ordered according to their statistical significance. The number of animals in each group is listed in the parentheses. Group comparisons were made with the Student s t test. Significant increases in glucose. utilization occurred in the granular layers (inner portion of layer III and IV) of areas 17 and 18 and in areas 21a, 21b, and PMLS and in the infragranular layers of area 18 in the experimental group compared with the control group. In area VLS and the infragranular layers of area 17, the increases in glucose utilization in the experimental group compared with the control group approached significance. y In the experimental group, n = 3. b In the control group, n = 2. of regions were always labeled in each experimental cat, but the location of the label varied slightly from animal to animal. In addition, there was no increase in metabolic activity at the border between the regions corresponding to areas 2 la and PMLS and between VLS and 21 b, in the fundus of the suprasylvian sulcus in PMLS and in the most rostra1 portion of area PMLS in the experimental cats compared with the control cats. There was a relatively small increase in metabolic activity, compared with the rest of areas 17 and 18, at the border between areas 17 and 18. The electrophysiologically defined PMLS (Fig. 4C) extends 6 mm more rostra1 than did the corresponding region of high metabolic activity ( c in Fig. 4, A, B). Discussion The principal conclusion from this study is that there is a 20-36% increase in glucose utilization in 5 cortical regions-corresponding to areas 17, 18, 2 1 a, 2 1 b, and PMLS - in cats gen- t and 18 were based on thionine-stained tissue sections (Otsuka and Hassler, 1962). The boundaries of the other visual cortical areas were based on published electrophysiological mapping studies (Tusa et al., 198 1). All of the cortical regions with a relatively high metabolic activity (as indicated by the red color) lie within areas 17, 18, 21a, 2 1 b, PMLS, and VLS or within a region that corresponds with auditory cortex (AU) (Reale and Imig, 1980).

7 1156 Herdman et al. * Cortical Metabolic Activity in Cat
8 The Journal of Neuroscience, April 1989, 9(4) 1157 erating horizontal OKN compared with cats viewing a stationary OKN drum (p < 0.05). There was also a 22% increase in glucose utilization in area VLS in the experimental cats compared with the control cats, but this difference did not reach statistical significance (p < 0.09). No significant change in metabolic activity occurred in areas 7, 19, 20a, 20b, AMLS, ALLS, PLLS, DLS, and SVA (p > 0.20). When the more rigorous Bonferroni correction for multiple comparisons was applied, only the granular layers of areas 17 and 18 had a truly statistically significant increase in the experimental group compared with the control group. The Bonferroni correction can conceal physiologically significant changes, however, when the number of subjects studied is small, as in our study. Therefore, our determination of the relevance of an increase in glucose utilization was based on both the percentage change in glucose utilization and on the results of statistical analyses using Student s t test. The cortical areas in which we found an increase in glucose utilization are part of the region thought to be involved in horizontal OKN based on lesion studies and anatomical projection studies. Bilateral ablation encompassing areas 17-l 9 or unilateral ablation encompassing areas 7, AMLS, PMLS, VLS, ALLS, PLLS, and DLS decreases slow phase eye velocity of OISN (Montalaro et al., 1981; Ventre, 1985). A detailed evaluation of the effects of selective ablation within these regions has not been made, however, so it is possible that not all of these areas are involved in OKN. The nucleus of the optic tract (NOT) and the dorsal terminal nucleus (DTN), 2 subcortical regions involved in horizontal OKN, receive projections from areas 17, 18, 2 la, 2 1 b, AMLS, PMLS, and PLLS (Berson and Graybiel, 1980; Schoppmann, 198 1; Marcotte and Updyke, 1982). Projections from cortex to these subcortical areas may be involved in functions other than OKN. We believe that the deoxyglucose technique has allowed us to further define the specific cortical areas involved in horizontal OKN. It is possible that metabolic activity in different cortical areas would increase if a vertically moving stimulus were used. Efect of stimulus direction The presence of direction-selective cells in cat cortex has been known for many years (Hubel and Wiesel, 1959, 1962). Although all directions appear to be represented in different cortical areas, single-unit studies in paralyzed cats have shown that not all directions are equally represented. For example, in areas 17 and 18, downward movement is preferred more often than upward movement, and temporal movement is preferred more than movement nasally (Berman et al., 1987). Additionally, in PMLS and PLLS, 3 times as many cells prefer stimuli moving away from the representation of area centralis as prefer stimuli moving toward area centralis (Camarda and Rizzolatti, 1976). Rauschecker et al. (1987) extended these findings to show that the preferred direction for cells in area PMLS was not along the horizontal meridian but, rather, was away from area centralis into the contralateral upper visual field. In our study, however, cats were generating eye movements in both directions along the horizontal meridian. The direction of the stimulus movement across the retina during slow-phase eye movements was in the opposite direction of the stimulus movement across the retina during the quick-phase eye movements. A bias in the directional preference of the cells, therefore, would not be reflected by asymmetries in local rates of glucose utilization. Laminar distribution of label The laminar distribution of metabolic activity in our study is most consistent with the concept that deoxyglucose labeling reflects the metabolic activity of axon terminals (Schwartz et al., 1979; Kadekaro et al., 1985). In areas 17 and 18 in the experimental cats, glucose utilization was most significantly increased in the granular layers (inner part of layer III and in layer IV) and moderately increased in the infragranular layers (layers V and VI). This pattern of increased metabolic activity coincides with the distribution of projections from the main laminae of the dorsal lateral geniculate nucleus (dlgn), which terminates in the inner part of layer III, layer IV, and layer VI (LeVay and Gilbert, 1976; Ferster and LeVay, 1978: Symonds et al., 198 1). Although the C laminae of dlgn and the pulvinar-lateral posterior nuclear complex also project to areas 17 and 18, these projections terminate, in part, outside of the layers activated in our study (LeVay and Gilbert, 1976; Symonds et al., 198 1). Areas 17 and 18 also receive projections from other cortical areas, but the laminar distribution of the projections is not known (Symonds and Rosenquist, 1984). In areas 2 la, 2 1 b, PMLS, and VLS the increase in metabolic activity in the experimental cats was more diffuse and was distributed throughout layers II-V. Within area PMLS this distribution of increased metabolic activity overlaps with the distribution of projections from areas 17 and 18, which terminate in layers III-V (Kawamura and Naito, 1976; Sugiyama, 1979; Kato et al., 1986). Although PMLS also receives projections from subcortical areas, the correlation between subcortical terminals and the laminar distribution of label is not strong. The C lamina of dlgn projects to layers I and IV, and the medial interlaminar nucleus and the posterior nucleus project to layer IV of PMLS (Rosenquist et al., 1974; LeVay and Gilbert, 1976). Areas 21a, 2 1 b, and VLS also receive projections from areas 17 and 18 and the thalamus (Symonds et al., 198 1; Symonds and Rosenquist, 1984) but the laminar distribution of these projections is not known. Based on preliminary data, the increase in glucose utilization in areas PMLS and 21a in cats generating OKN appears to depend on areas 17 and 18 (Herdman et al., 1987). Following unilateral ablation of areas 17 and 18 plus section of the corpus callosum, areas 21a and PMLS no longer show an increase in metabolic activity in cats generating OKN. This lack of an increase in metabolic activity may be due to the disruption of the bilateral projections from areas 17 and 18 to areas 2 la and PMLS (Segraves and Rosenquist, 1982; Symonds and Rosenquist, 1984). In summary, the laminar distribution of increased metabolic activity in cats generating OKN in areas 17 and 18 corresponds most closely to the distribution of the projections from the main laminae of the dlgn. The laminar distribution of increased metabolic activity in area PMLS corresponds best to the distribution of the projections from areas 17 and 18. Based on the correlation of metabolic activity with the laminar distribution ofterminals, the sequence of information processing used during OKN may be from dlgn to areas 17 and 18, and from areas 17 and 18 to PMLS. Regional distribution of label within areas We found that the increase in metabolic activity in cats generating OISN did not occupy the full extent of areas 17, 18, 2 la,
9 1 158 Herdman et al. - Cortical Metabolic Activity in Cat Figure 4. Two-dimensional reconstruction of cerebral cortex from 2 experimental cats (A and B). The portion of cortex with increased metabolic activity in the experimental cats compared with the control cats is shaded. These flat maps can be compared with the 2-dimensional reconstruction of the electrophysiological maps of Tusa et al. (198 1) (C). Thin solid lines indicate the contour of the middle of the cortical mantle from coronal sections used in the reconstructions. Thick solid lines indicate the lips of each sulcus, and the dashed lines indicate the fundus of each sulcus. The arrows connecting the ends of some thin solid lines indicate the location of cuts that were made in the contour lines in order to flatten the reconstruction. The thick arrow on the medial view of the hemisnhere in C indicates the location of these cuts on the hemisphere. The coronal sections used in the construction of the flat map are indicated on the lateral views of the cat brain. In C, the histological border of areas 17 and 18 is indicated by a heavy dotted line. The shaded region labeled a in the reconstructions of metabolic activity corresponds to areas 17 and 18, b to area 2 la, c to PMLS, d to area 2 1 b, and e to area VLS. The A/P level for the rostra1 extent of the label corresponding to area PMLS is indicated on the lateral surface view of the hemisphere. Abbreviations: CC, corpus callosum; Cr, cruciatus sulcus; Sp, splenial sulcus; Ss, suprasplenial sulcus; Lat, lateral sulcus; PI, posterior lateral sulcus; Ent, entolateral sulcus; Mss, middle suprasylvian sulcus; Pss, posterior suprasylvian sulcus; Pe, posterior ectosylvian sulcus; Ae, anterior ectosylvian sulcus; Sy, sylvian sulcus; Rh, rhinal sulcus; Erh, entorhinal cortex; Pam, paramygdala cortex. +--iek- 21 b, PMLS, and VLS as defined in electrophysiological mapping studies. There was no increase in metabolic activity at the borders between 2 la and PMLS and between 21 b and VLS, in the fundus of the suprasylvian sulcus in PMLS, or in the rostra1 portion of PMLS. In addition, the metabolic activity at the 17 and 18 border was less than the metabolic activity of the rest of these 2 areas. Because we used a full-field stimulus to elicit OKN, we do not think that these regional variations reflect the portion of the visual field stimulated but instead are related to differences in the cellular responses within the areas. We will discuss what is known about the regional differences of the cellular responses in these areas as they pertain to the sensory properties of the stimulus we used and to the motor response evoked by the stimulus. Spatial frequency and target velocity The stimulus we used to elicit OKN contained a broad range of spatial frequencies with a peak at cycles/deg at half- maximum amplitude and 0.38 cycles/deg at l/loth maximum amplitude. In area 17, cells are best tuned to a spatial frequency of 3 cycles/deg at area centralis and 0.3 cycles/deg at 15 eccentricity (Movshon et al., 1978). A rapidly moving pattern with a low spatial frequency, as used in our experiment, would not be optimal for the spatial and temporal frequency resolution of area 17 and would not be expected to excite cells in the central 5 of the visual field. The preferred spatial frequencies of the cells in area 18 are lower, ranging from 0.5 cycles/deg at area centralis to 0.1 cycles/deg at 15 eccentricity (Movshon et al., 1978), and as we found, all of this portion of area 18 should be activated by the stimulus we used. The preferred spatial frequencies of cells in area PMLS ranges from 0.5 cycles/deg in the central 5 to 0.1 cycles/deg at 40 eccentricity (Morrone et al., 1986). The spatial and temporal frequency of the stimulus we used may be too high to excite the cells within the representation of the peripheral portion of the visual field, which lies in rostra1 PMLS, and may be too low to excite the cells within
10 The Journal of Neuroscience, April 1989, 9(4) 1159 Figure 4. Continued. the representation of area centralis. Thus, the spatial and temporal frequency of the stimulus we used could explain the regional distribution of label in areas 17, 18, and PMLS. Moreover, we believe the results of our metabolic study extend our knowledge about the regional distribution of preferred spatial frequency throughout areas 17, 18, and PMLS. Previous studies on the distribution of preferred spatial frequencies in these areas were limited to the examination of the more central portions of the visual field (Movshon et al., 1978; Tootell et al., 1981; Morrone et al., 1986; Zumbroich and Blakemore, 1987). Based on our metabolic studies, cells beyond 15 in areas 17 and 18 appear to respond to a stimulus with a spatial frequency of less than 0.38 cycles/deg. In contrast, cells beyond 50 in area PMLS do not appear to respond to a stimulus with a spatial frequency range between and 0.38 cycles/deg. Further studies are needed to determine the preferred spatial frequencies of the cells in the representation of the more peripheral portions of the visual field. The major stimulus for generating OKN is retinal-slip velocity. Neurons that encode retinal-slip velocities in the cat have been examined only in area 18 (Hoffman et al., 1984). In this area, cells are tuned to retinal-slip velocities ranging from 2 to 100 /sec. The average retinal-slip velocities generated during our experiment are within this range (29 /sec during slow-phase eye movements and 95 /sec during quick-phase eye movements). It is not known whether a regional distribution of preferred retinal-slip velocities exists in area 18, however, a regional distribution of preferred target velocities has been described in paralyzed cats in areas 17, 18, and PMLS. In areas 17 and PMLS, cells are best tuned to a stimulus velocity of less than or equal to 1 O /sec within the representation of the central portion of the visual field and to higher stimulus velocities in the peripheral portion of the visual field (Wilson and Sherman, 1976; Orban et al., 1985; Rauschecker et al., 1987). The distribution of preferred velocity tuning could explain the relative decrease in metabolic activity in areas 17 and PMLS near the area centralis
11 1 160 Herdman et al. * Cortical Metabolic Activity in Cat Figure 4. Continued. representation in our study. Cells throughout the entire representation of area 18 prefer higher stimulus velocities than cells in area 17 (Orban et al., 1985), and as we found, all of area 18 should be activated by the stimulus we used. Thus, the retinalslip velocity elicited by our stimulus could explain some of the regional distribution of metabolic activity in areas 17, 18, and PMLS in our cats if the regional distribution of retinal-slip velocities in awake, behaving cats is similar to the regional distribution of target velocity tuning in paralyzed cats. Further studies are needed to determine if cells in cat cerebral cortex other than area 18 encode retinal-slip velocity and whether preferred retinal-slip velocities vary with eccentricity. In summary, the regional distribution of metabolic activity we found in areas 17, 18, and PMLS may be due to the distribution of spatial frequency or possibly retinal-slip velocity or target velocity preferences in these areas. A lower rate of glucose utilization also occurs at the borders of area 21a and PMLS, and areas VLS and 21 b where the central portion of the visual field is represented. Although spatial frequency and retinal-slip velocity preferences have not been examined in areas 21 a, 21 b, and VLS using electrophysiological techniques, our study suggests that these parameters may be regionally distributed in these areas as well. Proprioceptive influences Another possible factor contributing to the metabolic activity of cat cortex is the influence of proprioceptive signals from extraocular muscles. It is known, for instance, that 25% of the cells in area 17 have a reproducible neuronal response to stretch of the extraocular muscles (Buisseret and Maffei, 1977). In our
12 The Journal of Neuroscience, April 1989, 9(4) 1161 study, the control cats made only 1/20th the number of quick phase eye movements compared with the experimental cats. This may have influenced the relative amount of proprioceptive information received in cortex by the 2 groups, contributing to the difference in metabolic activity. No regional distribution of the cortical cells responding to proprioceptive inputs has been described, however. Motor and eflerence copy It is unlikely that a regional distribution of metabolic activity is due to a regional distribution of cells that code a motor command or an efference copy signal during OKN. Of the 70% of the cells that can be driven during OKN in area 18 in awake, behaving cats, only l-2% of the cells respond clearly to eye movements generated in the dark (Hoffmann et al., 1984). Most of the cells in area 18 responding during OKN, therefore, do not appear to be coding a motor command or an efference copy signal. Furthermore, no regional distribution for these cells was described. Although neurophysiological recordings have not been done in other cortical areas during the generation of OKN, recordings have been made during vestibular stimulation. Vanni-Mercier and Magnin (1982) have shown that cells in areas 17 (27%), 18 (24%), PMLS (12%), 19 (2%), and 2 la (2%) discharge at the end of each quick-phase eye movement produced during vestibular stimulation in the dark. These cells are therefore thought to be coding efference copy of the quick-phase eye movements. No regional distribution has been described for these efference copy signals. In conclusion, we found that rates of glucose utilization are increased in areas 17, 18, 2 la, 2 1 b, PMLS, and VLS in cats generating OKN compared with cats viewing a stationary OKN drum. In order to determine whether these areas are critically involved in the generation of OKN, we studied the effect of unilateral lesions restricted to these areas. The results of the ablation study are reported in the following paper (Tusa et al., 1989). References Albus, K. (1979) * C-deoxyglucose mapping of orientation subunits in cats visual cortical areas. Exp. Brain Res. 37: Albus, K., and B. Sieber (1984) On the spatial arrangement of iso-orientation bands in the cat s visual cortical areas 17 and 18: A 14C-deoxyglucose study. Exp. Brain Res. 56: Berman, N. E. J., M. E. Wilkes, and B. R. Payne (1987) Organization of orientation and direction selectivity in areas 17 and 18 of cat cerebral cortex. J. Neuronhvsiol. 58: Berson, D. M., and A. M.-Graybiel (1980) Some cortical and subcortical fiber projections to the accessory optic nuclei in the cat. Neuroscience 5: Buisseret, P., and L. Maffei (1977) Extraocular proprioceptive projections to.visual cortex. Exp. Brain Res. 28: Camarda. R.. and G. Rizzolatti (1976) Visual retentive fields in the lateral supiasylvian area (ClarelBishop Area) of the cat. Brain Res. 101: Ferster, D., and S. LeVay (1978) The axonal arborizations of lateral geniculate neurons in the striate cortex of the cat. J. Comp. Neurol. 182: Flood, D. G., and P. D. Coleman (1979) Demonstration of orientation columns with [14C]2-deoxyglucose in a cat reared in a striped environment. Brain Res. 173: Goochee, C., W. Rasband, and L. Sokoloff (1980) Computerized densitometry and color coding of [14C]deoxyglucose autoradiographs. Ann. Neurol. 7: Hand, P. J. (1981) In Neurounatomical Tract-Tracing Methods, L. Heimer and M. J. Robards, eds., pp. 51 l-538, Plenum, New York. Herdman, S. J., and R. J. Tusa (1984) Local cerebral glucose utilization in cortex of awake, behaving cat in response to an optokinetic stimulus. Sot. Neurosci. Abstr. 10: 933. Herdman, S. J., and R. J. Tusa (1986) The role of striate cortex in the generation of optokinetic nystagmus. Physical Ther. 66: 742. Herdman, S. J., R. J. Tusa, and C. B. Smith (1987) Areas 17 and 18 contribute the major functional input to two suprasylvian cortical areas in the cat during generation of optokinetic nystagmus. Sot. Neurosci. Abstr. 13: Hoffman, K.-P. (1982) Cortical versus subcortical contributions to the optokinetic reflex in the cat. In Functional Basis of Ocular Motility Disorders, G. Lennerstrand, D. S. Zee, and E. L. Keller, eds., pp , Pergamon, Oxford, UK. Hoffman, K.-P., R. Bauer, H. P. Huber, and M. Mayr (1984) Single cell activity in area 18 of the cat s visual cortex during optokinetic nystagmus. Exp. Brain Res. 57: Hubel, D. H., and T. N. Wiesel (1959) Receptive fields of single neurons in cat s striate cortex. J. Physiol. (Lond.) 148: Hubel, D. H., and T. N. Wiesel (1962) Receptive fields, binocular interaction and functional architecture in cat s visual cortex. J. Physiol. (Lond.) 160: Humphrey, A. L., M. Sur, D. J. Uhlrich, and S. M. Sherman (1985a) Projection patterns of individual X- and Y-cell axons from the lateral geniculate nucleus to cortical area 17 in the cat. J. Comp. Neurol. 233: Humphrey, A. L., M. Sur, D. J. Uhlrich, and S. M. Sherman (1985b) Termination patterns of individual X- and Y-cell axons in the visual cortex of the cat: Projections to area 18, to the 17/18 border region, and to both areas 17 and 18. J. Comp. Neurol. 233: Kadekaro, M., A. Crane, and L. Sokoloff (1985) Differential effects of electrical stimulation of sciatic nerve on metabolic activity in spinal cord and dorsal root ganglion in the rat. Proc. Natl. Acad. Sci. USA 82: Kato, N., S. Kawaguchi, and H. Miyata (1986) Postnatal development of afferent projections to the lateral suprasylvian visual area in the cat: An HRP study. J. Comp. Neurol. 252: Kawamura, K., and J. Naito (1976) Corticocortical afferents to the cortex of the middle suprasylvian sulcus area in the cat. Exp. Brain Res. (Suppl.) 1: Lana. W.. and V. Henn (1980) Columnar aattem in the cat s visual c&tex after optokinetic stimulation. Brain-Res. 182: LeVay, S., and C. D. Gilbert (1976) Laminar patterns of geniculocortical projection in the cat. Brain Res. I1 3: l-l 9. Lowel, S., B. Freeman, and W. Singer (1987) Topographic organization of the orientation column system in large flat-mounts of the cat visual cortex: A 2-deoxyglucose study. J. Comp. Neurol. 255: Marcotte, R. R., and B. V. Updyke (1982) Cortical visual areas of the cat project differentially onto the nuclei of the accessory optic system. Brain Res. 242: Miller, R. G. (1966) Simultaneous Statistical Inference, pp , McGraw-Hill, New York. Montarolo, P. G., W. Precht, and P. Strata (198 1) Functional organization of the mechanisms subserving the optokinetic nystagmus in the cat. Neuroscience 6: Morrone, M. C., M. Di Stefano, and D. C. Burr (1986) Spatial and temporal properties of neurons of the lateral suprasylvian cortex of the cat. J. Neurophysiol. 56: Movshon, J. A., I. D. Thompson, and D. J. Tolhurst (1978) Spatial and temporal contrast sensitivity in areas 17 and 18 of the cat visual cortex. J. Physiol. (Lond.) 283: Orban, G. A., K.-P. Hoffmann, and J. Duysens (1985) Velocity selectivity in the cat visual system. I. Responses of LGN cells to moving bar stimuli: A comparison with cortical areas 17 and 18. J. Neurophysiol. 54: Otsuka. R.. and R. Hassler (1962) Uber autbau und aliederuna der corticalen sehsphare bei de; katze. Archiv. Psychol.?eitschr. i03: Palmer, L. A., A. C. Rosenquist, and R. J. Tusa (1978) The retinotopic organization of the lateral suprasylvian areas in the cat. J. Comp. Neurol. 177: Rauschecker, J. P., M. W. von Grunau, and C. Poulin (1987) Centrifugal organization of direction preference in the cat s lateral suprasylvian visual cortex and its relation to flow field processing. J. Neurosci. 7: Reale, R. A., and T. J. Imig (1980) Tonotopic organization in auditory cortex of the cat. J. Comp. Neurol. 192:
The contralateral impairment of the orienting ocular-following reflex after lesions of the lateral suprasylvian cortex in cats
 The contralateral impairment of the orienting ocular-following reflex after lesions of the lateral suprasylvian cortex in cats Boguslaw ~ernicki and Maciej Stasiak Department of Neurophysiology, Nencki
THE JOURNAL OF COMPARATIVE NEUROLOGY 233: (1985)
") THE JOURNAL OF COMPARATIVE NEUROLOGY 233:190-212 (1985) Termination Patterns of Individual XI and Y-Cell Axons in the Visual Cortex of the Cat: Projections to Area 18, to the 17/18 Border Region, and to
THE JOURNAL OF COMPARATIVE NEUROLOGY 233:190-212 (1985) Termination Patterns of Individual XI and Y-Cell Axons in the Visual Cortex of the Cat: Projections to Area 18, to the 17/18 Border Region, and to
A SINGLE VIBRISSAL COLUMN IN THE FIRST SOMATOSENSORY CORTEX OF THE MOUSE DEMONSTRATED WITH 2-DEOXYGLUCOSE
 ACTA NEUROBIOL. EXP. 1984, 44: 83-88 Short communication A SINGLE VIBRISSAL COLUMN IN THE FIRST SOMATOSENSORY CORTEX OF THE MOUSE DEMONSTRATED WITH 2-DEOXYGLUCOSE J. CHMIELOWSKA and M. KOSSUT Department
CLARSBISHOP AREA IN THE CAT: LOCATION AIVD RETINOTOPICAL PROJECTION
 ACTA NEUROBIOL. EXP. 1975, 35: 179488 CLARSBISHOP AREA IN THE CAT: LOCATION AIVD RETINOTOPICAL PROJECTION Krzysztof TURLEJSKI and Andrzej MICHALSKI Department of Neurophysiology, Nencki Institute of Experimental
THE PRETRIGEMINAL CAT AS AN INSTRUMENT FOR INVESTIGATION OF THE OCULAR FIXATION REFLEX
 ACTA NEUROBIOL. EXP. 1980, 40: 381-385 Lecture delivered at the Warsaw Colloquium on Instrumental Conditioning and Brain Research May 1979 THE PRETRIGEMINAL CAT AS AN INSTRUMENT FOR INVESTIGATION OF THE
M. uch interest has recently been focused. Visual development in cats. 394 Pettigrew Investigative Ophthalmology. S.
 394 Pettigrew Investigative Ophthalmology May 1972 The one third of recordable cells in three-monthold binocularly sutured animals which you describe as "normal" could only be so called if one used the
The Laminar and Size Distribution of Commissural Efferent Neurons in the Cat Visual Cortex*
 Arch. histol. jap., Vol. 42, No. 2 (1979) p. 119-128 The Laminar and Size Distribution of Commissural Efferent Neurons in the Cat Visual Cortex* Kazuhiko SHOUMURA Department of Anatomy (Prof. S. DEURA),
Pre-natal construction of neural circuits (the highways are genetically specified):
:") Modification of Brain Circuits as a Result of Experience Chapter 24, Purves et al. 4 th Ed. Pre-natal construction of neural circuits (the highways are genetically specified): (1/6/2010) Mona Buhusi Postnatal
Modification of Brain Circuits as a Result of Experience Chapter 24, Purves et al. 4 th Ed. Pre-natal construction of neural circuits (the highways are genetically specified): (1/6/2010) Mona Buhusi Postnatal
abnormal lateral geniculate body. His anatomical study suggested that chiasm instead of remaining uncrossed. They thus reach the wrong hemispheres,
 J. Physiol. (1971), 218, pp. 33-62 33 With 1 plate and 9 text-figures Printed in Great Britain ABERRANT VISUAL PROJECTIONS IN THE SIAMESE CAT BY D. H. HUBEL AND T. N. WIESEL From the Department of Neurobiology,
Do blue-eyed white cats have normal or abnormal retinofugal pathways? R. W. Guillery, T. L. Hickey, and P. D. Spear
 Do blue-eyed white cats have normal or abnormal retinofugal pathways? R. W. Guillery, T. L. Hickey, and P. D. Spear Three white cats that had blue eyes and no tapetum were studied by behavioral, electrophysiological,
preferring rightward movement. A changeover later than 5 weeks of age peak of the critical period for directional deprivation may occur earlier
 J. Physiol. (1976), 257, pp. 155-170 155 With 5 text-figures Printed in Great Britain KITTENS REARED IN A UNIDIRECTIONAL ENVIRONMENT: EVIDENCE FOR A CRITICAL PERIOD BY N. W. DAW AND H. J. WYATT* From the
Active sensing. Ehud Ahissar
 Active sensing Ehud Ahissar 1 Active sensing Passive vs active sensing (touch) Comparison across senses Basic coding principles -------- Perceptual loops Sensation-targeted motor control Proprioception
Area Centralis Position Relative to the Optic Disc Projection in Kittens as o Function of Age
 Investigative Ophthalmology & Visual Science, Vol. 29, No. 8, August 1988 Copyright Association.for Research in Vision and Ophthalmology Area Centralis Position Relative to the Optic Disc Projection in
Differential Effects of Early Monocular Deprivation on Binocular and Monocular Segments of Cat Striate Cortex
 J~uRNALOFNEUROPH YSIOLOGY Vol. 40, No. 4, July 1977. Printed in U.S.A. Differential Effects of Early Monocular Deprivation on Binocular and Monocular Segments of Cat Striate Cortex J. R. WILSON AND S,
injected eve. (Received 1 November 1977) with electrolytic lesions. A good correspondence was found between the location of
 with electrolytic lesions. A good correspondence was found between the location of") J. Physiol. (1978), 281, pp. 267-283 267 With 6 plates and 3 text-figures Printed in Great Britain OCULAR DOMINANCE IN LAYER IV OF THE CAT'S VISUAL CORTEX AND THE EFFECTS OF MONOCULAR DEPRIVATION By CARLA
J. Physiol. (1978), 281, pp. 267-283 267 With 6 plates and 3 text-figures Printed in Great Britain OCULAR DOMINANCE IN LAYER IV OF THE CAT'S VISUAL CORTEX AND THE EFFECTS OF MONOCULAR DEPRIVATION By CARLA
Effects of Early Monocular Lid Suture on Spatial and Temporal Sensitivity of Neurons in Dorsal Lateral Geniculate Nucleus of the Cat
 JOURNALOF NEUROPHYSIOLOGY Vol. 43, No. 2, February 1980. Printed in U.S.A. Effects of Early Monocular Lid Suture on Spatial and Temporal Sensitivity of Neurons in Dorsal Lateral Geniculate Nucleus of the
A Comparison of Visual Pathways in Boston and Midwestern Siamese Cats
 A Comparison of Visual Pathways in Boston and Midwestern Siamese Cats CARLA SHA'TZ2 Department of Neurobiology, Harvard Medical School, 25 Shattuck Street, Boston, Massachusetts 021 15 ABSTRACT A genetic
THE POSTNATAL DEVELOPMENT OF THE VISUAL CORTEX AND THE INFLUENCE OF ENVIRONMENT
 THE POSTNATAL DEVELOPMENT OF THE VISUAL CORTEX AND THE INFLUENCE OF ENVIRONMENT Nobel lecture, 8 December 1981 by TORSTEN N. WIESEL Harvard Medical School, Department of Neurobiology, Boston, Massachusetts,
Horizontal Interactions in Cat Striate Cortex: 111. Receptive Fields and Transient Exuberance of Tangential Interactions
 European Journal of Neuroscience, Vol. 2, pp. 369-3 @ European Neuroscience Association 093-81 W90 $3.00 Horizontal Interactions in Cat Striate Cortex: 111. Receptive Fields and Transient Exuberance of
Regional Variation in the Representation of the Visual Field in the Visual Cortex of the Siamese Cat
 THE JOURNAL OF COMPARATIVE NEUROLOGY 193:237-253 (1980) Regional Variation in the Representation of the Visual Field in the Visual Cortex of the Siamese Cat MICHAEL LEE COOPER AND GARY G. BLASDEL Division
Cortical Cell Orientation Selectivity Fails to Develop in the Absence of ON-Center Retinal Ganglion Cell Activity
 The Journal of Neuroscience, March 1, 2000, 20(5):1922 1930 Cortical Cell Orientation Selectivity Fails to Develop in the Absence of ON-Center Retinal Ganglion Cell Activity Barbara Chapman and Imke Gödecke
Effects of Feedback Projections From Area 18 Layers 2/3 to Area 17 Layers 2/3 in the Cat Visual Cortex
 Effects of Feedback Projections From Area 18 Layers 2/3 to Area 17 Layers 2/3 in the Cat Visual Cortex SUSANA MARTINEZ-CONDE, 1 JAVIER CUDEIRO, 1,2 KENNETH L. GRIEVE, 3 ROSA RODRIGUEZ, 1 CASTO RIVADULLA,
Spatial Analysis of Ocular Dominance Patterns in Monocularly Deprived Cats
 Spatial Analysis of Ocular Dominance Patterns in Monocularly Deprived Cats Kerstin E. Schmidt, Michael Stephan, Wolf Singer and Siegrid Löwel 1 Max-Planck-Institut für Hirnforschung, Neurophysiologische
1Ila and V. Canberra, A.C.T. 2601, Australia (Received 21 March 1979)
") J. Physiol. (1980), 302, pp. 483-505 483 With 2 plate and 9 text-ftigurew Printed in Great Britain THE AFFERENT CONNEXIONS AND LAMINAR DISTRIBUTION OF CELLS IN AREA 18 OF THE CAT BY A. R. HARVEY* From
J. Physiol. (1980), 302, pp. 483-505 483 With 2 plate and 9 text-ftigurew Printed in Great Britain THE AFFERENT CONNEXIONS AND LAMINAR DISTRIBUTION OF CELLS IN AREA 18 OF THE CAT BY A. R. HARVEY* From
Binocular Impulse Blockade Prevents the Formation of Ocular Dominance Columns in Cat Visual Cortex
 The Journal of Neuroscience August 1986, f?(8): 2117-2133 Binocular Impulse Blockade Prevents the Formation of Ocular Dominance Columns in Cat Visual Cortex Michael P. Stryker and William A. Harris Department
Columnar Specificity of Intrinsic Horizontal and Corticocortical Connections in Cat Visual Cortex
 The Journal of Neuroscience, July 1989, g(7): 2432-2442 Columnar Specificity of Intrinsic Horizontal and Corticocortical Connections in Cat Visual Cortex Charles D. Gilbert and Torsten N. Wiesel The Rockefeller
Emergence of Ocular Dominance Columns in Cat Visual Cortex by 2 Weeks of Age
 THE JOURNAL OF COMPARATIVE NEUROLOGY 430:235 249 (2001) Emergence of Ocular Dominance Columns in Cat Visual Cortex by 2 Weeks of Age MICHAEL C. CRAIR, 1,2 JONATHAN C. HORTON, 3 ANTONELLA ANTONINI, 1 AND
Expression of a Surface-Associated Antigen on Y-Cells in the Cat Lateral Geniculate Nucleus Is Regulated by Visual Experience
 The Journal of Neuroscience, March 1988, 8(3): 874-882 Expression of a Surface-Associated Antigen on Y-Cells in the Cat Lateral Geniculate Nucleus Is Regulated by Visual Experience Mriganka Sur, Douglas
Effects of Convergent Strabismus on the Development of Physiologically Identified Retinogeniculate Axons ih Cats
 THE JOURNAL OF COMPARATIVE NEUROLOGY 28922-212 (1989) Effects of Convergent Strabismus on the Development of Physiologically Identified Retinogeniculate Axons ih Cats P.E. GARRAGHTY, A.W. ROE, Y.M. CHINO,
Ascending Projections of Simple and Complex Cells in Layer 6 of the Cat Striate Cortex
 The Journal of Neuroscience, October 1, 1998, 18(19):8086 8094 Ascending Projections of Simple and Complex Cells in Layer 6 of the Cat Striate Cortex Judith A. Hirsch, Christine A. Gallagher, José-Manuel
Overlap of sensory representations in rat barrel cortex after neonatal vibrissectomy
 Overlap of sensory representations in rat barrel cortex after neonatal vibrissectomy Malgorzata Kossut and Ewa Siucinska Department of Neurophysiology, Nencki Institute of Experimental Biology, 3 Pasteur
The Critical Period for Ocular Dominance Plasticity in the Ferret s Visual Cortex
 The Journal of Neuroscience, August 15, 1999, 19(16):6965 6978 The Critical Period for Ocular Dominance Plasticity in the Ferret s Visual Cortex Naoum P. Issa, Joshua T. Trachtenberg, Barbara Chapman,
spider monkeys by recording extracellularly from single units and stimulating
 J. Physiol. (1968), 195, pp. 215-243 215 With 3 plates and 14 text-figures Printed in Great Britain RECEPTIVE FIELDS AND FUNCTIONAL ARCHITECTURE OF MONKEY STRIATE CORTEX By D. H. HUBEL AND T. N. WIESEL
PATTERN EVOKED RESPONSE DEFICIENCY IN PATTERN DEPRIVED CATS 1
 Electroencephalography and Clinical Neurophysiology, 1973, 35: 569-573 Elsevier Scientific Publishing Company, Amsterdam - Printed in The Netherlands 569 PATTERN EVOKED RESPONSE DEFICIENCY IN PATTERN DEPRIVED
Neuroscience Letters
 Neuroscience Letters 437 (2008) 65 70 Contents lists available at ScienceDirect Neuroscience Letters journal homepage: www.elsevier.com/locate/neulet Weakened feedback abolishes neural oblique effect evoked
Spatial and Temporal Sensitivity of Normal and Amblyopic Cats
 JOURNALOF NEUROPHYSIOLOGY Vol. 48, No. 2, August 1982. Printed in U.S.A. Spatial and Temporal Sensitivity of Normal and Amblyopic Cats STEPHEN LEHMKUHLE, KENNETH E. KRATZ, AND S. MURRAY SHERMAN Department
UTILITY OF THE NEUROLOGICAL EXAMINATION IN RATS
 ACTA NEUROBIOL. ELW. 1980, 40 : 999-3 Short communication UTILITY OF THE NEUROLOGICAL EXAMINATION IN RATS David E. TUPPER and Robert B. WALLACE Laboratory of Developmental Psychobiology, University of
[Frontiers in Bioscience 13, , May 1, 2008] Binocular phasic coactivation does not prevent ocular dominance segregation
![[Frontiers in Bioscience 13, , May 1, 2008] Binocular phasic coactivation does not prevent ocular dominance segregation](/thumbs/89/100953013.jpg "[Frontiers in Bioscience 13, , May 1, 2008] Binocular phasic coactivation does not prevent ocular dominance segregation") [Frontiers in Bioscience 13, 3381-3390, May 1, 2008] Binocular phasic coactivation does not prevent ocular dominance segregation Kerstin E. Schmidt 1, Wolf Singer 2, Siegrid Lowel 3 1 Laboratory of Cortical
[Frontiers in Bioscience 13, 3381-3390, May 1, 2008] Binocular phasic coactivation does not prevent ocular dominance segregation Kerstin E. Schmidt 1, Wolf Singer 2, Siegrid Lowel 3 1 Laboratory of Cortical
Binocular Interactions in Striate Cortical Neurons of Cats Reared with Discordant Visual Inputs
 The Journal of Neuroscience, August 1994, 14(8): 55-567 Binocular Interactions in Striate Cortical Neurons of Cats Reared with Discordant Visual Inputs Yuzo M. Chino, Earl L. Smith III, Kazuyuki Yoshida,
Serendipity and the Siamese Cat: The Discovery That Genes for Coat and Eye Pigment Affect the Brain. Jon H. Kaas
 Serendipity and the Siamese Cat: The Discovery That Genes for Coat and Eye Pigment Affect the Brain Jon H. Kaas Abstract One day in the late 1960s, Ray Guillery was examining brain sections through the
Consequences of alternating monocular deprivation on eye alignment and convergence in cats. Randolph Blake, M. L. ]. Crawford, and Helmut V. B.
![Consequences of alternating monocular deprivation on eye alignment and convergence in cats. Randolph Blake, M. L. ]. Crawford, and Helmut V. B.](/thumbs/94/120773134.jpg "Consequences of alternating monocular deprivation on eye alignment and convergence in cats. Randolph Blake, M. L. ]. Crawford, and Helmut V. B.") Consequences of alternating monocular deprivation on eye alignment and convergence in cats Randolph Blake, M. L. ]. Crawford, and Helmut V. B. Hirsch Four kittens were raised with an opaque contact lens
Consequences of alternating monocular deprivation on eye alignment and convergence in cats Randolph Blake, M. L. ]. Crawford, and Helmut V. B. Hirsch Four kittens were raised with an opaque contact lens
Rules of Connectivity between Geniculate Cells and Simple Cells in Cat Primary Visual Cortex
 The Journal of Neuroscience, June 1, 2001, 21(11):4002 4015 Rules of Connectivity between Geniculate Cells and Simple Cells in Cat Primary Visual Cortex Jose-Manuel Alonso, 1,2 W. Martin Usrey, 1,3 and
(Received 22 November 1984) studies were made on twenty such pairs; eight X on-centre, seven Y on-centre, two
 studies were made on twenty such pairs; eight X on-centre, seven Y on-centre, two") J. Physiol. (1985), 369, pp. 249-268 249 With 12 text-ftgures Printed in Great Britain A COMPARISON OF VISUAL RESPONSES OF CAT LATERAL GENICULATE NUCLEUS NEURONES WITH THOSE OF GANGLION CELLS AFFERENT
J. Physiol. (1985), 369, pp. 249-268 249 With 12 text-ftgures Printed in Great Britain A COMPARISON OF VISUAL RESPONSES OF CAT LATERAL GENICULATE NUCLEUS NEURONES WITH THOSE OF GANGLION CELLS AFFERENT
Key words: Mouse motor cortex, intracortical microstimulation, motor representation,.corticomotor asymmetry.
 Neuroscience and Behavioral Physiology, Vol. 28, No. 1, 1998 FUNCTIONAL MAPPING OF THE MOTOR CORTEX OF THE WHITE MOUSE BY A MICROSTIMULATION METHOD I. V. Pronichev and D. N. Lenkov Studies on 33 anesthetized
F.L. Andr6s. Rua Tristao Vaz No Esq., 1400 Lisboa, Portugal
 Supranumerary Barrels Develop in the Somatosensory Cortex of Mice, After the Implantation of the Vibrissal Follicle Parts Containing Large Numbers of Receptors F.L. Andr6s Rua Tristao Vaz No. 37 1 Esq.,
Experimental analysis of amblyopia
 Brit. J. Ophthal. (I974) 58, I76 Experimental analysis of amblyopia and strabismus COLIN BLAKEMORE AND RICHARD C. VAN SLUYTERS The Physiological Laboratory, Cambridge In the past few years physiological
David H. Hubel. A Biographical Memoir by Robert H. Wurtz
 David H. Hubel 1926 2013 A Biographical Memoir by Robert H. Wurtz 2014 National Academy of Sciences. Any opinions expressed in this memoir are those of the author and do not necessarily reflect the views
Projection Patterns of Individual X- and Y- Cell Axons From the Lateral Geniculate Nucleus to Cortical Area 17 in the Cat
 THE JOURNAL OF COMPARATIVE NEUROLOGY 233~159-189 (1985) Projection Patterns of Individual X- and Y- Cell Axons From the Lateral Geniculate Nucleus to Cortical Area 17 in the Cat A.L. HUMPHREY, M. SUR,
texp. Biol. (196a), 39,
, 39,") texp. Biol. (196a), 39, 239-242 ith 1 plate Printed in Great Britain INNERVATION OF LOCOMOTOR MOVEMENTS BY THE LUMBOSACRAL CORD IN BIRDS AND MAMMALS BY J. TEN CATE Physiological Laboratory, University
texp. Biol. (196a), 39, 239-242 ith 1 plate Printed in Great Britain INNERVATION OF LOCOMOTOR MOVEMENTS BY THE LUMBOSACRAL CORD IN BIRDS AND MAMMALS BY J. TEN CATE Physiological Laboratory, University
344 References Andrews BW, Pollen DA (1979) Relationship between spatial frequency selectivity and receptive field profile of simple cells. 1 Physiol
 Relationship between spatial frequency selectivity and receptive field profile of simple cells. 1 Physiol") References Albrecht DG, De Valois RL (1981) Striate cortex responses to periodic patterns with and without the fundamental harmonics. J Physiol (Lond) 319:497-514 Albrecht DG, De Valois RL, Thorell LG
References Albrecht DG, De Valois RL (1981) Striate cortex responses to periodic patterns with and without the fundamental harmonics. J Physiol (Lond) 319:497-514 Albrecht DG, De Valois RL, Thorell LG
Morphology of Retinogeniculate X and Y Axon Arbors in Cats Raised With Binocular Lid Suture
 JOURNALOFNEUROPHYSIOLOGY Vol. 60, No. 6, December 1988. Printed Morphology of Retinogeniculate X and Y Axon Arbors in Cats Raised With Binocular Lid Suture DENIS RACZKOWSKI, DANIEL J. UHLRICH, AND S. MURRAY
My recollections of Hubel and Wiesel and a brief review of functional circuitry in the visual pathway
 J Physiol 587.12 (2009) pp 2783 2790 2783 TOPICAL REVIEW My recollections of Hubel and Wiesel and a brief review of functional circuitry in the visual pathway Jose-Manuel Alonso Department of Biological
Development of Neuronal Response Properties in the Cat Dorsal Lateral Geniculate Nucleus During Monocular
 JOURNALOF NEUROPHYSIOLOGY Vol. 5, No. 1, July 1983. Printed in U.S.A. Development of Neuronal Response Properties in the Cat Dorsal Lateral Geniculate Nucleus During Monocular Deprivation STUART C. MANGEL,
Parallel Processing in the Visual System THE CLASSIFICATION OF RETINAL GANGLION CELLS AND ITS IMPACT ON THE NEUROBIOLOGY OF VISION
 Parallel Processing in the Visual System THE CLASSIFICATION OF RETINAL GANGLION CELLS AND ITS IMPACT ON THE NEUROBIOLOGY OF VISION PERSPECTIVES IN VISION RESEARCH Series Editor: Colin Blakemore University
Morphology and Axonal Projection Patterns of Individual Neurons in the Cat Perigeniculate Nucleus
 JOURNALOF NEUROPHYSIOLOGY Vol. 65, No. 6, June 1991. Printed in U.S.A. Morphology and Axonal Projection Patterns of Individual Neurons in the Cat Perigeniculate Nucleus DANIEL J. UHLRICH, JOSEPHINE B.
Differences in Projection Patterns between Large and Small Corticothalamic Terminals
 THE JOURNAL OF COMPARATIVE NEUROLOGY 475:406 415 (2004) Differences in Projection Patterns between Large and Small Corticothalamic Terminals SUSAN C. VAN HORN AND S. MURRAY SHERMAN* Department of Neurobiology,
Binocular Exposure causes Suppression of the Less Experienced Eye in Cats Previously Reared with Unequal Alternating Monocular Exposure
 Binocular Exposure causes Suppression of the Less Experienced Eye in Cats Previously Reared with Unequal Alternating Monocular Exposure Nino Tumosa,* Stacy Nunberg, Helmut V. B. Hirsch, and Suzannah Bliss
Rapid Anatomical Plasticity of Horizontal Connections in the Developing Visual Cortex
 The Journal of Neuroscience, May 15, 2001, 21(10):3476 3482 Rapid Anatomical Plasticity of Horizontal Connections in the Developing Visual Cortex Joshua T. Trachtenberg and Michael P. Stryker Department
STANDARD OPERATING PROCEDURE #111 RAT ANESTHESIA
 STANDARD OPERATING PROCEDURE #111 RAT ANESTHESIA 1. PURPOSE This Standard Operating Procedure (SOP) describes methods for anesthetizing rats. 2. RESPONSIBILITY Principal Investigators (PIs) and their research
Regional and Local Anesthesia of the Wrist and Hand Aided by a Forearm Sterile Elastic Exsanguination Tourniquet - A Review
 H E M A C L E A R P R E S S A u g u s t 2 0 1 2 P a g e 1 Regional and Local Anesthesia of the Wrist and Hand Aided by a Forearm Sterile Elastic Exsanguination Tourniquet - A Review Noam Gavriely, MD,
geniculate nucleus of kittens raised with convergent squint in one eye,
 J. Phyaiol. (1977), 270, pp. 345-366 345 With 1 plate and 9 text-ftgure8 Printed in Great Britain NASAL FIELD LOSS IN KITTENS REARED WITH CONVERGENT SQUINT: NEUROPHYSIOLOGICAL AND MORPHOLOGICAL STUDIES
Laminar and Columnar Distribution of Geniculo-cortical Fibers in the Macaque Monkey
 Laminar and Columnar Distribution of Geniculo-cortical Fibers in the Macaque Monkey DAVID H. HUBEL AND TORSTEN N. WIESEL Department of Neurobiology, Harvurd Medical School, 25 Shattuck Street, Boston,
The receptive fields of cat retinal ganglion cells in physiological and pathological states: where we are after half a century of research
 Progress in Retinal and Eye Research 21 (2002) 263 302 The receptive fields of cat retinal ganglion cells in physiological and pathological states: where we are after half a century of research J.B. Troy
NUMBER: R&C-ARF-10.0
 1. PURPOSE PAGE 1 OF 6 This policy describes the procedures for keeping and maintaining animal medical records. This procedure is approved by the Creighton University Institutional Animal Care and Use
Alternatives in Veterinary Anatomy Training
 Training Computer Software The items in this category are numerous. The following are some good examples. Comparative Anatomy: Mammals, Birds and Fish This computer software covers an introduction to:
WHY DO ALBINOS AND OTHER HYPOPIGMENTED MUTANTS LACK NORMAL BINOCULAR VISION, AND WHAT ELSE IS ABNORMAL IN THEIR CENTRAL VISUAL PATHWAYS?
 WHY DO ALBINOS AND OTHER HYPOPIGMENTED MUTANTS LACK NORMAL BINOCULAR VISION, AND WHAT ELSE IS ABNORMAL IN THEIR CENTRAL VISUAL PATHWAYS? Oxford EARLY OBSERVATIONS OF THE PATHWAY ABNORMALITY It is now 30
Formoguanamine-induced blindness and photoperiodic responses in the Japanese quail, Coturnix coturnix japonica
 J. Biosci., Vol. 19, Number 4, October 1994, pp 479-484. Printed in India. Formoguanamine-induced blindness and photoperiodic responses in the Japanese quail, Coturnix coturnix japonica 1. Introduction
Feature detection of visual neurons in the nucleus of the basal optic root in pigeons
 Brain Research Bulletin, Vol. 51, No. 2, pp. 165 169, 2000 Copyright 2000 Elsevier Science Inc. Printed in the USA. All rights reserved 0361-9230/00/$ see front matter PII S0361-9230(99)00220-8 Feature
NUMBER: /2005
 Purpose PAGE 1 OF 7 The purpose of this policy is to describe the procedures for keeping and maintaining animal medical records. This procedure is approved by the Creighton University Institutional Animal
E erimental Brain Research 9 Springer-Verlag 1986
 Exp Brain Res (1986) 64:11%126 E erimental Brain Research 9 Springer-Verlag 1986 Effects of monocular deprivation in the nucleus rotundus of zebra finches: a Nissl and deoxyglucose study K. Herrmann and
Discovery. DIFFERENTIAL DIAGNOSES Septic joint or tendon sheath Abscess Vascular damage Fracture Tendon or ligament damage
 Discovery Applied Research for Today s Equine Athlete March 2012 Volume 3 Case File: Contrast-Enhanced Computed Tomography (CT) SIGNALMENT AND HISTORY 1-year-old Morgan colt January 1, 2011, Trooper was
(Received 29 June 1972)
") J. Physiol. (1973), 228, pp. 115-137 115 With 9 text-figures Printed in Great Britain CONTRASTS IN SPATIAL ORGANIZATION OF RECEPTIVE FIELDS AT GENICULATE AND RETINAL LEVELS: CENTRE, SURROUND AND OUTER
J. Physiol. (1973), 228, pp. 115-137 115 With 9 text-figures Printed in Great Britain CONTRASTS IN SPATIAL ORGANIZATION OF RECEPTIVE FIELDS AT GENICULATE AND RETINAL LEVELS: CENTRE, SURROUND AND OUTER
examination, the slight resistance encountered being sufficient By J. HERBERT PARSONS.
 PROCEEDI NGS OF THE PHYSIOLOGICAL May 10, 1902. SOCIETY, A method of measuring a visual illusion. By HORACE DARWIN and W. H. R. RIVERS. The instrument we show is designed for the quantitative study of
STANDARD OPERATING PROCEDURE #110 MOUSE ANESTHESIA
 STANDARD OPERATING PROCEDURE #110 MOUSE ANESTHESIA 1. PURPOSE This Standard Operating Procedure (SOP) describes methods for anesthetizing mice. 2. RESPONSIBILITY Principal Investigators (PIs) and their
Reductions in Taurine Secondary to Photoreceptor Loss in Irish Setters with Rod-Cone Dysplasia
 Reductions in Taurine Secondary to Photoreceptor Loss in Irish Setters with Rod-Cone Dysplasia S. Y. Schmidr*t and G. D. Aguirre$ These studies show that onset of photoreceptor cell degeneration preceded
Vertebrates. Vertebrate Characteristics. 444 Chapter 14
 4 Vertebrates Key Concept All vertebrates have a backbone, which supports other specialized body structures and functions. What You Will Learn Vertebrates have an endoskeleton that provides support and
On and off domains of geniculate afferents in cat primary visual cortex
 28 Nature Publishing Group http://www.nature.com/natureneuroscience On and off domains of geniculate afferents in cat primary visual cortex Jianzhong Z Jin 1, Chong Weng 1, Chun-I Yeh 1,2, Joshua A Gordon
SOP #: Page: 1 of 6 Rodent Analgesia
 Comparative Medicine Page: 1 of 6 Rodent Analgesia The intent of this Standard Operating Procedure (SOP) is to describe commonly used analgesics provided to rodents housed at Comparative Medicine (CM).
log no. VNS23011 Ocular dominance columns in strabismus VNS23~6! :31 pm
 VNS23~6! 23011 1011 07007006 2:31 pm log no. VNS23011 Visual Neuroscience ~2006!, 23, 1 11. Printed in the USA. Copyright 2006 Cambridge University Press 0952-5238006 $16.00 DOI: 10.10170S0952523806230116
deprived eye (reverse occlusion). beyond 1 year of age; only two of six animals recovered sufficient vision to enable
. beyond 1 year of age; only two of six animals recovered sufficient vision to enable") Journal of Physiology (1988), 395, pp. 639-66 639 With 8 text-figures Printed in Great Britain THE EXTENT OF VISUAL RECOVERY FROM EARLY MONOCULAR OR BINOCULAR VISUAL DEPRIVATION IN KITTENS BY DONALD E.
Journal of Physiology (1988), 395, pp. 639-66 639 With 8 text-figures Printed in Great Britain THE EXTENT OF VISUAL RECOVERY FROM EARLY MONOCULAR OR BINOCULAR VISUAL DEPRIVATION IN KITTENS BY DONALD E.
STANDARD OPERATING PROCEDURE
 Page 1 of 5 Version 4.0 STANDARD OPERATING PROCEDURE TITLE: 28-point Neuroscore Test CATEGORY: Behavioral Assay Introduction Goal: This document aims to provide the reader information on how to conduct
THE VISUAL MECHANISMS OF TENEBRIO MOLITOR: VARIATIONS TAKING PLACE IN THE ERG OF PUPA AND ADULT DURING DEVELOPMENT
 J. Exp. Biol. (1969), 51. 635-641 635 With 5 text-figures Printed in Great Britain THE VISUAL MECHANISMS OF TENEBRIO MOLITOR: VARIATIONS TAKING PLACE IN THE ERG OF PUPA AND ADULT DURING DEVELOPMENT BY
Supplementary Material
 10.1071/HR17008_AC CSIRO 2018 Supplementary Material: Historical Records of Australian Science, 2018, 29(2), 162 171. Supplementary Material Peter Orlebar Bishop 1917 2012 Jack D. Pettigrew A and Bogdan
Human-Animal Interactions in the Turkey Industry
 Human-Animal Interactions in the Turkey Industry Dr. Naomi A. Botheras 1, Ms. Jessica A. Pempek 2, Mr. Drew K. Enigk 2 1 PI, 222E Animal Sciences Building, 2029 Fyffe Court, Columbus, OH 43210 (614) 292-3776;
Horizontal Interactions in Cat Striate Cortex:
 European Journal of Neuroscience, Vol. 2, pp. 358368 @ European Neuroscience Association 095381 W90 $3.00 Horizontal Interactions in Cat Striate Cortex: II. A Current SourceDensity Analysis H. J. Luhmann,
Ocular Dominance Columns and Their Development in Layer IV of the Cat's Visual Cortex: A Quantitative Study
 Reprinted from THE JOURNAL OF COMPARATIVE NEUROLOGY Vol. 179, No.1, May 1, 1978 The Wi. tar Institute Press 1978 Ocular Dominance Columns and Their Development in Layer IV of the Cat's Visual Cortex: A
Properties of the flash visual evoked potential recorded in the cat primary visual cortex
 Vision Research 39 (1999) 2833 2840 Properties of the flash visual evoked potential recorded in the cat primary visual cortex Lissa B. Padnick a, Robert A. Linsenmeier a,b,c, * a Department of Biomedical
Animal, Plant & Soil Science
 Animal, Plant & Soil Science Lesson C5-9 Veterinary Terminology Interest Approach Gather some common veterinary tools (e.g., scissors, forceps, and scalpels). Ask the students what each item is and for
Research Article Electrodiagnostic Examination of the Tibial Nerve in Clinically Normal Ferrets
 SAGE-Hindawi Access to Research Veterinary Medicine International Volume 2010, Article ID 756321, 5 pages doi:10.4061/2010/756321 Research Article Electrodiagnostic Examination of the Tibial Nerve in Clinically
striking it with unsheathed claws, was accompanied
 JOURNAL OF THE EXPERIMENTAL ANALYSIS OF BEHAVIOR TRANSFER OF AN ESCAPE RESPONSE FROM TAIL SHOCK TO BRAIN- STIMULA TED ATTACK BEHAVIOR' DAVID ADAMS AND JOHN P. FLYNN YALE UNIVERSITY SCHOOL OF MEDICINE VOLUME
Name Class Date. After you read this section, you should be able to answer these questions:
 CHAPTER 14 4 Vertebrates SECTION Introduction to Animals BEFORE YOU READ After you read this section, you should be able to answer these questions: How are vertebrates different from invertebrates? How
UNIVERSITY OF PITTSBURGH Institutional Animal Care and Use Committee
 UNIVERSITY OF PITTSBURGH Institutional Animal Care and Use Committee Policy: Surgical Guidelines EFFECTIVE ISSUE DATE: 2/21/2005 REVISION DATE(s): 2/14/15; 3/19/2018 SCOPE To describe guidelines and considerations
Electromechanical Whole-Body Rotator for Cats
 Electromechanical Whole-Body Rotator for Cats University of Wisconsin Madison College of Engineering Biomedical Engineering BME 301 March 3, 2006 Team Members: Leah Brandon President Adam Budde Communicator
specific innervation of the muscle, so that when the nerves of a fast and of a
 Quart. J. exp. Phy8iol. (1967) 52, 293-304 THE DIFFERENTIATION OF CONDUCTION VELOCITIES OF SLOW TWITCH AND FAST TWITCH MUSCLE MOTOR INNERVATIONS IN KITTENS AND CATS. By R. M. A. P. RIDGE.* From the Physiology
Distribution of Thalamic Projection Neurons to the Wulst in the Japanese Quail (Coturnix coturnix japonica)
") Distribution of Thalamic Projection Neurons to the Wulst in the Japanese Quail (Coturnix coturnix japonica) Michi YAMADA and Shoei SUGITA Department of Bioproductive Science, Faculty of Agriculture, Utsunomiya
Distribution of Thalamic Projection Neurons to the Wulst in the Japanese Quail (Coturnix coturnix japonica) Michi YAMADA and Shoei SUGITA Department of Bioproductive Science, Faculty of Agriculture, Utsunomiya
DREXEL UNIVERSITY COLLEGE OF MEDICINE ANIMAL CARE AND USE COMMITTEE POLICY FOR PREOPERATIVE AND POSTOPERATIVE CARE FOR NON-RODENT MAMMALS
 DREXEL UNIVERSITY COLLEGE OF MEDICINE ANIMAL CARE AND USE COMMITTEE POLICY FOR PREOPERATIVE AND POSTOPERATIVE CARE FOR NON-RODENT MAMMALS OBJECTIVE: This policy is to ensure that appropriate provisions
PERFUSION OF ISOLATED DOG SKIN*
 PERFUSION OF ISOLATED DOG SKIN* AAGE RITS KJAERSGAARD, M.D. Internal organs lend themselves easily to perfusion experiments. Important knowledge about intermediary metabolism of kidneys, liver, thyroid,
This SOP presents commonly used anesthetic regimes in rabbits.
 Comparative Medicine SOP #: 103. 01 Page: 1 of 7 Rabbit Anaesthesia The intent of this Standard Operating Procedure (SOP) is to describe commonly used methods to anesthetize rabbits at Comparative Medicine
AnOn. Behav., 1971, 19,
 AnOn. Behav., 1971, 19, 575-582 SHIFTS OF 'ATTENTION' IN CHICKS DURING FEEDING BY MARIAN DAWKINS Department of Zoology, University of Oxford Abstract. Feeding in 'runs' of and grains suggested the possibility
SURGICAL (SURVIVAL) OOCYTE COLLECTION FROM XENOUS LAEVIS
 OOCYTE COLLECTION FROM XENOUS LAEVIS") UBC Animal Care Guidelines SOP: ACC 2013 01 Surgical Oocyte Collection from Xenopus Laevis Submitted by: Shelly McErlane Last Date Revised: Date Approved: January 28, 2013 SURGICAL (SURVIVAL) OOCYTE COLLECTION
UBC Animal Care Guidelines SOP: ACC 2013 01 Surgical Oocyte Collection from Xenopus Laevis Submitted by: Shelly McErlane Last Date Revised: Date Approved: January 28, 2013 SURGICAL (SURVIVAL) OOCYTE COLLECTION