DEMOGRAPHY AND DISPERSAL IH ISLAND AND MAINLAND POPULATIONS OF THE DEER HOUSE, PeromYgcus maniculatus THOMAS PRIESTLAY SULLIVAN
|
|
|
- Geoffrey Strickland
- 6 years ago
- Views:
Transcription
1 DEMOGRAPHY AND DISPERSAL IH ISLAND AND MAINLAND POPULATIONS OF THE DEER HOUSE, PeromYgcus maniculatus by THOMAS PRIESTLAY SULLIVAN B.Sc. (Hons.), University of B.C., 1973 A THESIS SUBMITTED IN PARTIAL FULFILLMENT OF THE REQUIREMENTS FOR THE DEGREE OF MASTER OF SCIENCE in the Department of Zoology He accept this thesis as conforming to the required standard THE UNIVERSITY OF BRITISH COLUMBIA JUNE, 1976 (c) Thomas Priestlay Sullivan
2 In presenting this thesis in partial fulfilment of the requirements for an advanced degree at the University of British Columbia, I agree that the Library shall make it freely available for reference and study. I further agree that permission for extensive copying of this thesis for scholarly purposes may be granted by the Head of my Department or by his representatives. It is understood that copying or publication of this thesis for financial gain shall not be allowed without my written permission. Department of The University of British Columbia 2075 Wesbrook Place Vancouver, Canada V6T 1W5
3 i Abstract If dispersal is reduced on islands, then the demography of island populations of deer mice should be different from that of mainland populations., Areas of 1.1 ha were periodically cleared of mice on Samuel Island (206 ha) and Saturna Island (3102 ha) in the Gulf Islands of southwestern British Columbia., A similar experiment was conducted on the mainland at Maple Ridge, B.C., The average density of mice per hectare on Saturna (43.5) was twice that on Samuel Island (22.0) and nearly two and one-half times higher than that on the mainland (18.7). The reproductive rate, as measured by length of breeding season, number of successful pregnancies, proportion of breeding animals, and number of recruits surviving to breed, was much higher on Samuel Island than on either Saturna or the mainland. Survival was lowest on Samuel Island, with little difference between the mainland and Saturna Island., Mice on Samuel Island grew more than five times faster than mainland animals, and Saturna growth rates were double those on the mainland. Island adult males showed very few aggressive tendencies in laboratory behaviour tests compared with the seasonal changes in aggression reported in the literature for mainland deer mice. Dispersal (or colonization) rate was reduced on the two islands compared with that on the mainland. Eecruitment of young animals occurred throughout the breeding season on the islands but was delayed until the end of breeding on the mainland. There was little difference in the demographic attributes of control populations when compared with those of colonist populations on either the
4 i i mainland or the two islands. These results indicate that seasonal changes in aggressiveness of the adult population may be sufficient but not necessary to determine breeding density and seasonal changes in survival of juvenile deer mice., A more intensive study is reguired, but regulatory processes in populations of Peromy_scus oa&iculatus may be different on islands and perhaps should not be generalized over different geographic areas.
5 iii TABLE OF CONTENTS AisstiTcict *' «*» *' *»* '* * * #» <«#, * i. TABLE OF CONTENTS., i i i LIST OF FIGURES...,...., iv LIST OF TABLES, V ACKNOWLEDGEMENTS......,vii INTRODUCTION, 1 DESCRIPTION OF STUDY AREAS. 3 MATERIALS AND METHODS 5 BJBSUXITS «#«* ' **«** *.» - <*- * * *, * #.. 8 Trappability Population Density and Recruitment..., 9 Population Density and Dispersal Reproduction 16 Reproduction and Dispersal...., 17 Mortality Survival and Dispersal Growth *..'.'«.«'.*'...'...*.«..'...'....«. #... '., 23 Growth Rates and Dispersal...,, 25 Sex Ratios and Dispersal...-,..., 27 Introduction Experiments Behaviour 29 DISCUSSION , 30 SUMMARY FIGURES' TABLES,, 64 LITERATURE CITED
6 iv LIST OF FIGURES Figure 1. Location of study areas....., 42 Figure 2. Aerial photograph of study areas. 44 Figure 3, Population density on mainland control and experimental grids.,..., 46 Figure 4. Population density on Samuel Island control and experimental grids., Figure 5., Population density on Saturna Island control and experimental grids.s; Figure 6. Survival in the three control populations Figure 7, Percentage of animals sexually mature in various weight classes.,, Figure 8. Body weight distributions for control populations Figure 9. Growth rates for control and experimental populations Figure 10., Median body weight at sexual maturity for control and experimental populations Figure 11. Schematic representation of seasonal changes in populations of deer mice.,... 62
7 / LIST OF TABLES Table 1. Trappability estimates for control populations. 64 Table 2. Adult and juvenile recruitment in the breeding season.., «y,,,,.,. 65 Table 3, Control population density and colonization data, 66 Table 4. Comparison of observed range length in control and experimental populations.., Table 5. Proportion of mice in breeding condition in control populations*,...*... * Table 6. Proportion of mice in breeding condition on control and experimental areas during removal weeks.. 69 Table 7.,, Comparison of proportion of mice in breeding condition for control and pulse populations Table 8. Table 9. Survival rates for control populations. 71 Indices of early juvenile survival and reproductive data for control populations. 72 Table 10. Comparison of survival rates for control and experimental populations Table 11, Age classes of animals....,.. 74 Table 12. Growth rates for animals in control populations. 74 Table 13. Sex ratios in control and experimental populations,...,,.» * 75 Table 14. Table 15. Results of introduction experiments Results of behaviour tests for island mice. 77
8 vi Table 16., Summary of demography and dispersal in island and mainland populations of deer mice
9 vii ACKNOWLEDGEMENTS I wish to thank my supervisor. Dr. Charles J. Krebs, for his invaluable guidance and encouragement, and Dr. James A. Eedfield for providing the initial inspiration for this project. The help of Stan Jarvis on fiayne Island and Mr. and Mrs. H. Olmstead on Samuel Island made the study possible.. Thanks go to Norton Clapp who kindly permitted me the use of Samuel Island and the Ecological Reserves Committee, through Dr. V. J. Krajina,, for the use of the reserve on Saturna Island. Mr. J. Walters and his staff at the U.B.C. Research Forest were helpful and cooperative throughout the study. Walter Sr., Walter Jr., and Randall Kaiser assisted in setting up the island grids and trapping the two small islands. My mother kindly and patiently provided food supplies for the many excursions to the islands. Rudy Boonstra provided inspiration during my analysis of the data. Dr. Z. I. Halpin did the behaviour tests. The help of these people is greatly appreciated! Financial support was provided by N.R.C. funds awarded to C.J. Krebs and by a Gulf Oil Graduate Fellowship for which I am most grateful.
10 1 INTRODUCTION The role of dispersal in the demography of small mammals has received much attention in recent years. The relation of dispersal to population regulation has been experimentally studied in Microtus spp, by Myers and Krebs (1971) and Krebs et al (1976) and in Per.omy.scus spp, by Garten and Smith (1974) and Fairbairn (1976) Islands provide natural laboratories where hypotheses concerning the possible role of dispersal in regulating numbers may be experimentally tested. The Gulf Islands off the coast of southern British Columbia and the adjacent mainland provide areas for studying dispersal in populations of deer mice, Peromvscus maniculatus. Populations of deer mice in southern B.C. fluctuate seasonally with low spring breeding densities and high densities through the fall and winter. During the breeding season, recruitment is low, with few juveniles surviving to trappable age. It is currently thought that seasonal changes in the survival of juvenile mice are determined by seasonal changes in the aggressiveness of the adult population (Sadleir 1965; Healey 1967; Fordham 1971; Petticrew and Sadleir 1974; and Fairbairn 1976)., Previous work involving Peromvscus maniculatus on the Gulf Islands has suggested that island mice are poorer dispersers and have a lower variance in population size relative to mainland mice (Redfield 1976). If dispersal is reduced on the islands, how does the demography of island populations of deer mice compare with that of mainland, populations? One technique for
11 2 determining these effects is to produce a vacant area in good deer mouse habitat and then to measure the rate of colonization of the vacant habitat. The trapped-out area has been adopted as a technique for studying dispersal. Resident deer mice are periodically removed from an area, which dispersing animals then colonize. This study was designed to: 1) compare demographic attributes and seasonal changes in island and mainland populations of deer mice, 2) test the hypothesis that rates of dispersal are lower on islands than on the mainland, 3) compare demographic attributes of dispersing animals with those of residents in control populations. y
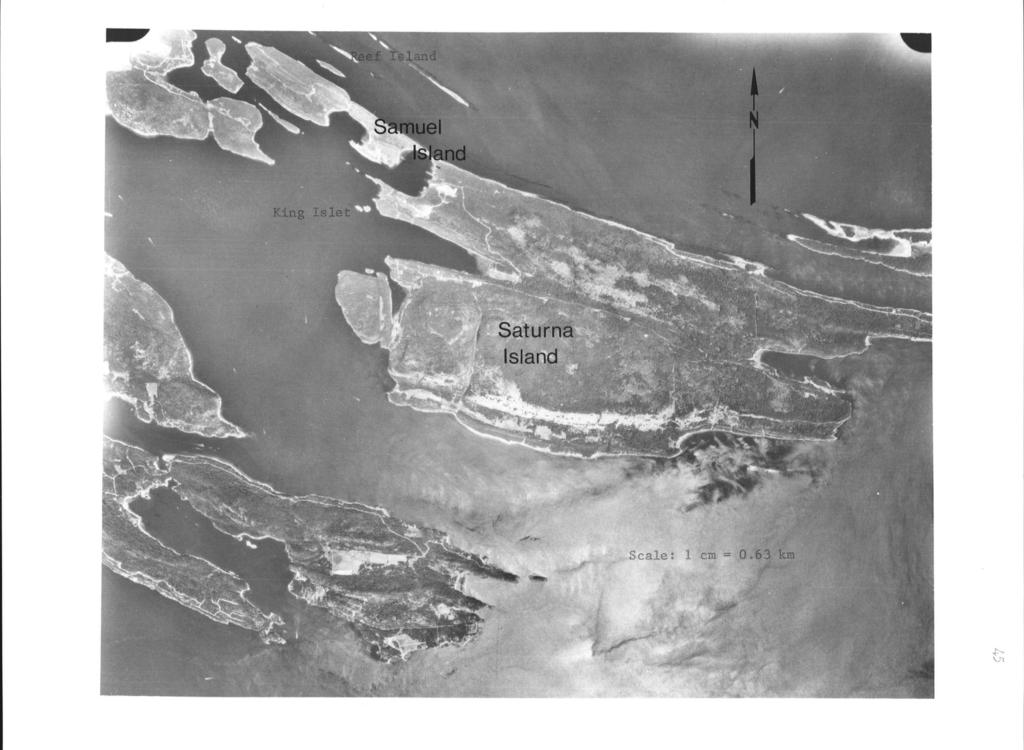
12 3 DESCRIPTION OF STUDY AREAS This research was done on Samuel Island and Saturna Island in the Gulf Islands and on the mainland in the U.B.C. Research Forest at Maple Ridge, B.C. (Figure 1). Samuel Island is 206 ha (510 acres) in area with a fairly dense cover of successional forest composed of Douglas f i r, western hemlock, western red cedar, and grand fir. Salal dominates the understory. Saturna Island is 3102 ha (7680 acres) in area and exhibits various successional stages following logging., The area used in this study was virgin Douglas fir forest with western hemlock and western red cedar of secondary importance. Salal was the most prevalent species in the understory. Two very small islands were used as areas for introductions of island and mainland populations of mice.. King Islet is 0.16 ha (0.4 acre) in area with a vegetation cover of shrubs and herbs, and is located between Samuel Island and Saturna Island. Reef Island is 1.6 ha (4.Q acres) in area, and has predominantly shrub and herb cover with some trees (Douglas fir and Madrone). It is located east of Samuel Island. An aerial photograph of these four island study areas is given in Figure 2. All these islands are located in the Coastal Douglas fir zone of Krajina's (1965) biogeoclimatic classification. The climate is mild with little temperature fluctuation and a fairly low amount of precipitation, most of which occurs in the winter season. The mainland study area is covered by second growth forest dominated by western hemlock and western red cedar with some
13 4 Douglas fir. Ground cover vegetation is sparse. The Research Forest is located in the Coastal Western Hemlock zone (Krajina 1965) with greater temperature fluctuations and amounts of precipitation than on the islands.
14 5 MATERIALS AND METHODS From March 1974 to May 1975, three control and three pulse removal grids were live-trapped every two weeks with Longworth live-traps. All grids were 1.1 hectares in area. One control grid and one pulse removal grid were located on each of the islands as well as the mainland. Large island (Saturna) and mainland grids had 4 9 trap stations (7x7), and small island (Samuel) grids had 50 trap stations (5x10). All trap stations, were located at 15.2-m intervals marked by flagging tape and string or stakes. One live-trap was placed within a 2-m radius of each station., Traps were baited with peanut butter and Purina lab chow, and Terylene batting was supplied as bedding. Traps were set on day 1, checked on days 2 and 3, and then locked open between trapping periods.. During November 1974 to March 1975, traps were set for one night only and checked the following day. Snow interrupted trapping from Dec.^ 28 to Jan. 24 on the islands and from Dec. 28 to Mar. 12 on the mainland. All deer mice captured were weighed on Pesola spring balances, sexed and ear-tagged with serially numbered fingerling fish tags. The duration of the breeding season was noted by palpation of male testes and the condition of vaginal openings and mammaries of the females, Mice were released immediately after processing on the control grids. The pulse removal grids were trapped on a 12-week cycle of 2 trapping periods of complete removal followed by 4 trapping periods of mark. and release trapping. This allowed mice to colonize the removal area and establish a resident population between removal
15 6 periods. Distances between control and pulse removal grids were as follows: 600 m on mainland, 1500 m on Saturna island, and 600 m on Samuel island. Population parameters were determined by enumeration technigues to avoid the statistical assumptions of random sampling. Hilborn et al. (1976) have demonstrated by a simulation model that enumeration technigues provide sufficiently accurate estimates for a trapping design in which 80% or more of the animals are caught each sampling time. Age classes of animals were determined by body weight. For the introduction experiments, approximately egual numbers of island and mainland mice were introduced onto King Islet and Reef Island on May 10, 1974,, These islands were not previously inhabited by mice (Redfield 1976), The areas were trapped July for two nights with small Sherman live-traps, and the number of surviving animals as well as new offspring were recorded., All mice were removed from King Islet at this time, and the experiment was repeated with much higher densities of island and mainland mice., This island was trapped again on Oct for two nights, and the number of surviving animals and offspring was recorded. For these experiments, mainland mice were collected from the removal grid at U.B.C. Research Forest and from trap-lines set on the U.B.C. Endowment Lands., Island mice were from the Samuel and Saturna Island pulse removal grids., Behaviour tests in the lab were conducted on males in reproductive condition from Samuel and Saturna Island control populations. No tests were done on mainland animals., Fourteen
16 7 animals were collected from each island in July, 1975 and tested after a 3- to 5-day lab adjustment period. Tests were conducted in a neutral arena in the dark under a 100-watt red bulb. Each of seven pairs of animals was allowed a 5-minute habituation period with behaviours (aggressive and cohesive) recorded at 5- second intervals over an interaction period of ten minutes, ; A brief description of these behaviours is given in Table 15.
17 8 RESULTS In the appropriate figures and tables, each of the grids is designated by a letter in the following manner: mainland control - A and pulse removal - B; Samuel Island control - C and pulse removal - D; Saturna Island control - E and pulse removal - F. Two age classes of deer mice have been used by Sadleir (1965), Britton (1966), Healey (1967), and Fordham (1971): juveniles and adults., I refer to these two age classes of adults and juveniles (animals in juvenile and subadult age classes pooled together) throughout the results and discussion. Juveniles are considered to be young animals recruited during the breeding season. The data analysis in this study is complicated by the same animals being captured in several sampling periods. Consequently, chi-square analyses have been utilized for data in which the samples are not completely independent. Examples are the proportion of animals in breeding condition, survival rates, and sex ratios. For this reason, the tests may not be statistically valid but are used as an indication of the degree of difference between sets of data. Chi-sguare analyses have been used to test for differences in various demographic attributes between control populations, between control and removal animals, and between control and pulse populations. Trappability. The demographic analysis of these island and mainland populations is based on the assumption that most of the individuals in a given population are captured. Maximum
18 9 trappability has been defined by Krebs et al.(1976) as follows: trappability= Ho. actually caught at time i / No. known to be present at time i Minimum unweighted trappability is a less biased estimate since it eliminates first and last captures, and provides only one value for each individual regardless of how long it lives. Both of these estimates for the three control populations are given in Table 1. As expected, maximum trappability is higher and is always above 79S. Minimum unweighted trappability is above 70S except for males on Saturna Island, There is no difference in trappability of males and females on Samuel Island. ; Mainland females and Saturna males have the lowest trappabilities, which in the latter case is probably associated with the higher density on this area. o Sii i2a LS.d Recruitment The population changes for the three study areas were different and will be discussed separately. The density of the control population on the mainland is shown in Figure 3, Density was low before breeding commenced and subsequently increased owing to an influx of new adult animals 3-4 weeks after the breeding season had begun. Numbers averaged about seventeen through the breeding season with very little recruitment. The number of juvenile recruits averaged 1.0 male and no females per trapping week of breeding season. In September, breeding ceased and there was the typical increase in
19 10 juvenile recruitment into the population., More males were recruited into the population than females at this time. Numbers increased through October to a peak of 32 animals and then stabilized for the duration of the winter. In early spring, density again decreased at the start of the next breeding season. Population changes on the Samuel Island control grid are illustrated in Figure 4., Breeding began in early April and numbers declined until late June, when recruitment of juveniles increased the density. Recruitment was continuous through the breeding season with peak density reached in mid-november. Juvenile recruits averaged 2.9 males and 2,2 females per trapping week of breeding season. More males were recruited than females during the last few weeks of the breeding season, otherwise there was very little difference in males and females throughout the study. Numbers were stable through the winter with little recruitment compared with that in the breeding season. There was approximately one and one-half times the number of animals at the start of the 1975 breeding season compared with the previous year. The non-breeding season was four months long on this small island compared with nine months duration on the mainland. The control population for Saturna Island is shown in Figure 5., Breeding began in early May with a slight decline in density until recruitment of juveniles started in July. Juvenile recruits averaged 3.1 males and 1.8 females per trapping week of breeding season. Numbers peaked at the end of breeding in September and remained high through the winter.. The
20 11 non-breeding season was approximately six months duration on this large island. The 1975 breeding season began in late March with juveniles recruited into the population during April and May, Numbers declined at the start of both breeding seasons until recruitment of young animals increased the density. The average density of mice per hectare on Saturna (43,5) throughout the study is twice that on Samuel Island (22,0) and nearly two and one^half times higher than that on the mainland (18.7). 22Slition Density, and Dispersal Results for the pulse removal grid on the mainland are shown in Figure 3. There are four total removal periods of one month duration each. The first, second, and last removals are followed by a two-month interval. The third removal is followed by a four-month interval when snow interrupted trapping for several weeks. Colonization and then establishment of a resident population comparable to the pre-removal density as well as that of the control grid occurred within two weeks in the first three pulse periods. The response after the fourth pulse removal is somewhat similar, but was hampered by skunk disturbance on the trapping area during the second removal week and the first week of colonization.. Also, this pulse removal occurred at the same time as numbers on the control grid were declining. A total of 95 animals was removed from this grid during the study, Results for the Samuel Island pulse removal grid are shown in Figure 4. The dispersal (colonization) rate of animals onto this grid was slow following the first and second removal weeks of the first pulse. Numbers did not reach the pre-removal or
21 12 control densities until eight weeks later. The other pulse periods showed more immediate responses following each removal. Density due to colonization stabilized at pre-removal and control levels 10 weeks after the second removal, six weeks after the third removal, and eight weeks following the fourth removal. The final pulse period showed a higher dispersal {colonization) rate compared with the first pulse but again recovery to a stable density was not completed. The first and last pulse removals occurred approximately one year apart. Colonization during the first two weeks of the final pulse was greater than that of the first., This probably reflects the higher control density (one and one-half times) and later start of the breeding season in 1975 compared with declining numbers after the start of the breeding season in A total of 168 mice was removed from this grid during the study. Data from the Saturna Island pulse removal grid are shown in Figure 5. Dispersal (colonization) rate was slow during the recovery following the first removal period. Density did not stabilize to the level of pre-removal or control populations until eight weeks after the removal. The second pulse had a much more rapid rate of dispersal within the first two weeks of colonization., Numbers stabilized at the pre-removal level about four weeks into the pulse and reached a density comparable to that of the control after ten weeks. The third pulse showed a similar initial rate of colonization and after four weeks stabilized below pre-removal and control densities. The fourth pulse removal was interrupted by snow, with the result that not all animals were removed. Subsequent colonization near to the
22 13 pre-removal level occurred within two weeks, and after ten weeks was s t i l l below that of the control. The final pulse removal took place in the spring of 1975 approximately one year after the first. The removal periods and initial colonization were very similar. The breeding season was in progress each year and control and pre-removal densities were comparable. Thus, this final pulse can be considered a sequential replicate of the first pulse period. 1 total of 262 animals was removed from this grid during the study. A comparison of recruitment during removal weeks in the breeding season for control and pulse removal grids is shown in Table 2. On the mainland, very few adults or juveniles entered the control population compared with the numbers that were recruited onto the removal grid. However, on Samuel Island, during the removal weeks of the second and third pulses, similar numbers of male juveniles but not females entered the control and experimental populations. For total numbers, this is significantly different from that on the mainland (p<.05). In both pulses, more adults colonized the removal area than were recruited into the control population and these animals were predominantly males. Saturna Island showed a greater number of juveniles colonizing the removal area compared with recruits into the control population. When compared with the mainland, this difference is not statistically significant (p=.06), but is of biological significance because of its similarity to Samuel Island. There is little difference between grids with respect to adults. In this study, dispersal (or colonization) rate can be
23 14 measured in three ways: number of new mice colonizing pulse removal grid during the two weeks following each total removal, recovery ratio and recruitment index (Krebs et al, ). Observed range length is used as a possible check on these three techniques. Recovery ratio= No., mice colonizing removal grid at time i / Population size on control grid or pulse removal grid at time i Relative recruitment index= No. mice colonizing removal grid at time i / No. new recruits tagged on control grid at i The first three measures for the experimental populations are presented in Table 3., The recovery ratio may be used as a measure of the resiliency of the control population as well as the experimental population which has colonized and resided on the pulse removal grid. The average recovery ratio, expressed as a percentage, for the control populations is highest on the mainland (pulses 1,2, and 3) at 95.8%. Both islands have a much lower resiliency: Samuel Island with 57.3% and Saturna (pulses 1,2,3, and 5) at 36.9%. There is no overlap in 95% confidence limits between data for the mainland and Saturna Island which suggests a significant difference in this measure of dispersal rate. The average recovery ratio for the pulse populations similarly is highest on the mainland at 97.4%, with Samuel Island (59.9%) and Saturna (50.7%) being substantially lower,.
24 15 There is virtually no overlap in confidence limits between data for the mainland and Samuel Island and very little overlap between the mainland and Saturna., The relative recruitment index averaged 8.25 on the mainland. This means for every new mouse captured on the control area during these removal weeks, approximately 8 animals colonized the pulse removal grid. The islands both had much lower average indices of recruitment, with Samuel Island at 3.44 and Saturna at 3.30., Since islands have restricted land area, observed range length should be a fairly good index of the movement of mice and, consequently, the ability to disperse. Table 4 summarizes observed range lengths for males and females on the control and pulse removal grids of each study area. Only mice with more than one capture were used for these calculations. Movement of males on the mainland control is not significantly different from that on either island control., However, Saturna males have a significantly smaller range length than do those on Samuel. Control and experimental males show no difference on either island. Sales from the experimental population on the mainland show a significantly larger average range length than do their control counterparts. This is biologically significant, since it is evident that those animals colonizing the pulse removal grid on the mainland have a higher rate of dispersal than similar mice on either island., Movement of females is not significantly different for control and experimental populations between islands (Table 4). Mainland females have larger range lengths than females on the islands, and this result again is
25 16 statistically and biologically significant. There is no difference in female movement between mainland control and experimental grids. In summary, the number of mice moving into depopulated areas as measured by two recovery ratios and recruitment index is much greater than on either island. This is further supported by movement of animals, as measured by observed range length, which is significantly greater on the mainland than on the islands., SMfiroduction The best variable to use for determining the breeding activity of a population is probably the percentage of lactating females (Krebs et al. 1969). This parameter underestimates the start of active breeding by the length of the gestation period, which is about three weeks. Percentage of females with medium to large nipples and percentage of males with scrotal testes have been used to determine the length of breeding season for my three control populations. On the mainland, the 1974 breeding season extended from mid-june to early September (ca., 12 weeks). On Samuel Island the duration of breeding was from mid-april to mid-december {ca. 34 weeks) with some animals in reproductive condition up to late January The 1975 breeding season began in early May at both of these study areas. Breeding commenced in mid-may 1974 on Saturna Island and extended to mid-september (ca., 18 weeks).. There was sporadic breeding in early October., The 1975 breeding season began in mid-march and continued through to the end of the study in late May.
26 17 Table 5 gives three measures of breeding performance for the control populations during June to August of the 1974 breeding season. A significantly higher percentage of adult males was in breeding condition on Samuel Island compared with Saturna., Although not statistically significant, the mainland population also had a higher percentage of males with scrotal testes compared with Saturna, There was no difference in percentage of adult females with a perforate vagina. Island comparisons for juveniles for these two measures of breeding intensity were not significantly different. Mainland animals in this age class could not be compared with those on the islands because of low sample size., Samuel Island had a significantly higher percentage of adult females lactating compared with Saturna and a 10% increment over the mainland. An estimate of litter size for Saturna Island mice was obtained from laboratory animals and averaged 3.38 (N=32, range 2 to 5)., This figure may be compared with. mainland litter sizes determined by other workers (Sheppe 1963; Sadleir 1974). IS production and Disp_er sal A comparison of breeding intensity for all removal weeks for control and pulse removal grids is given in Table 6. There was no difference in breeding intensity between control and dispersing males of either age class on any of the study areas. Adult and juvenile females showed no difference in breeding intensity as measured by lactation. Of the adult females colonizing the removal grid on Samuel Island, the percentage with a perforate vagina was significantly higher compared with the control population (p<.05). Similarly, adult female
27 18 colonizers on Saturna Island also had a higher percentage (p=.06) for this measure of breeding intensity. However, this may not be biologically significant because condition of the vaginal opening shows much variability (Sadleir 1974), and both island experimental grids have low sample size relative to those for control populations. Percentage of lactating females is probably more reliable for determining the breeding activity of a population but i t is impossible to get a rapid response in the lactation measure to a sudden removal situation,, The reproductive performance of the pulse populations after colonization is given in Table 7. There was a significantly higher percentage of adult males with scrotal testes on the Saturna experimental grid during the first and second pulses as well as the total. The second pulse population on Samuel Island also had more reproductive adult males than did the control. Mainland adult males showed no difference in reproductive performance between control and pulse populations. Similarly, where sample size allowed statistical comparison, juveniles did not vary significantly in control and pulse populations for either scrotal testes or perforate vagina. Percentage of adult females with perforate vagina also follows this pattern. There is no significant variation in percentage of lactating females on the mainland or Samuel Island, but the trend from the totals is a lower number of females with medium to large nipples among the pulse populations compared with the control. The Saturna Island adult females show a higher percentage of lactation in the first pulse population, a difference which may be biologically significant.,
28 19 To summarize, males and females colonizing the experimental grids following each removal week did not differ significantly in reproductive condition from control animals for any of the study areas., However, in the subsequent pulse populations, breeding intensity was significantly higher in adult males on Saturna Island and during the second pulse on Samuel Island., It was significantly lower for lactating adult females during the second pulse on Saturna. Mainland control and experimental populations showed similar reproductive attributes.. Mortality Mortality in this study is represented by disappearance from the trappable population, and so includes emigration. Temporal changes in survival rates are measured by direct enumeration, and include survival in the trappable population and early juvenile survival., Minimum survival rates for all males and females in the three control populations in this study are presented in Figure 6. The average survival rates are given for breeding (summer) and non-breeding (winter) seasons in Table 8. These average rates are summed over a season with an individual mouse being tallied each time it is trapped., On the mainland, male survival showed a large drop at the start of the breeding season, and was lowest in July 1974 and again in April Females survived poorly before the breeding season started, and then remained fairly stable up to May of the following year, when survival slipped below 50%. Survival of males was lower in the summer compared with winter (p=.07) and female survival was the same in each season. Male
29 20 survival was lower than that of females iu summer (not statistically significant) with no difference in the, winter., Both males and females showed a steady increase in survival towards the end of and after the breeding season., On Samuel Island, both sexes (particularly males) had very poor survival during most of the breeding season. It improved toward the end of breeding and remained high through the winter. Average survival was significantly higher (p<.01) in winter for both males and females. Male survival was lower than that of females in both seasons but the difference is not statistically significant. Saturna Island males had lowest survival during summer 1974, increased towards the end of breeding and remained high through the winter (difference significant at p<.01). Female survival was high throughout the study, with little difference between seasons. It may be biologically significant that survival of females was greater than that of males during the breeding season. Table 8 presents comparisons of minimum survival rates for different seasons and age classes for males and females in the three control populations. Low sample size for winter 1974 populations at the start of the study did not permit statistical comparisons. During summer 1974, adult males and juvenile females on Saturna Island had significantly better survival than on Samuel Island. Mainland adults and Saturna juvenile males also had higher survival than those of Samuel, but this is not significant.. Totals for the two age classes show significantly higher survival on Saturna and the mainland for both males and females. This trend continued through winter for males,
30 21 but there are no differences in total female survival. Age class distinctions for deer mice can be determined only during the breeding season. Total survival through the study for all males and females was significantly lower on Samuel Island compared with Saturna. This was also true for total mainland males but not for females. Total survival on the mainland and Saturna was very similar for both sexes. Early juvenile survival may be measured by an index relating recruitment of young into the trappable population to the number of possibly lactating females (Krebs 1966): index= No. small mice in week t / No. females with medium to large nipples caught in week t-4 Small mice were defined as those less than 17 g on the mainland, 19 g on Samuel Island, and 21 g on Saturna Island.. Different gram weights were used in accordance with the discussion of variation in body weights and growth rates. Table 9 gives the mean indices for the three control populations during the breeding season and up to the end of recruitment of young. In the breeding season, early juvenile survival on Samuel Island was ten times higher than that of the mainland and one and onehalf times higher than that of Saturna Island. Early juvenile survival was also much better on Saturna than on the mainland. With the addition of recruitment after the breeding season, the two island indices changed very little. However, the mainland increased to 0.66 and this late recruitment was reflected in the
31 22 increase in total density in the fall for the control population (Figure 3). The number of successful pregnancies, litter size, and expected and observed number of juveniles which were recruited into each control population during the breeding season are listed in Table 9. Samuel Island had the highest number of successful pregnancies as well as observed number of juveniles entering the population. Saturna Island had slightly more successful pregnancies than the mainland and a much higher recruitment of juveniles. Of animals which were recruited into control populations up to one month before the end of breeding, 46% males and 50% females survived at least two weeks and 29% males and 47% females survived and bred on Samuel Island (Table 9). On Saturna, 60% males and 75% females survived, but no males and only 3 of 8 females survived and bred. The mainland had 2 of 3 males surviving after being caught two weeks before the end of breeding. In summary, total male survival for all control populations and total female survival on Samuel Island were significantly lower in summer compared with winter. Samuel adult males and juvenile males and females survived very poorly relative to Saturna Island. Adult females showed little difference. Winter survival rates were poorest on Samuel Island, and showed very little variation between Saturna and the mainland. Total survival through the study was lowest on Samuel, with little difference between the mainland and Saturna Island., Early juvenile survival was highest on Samuel Island, followed by Saturna and then the mainland.
32 23 Survival and Dispersal To determine if dispersing (colonizing) animals survived better than those in control populations, survival rates should be compared between each two-month pulse period and a similar time period on the control. Table 10 presents this comparison for males and females on the three study areas. There was no difference in survival between residents and colonizing mice for either sex on the mainland. The poor survival of animals in pulse no., 3 for both males and females was probably due to low sample size on the experimental grid. Total survival was similar for males and somewhat lower for pulse females compared with the control. Saturna Island likewise showed no difference between control and experimental animals. Survival was slightly higher in male populations of the first and last pulses and lower in pulse no,, 1 for females, but total survival was similar for both sexes. On Samuel Island, males survived significantly better on the experimental grid during the first and third pulses as well as overall. Female survival was significantly higher for the first three pulse populations compared with control survival., The fourth pulse showed a lower but still high survival rate relative to control. To summarize, there was little variation in survival between control and colonist populations on Saturna Island or the mainland. However, both male and female deer mice on Samuel Island survived better in most pulse populations relative to control animals. Growth Growth rates may be used as a further index of conditions
33 24 within populations of Peromjjscus maniculatus. The aspects of growth to be considered are sexual maturity and body weight, growth rate regressed on body weight, and body weight distributions. Age at sexual maturity is a useful demographic variable for determining the age classes of deer mice. Owing to the lack of a better criterion, body weight must be used as an index of age. The percentage of sexually mature animals in a series of weight classes may be used to determine the weight limitations for juveniles, subadults, and adults. Figure 7 presents this comparison for males and females in the control and pulse populations during the breeding season., Males and females and control and pulse populations did not differ significantly with respect to these histograms. My age classes assume juveniles are seldom, if ever, sexually mature; individuals of which less than 50% are mature in the upper weight class are called subadults; and adults must have at least 50% of mice sexually mature in the lowest weight class. Osing these criteria, I estimated the weight limits for age classes from Figure 7 and these limits are listed in Table 11. To show that the differing weights of age classes are equivalent among study areas (e. g. is a 17-g adult mouse on the mainland equivalent in age to a 21-g adult mouse on Saturna Island?), there must be variation in growth rates. Since growth rate is dependent on body weight, regressions for these variables may be compared between study areas. Table 12 summarizes analysis of covariance of growth rate regressed on body weight of animals less than 20 g from June to October.
34 25 Males and females had similar growth rates and have been combined for the three control populations. Samuel Island mice have a growth rate 5.6 times that of mainland mice and 2.8 times that of Saturna mice, which in turn grow twice as fast as mainland animals. Thus, the island animals do grow much faster than their mainland counterparts, and so the age classes used throughout this paper are reasonably accurate. Body weight distributions for breeding (summer) and nonbreeding (winter) seasons for males in control populations are shown in Figure 8. Body weights were higher in the summer compared with winter for the mainland and Samuel Island. There is little difference on Saturna, which may reflect the lower intensity of breeding on the larger island. Both islands have animals weighing up to 32 g., During breeding, there are very few mainland adults above 24 g in weight and none above 26 g. Samuel Island has the highest number of mice in juvenile and subadult weight classes. During the winter, most mainland males are in one weight category (16-17 g), and on Samuel the majority weigh g. Saturna males are evenly spread over 5 weight classes (20-30 g), Growth Bates and Dispersal The growth rates of individuals comprising the pulse populations on removal areas should be egual to or better than those on control grids.. Mean growth rates (adjusted to 13-g animals on the mainland and Samuel Island and 15 g on Saturna Island) and 95% confidence limits of males for control and pulse populations are shown in Figure 9. None of the individual means is significantly different because of the broad confidence
35 26 intervals. Growth was slightly better on the mainland pulse removal grid during the first, third, and fourth pulses., On Samuel and Saturna Islands, growth rates in pulse populations were less (except pulse no. 3 on Saturna) than for control animals. There is more variation in the female data, which are also presented in Figure 9. Experimental females on the mainland had slightly better growth during the first and third pulses, but a lower growth rate for the second pulse. There were insufficient data to plot an average value for the fourth pulse population. Saturna females showed slightly better growth in the experimental population relative to control for the first three pulses and then decreased considerably in the final pulse. Females were growing better in the first, second, and fourth pulses, but much poorer during the third pulse on Samuel Island. In general, growth of mainland animals remained fairly stable through time whereas the growth rates of Samuel Island animals decreased during the study, and those of Saturna decreased and then improved in the last pulse., Age at sexual maturity is also a useful variable for determining i f colonizing mice are maturing at the same age as control animals. The weight at sexual maturity for live-trapped mice was estimated in the same manner as described for voles by Krebs et al. (1976). Figure 10 presents these data for males and females during the period June to October The body weight of male deer mice at sexual maturity was the same for control and pulse populations on the mainland.. However, island experimental males tended to mature at lighter weights than control animals, a difference that is significant on Saturna
36 27 Island but not on Samuel. Females on all study areas matured at slightly lower weights in pulse compared with control populations. From a comparison of male and female control animals i t is apparent that mainland females matured at weights nearly 3 g heavier than males, but island mice showed very little difference. In summary, animals on Samuel Island grew more than five times faster than mainland mice, and Saturna growth rates were double those on the mainland. This variation in growth substantiates age class distinctions showing Saturna adults 4 g heavier and Samuel adults 2 g heavier than their mainland counterparts., Mainland experimental males tended to have better growth than control animals, whereas island experimental males had slightly lower growth rates. In general, female growth on experimental areas was better than on controls, but there was some variation for specific pulse periods. Both sexes of island experimental animals and females on the mainland tended to mature at lighter weights compared with control populations. Sex Ratios and Disp_ersal The sex ratio of control areas has been estimated by tallying each animal every time i t is captured and summing these data for the entire study and the four removal periods. This technique provides a weighted average sex ratio for control and colonizing populations., Both the mainland and Saturna control populations had a significantly higher (p<.05) proportion of males (0.58) compared with Samuel Island (0.50). Table 13 gives the sex ratios for control and colonizing populations of the three study areas. More males colonized the removal area than
37 28 females on Samuel Island, and this is significant for the total. The proportion of mainland males varied from one pulse to the next, but there was no difference in the total ratio. On Saturna, the proportion of males was less than the control in the first removal period, but there was a transition through the study to a higher proportion in the final removal. Since age class distinctions in P. maniculatus can only be made during the breeding season, there are insufficient data to determine a difference in sex ratio between juveniles from experimental and control areas and that of adults., Comparison of sex ratios of mice colonizing removal areas with those of new recruits on control areas showed no difference. isjteoduction Exp.erim.ents To test for possible differences between island and mainland deer mice with respect to colonizing ability, behaviour, and survival, approximately egual numbers of animals were introduced to two small islands. The results of three introduction experiments are listed in Table 14. There were no significant differences (chi-sguare analyses) in relative success or survival of either island or mainland mice. It was not possible to identify untagged offspring as of either island or mainland origin. The total number of mice introduced onto Eeef Island averaged animals per acre and the number introduced in the second King Islet experiment equalled 167 per acre. At the end of these experiments the density on Eeef Island increased to 21.5 per acre and King Islet was 120 animals per acre. It was hoped that these abnormally high densities might result in either mainland or island mice dominating owing
38 29 to a higher level of agonistic behaviour. However, no valid conclusions may be drawn from these experiments except that deer mice can survive for a short period of time, and at least some individuals reproduce at these very high densities.. Behaviour This investigation into behaviour of island and mainland mice is preliminary and represents the behaviour of animals under laboratory conditions. Results of behaviour tests for Samuel and Saturna Islands are listed in Table 15.,, There appear to be very few aggressive tendencies in island mice. Samuel Island males had a much shorter latency period before first recorded behaviour and twice the number of interaction intervals compared with those of Saturna. This may reflect a lower level of general activity among the large island animals compared with those from Samuel. These results are not consistent with those of Sadleir (1965), Healey (1967), and Fairbairn (1976) who showed seasonal changes in aggressive behaviour of male adult deer mice.
39 30 DISCUSSION In the experimental part of this study, deer mice were removed from areas for one month, followed by establishment of a resident population during the next two months,, Consequently, i t is possible to measure the rate of colonization onto the vacant area and monitor the performance of animals which become established. Individuals which appear on the vacant area were classed as 'dispersers,' and are probably surplus animals driven out of adjacent populations. This experiment was designed to study the colonizing ability of dispersers at 3-month intervals throughout the year.. It is unlikely that all the mice which colonized the pulse removal grids were animals which would have been dispersing out of undisturbed populations. ; However, I think it is safe to assume that this sample would contain a higher proportion of dispersing individuals than would resident samples from control areas. The work of Stickel (1946) and Fairbairn (1976) with deer mice from continuous removal grids tends to support this assumption.. Several other assumptions for experimental designs involving removal of animals from an area have been discussed by Krebs et al. (1976). Control and removal grids were separated by a distance beyond which there could be any effect on population processes in the control area due to removal of mice from the experimental area. This precluded catching tagged individuals which dispersed from the control, but was necessary owing to the wide ranging activity of deer mice (Stickel 1968). Therefore, I am assuming my distant control populations give an adequate
40 31 representation of events occurring around the removal area. A second assumption is that most resident and colonizing mice are removed during the two removal weeks between pulse periods. V±. ffiasigulatus is very trappable and readily enters unfamiliar traps. Thus, the wave of colonizing mice following a month removal are assumed to be surplus animals dispersing onto a vacant habitat. ; It is also possible that colonizing mice are just wandering individuals which shift homesites every few weeks or months. I do not have the behavioural data to determine whether colonizing mice are socially subordinate animals or are wanderers moving through the population. A pulse removal was used in this study instead of a continuous removal because it allows capture. of animals colonizing a vacant habitat and then monitors the demographic performance in the following two months. It should also be noted that a continuous removal on Samuel Island may have had adverse effects on the control population by acting as a sink for this small island (510 acres). Populations of deer mice have been experimentally studied on the mainland of southwestern British Columbia by Sadleir (1965), Healey (1967), Fordham (1971), Petticrew and Sadleir (1974), and Fairbairn (1976)., Seasonal changes in these populations of P.. fflaniculatus are summarized in Figure 11. The results from my study at the U.B.C Research Forest at Haple Sidge tend to agree with most aspects of the demographic changes associated with this annual cycle of numbers in deer mice. There is an increase rather than a decline at the onset of breeding. Overwinter mortality may have reduced the population
41 32 to the point that too few animals are present to exploit the habitat efficiently and immigrants move in from adjacent areas. As discussed by Healey (1967) and Fairbairn (1976), the spring reorganization may not necessarily be a decline in numbers. It should involve increased immigration and emigration, and density may decrease, increase, or show no net change. Fairbairn (1976) also suggests that a decrease in density of males at this time is a response to mortality of early breeding females., However, the first lactating females on my mainland control grid did not suffer heavy mortality. This may be due to delayed start in breeding (mid-june) in 1974 such that energy requirements (food and weather conditions) were favourable for successful reproduction. Petticrew and Sadleir (1974) working in this same forest found the start of breeding to be much earlier in 1969 (February) and in 1970 (April). The populations on Samuel Island and Saturna Island showed some differences from the model population presented in Figure 11. There are two basic differences in demography, apart from density, between the islands and mainland. Firstly, there is a lower rate of dispersal on the islands as measured by observed range length and by three indices derived from the number of new mice colonizing the pulse removal grid. This is most pronounced during the spring reorganization, when male density on Saturna (1974 and 1975) and density of males and females on Samuel Island is declining. There does not appear to be a surplus of animals on either island at this time. This may be an indication that animals are not being driven out of the resident population by social pressure, but are dying on
42 33 the grid., This is further supported by the colonization of experimental areas being more rapid in removal weeks during the rest of the year when a surplus or spill-over of animals must be available from the breeding season., Although rapid colonization of my mainland pulse removal grid occurred before breeding, Fairbairn (1976) has shown by two pulse removal experiments on U.B.C., Endowment Lands that animals moving around in undisturbed areas during the spring reorganization would rapidly colonize a depopulated area., Her control populations were declining at this time, which is similar to what was happening on my island control areas. Thus, these dispersing mainland mice represent surplus animals which were presumably driven out of the resident population. Breeding was continuous after starting in April on Samuel Island and in May on Saturna Island (1974). There was no pulse of early breeding before the main breeding season began on the islands compared with that recorded by Fairbairn (1976) on the U.B.C. Endowment Lands. An exception may be the 1975 breeding season on Saturna Island which began in March and appeared to taper off in mid-may when the study ended. There was heavy mortality of early breeding females on Samuel Island, and survival of males was also very poor at this time. These results are consistent with the poor survival of early breeding females and subsequent decline in density of males recorded by Fairbairn (1976). However, on Saturna Island, the first lactating females survived very well in both 1974 and 1975., Secondly, recruitment of juveniles occurs throughout the breeding season with peak densities reached before the end of
43 34 breeding., This recruitment into control populations on the islands was verified by the experimental areas., The eguivalent number of juveniles colonizing the pulse removal grid and entering the control population during removal weeks provided this support. On the mainland, as expected, animals colonizing the pulse removal during removal weeks and the first two weeks of the second pulse period were primarily juveniles,, There was virtually no recruitment into the control population at this time. This result contradicts that of Fairbairn (1976), who had poor dispersal of juveniles, but high dispersal of adults onto removal areas. It is possible my experiment of periodically removing animals during breeding may not be comparable to a continuous removal experiment. However, the number of juveniles versus adults dispersing onto a removal grid is a function of age classes based on body weight.^ Fairbairn (1976) used a juvenile weight class of under 15 g ;whereas I used 17 g. Since juvenile animals may be growing rapidly at this time of year, the high number of adults colonizing a depopulated area may include a fair proportion of mice which are actually young recruits. If this is the case, then, animals not able to enter a resident population disperse in an attempt to find an open space to settle in.,. This was suggested by Healey (1967) as a mechanism for getting rid of the excess of recruits during years of low mortality. Preliminary results from behaviour tests indicate that island adult males in breeding condition show virtually no aggressive behaviour. This is further supported by Halpin's work (pers, comm. ) which showed no evidence of aggressive
44 35 behaviour between island adults and juveniles in the neutral arena. On the mainland, Sadleir (1965), Healey (1967), and Fairbairn (1976) have found an increase in adult male aggression during the breeding season., Sadleir (1965) and Healey (1967) have also established that adult males in mainland populations inhibit growth and survival of juveniles at this time. A behavioural difference between island and mainland mice may explain reduced dispersal on the islands, particularly during the spring reorganization. If there is little aggressive interaction or social pressure forcing animals out of the population on the islands in order to establish a breeding density, then colonization of depopulated areas will be slow. The ability of juveniles to reach trappable age and even enter the population may also be a result of this lack of aggressive behaviour. The reproductive rate as measured by length of breeding season, number of successful pregnancies, percentage of breeding animals, and number of recruits surviving to breed is much higher on Samuel Island than on either Saturna or the mainland. This high reproductive rate is responsible for the high recruitment and is associated with subseguent poor survival during breeding on Samuel, That the flood of recruits on Samuel is not just a function of the high rate of reproduction is shown by the recruitment into the Saturna control population which had a lower reproductive rate but higher survival. If the Samuel population can produce almost double the number of litters, why is the density of deer mice on this island not comparable to that on Saturna?
45 36 The higher density on Saturna probably reflects a greater abundance of food in the virgin Douglas fir forest compared with that in the drier successional forest habitat on Samuel Island. This assumes that animals in both island populations are equally non-aggressive, but in, no way implicates food as a factor limiting the number of mice on the smaller island.,. Young animals on Samuel have growth rates over two and one-half times those on Saturna, and this allows recruited animals to breed as soon as possible before the end of the breeding season., This is certainly reflected in the high number of recruits surviving to breed in the Samuel Island control population. Further evidence that food limitation is unlikely, is the success of introduced deer mice onto King Islet and Eeef Island. Both these islands were dry and rocky with few trees and shrubs, but there obviously was enough edible material to support such high densities of mice. Redfield (pers, comm.) introduced cohorts of 50 mice to each of several previously uninhabited islands in the Gulf Islands, and all populations were thriving one year later. The weather on the Gulf Islands is much less seasonal than on the mainland. Summers can be very dry, and so water could be a limiting factor on small rocky islands; but again the success of my introductions would appear to refute this hypothesis., Predation appears as an unlikely source of mortality. No avian or terrestrial predators were observed on Samuel Island. Raccoons and herons were occasionally observed to forage in intertidal regions and mink are known to inhabit some of the smaller Gulf Islands, but were not seen on Samuel.
46 37 Thus, what is regulating the numbers of deer mice during the spring reorganization and breeding season on these islands? Aggressive behaviour by dominant animals cannot be ruled out. Comparison of demographic attributes in control and pulse populations showed no consistent differences throughout the study on the mainland and Saturna Island. Fairbairn (1976) ' found a similar result on the U.B.C* Endowment Lands, and concluded that the plasticity of these animals, in colonizing a vacant area and establishing a resident population, make deer mice very resilient to local extinctions. The situation on Samuel Island was somewhat different, as more males colonized the pulse removal grids; but the sex ratio stabilized at 1:1 in the succeeding pulse populations. Survival of males and females was significantly higher in nearly every pulse population compared with the control. This suggests that perhaps some animals, particularly males, may have been driven out of the resident population, and these possibly subordinate mice survived better on the depopulated areas. One might also expect growth rates to improve. However, males grew less and females slightly better than their control counterparts. There were no other consistent differences in demographic parameters between control and pulse populations on Samuel Island. There seems to be little difference in the plasticity of island and mainland mice colonizing vacant habitat., I originally thought that if there were reduced dispersal on the islands, it would be a result of the 'island* or 'fence effect'(krebs et al. 1969)., Hith this lower rate of dispersal and movement, there might also be a reduction in aggressive
47 38 tendencies such that a population could survive successfully on a small, finite area of land. However, it seems unlikely that Saturna Island at 3102 ha {7680 acres) could act as an 'island* to a population of deer mice; and yet reduced dispersal on this island was comparable to that of Samuel with an area of 206 ha (510 acres), If dispersal is a function of island size, then it should be more restricted oh islands smaller than Samuel, and more pronounced on larger areas such as Vancouver Island. HcCabe and Cowan {1945) reported lower densities of island E Siccus spp. compared with nearby mainland areas further north in British Columbia. Redfield (1976) reported higher densities of deer mice on some of the Gulf Islands compared with the mainland of southwestern B.C. The 'fence effect' (Krebs et al., 1969) may be operating to reduce dispersal resulting in higher densities. This is in accordance with the condition of 'frustrated dispersal' suggested by Lidxcker (1975). Populations of small mammals in experimental enclosures and on natural islands would cope with frustrated dispersal by increased usage of marginal habitat or a combination of decreased birth rate and increased death rate (Lidicker 1975).. Redfield (1976) has suggested that deer mice on the Gulf Islands are K-selected because of their larger body size and higher densities, which reflect different demographic parameters and reduced dispersal compared with mainland populations. Studies in Europe appear to support the contention that island populations of rodents tend towards K-selection. an island population of the Skomer vole jc 1 e t hrionomy.s gla.regl.3s skgmerensisjl exhibited larger body size, higher densities, very
48 39 short breeding season, and a slower maturation rate compared with populations on the British mainland (Fullagar et al., 1963; Jewell 1966), Populations of the long-tailed field mouse ll &demus svjlvaticus}. on some British islands have larger body size than mainland animals but there is much variation among islands (Delany 1970). An island population of the bank vole iclethrionomxs S[la solus)_ in Poland showed delayed maturation of young born late in the breeding season (Bujalska and Gliwicz 1968; Petrusewicz et al. 1971). My island populations of Peromyseus maniculatu.s exhibit larger body size, higher densities, and reduced dispersal but they do not conform to the correlates of K-selection listed by Pianka (1970). In particular, mice on Samuel Island have rapid growth rates, a high reproductive rate, and poor survival which are all demographic correlates of r-selection.^ Deer mice on Saturna Island have higher growth rates, a slightly higher reproductive rate, and similar survival compared with mainland animals, Thus, compared with Samuel Island, mice on Saturna appear to be shifted towards the r-endpoint of the r-k continuum. Mainland populations of deer mice would probably also be located towards the K-endpoint compared with animals on Samuel Island. Taxonomic studies of this species on the northern Gulf Islands (McCabe and Cowan 1945) and the Queen Charlotte Islands (Foster 1965) have indicated that there are several subspecies of deer mice on islands along the west coast of B.C. This information and the difference in body size and other external characteristics, such as pelage colour, between my island and
49 40 mainland populations, as well as the genetic variation shown by Eedfield (1976), indicate that deer mice have probably been isolated on the islands for many thousands of years. Thus, evolutionary processes such as genetic drift could be responsible for the dispersal and recruitment pattern observed in these island mice. The effect of restricted land area may have interacted with the evolution of the populations. Regardless of the evolutionary origin of this dispersal and recruitment pattern, it may be concluded that on these islands seasonal changes in aggressiveness of the adult population may be sufficient but not necessary to determine the breeding density and seasonal changes in survival of juvenile deer mice. A more intensive study of seasonal changes in behaviour and the variation in demographic and dispersal parameters over several years for island populations of deer mice would rigorously test the validity of this conclusion,. It perhaps can be stated with some credibility that regulatory processes in populations of Peromyscus laniculatus could be different in island populations and hence should not be generalized over different geographic areas.
50 41 SdHBAfiY The demographic and dispersal results for island and mainland populations of deer mice in this study are summarized in Table 16.,
51 42 Figure 1. Location of study areas: tt.b.c. Research Forest at Maple Ridge, and Samuel Island, Saturna Island, Reef Island, and King Islet in the Gulf Islands.
52 Scale 1 cm = 1»28Km
53 44 Figure 2. Aerial photograph of island study areas: Samuel Island, Saturna Island, Reef Island, and King Islet.
54
55 46 Figure 3. Population density on mainland control and experimental grids, Peromxscus sanisulajtus,. Non-breeding season is shaded. Vertical dotted bars represent start and end of breeding activity. Solid vertical bars enclose defined breeding season. Histograms indicate number of new males (shaded) and females (unshaded) recruited into control population.

56 47 MAJJOND ODNTRDL 3UD May July Sept P- MnNIOJLATLB Nov Jan 1974 MAIN_JMVO May July Mar May 1975 R J L 5 E FOVCVAL Sept GRIO Nov P. MANITLLATLE Jan Mar May
57 48 Figure 4. Population density on Samuel Island control and experimental grids, Peromy,scus maniculatus,^ Non-breeding season is shaded. Vertical dotted bars represent start and end of breeding activity. Solid vertical bars enclose defined breeding season.. Histograms indicate number of new males (shaded) and females (unshaded) recruited into control population.
58
59 50 Figure 5., Population density on Saturna Island control and experimental grids, Peromxscus laniculatus,. Non-breeding season is shaded. Vertical dotted bars represent start and end of breeding activity. Solid vertical bars enclose defined breeding season. Histograms indicate number of new males (shaded) and females (unshaded) recruited into control population..

60 51 SATUF3NA JSLAtO Mar May July UNTFCL GRID P«MWiaJLATUS Sept Nov 1974 SATLRslA I5LAISD PULSE REMOVAL GRID Jan Mar 1975 P- MANIQJ-ATLB May
PROBABLE NON-BREEDERS AMONG FEMALE BLUE GROUSE
 Condor, 81:78-82 0 The Cooper Ornithological Society 1979 PROBABLE NON-BREEDERS AMONG FEMALE BLUE GROUSE SUSAN J. HANNON AND FRED C. ZWICKEL Parallel studies on increasing (Zwickel 1972) and decreasing
Factors Influencing Egg Production
 June, 1930 Research Bulletin No. 129 Factors Influencing Egg Production II. The Influence of the Date of First Egg Upon Maturity and Production By C. W. KNOX AGRICULTURAL EXPERIMENT STATION IOWA STATE
University of Canberra. This thesis is available in print format from the University of Canberra Library.
 University of Canberra This thesis is available in print format from the University of Canberra Library. If you are the author of this thesis and wish to have the whole thesis loaded here, please contact
Naturalised Goose 2000
 Naturalised Goose 2000 Title Naturalised Goose 2000 Description and Summary of Results The Canada Goose Branta canadensis was first introduced into Britain to the waterfowl collection of Charles II in
COLORADO LYNX DEN SITE HABITAT PROGRESS REPORT 2006
 COLORADO LYNX DEN SITE HABITAT PROGRESS REPORT 2006 by Grant Merrill Tanya Shenk U.S. Forest Service and Colorado Division of Wildlife Cooperative Effort September 30, 2006 INTRODUCTION Lynx (Lynx canadensis)
The effect of weaning weight on subsequent lamb growth rates
 Proceedings of the New Zealand Grassland Association 62: 75 79 (2000) 75 The effect of weaning weight on subsequent lamb growth rates T.J. FRASER and D.J. SAVILLE AgResearch, PO Box 60, Lincoln, Canterbury
Lynx Update May 25, 2009 INTRODUCTION
 Lynx Update May 25, 2009 INTRODUCTION In an effort to establish a viable population of Canada lynx (Lynx canadensis) in Colorado, the Colorado Division of Wildlife (CDOW) initiated a reintroduction effort
ESTIMATING NEST SUCCESS: WHEN MAYFIELD WINS DOUGLAS H. JOHNSON AND TERRY L. SHAFFER
 ESTIMATING NEST SUCCESS: WHEN MAYFIELD WINS DOUGLAS H. JOHNSON AND TERRY L. SHAFFER U.S. Fish and Wildlife Service, Northern Prairie Wildlife Research Center, Jamestown, North Dakota 58402 USA ABSTRACT.--The
Lizard Surveying and Monitoring in Biodiversity Sanctuaries
 Lizard Surveying and Monitoring in Biodiversity Sanctuaries Trent Bell (EcoGecko Consultants) Alison Pickett (DOC North Island Skink Recovery Group) First things first I am profoundly deaf I have a Deaf
GREATER SAGE-GROUSE BROOD-REARING HABITAT MANIPULATION IN MOUNTAIN BIG SAGEBRUSH, USE OF TREATMENTS, AND REPRODUCTIVE ECOLOGY ON PARKER MOUNTAIN, UTAH
 GREATER SAGE-GROUSE BROOD-REARING HABITAT MANIPULATION IN MOUNTAIN BIG SAGEBRUSH, USE OF TREATMENTS, AND REPRODUCTIVE ECOLOGY ON PARKER MOUNTAIN, UTAH Abstract We used an experimental design to treat greater
Original Draft: 11/4/97 Revised Draft: 6/21/12
 Original Draft: 11/4/97 Revised Draft: 6/21/12 Dear Interested Person or Party: The following is a scientific opinion letter requested by Brooks Fahy, Executive Director of Predator Defense. This letter
Dominance/Suppression Competitive Relationships in Loblolly Pine (Pinus taeda L.) Plantations
 Plantations") Dominance/Suppression Competitive Relationships in Loblolly Pine (Pinus taeda L.) Plantations by Michael E. Dyer Dissertation submitted to the Faculty of the Virginia Polytechnic Institute and Stand University
Dominance/Suppression Competitive Relationships in Loblolly Pine (Pinus taeda L.) Plantations by Michael E. Dyer Dissertation submitted to the Faculty of the Virginia Polytechnic Institute and Stand University
I the BUSSEY INSTITUTION of HARVARD UNIVERSITY, it was found that
 THE RELATION OF ALBINISM TO BODY SIZE IN MICE W. E. CASTLE Division of Genetics, University of Calijornia, Berkeley, California Received January 24, 1938 N PREVIOUS studies made in cooperation with former
Water Vole Translocation Project: Abberton ReservoirAbout Water Voles Population Dynamics
 Water Vole Translocation Project: Abberton ReservoirAbout Water Voles Measuring up to 24cm, water voles (Arvicola amphibius) are the largest of the British voles and at a quick glace, are often mistaken
ABSTRACT. Ashmore Reef
 ABSTRACT The life cycle of sea turtles is complex and is not yet fully understood. For most species, it involves at least three habitats: the pelagic, the demersal foraging and the nesting habitats. This
Motuora island reptile monitoring report for common & Pacific gecko 2016
 Motuora island reptile monitoring report for common & Pacific gecko 6 Prepared by Su Sinclair August 7 Work on this monitoring project was carried out under a Wildlife Act Authority issued by the Department
California Bighorn Sheep Population Inventory Management Units 3-17, 3-31 and March 20 & 27, 2006
 California Bighorn Sheep Population Inventory Management Units 3-17, 3-31 and 3-32 March 20 & 27, 2006 Prepared for: Environmental Stewardship Division Fish and Wildlife Science and Allocation Section
NATAL DISPERSAL OF SNOWSHOE HARES DURING A CYCLIC POPULATION INCREASE
 NATAL DISPERSAL OF SNOWSHOE HARES DURING A CYCLIC POPULATION INCREASE ELIZABETH A. GILLIS AND CHARLES J. KREBS Department of Zoology, University of British Columbia, 6270 University Boulevard, Vancouver,
Snowshoe Hare and Canada Lynx Populations
 Snowshoe Hare and Canada Lynx Populations Ashley Knoblock Dr. Grossnickle Bio 171 Animal Biology Lab 2 December 1, 2014 Ashley Knoblock Dr. Grossnickle Bio 171 Lab 2 Snowshoe Hare and Canada Lynx Populations
Ecological Studies of Wolves on Isle Royale
 Ecological Studies of Wolves on Isle Royale 2017-2018 I can explain how and why communities of living organisms change over time. Summary Between January 2017 and January 2018, the wolf population continued
September Population analysis of the Neapolitan Mastiff breed
 Population analysis of the Neapolitan Mastiff breed Genetic analysis of the Kennel Club pedigree records of the UK Neapolitan Mastiff population has been carried out with the aim of estimating the rate
September Population analysis of the Glen of Imaal Terrier breed
 Population analysis of the Glen of Imaal Terrier breed Genetic analysis of the Kennel Club pedigree records of the UK Glen of Imaal Terrier population has been carried out with the aim of estimating the
INFO SHEET. Cull Eggs: What To Expect And How To Reduce The Incidence.
 INFO SHEET Cull Eggs: What To Expect And How To Reduce The Incidence info.hybrid@hendrix-genetics.com www.hybridturkeys.com Introduction Over the years, several Hybrid customers have inquired about the
Short Report Key-site monitoring on Hornøya in Rob Barrett & Kjell Einar Erikstad
 Short Report 3-2011 Key-site monitoring on Hornøya in 2010 Rob Barrett & Kjell Einar Erikstad SEAPOP 2011 Key-site monitoring on Hornøya in 2010 Apart from the weather which was unusually wet, the 2010
Relationship Between Eye Color and Success in Anatomy. Sam Holladay IB Math Studies Mr. Saputo 4/3/15
 Relationship Between Eye Color and Success in Anatomy Sam Holladay IB Math Studies Mr. Saputo 4/3/15 Table of Contents Section A: Introduction.. 2 Section B: Information/Measurement... 3 Section C: Mathematical
Female Persistency Post-Peak - Managing Fertility and Production
 Female Persistency Post-Peak - Managing Fertility and Production Michael Longley, Global Technical Transfer Manager May 2013 SUMMARY Introduction Chick numbers are most often reduced during the period
Wild Turkey Annual Report September 2017
 Wild Turkey 2016-2017 Annual Report September 2017 Wild turkeys are an important game bird in Maryland, providing recreation and enjoyment for many hunters, wildlife enthusiasts and citizens. Turkey hunting
In the News. Feral Hogs (Sus scrofa) in Texas. From the Field. What is in a name? 11/15/2013
 in Texas. From the Field. What is in a name? 11/15/2013") Feral Hogs (Sus scrofa) in Texas In the News Mark Tyson, M.S. Extension Associate Texas A&M AgriLife Extension From the Field What is in a name? Wild Boar Wild Hog Wild Pig Feral Pig Feral Hog Razorback
Feral Hogs (Sus scrofa) in Texas In the News Mark Tyson, M.S. Extension Associate Texas A&M AgriLife Extension From the Field What is in a name? Wild Boar Wild Hog Wild Pig Feral Pig Feral Hog Razorback
A brief report on the 2016/17 monitoring of marine turtles on the São Sebastião peninsula, Mozambique
 A brief report on the 2016/17 monitoring of marine turtles on the São Sebastião peninsula, Mozambique 23 June 2017 Executive summary The Sanctuary successfully concluded its 8 th year of marine turtle
Y Use of adaptive management to mitigate risk of predation for woodland caribou in north-central British Columbia
 Y093065 - Use of adaptive management to mitigate risk of predation for woodland caribou in north-central British Columbia Purpose and Management Implications Our goal was to implement a 3-year, adaptive
September Population analysis of the Australian Shepherd breed
 Population analysis of the Australian Shepherd breed Genetic analysis of the Kennel Club pedigree records of the UK Australian Shepherd population has been carried out with the aim of estimating the rate
September Population analysis of the Anatolian Shepherd Dog breed
 Population analysis of the Anatolian Shepherd Dog breed Genetic analysis of the Kennel Club pedigree records of the UK Anatolian Shepherd Dog population has been carried out with the aim of estimating
Density, growth, and home range of the lizard Uta stansburiana stejnegeri in southern Dona Ana County, New Mexico
 Great Basin Naturalist Volume 33 Number 2 Article 8 6-30-1973 Density, growth, and home range of the lizard Uta stansburiana stejnegeri in southern Dona Ana County, New Mexico Richard D. Worthington University
Physical Description Meadow voles are small rodents with legs and tails, bodies, and ears.
 A Guide to Meadow Voles Identification, Biology and Control Methods Identification There are 5 species of Meadow Vole common to California. They are the California Vole, Long-tailed Vole, Creeping Vole,
September Population analysis of the Boxer breed
 Population analysis of the Boxer breed Genetic analysis of the Kennel Club pedigree records of the UK Boxer population has been carried out with the aim of estimating the rate of loss of genetic diversity
September Population analysis of the Maltese breed
 Population analysis of the Maltese breed Genetic analysis of the Kennel Club pedigree records of the UK Maltese population has been carried out with the aim of estimating the rate of loss of genetic diversity
Female Persistency Post-Peak - Managing Fertility and Production
 May 2013 Female Persistency Post-Peak - Managing Fertility and Production Michael Longley, Global Technical Transfer Manager Summary Introduction Chick numbers are most often reduced during the period
Ames, IA Ames, IA (515)
") BENEFITS OF A CONSERVATION BUFFER-BASED CONSERVATION MANAGEMENT SYSTEM FOR NORTHERN BOBWHITE AND GRASSLAND SONGBIRDS IN AN INTENSIVE PRODUCTION AGRICULTURAL LANDSCAPE IN THE LOWER MISSISSIPPI ALLUVIAL
BENEFITS OF A CONSERVATION BUFFER-BASED CONSERVATION MANAGEMENT SYSTEM FOR NORTHERN BOBWHITE AND GRASSLAND SONGBIRDS IN AN INTENSIVE PRODUCTION AGRICULTURAL LANDSCAPE IN THE LOWER MISSISSIPPI ALLUVIAL
September Population analysis of the Poodle (Standard) breed
 breed") Population analysis of the Poodle (Standard) breed Genetic analysis of the Kennel Club pedigree records of the UK Poodle (Standard) population has been carried out with the aim of estimating the rate of
Population analysis of the Poodle (Standard) breed Genetic analysis of the Kennel Club pedigree records of the UK Poodle (Standard) population has been carried out with the aim of estimating the rate of
WisGraph 8.0 Interpretive Manual
 WISGRAPH 8. WISGRAPH 8. WisGraph 8. Interpretive Manual Ken Nordlund, DVM, Nigel Cook, MRCVS, and Tom Bennett, BS UW School of Veterinary Medicine Introduction to the Graphs The graphs are generated from
September Population analysis of the Cavalier King Charles Spaniel breed
 Population analysis of the Cavalier King Charles Spaniel breed Genetic analysis of the Kennel Club pedigree records of the UK Cavalier King Charles Spaniel population has been carried out with the aim
September Population analysis of the Dalmatian breed
 Population analysis of the Dalmatian breed Genetic analysis of the Kennel Club pedigree records of the UK Dalmatian population has been carried out with the aim of estimating the rate of loss of genetic
GUIDELINES ON CHOOSING THE CORRECT ERADICATION TECHNIQUE
 GUIDELINES ON CHOOSING THE CORRECT ERADICATION TECHNIQUE PURPOSE... 2 1. RODENTS... 2 1.1 METHOD PROS AND CONS... 3 1.1. COMPARISON BETWEEN BROUDIFACOUM AND DIPHACINONE... 4 1.2. DISCUSSION ON OTHER POSSIBLE
TEMPORAL AND SPATIAL DISTRIBUTION OF THE BLACK-LEGGED TICK, IXODES SCAPULARIS, IN TEXAS AND ITS ASSOCIATION WITH CLIMATE VARIATION
 TEMPORAL AND SPATIAL DISTRIBUTION OF THE BLACK-LEGGED TICK, IXODES SCAPULARIS, IN TEXAS AND ITS ASSOCIATION WITH CLIMATE VARIATION An Undergraduate Research Scholars Thesis By JOSHUA SANTELISES Submitted
September Population analysis of the Borzoi breed
 Population analysis of the Borzoi breed Genetic analysis of the Kennel Club pedigree records of the UK Borzoi population has been carried out with the aim of estimating the rate of loss of genetic diversity
University of Wyoming National Park Service Research Center Annual Report
 University of Wyoming National Park Service Research Center Annual Report Volume 20 20th Annual Report, 1996 Article 10 1-1-1996 Metapopulations of Montane and Long-Tailed Voles (Microtus montanus and
STANDARD OPERATING PROCEDURE COL- 01
 COL- 01 STANDARD OPERATING PROCEDURE COLONY MANAGEMENT - MICE Version #1 Author: Kerri Nielsen Effective: 28 Jan 2015 1. PURPOSE To define standards and responsibilities for mouse housing and mouse breeding
Sheikh Muhammad Abdur Rashid Population ecology and management of Water Monitors, Varanus salvator (Laurenti 1768) at Sungei Buloh Wetland Reserve,
 at Sungei Buloh Wetland Reserve,") Author Title Institute Sheikh Muhammad Abdur Rashid Population ecology and management of Water Monitors, Varanus salvator (Laurenti 1768) at Sungei Buloh Wetland Reserve, Singapore Thesis (Ph.D.) National
Author Title Institute Sheikh Muhammad Abdur Rashid Population ecology and management of Water Monitors, Varanus salvator (Laurenti 1768) at Sungei Buloh Wetland Reserve, Singapore Thesis (Ph.D.) National
Response to SERO sea turtle density analysis from 2007 aerial surveys of the eastern Gulf of Mexico: June 9, 2009
 Response to SERO sea turtle density analysis from 27 aerial surveys of the eastern Gulf of Mexico: June 9, 29 Lance P. Garrison Protected Species and Biodiversity Division Southeast Fisheries Science Center
Mastitis in ewes: towards development of a prevention and treatment plan
 SCHOOL OF LIFE SCIENCES, UNIVERSITY OF WARWICK Mastitis in ewes: towards development of a prevention and treatment plan Final Report Selene Huntley and Laura Green 1 Background to Project Mastitis is inflammation
A Population Analysis of the Common Wall Lizard Podarcis muralis in Southwestern France
 - 513 - Studies in Herpetology, Rocek Z. (ed.) pp. 513-518 Prague 1986 A Population Analysis of the Common Wall Lizard Podarcis muralis in Southwestern France R. BARBAULT and Y. P. MOU Laboratoire d'ecologie
EFFECT OF LENGTH OF STORAGE OF MIXED FEED ON THE GROWTH RATE OF CHICKS
 EFFECT OF LENGTH OF STORAGE OF MIXED FEED ON THE GROWTH RATE OF CHICKS T. Tanaka M. M. Rosenberg - HAWAII AGRICULTURAL EXPERIMENT STATION March 1956 Circular 50 CONTENTS Introduction Materials and Methods
Mexican Gray Wolf Reintroduction
 Mexican Gray Wolf Reintroduction New Mexico Supercomputing Challenge Final Report April 2, 2014 Team Number 24 Centennial High School Team Members: Andrew Phillips Teacher: Ms. Hagaman Project Mentor:
ON COMMERCIAL poultry farms during
 Effect of Date of Hatch on Weight F. P. JEFFREY Department of Poultry Husbandry, Rutgers University, New Brunswick, New Jersey (Presented at annual meeting June, 1940; received for publication May 23,
Population Dynamics: Predator/Prey Teacher Version
 Population Dynamics: Predator/Prey Teacher Version In this lab students will simulate the population dynamics in the lives of bunnies and wolves. They will discover how both predator and prey interact
enable groups to track the occurrence of wasting disease on a local and coast wide scale.
 Value of Citizen Science Monitoring Involving citizen scientists in the sea star wasting disease survey effort has greatly expanded our spatial and temporal coverage. Citizen science groups can collect
FOOTEDNESS IN DOMESTIC PIGEONS
 FOOTEDNESS IN DOMESTIC PIGEONS I BY HARVEY I. FISHER N studies of the landing forces of Domestic Pigeons (Columba Zivia) it was noted (Fisher, 1956a, 19566) that the birds did not always land si- multaneously
September Population analysis of the Akita breed
 Population analysis of the Akita breed Genetic analysis of the Kennel Club pedigree records of the UK Akita population has been carried out with the aim of estimating the rate of loss of genetic diversity
Population dynamics of small game. Pekka Helle Natural Resources Institute Finland Luke Oulu
 Population dynamics of small game Pekka Helle Natural Resources Institute Finland Luke Oulu Populations tend to vary in size temporally, some species show more variation than others Depends on degree of
ILLINO PRODUCTION NOTE. University of Illinois at Urbana-Champaign Library Large-scale Digitization Project, 2007.
 ILLINO S UNIVERSITY OF ILLINOIS AT URBANA-CHAMPAIGN PRODUCTION NOTE University of Illinois at Urbana-Champaign Library Large-scale Digitization Project, 2007. ILLINOIS NATURAL HISTORY SURVEY CENTER FOR
THE WOLF WATCHERS. Endangered gray wolves return to the American West
 CHAPTER 7 POPULATION ECOLOGY THE WOLF WATCHERS Endangered gray wolves return to the American West THE WOLF WATCHERS Endangered gray wolves return to the American West Main concept Population size and makeup
Bobcat. Lynx Rufus. Other common names. Introduction. Physical Description and Anatomy. None
 Bobcat Lynx Rufus Other common names None Introduction Bobcats are the most common wildcat in North America. Their name comes from the stubby tail, which looks as though it has been bobbed. They are about
September Population analysis of the Rhodesian Ridgeback breed
 Population analysis of the Rhodesian Ridgeback breed Genetic analysis of the Kennel Club pedigree records of the UK Rhodesian Ridgeback population has been carried out with the aim of estimating the rate
September Population analysis of the Norwegian Buhund breed
 Population analysis of the Norwegian Buhund breed Genetic analysis of the Kennel Club pedigree records of the UK Norwegian Buhund population has been carried out with the aim of estimating the rate of
Pre-lab homework Lab 8: Food chains in the wild.
 Pre-lab homework Lab 8: Food chains in the wild. Lab Section: Name: Put your field hat on and complete the questions below before coming to lab! The bits of information you and your classmates collect
INHERITANCE OF BODY WEIGHT IN DOMESTIC FOWL. Single Comb White Leghorn breeds of fowl and in their hybrids.
 440 GENETICS: N. F. WATERS PROC. N. A. S. and genetical behavior of this form is not incompatible with the segmental interchange theory of circle formation in Oenothera. Summary.-It is impossible for the
September Population analysis of the Fox Terrier (Wire) breed
 breed") Population analysis of the Fox Terrier (Wire) breed Genetic analysis of the Kennel Club pedigree records of the UK Fox Terrier (Wire) population has been carried out with the aim of estimating the rate
Population analysis of the Fox Terrier (Wire) breed Genetic analysis of the Kennel Club pedigree records of the UK Fox Terrier (Wire) population has been carried out with the aim of estimating the rate
Pre-lab Homework Lab 9: Food Webs in the Wild
 Lab Section: Name: Pre-lab Homework Put your field hat on and complete the questions below before coming to lab! As always, it is expected that you have supplemented your understanding by reading about
Summary of 2017 Field Season
 Summary of 2017 Field Season Figure 1. The 2017 crew: L to R, Mark Baran, Collette Lauzau, Mark Dodds A stable and abundant food source throughout the chick provisioning period allowed for a successful
Having Puppies. Pregnancy Pregnancy normally lasts 9 weeks (63 days) but puppies may be delivered between 58 and 68 days.
 but puppies may be delivered between 58 and 68 days.") 24- hour Emergency Service 01635 47170 Having Puppies Although a bitch is capable of having puppies at their first season (which will on average occur at about 9 months of age but may vary from 5 to 18
24- hour Emergency Service 01635 47170 Having Puppies Although a bitch is capable of having puppies at their first season (which will on average occur at about 9 months of age but may vary from 5 to 18
September Population analysis of the Mastiff breed
 Population analysis of the Mastiff breed Genetic analysis of the Kennel Club pedigree records of the UK Mastiff population has been carried out with the aim of estimating the rate of loss of genetic diversity
EVALUATION OF A METHOD FOR ESTIMATING THE LAYING RATE OF BROWN-HEADED COWBIRDS
 EVALUATION OF A METHOD FOR ESTIMATING THE LAYING RATE OF BROWN-HEADED COWBIRDS D. M. SCOTT AND C. DAVISON ANKNEY Department of Zoology, University of Western Ontario, London, Ontario, Canada N6A 5B7 AnSTI
September Population analysis of the Soft-Coated Wheaten Terrier breed
 Population analysis of the Soft-Coated Wheaten Terrier breed Genetic analysis of the Kennel Club pedigree records of the UK Soft-Coated Wheaten Terrier population has been carried out with the aim of estimating
Old Dominion University Tick Research Update Chelsea Wright Department of Biological Sciences Old Dominion University
 Old Dominion University Tick Research Update 2014 Chelsea Wright Department of Biological Sciences Old Dominion University Study Objectives Long-term study of tick population ecology in Hampton Roads area
STUDIES TO EVALUATE THE SAFETY OF RESIDUES OF VETERINARY DRUGS IN HUMAN FOOD: REPRODUCTION TESTING
 VICH GL22 (SAFETY: REPRODUCTION) Revision 1 May 2004 For implementation at Step 7 STUDIES TO EVALUATE THE SAFETY OF RESIDUES OF VETERINARY DRUGS IN HUMAN FOOD: REPRODUCTION TESTING Recommended for Implementation
WisGraph 7.0 Interpretive Manual
 WisGraph 7. Interpretive Manual Ken Nordlund, DVM and Tom Bennett UW School of Veterinary Medicine Introduction to the Graphs The graphs are generated from herd DHI data from Wisconsin AgSource and downloaded
September Population analysis of the Spaniel (English Springer) breed
 breed") Population analysis of the Spaniel (English Springer) breed Genetic analysis of the Kennel Club pedigree records of the UK Spaniel (English Springer) population has been carried out with the aim of estimating
Population analysis of the Spaniel (English Springer) breed Genetic analysis of the Kennel Club pedigree records of the UK Spaniel (English Springer) population has been carried out with the aim of estimating
EFFECTS OF POSTNATAL LITTER SIZE ON REPRODUCTION OF FEMALE MICE 1
 EFFECTS OF POSTNATAL LITTER SIE ON REPRODUCTION OF FEMALE MICE 1 R. E. Nelson 2 and O. W. Robison North Carolina State University, Raleigh 2767 SUMMARY A group of 8 dams weaned 588 female mice to be mated
September Population analysis of the Old English Sheepdog breed
 Population analysis of the Old English Sheepdog breed Genetic analysis of the Kennel Club pedigree records of the UK Old English Sheepdog population has been carried out with the aim of estimating the
Some Foods Used by Coyotes and Bobcats in Cimarron County, Oklahoma 1954 Through
 .180 PROOf OF THE QKLA. ACAD. OF SCI. FOR 1957 Some Foods Used by Coyotes and Bobcats in Cimarron County, Oklahoma 1954 Through 1956 1 RALPH J. ELLIS and SANFORD D. SCBEMNITZ, Oklahoma Cooperative Wildlife
(Anisoptera: Libellulidae)
") Odonatologica 5(1): 2733 March I. 1976 The effect of foodon the larval development of Palpopleuralucia lucia (Drury) (Anisoptera: Libellulidae) A.T. Hassan Departmentof Zoology, University of Ibadan, Ibadan,
Odonatologica 5(1): 2733 March I. 1976 The effect of foodon the larval development of Palpopleuralucia lucia (Drury) (Anisoptera: Libellulidae) A.T. Hassan Departmentof Zoology, University of Ibadan, Ibadan,
Variation in Piglet Weights: Development of Within-Litter Variation Over a 5-Week Lactation and Effect of Farrowing Crate Design
 The Humane Society Institute for Science and Policy Animal Studies Repository 6-1986 Variation in Piglet Weights: Development of Within-Litter Variation Over a 5-Week Lactation and Effect of Farrowing
May Dear Blunt-nosed Leopard Lizard Surveyor,
 May 2004 Dear Blunt-nosed Leopard Lizard Surveyor, Attached is the revised survey methodology for the blunt-nosed leopard lizard (Gambelia sila). The protocol was developed by the San Joaquin Valley Southern
Short Report Key-site monitoring on Hornøya in Rob Barrett & Kjell Einar Erikstad
 Short Report 2-2010 Key-site monitoring on Hornøya in 2009 Rob Barrett & Kjell Einar Erikstad SEAPOP 2010 Key-site monitoring on Hornøya in 2009 The 2009 breeding season was in general good for most species
PROGRESS REPORT for COOPERATIVE BOBCAT RESEARCH PROJECT. Period Covered: 1 April 30 June Prepared by
 PROGRESS REPORT for COOPERATIVE BOBCAT RESEARCH PROJECT Period Covered: 1 April 30 June 2014 Prepared by John A. Litvaitis, Tyler Mahard, Rory Carroll, and Marian K. Litvaitis Department of Natural Resources
Memorandum. To: Tim Walsh Date: April 16, From: Michael D. Loberg cc: MVCHI Review Team
 Memorandum To: Tim Walsh Date: April 16, 2015 From: Michael D. Loberg cc: MVCHI Review Team Matthew Poole Subject: Tick-Borne Illness Grant: 2013 Year-End Progress Report & 2014 Objectives and Budget TBI
Population Structure Analysis of Western Painted Turtles
 University of Nebraska - Lincoln DigitalCommons@University of Nebraska - Lincoln Environmental Studies Undergraduate Student Theses Environmental Studies Program Spring 2017 Population Structure Analysis
Structured PVA Historical essay: for example history of protection of Everglades
 Final Essay: possible topics Structured PVA Historical essay: for example history of protection of Everglades Concern: Run-off of oil-products from streets/roads Management plan: how to manage the Wakulla
Ovulation Synchrony as an Adaptive Response to Egg Cannibalism in a Seabird Colony
 Andrews University Digital Commons @ Andrews University Honors Theses Undergraduate Research 2015 Ovulation Synchrony as an Adaptive Response to Egg Cannibalism in a Seabird Colony Sumiko Weir This research
Identification of Pacific water shrew. Photo credit: C. Schmidt
 Identification of Pacific water shrew Photo credit: C. Schmidt Prepared for: South Coast Conservation Program Species at Risk Training for Professionals Workshop 2: Pacific water shrew habitat management
Supplementary Fig. 1: Comparison of chase parameters for focal pack (a-f, n=1119) and for 4 dogs from 3 other packs (g-m, n=107).
 and for 4 dogs from 3 other packs (g-m, n=107).") Supplementary Fig. 1: Comparison of chase parameters for focal pack (a-f, n=1119) and for 4 dogs from 3 other packs (g-m, n=107). (a,g) Maximum stride speed, (b,h) maximum tangential acceleration, (c,i)
Supplementary Fig. 1: Comparison of chase parameters for focal pack (a-f, n=1119) and for 4 dogs from 3 other packs (g-m, n=107). (a,g) Maximum stride speed, (b,h) maximum tangential acceleration, (c,i)
Southern Shrimp Alliance, Inc P.O. Box 1577 Tarpon Springs, FL Ph Fx
 P.O. Box 1577 Tarpon Springs, FL 34688 Ph. 727.934.5090 Fx. 727.934.5362 john@shrimpalliance.com Karyl Brewster-Geisz HMS Management Division F/SF1 National Marine Fisheries Service 1315 East West Highway
September Population analysis of the Basset Griffon Vendeen (Grand) breed
 breed") Population analysis of the Basset Griffon Vendeen (Grand) breed Genetic analysis of the Kennel Club pedigree records of the UK Basset Griffon Vendeen (Grand) population has been carried out with the aim
Population analysis of the Basset Griffon Vendeen (Grand) breed Genetic analysis of the Kennel Club pedigree records of the UK Basset Griffon Vendeen (Grand) population has been carried out with the aim
Selecting Foundation and Replacement Goats
 Selecting Foundation and Replacement Goats G. L. M. Chappell Terry K. Hutchens Department of Animal Sciences College of Agriculture University of Kentucky The selection of goats to begin a flock or add
Mexican Gray Wolf Endangered Population Modeling in the Blue Range Wolf Recovery Area
 Mexican Gray Wolf Endangered Population Modeling in the Blue Range Wolf Recovery Area New Mexico Super Computing Challenge Final Report April 3, 2012 Team 61 Little Earth School Team Members: Busayo Bird
Effects of prey availability and climate across a decade for a desert-dwelling, ectothermic mesopredator. R. Anderson Western Washington University
 Effects of prey availability and climate across a decade for a desert-dwelling, ectothermic mesopredator R. Anderson Western Washington University Trophic interactions in desert systems are presumed to
APPENDIX F. General Survey Methods for Covered Species
 APPENDIX F General Survey Methods for Covered Species APPENDIX F General Survey Methods for Covered Species As described in Chapter 4, the Imperial Irrigation District (IID) will conduct baseline surveys
A Case Study of the Effectiveness of TNR on a Feral Cat Colony
 Compiled and Written By: Triple R Pets PO Box 86, Western Springs, IL 60558 708.738.1438 phone 630.214.3603 fax www.triplerpets.org QUESTION Does a TNR trap/neuter/return program stabilize or reduce the
A Comparison of morphological differences between Gymnophthalmus spp. in Dominica, West Indies
 209 A Comparison of morphological differences between Gymnophthalmus spp. in Dominica, West Indies Marie Perez June 2015 Texas A&M University Dr. Thomas Lacher and Dr. Jim Woolley Department of Wildlife
STAT170 Exam Preparation Workshop Semester
 Study Information STAT Exam Preparation Workshop Semester Our sample is a randomly selected group of American adults. They were measured on a number of physical characteristics (some measurements were