(12) INTERNATIONAL APPLICATION PUBLISHED UNDER THE PATENT COOPERATION TREATY (PCT)
|
|
|
- Trevor Manning
- 5 years ago
- Views:
Transcription
1 (12) INTERNATIONAL APPLICATION PUBLISHED UNDER THE PATENT COOPERATION TREATY (PCT) (19) World Intellectual Property Organization International Bureau (10) International Publication Number (43) International Publication Date WO 2012/ Al 22 November 2012 ( ) P O P C T (51) International Patent Classification: (81) Designated States (unless otherwise indicated, for every C12N 15/06 ( ) C12Q 1/68 ( ) kind of national protection available): AE, AG, AL, AM, AO, AT, AU, AZ, BA, BB, BG, BH, BR, BW, BY, BZ, (21) International Application Number: PCT/US2012/ CA, CH, CL, CN, CO, CR, CU, CZ, DE, DK, DM, DO, DZ, EC, EE, EG, ES, FI, GB, GD, GE, GH, GM, GT, HN, (22) International Filing Date: HR, HU, ID, IL, IN, IS, JP, KE, KG, KM, KN, KP, KR, 16 May 2012 ( ) KZ, LA, LC, LK, LR, LS, LT, LU, LY, MA, MD, ME, MG, MK, MN, MW, MX, MY, MZ, NA, NG, NI, NO, NZ, (25) Filing Language: English OM, PE, PG, PH, PL, PT, QA, RO, RS, RU, RW, SC, SD, (26) Publication Language: English SE, SG, SK, SL, SM, ST, SV, SY, TH, TJ, TM, TN, TR, TT, TZ, UA, UG, US, UZ, VC, VN, ZA, ZM, ZW. (30) Priority Data: 61/487, May ( ) US (84) Designated States (unless otherwise indicated, for every kind of regional protection available): ARIPO (BW, GH, (71) Applicant (for all designated States except US): THE RE GM, KE, LR, LS, MW, MZ, NA, RW, SD, SL, SZ, TZ, GENTS OF THE UNIVERSITY OF CALIFORNIA UG, ZM, ZW), Eurasian (AM, AZ, BY, KG, KZ, RU, TJ, [US/US]; 1111 Franklin Street, 12th Floor, Oakland, Cali TM), European (AL, AT, BE, BG, CH, CY, CZ, DE, DK, fornia (US). EE, ES, FI, FR, GB, GR, HR, HU, IE, IS, IT, LT, LU, LV, MC, MK, MT, NL, NO, PL, PT, RO, RS, SE, SI, SK, SM, (72) Inventors; and TR), OAPI (BF, BJ, CF, CG, CI, CM, GA, GN, GQ, GW, (75) Inventors/ Applicants (for US only): LYONS, Leslie A. ML, MR, NE, SN, TD, TG). [US/US]; 1355 Tyler Drive, Woodland, California (US). KURUSHIMA, Jennifer D. [US/US]; 4735 Cowell Declarations under Rule 4.17 : Boulevard, Apt. 74, Davis, California (US). as to applicant's entitlement to apply for and be granted a patent (Rule 4.1 7(H)) FROENICKE, Lutz [DE/US]; 520 Alvarado Avenue, Apt. 204, Davis, California (US). LIPINSKI, Monika J. [US/US]; 2301 Summer Creek Drive, Apt. #7, Published: Santa Rosa, California (US). GANDOLFI, Bar bara [IT/US]; 2985 Layton Drive, Davis, California with international search report (Art. 21(3)) (US). (74) Agents: WAHLSTEN, Jennifer L. et al; Weaver Austin Villeneuve & Sampson LLP, P.O. Box 70250, Oakland, California (US).
2 GENETIC IDENTIFICATION OF DOMESTIC CAT BREEDS AND POPULATIONS CROSS-REFERENCE TO RELATED APPLICATIONS [0001] This application claims the benefit under 35 U.S. C. 119(e) of U.S. Provisional Application No. 61/487,987, filed on May 19, 201 1, which is hereby incorporated herein in its entirety for all purposes. STATEMENT OF GOVERNMENTAL SUPPORT [0002] This invention was made with government support under Grant No. R24 RROO awarded by the National Institutes of Health, National Center for Research Resources (NCRR). The government has certain rights in the invention. FIELD OF THE INVENTION [0003] The invention relates to determining the contribution of one or more feline populations to the genome of a feline using a predetermined set of genetic markers, including single nucleotide polymorphisms (SNPs), short tandem repeats (STRs) and DNAbased phenotypic markers. BACKGROUND OF THE INVENTION [0004] The domestication of the cat has been a slow and prolonged process, especially when compared to most species associated with human agricultural development. Indeed, the cat is often considered to be only semi-domesticated. Archaeological remains of cats in close proximity to and even buried alongside humans suggest that cats were first domesticated in Cyprus during the Neolithic age 5,000-10,000 BP (Vigne et al, (2004) Science 304, ) but popular culture suggests cats were domesticated in Egypt (Malek, (1993) The cat in ancient Egypt British Museum Pr. for the Trustees of the British Museum, London; Nowell, (1996) Status Survey and Conservation Action Plan: Wild Cats IUCN, Gland, Switzerland.). Genetic studies using STR and mtdna analysis of feral and wildcats from throughout Africa and Eurasia identified the Near Eastern Arabian/Northern African wildcat subspecies (Felis silvestris libyca) as the species most closely related to the domestic cat (Driscoll et al., (2007) Science 317, ). Other early human civilizations developed near the Yellow River region of China and the Indus Valley of present day Pakistan. However, sufficient sampling or documentation of wildcats in these regions is
3 inadequate. Only the Fertile Crescent lies within the range of F. s. lybica, which has better documentation and sampling. In addition to the wildcat studies, an independent STR study of both feral and pedigreed cats found the highest genetic diversity of the sampled cats in the region of the eastern Mediterranean Sea, supporting a Fertile Crescent origin of cat domestication (Lipinski et al, (2008) Genomics 91, ). However, neither study sampled the cats of the Fertile Crescent and Egypt sufficiently to closely examine cat populations in this historically important region, which is necessary for pinpointing the site of cat domestication. [0005] Genetic markers that arise through a variety of mutational mechanisms help to resolve population stratifications and trace historical migrations (Zeder et al., (2006) Trends in Genetics 22: ). STRs and have long been the preferred tool for genetic analyses of recently diverged populations, such as cat breeds, due to their high mutation rate and relative cost effectiveness in comparison to sequencing techniques (Brown et al, (1979) Proc. Natl. Acad. Sci. USA 76: ). Analysis of different areas of the mtdna, particularly gene sequences provide evidence of the matrilineal history of the domesticated cat and of the closest common ancestor, the African wildcat from the Near East (Driscoll et al., 2007, supra). In addition, the mtdna control region (CR), with its fast rate of mutation, provides evidence of recent admixture of most of the worldwide cat populations (Grahn et al, Forensic Sci Int Genet. (201 1) 1:33-42). The advent of high-throughput SNP typing platforms allows the genotyping of many markers with slower mutation rates, rates which can help define a population's more ancient origins and provide finer-scale evidence for the first domesticated cat populations. Thus, genetic analysis of the same cat populations, using an assortment of DNA markers with a variety of mutation patterns, will better define cat population stratification but not obfuscate the more ancient lineages, further clarifying the domestication progression from ancient to modern cats. [0006] Data presented herein shows that the domestic cat origins lie within the Northern region of the Fertile Crescent, where the earliest agriculture and civilizations began. Random bred domestic cat populations from around the world, specifically the region of the Fertile Crescent and Egypt, were genetically investigated to improve the resolution of cat population structures within this important site of cat domestication. Two types of genetic markers, STRs and SNPs, were genotyped in the same cat populations, including several larger populations from the Fertile Crescent region.
4 [0007] The genetic markers further find application in determining the breed pedigree or population origins of a subject feline. Over the past 125 years, mankind has imposed artificial selection to further the previously unchecked process of cat domestication resulting in pedigreed cats. Since the first USA cat show in 1895, which presented five breeds, the development of pedigreed cats has increased in popularity (Gebhardt (1991) The Complete Cat Book. Howell Book House, New York.). Forty-one breeds are currently recognized for competition by the Cat Fanciers' Association (CFA, on the internet at cfa.org/) and 57 are accepted by The International Cat Association (TICA, on the internet at tica.org/). A majority of the breeds recognized by these two large registries is also recognized around the world. A common, sometimes obsessive hobby of cat breeders is feline genealogy, or tracing the true genetic ancestry of the breed and even of one's own random bred pet cat. Many commercial service laboratories are marketing genetic tests for dogs, promising the elucidation of "the breed ancestry of your best friend". Random bred house cats, however, have a different story to their genetic origins. Whereas the average feline mutt found in the streets of most developed countries is more likely a cross-bred individual from multiple purebred breeds, the average random bred cat is not a descendant of their pedigreed counterparts. For cats, the opposite scenario is more likely - pedigreed feline stocks are the descendants of common street cats from distinct parts of the world that have been selected for a distinctive trait (Table 8) (CFA (1993) The Cat Fanciers' Association Cat Encyclopedia, Simon & Schuster, New York). Random bred cats are the original populations from which the breeds developed, not a population of pedigreed cats gone feral. In addition, also converse to most dog registries, to improve population health and reduce the effects of inbreeding depression, cat breeding associations often seek to diversify their breed populations with random bred cats from their ancestral origin. For this reason, most cat registries use the term "pedigreed" and not "purebred". [0008] Two studies have evaluated the genetic distinction of cat breeds. Lipinski et al. ((2008) Genomics, 91:12-21) defined the connections between the random bred cat populations and their descendant pedigreed lines using a DNA marker panel containing two tetranucleotide and 36 dinucleotide STR markers. Five hundred fifty-five individuals were demarcated into 20 breeds. Four breeds could not be resolved at the breed level. Furthermore, the breeds sampled by Lipinski et al. were shown to be similar to the populations of street cats found in Europe, the Eastern Mediterranean and Southeast Asia. Menotti-Raymond et al. ((2008) Genomics, 91:1-1 1) used a panel of eleven tetranucleotide
5 STR markers and ten regions of SNPs in a subset of their sample set in order to characterize the delineation of cat breeds. Further attempts at population division caused lineages within breeds to resolve before that of the recognized sister breeds. Using only the STR markers, 1040 individuals were demarcated into 8 individual breeds and 9 additional breed groups. Twenty breeds could not be resolved at the breed level. These studies indicated that distinct populations and breeds of cats can be defined genetically, that breeds do have different worldwide regions of origin, tetranucleotide STRs do not perform as well with defining cat breeds as the dinucleotide markers, and that some breeds are so closely related that they cannot be distinguished with even the rapidly evolving dinucleotide STRs. [0009] The 38 highly polymorphic markers of Lipinski et al. (2008), supra, and a recently developed panel of 148 intergenic autosomal SNPs were recently applied to an extensive sample of random bred street cats collected throughout the world (described herein). Nine hundred forty-four samples were collected from 37 locations spread throughout North and South America, Europe, Africa, and Asia. This study found that while both were efficient at distinguishing five long established lineages, a few geographically close populations were better delineated with either SNPs or STRs, most likely due to varying mutation rates between the markers. [0010] Many methods of assignment testing have been developed in the past decade using common population genetic markers and a variety of statistical methods (Rannala & Mountain (1997) Proc Natl Acad Sci USA. 94(17): ; Pritchard et al. (2000) Genetics, 155: ; Baudouin & Lebrun (2001) In: Proc. Int. Symp. on Molecular Markers, pp ; Paetkau et al. (2004) Molecular Ecology, 13:55-65). These methods have been applied to various breeding populations including pigs, cattle, and dogs (Schelling et al. (2005) Journal of Animal Breeding and Genetics, 122:71-77; Negrini et al. (2009) Animal Genetics, 40:18-26; Boitard et al. (2010) Anim Genet (6): In cattle, Negrini et al. (2009), supra, used 90 SNPs to both allocate and then assign 24 breeds under both the Baysean methods of Pritchard et al. (2000), supra, and Rannala & Mountain (1997), supra, and Baudouin & Lebrun (2001), supra, and the likelihood method of Paetkau et al. (2004), supra. Negrini et al. (2009) concluded that the methods implemented through Rannala & Mountain (Bayesian) (1997) and Petkau et al. (frequentist) (2004) worked best when attempting to assign unknown individuals to a known database of representative samples from each breed. Previous population studies used Bayesian clustering and neighbor-joining phylogenetic analyses to elucidate the cat
6 breeds and the origins of random bred populations. The present invention demonstrates the utility of a panel of 148 evenly dispersed genome-wide SNPs for population assignment of cats. Different assignment techniques are examined and demonstrated in a species exhibiting many recent and extreme population bottlenecks, comparing the power and efficiency of this 148 SNP panel to 4-fold fewer microsatellites. The power of phenotypic DNA variants is demonstrated for sensitivity and specificity to support individual assignment, specifically for closely related cat breeds that are demarcated by single gene traits. SUMMARY OF THE INVENTION [0011] The present invention provides genetic markers useful for the determination of the the population of origin (e.g., ancestral lineage and/or contributing breed(s)) of a test feline. Accordingly, in one aspect, the invention provides computer implemented methods for determining the contributions of feline populations to a feline genome. In some embodiments, the methods comprise: (a) genotyping a sample comprising genomic DNA obtained from a test feline to determine the identity of one or both alleles of each marker of a set of markers, wherein the set of markers comprises a plurality of single nucleotide polymorphisms (SNPs) listed in Table 1; (b) comparing the identity of one or both alleles for each of the markers in the set of markers determined to be present in the test feline genome to a database comprising one or more feline population profiles, wherein each feline population profile comprises genotype information for the set of markers in the feline population; and (c) determining the contribution of the one or more feline populations to the test feline genome. [0012] In a further aspect, the invention provides methods for defining one or more feline populations. In some embodiments, the methods comprise: (a) determining the identity of one or both alleles for each marker of a set of markers in a test feline genome, wherein the set of markers comprises a plurality of single nucleotide polymorphisms (SNPs) listed in Table 1; and (b) applying a computer-implemented statistical model to define one or more distinct feline populations, wherein one or more distinct feline populations are characterized by a set of allele frequencies for each marker of the set of markers comprising a plurality of SNPs listed in Table 1.
7 [0013] In a related aspect, the invention provides methods for determining the contributions of feline populations to a feline genome. In some embodiments, the methods comprise performing a genotyping assay on a sample comprising genomic DNA obtained from a test feline to determine the identity of one or both alleles present in the test feline genome for each marker of a set of markers, wherein the set of markers is indicative of the contribution of feline populations to the genome of the test feline, wherein the set of markers comprises a plurality of single nucleotide polymorphisms (SNPs) listed in Table 1. [0014] In another aspect, the invention provides methods of assigning a feline individual to a population of origin (e.g., an ancestral lineage and/or one or more contributing breeds), which comprises: (a) genotyping the feline individual to identify one or both alleles of each marker of a set of markers to thereby identify the individual's genotype, wherein the set of markers comprises a plurality of single nucleotide polymorphisms (SNPs) listed in Table 1; (b) applying a computer-implemented statistical model to assign the feline individual to one or more feline populations in a database, wherein the one or more feline populations are characterized by a set of allele frequencies for each marker of the set of markers; and (c) assigning the feline individual to the one or more most likely populations identified in step (b). In some embodiments, the individual is assigned to the one or more most likely feline populations if the population genotype probability for the most likely feline populations exceeds the value of assignment to any other feline populations of the database. [0015] With respect to the embodiments, in some embodiments, the plurality of SNPs comprises at least about 5 SNPs listed in Table 1, for example, at least about 10, 15, 20, 25, 30, 40, 50, 60, 70, 75, 80, 90, 100, 110, 120, 125, 130, 140 or 148 SNPs listed in Table 1. The SNPs listed in Table 1 are as depicted at position 6 1 of a polynucleotide selected from the group consisting of SEQ ID NO:l to SEQ ID NO: 148 listed in Table 1. In some embodiments, the plurality of SNPs comprises all 148 SNPs listed in Table 1, e.g., as depicted at position 6 1 of polynucleotides SEQ ID NO:l to SEQ ID NO: 148 listed in Table 1. [0016] For example, the plurality of SNPs listed in Table 1 are as depicted at position 6 1 of a polynucleotide selected from the group consisting of SEQ ID NO:l to SEQ ID NO: 148. In some embodiments, the set of markers comprises a plurality of SNPs,
8 wherein the SNPs are selected from the group consisting of position 6 1 of SEQ ID NO:l, position 6 1 of SEQ ID NO:2, position 6 1 of SEQ ID NO:3, position 6 1 of SEQ ID NO:4, position 6 1 of SEQ ID NO:5, position 6 1 of SEQ ID NO:6, position 6 1 of SEQ ID NO:7, position 6 1 of SEQ ID NO:8, position 6 1 of SEQ ID NO:9, position 6 1 of SEQ ID NO:10, position 6 1 of SEQ ID NO: 11, position 6 1 of SEQ ID NO: 12, position 6 1 of SEQ ID NO: 13, position 6 1 of SEQ ID NO: 14, position 6 1 of SEQ ID NO: 15, position 6 1 of SEQ ID NO:16, position 6 1 of SEQ ID NO:17, position 6 1 of SEQ ID NO: 18, position 6 1 of SEQ ID NO: 19, position 6 1 of SEQ ID NO:20, position 6 1 of SEQ ID NO:21, position 6 1 of SEQ ID NO:22, position 6 1 of SEQ ID NO:23, position 6 1 of SEQ ID NO:24, position 6 1 of SEQ ID NO:25, position 6 1 of SEQ ID NO:26, position 6 1 of SEQ ID NO:27, position 6 1 of SEQ ID NO:28, position 6 1 of SEQ ID NO:29, position 6 1 of SEQ ID NO:30, position 6 1 of SEQ ID NO:31, position 6 1 of SEQ ID NO:32, position 6 1 of SEQ ID NO:33, position 6 1 of SEQ ID NO:34, position 6 1 of SEQ ID NO:35, position 6 1 of SEQ ID NO:36, position 6 1 of SEQ ID NO:37, position 6 1 of SEQ ID NO:38, position 6 1 of SEQ ID NO:39, position 6 1 of SEQ ID NO:40, position 6 1 of SEQ ID NO:41, position 6 1 of SEQ ID NO:42, position 6 1 of SEQ ID NO:43, position 6 1 of SEQ ID NO:44, position 6 1 of SEQ ID NO:45, position 6 1 of SEQ ID NO:46, position 6 1 of SEQ ID NO:47, position 6 1 of SEQ ID NO:48, position 6 1 of SEQ ID NO:49, position 6 1 of SEQ ID NO:50, position 6 1 of SEQ ID NO:51, position 6 1 of SEQ ID NO:52, position 6 1 of SEQ ID NO:53, position 6 1 of SEQ ID NO:54, position 6 1 of SEQ ID NO:55, position 6 1 of SEQ ID NO:56, position 6 1 of SEQ ID NO:57, position 6 1 of SEQ ID NO:58, position 6 1 of SEQ ID NO:59, position 6 1 of SEQ ID NO:60, position 6 1 of SEQ ID NO:61, position 6 1 of SEQ ID NO:62, position 6 1 of SEQ ID NO:63, position 6 1 of SEQ ID NO:64, position 6 1 of SEQ ID NO:65, position 6 1 of SEQ ID NO:66, position 6 1 of SEQ ID NO:67, position 6 1 of SEQ ID NO:68, position 6 1 of SEQ ID NO:69, position 6 1 of SEQ ID NO:70, position 6 1 of SEQ ID NO:71, position 6 1 of SEQ ID NO:72, position 6 1 of SEQ ID NO:73, position 6 1 of SEQ ID NO:74, position 6 1 of SEQ ID NO:75, position 6 1 of SEQ ID NO:76, position 6 1 of SEQ ID NO:77, position 6 1 of SEQ ID NO:78, position 6 1 of SEQ ID NO:79, position 6 1 of SEQ ID NO:80, position 6 1 of SEQ ID NO:81, position 6 1 of SEQ ID NO:82, position 6 1 of SEQ ID NO:83, position 6 1 of SEQ ID NO: 84, position 6 1 of SEQ ID NO: 85, position 6 1 of SEQ ID NO: 86, position 6 1 of SEQ ID NO:87, position 6 1 of SEQ ID NO:88, position 6 1 of SEQ ID NO:89, position 6 1 of SEQ ID NO:90, position 6 1 of SEQ ID NO:91, position 6 1 of SEQ ID NO:92, position 6 1 of SEQ ID NO:93, position 6 1 of SEQ ID NO:94, position 6 1 of SEQ ID NO:95,
9 position 6 1 of SEQ ID NO:96, position 6 1 of SEQ ID NO:97, position 6 1 of SEQ ID NO:98, position 6 1 of SEQ ID NO:99, position 6 1 of SEQ ID NO: 100, position 6 1 of SEQ ID NO: 101, position 6 1 of SEQ ID NO: 102, position 6 1 of SEQ ID NO: 103, position 6 1 of SEQ ID NO: 104, position 6 1 of SEQ ID NO: 105, position 6 1 of SEQ ID NO: 106, position 6 1 of SEQ ID NO: 107, position 6 1 of SEQ ID NO: 108, position 6 1 of SEQ ID NO: 109, position 6 1 of SEQ ID NO: 110, position 6 1 of SEQ ID NO: 111, position 6 1 of SEQ ID NO: 112, position 6 1 of SEQ ID NO: 113, position 6 1 of SEQ ID NO: 114, position 6 1 of SEQ ID NO: 115, position 6 1 of SEQ ID NO: 116, position 6 1 of SEQ ID NO: 117, position 61 of SEQ ID NO:118, position 61 of SEQ ID NO:119, position 61 of SEQ ID NO:120, position 6 1 of SEQ ID NO: 121, position 6 1 of SEQ ID NO: 122, position 6 1 of SEQ ID NO: 123, position 6 1 of SEQ ID NO: 124, position 6 1 of SEQ ID NO: 125, position 6 1 of SEQ ID NO: 126, position 6 1 of SEQ ID NO: 127, position 6 1 of SEQ ID NO: 128, position 61 of SEQ ID NO:129, position 61 of SEQ ID NO:130, position 61 of SEQ ID NO:131, position 6 1 of SEQ ID NO:132, position 6 1 of SEQ ID NO: 133, position 6 1 of SEQ ID NO: 134, position 6 1 of SEQ ID NO: 135, position 6 1 of SEQ ID NO: 136, position 6 1 of SEQ ID NO: 137, position 6 1 of SEQ ID NO: 138, position 6 1 of SEQ ID NO: 139, position 6 1 of SEQ ID NO: 140, position 6 1 of SEQ ID NO: 141, position 6 1 of SEQ ID NO: 142, position 6 1 of SEQ ID NO: 143, position 6 1 of SEQ ID NO: 144, position 6 1 of SEQ ID NO: 145, position 6 1 of SEQ ID NO: 146, position 6 1 of SEQ ID NO: 147, and position 6 1 of SEQ ID NO: 148. [0017] In some embodiments, the set of markers comprises a plurality of SNPs, wherein the SNPs are selected from the group consisting of chral_ , chral l , chral l , chral_ , chral_ , chral_ , chral_ , chral_ , chral_ , chral_ , chral_ , chral_ , chral_ , chral_ , chra2_ , chra2_ , chra2_ , chra2_ , chra2_554046, chra3_ , chra3_l , chra3_ , chra3_l , chra3_ , chra3_l , chra3_ , chra3_ , chra3_ , chra3_ , chrbl l , chrbl_ , chrbl_ , chrb , chrbl_ , chrbl_ , chrbl_ , chrbl_ , chrb2_ , chrb2_ , chrb2_ , chrb2_ , chrb2_ , chrb3_l , chrb3_l , chrb3_l , chrb3_ ,
10 chrb3_ , chrb3_ , chrb3_ , chrb4_l , chrb4_ , chrb4_ , chrb4_ , chrb4_ , chrb4_ , chrb4_ , chrb4_ , chrb4_ , chrb4_ , chrb4_255106, chrb4_ , chrb4_ , chrb4_ , chrcl_l , chrcl_ , chrcl_l , chrcl_ , chrcl_ , chrcl_ , chrcl_ , chrcl_ , chrcl_ , chrcl_396397, chrcl_ , chrcl_ , chrc2_ , chrc2_ , chrc2_l , chrc2_ , chrc2_187325, chrc2_262401, chrc2_ , chrdl_ , chrd , chrd , chrdl_ , chrdl l , chrd , chrdl_ , chrdl_ , chrdl_ , chrd 1_ , chrd 1_ , chrdl_ , chrdl_ , chrd , chrd2_l , chrd2_l , chrd2_l , chrd2_ , chrd2_717969, chrd2_ , chrd2_ , chrd3_ , chrd3_ , chrd3_ , chrd3_ , chrd3_ , chrd3_ , chrd4_ , chrd4_ , chrd4_ , chrel_ , chrel_ , chrel_ , chrel_ , chrel_ , chrel_ , chrel_ , chre2_ , chre2_ , chre2_ , chre2_ , chre2_ , chre2_ , chre2_ , chre2_ , chre2_ , chre3_ , chre3_ , chre3_ , chrfl_ , chrf , chrfl_ , chrfl_ , chrfl_ , chrfl_565223, chrfl_ , chrfl_ , chrfl_ , chrf2_ , chrf2_ , chrf2_ , chrf2_ , chrf2_ , chrf2_ , chrf2_ and chrf2_ [0018] In some embodiments, the set of markers further comprises one or more microsatellite markers. For example, in some embodiments, the set of markers further comprises one or more STRs selected from the group consisting of FCA005, FCA008, FCA023, FCA026, FCA035, FCA043, FCA045, FCA058, FCA069, FCA075, FCA077, FCA080B, FCA088, FCA090, FCA094, FCA096, FCA097, FCA105, FCA123, FCA126, FCA132, FCA149, FCA21 1, FCA220, FCA223, FCA224, FCA229, FCA262, FCA293, FCA305, FCA310, FCA391, FCA441, FCA453, FCA628, FCA649, FCA678 and FCA698. [0019] In various embodiments, prior to or in addition to genotyping, a most likely population of origin is based on one or more morphological features of the test feline. In some embodiments, prior to or in addition to genotyping, one or more morphological
11 features of the test feline allow the exclusion of one or more of the candidate populations of origin. For example, the feline may be evaluated for coat color (e.g., chocolate, cinnamon, dilute, orange, white), coat patterning (e.g., agouti, tabby, spotted, ticked, calico, point coloring), coat texture (e.g., straight or rex), coat length (e.g., hairless, short or long), ear morphology (e.g., normal, curled or folded), paw morphology (e.g., normal or polydactyl), and tail morphology (e.g., manx, bobtail, long). [0020] In some embodiments, the set of markers further comprises one or more phenotypic markers. For example, in some embodiments, the set of markers further comprises one or more of the phenotypic markers selected from the group consisting of Phen CMAH G139A, Phen ASIP del, Phen_MLPH_T83del, Phen_MClR_G250A, Phen_TYRPl_C298T, Phen_TYRPl_5IVS6, Phen_TYR_del975C, Phen_TYR_G7 15T, Phen_TYR_G940A, Phen_KIT_G1035C_BI, Phen_FGF5_475, Phen_FGF5_474, phen_fgf5_406, Phen_FGF5_356, Phen_GBLl_G1457C_SIA_KOR, Phen HEXB Dellntr BUR, Phen_HEXB_del39C_KOR, Phen GBE 1 Ins NFC, Phen_KRT71_G/Aintro4_SPX, Phen_MYBPC_G93C_MCC, Phen_MYBPC_C2460T_RAG, phen MPO ALC, Phen PLAU AG ALC, Phen FCAT ALC, Phen_PKLR_13delE6_Aby, Phen_PKDl_C10063A_PER, Phen_SHH_A479G_Hw, Phen_CEP290_PRA_Aby, Phen_CRX_546_Aby, Phen CMAH del, Phen_HEXB_C667T_DSH, Phen_GM2A_Del_DSH, Phen GRHPR DSH, Phen LPL G 1234A DSH, Phen LAMAN del PER, Phen ldua del DSH, Phen_ARSB_G1558A_SIA, Phen_ARSB_T1427C_Sia, Phen GUSB A l 052G DSH, Phen_MYBPC_A74T_Poly, Phen NPC 1 G2864C PER, Phen_SHH_G257C_UKl, Phen_SHH_A481T_UK2, Phen_HMBS_del842_SIA, Phen- HMBS l 89TT SIA, Phen_CYP21Bl, Phen TAS 1R2 CAT, Phen_TASlR2_G8224A_CAT, Phen_CYP27Bl_Rob, Phen ZFX, KRT7 1-Del Drex, P2RY5_CRex, WNK4_Burm_HKL, and CARTl del Burm. In some embodiments, the set of markers further comprises one or more of the phenotypic markers selected from the group consisting of SEQ ID NO: 149 to SEQ ID NO:202, shown in Table 3. [0021] In some embodiments, the marker locus genotypes for each candidate population are in Hardy-Weinberg Equilibrium and/or Gametic Phase Equilibrium. [0022] In various embodiments, the genotype information in each feline population profile comprises identities of one or both alleles of each marker of the set of markers. In some embodiments, the genotype information in each feline population profile comprises
12 allele frequencies for one or both alleles of each marker of the set of markers. In various embodiments, the genotype information in each feline population profile comprises both the identities and the allele frequencies of one or both alleles of each marker of the set of markers. [0023] In some embodiments, the database of feline population profiles comprises one or more feline population profiles. In various embodiments, the database of feline population profiles comprises a plurality of feline population profiles, for example, between about 5 and about 500 feline population profiles, for example, about , , or feline population profiles, for example, about 5, 10, 15, 20, 50, 100, 150, 200, 250, 300, 350, 400, 450, 500, or more, feline population profiles. [0024] In some embodiments, the database of feline populations profiles comprise one or more profiles of feline ancestral lineages, i.e., randombred populations of origin. For example, the feline populations profiles may comprise the profiles of one or more ancestral lineages of random bred worldwide populations of cats, including, e.g., Europe, Mediterranean, Egypt, Iraq/Iran, Arabian Sea, India, Southeast Asia, and East Asia. In some embodiments, the feline populations profiles may comprise the profiles of 1, 2, 3, 4, 5, 6, 7, 8, or more, ancestral lineages of random bred worldwide populations of cats. [0025] In some embodiments, the database of feline populations profiles comprise profiles of one or more feline breeds. Breeds of interest are recognized by at least one cat breed registry. For example, the breed may be recognized by one or more cat registries selected from the group consisting of The International Cat Association (TICA); the Cat Fanciers' Association (CFA); The Australian Cat Federation (ACF); Co-Ordinating Cat Council of Australia (CCC of A); Federation Internationale Feline (FIFe); Governing Council of the Cat Fancy (GCCF); The New Zealand Cat Fancy (NZCF); The Southern African Cat Council (SACC); The World Cat Federation (WCF); American Cat Fanciers Association (ACFA); The Traditional Cat Association, Inc. (TCA); International Progressive Cat Breeders' Alliance (IPCBA); Canadian Cat Association (CCA); Cat Fanciers' Federation (CFF); American Association of Cat Enthusiasts (AACE); Australian National Cats (WNCA); Capital Cats Incorporated (CCI); Catz Incorporated; Council of Federated Cat Clubs of Qld (CFCCQ); The Feline Association of NSW (TFA of NSW); Feline Control Council (FCC); Gold Coast Cat Club; The Governing Council of the Cat Fancy of South Australia (GCCFSA); NSW Cat Fanciers * Association (NSW CFA;); Queensland Feline Association (QFA); Queensland Independent Cat Council (QICC;);
13 Hong Kong Cat Lovers' Society; Korea Cat Club (KOCC); The Cat Federation of Southern Africa (CFSA); The Asian Cat Association (ACA); Bavarian Cat Fanciers' Association; and Feline Federation Europe. [0026] In various embodiments, the database comprises profiles of a plurality of feline breeds, for example, profiles of at least about 5, 10, 15, 20, 25, 30, 35, 40, 45, 50, 55, 60, or more, feline breeds recognized by one or more cat registries. For example, in certain embodiments, the profiles of feline breeds are selected from the group consisting of Persian, Exotic Shorthair (SH), British SH, Scottish Fold, Chartreux, American SH, Sphynx, Japanese Bobtail, Cornish Rex, Ragdoll, Maine Coon, Abyssinian, Siberian, Norwegian FC, Manx, Egyptian Mau, Turkish Angora, Turkish Van, Bengal, Sokoke, Ocicat, Russian Blue, Australian Mist, Burmese, Birman, Havana Brown, Korat, Siamese and Singapura. In some embodiments, the profiles of feline breeds are selected from the group consisting of Abyssinian, American Bobtail, American Bobtail Shorthair (SH), American Curl, American Curl Longhair (LH), American Shorthair, American Wirehair, Balinese, Bengal, Birman, Bombay, British Shorthair, British Longhair, Burmese, Chartreux, Colorpoint Shorthair, Cornish Rex, Cymric, Devon Rex, Don-Skoy, Egyptian Mau, European Burmese, Exotic Shorthair, Havana Brown, Himalayan, Japanese Bobtail, Japanese Bobtail Longhair, Korat, LaPerm, Maine Coon, Manx, Munchkin, Munchkin Longhair, Nebelung, Norwegian Forest Cat, Ocicat, Oriental Longhair, Oriental Shorthair, Persian, Peterbald, Pixiebob, Pixiebob Longhair, RagaMuffm, Ragdoll, Russian Blue, Scottish Fold, Scottish Fold Longhair, Selkirk Rex, Selkirk Rex Longhair, Siamese, Siberian, Singapura, Snowshoe, Somali, Sphynx, Thai, Tonkinese, Toyger, Turkish Angora, and Turkish Van. The profiles of feline breeds may also include one or more of Chausie, Savannah, Bambino, Donskey, Highlander, Highlander Shorthair, Kurilian Bobtail, Kurilian Bobtail Longhair, Minskin, Ojos Azules, Ojos Azules Longhair, Serengeti and Sokoke. [0027] In various embodiments, the test feline is suspected of having genetic contributions of 4 or fewer breeds. For example, a test feline may be suspected of being a purebred, having a genetic composition primarily contributed from a single breed, having a genetic composition primarily contributed by two distinct breeds, having a genetic composition primarily contributed by three distinct breeds, or having a genetic composition primarily contributed by four distinct breeds. [0028] In some embodiments, the set of markers comprises a subset of the 148 SNP markers listed in Table 1 and the method determines the contributions of one or more feline
14 populations to the test feline genome. In various embodiments, the set of markers comprises fewer than about 150 SNP markers and the method determines the contributions of 1, 2, 3 or 4 feline populations to the test feline genome. [0029] The identity of one or both alleles of a marker can be determined using any method in the art. In some embodiments, the identity of one or both alleles of a marker is determined by amplifying genomic DNA of the test feline using primers specific for each of the set of markers and determining the size of the amplification product. In some embodiments, the identity of one or both alleles of a marker is determined by amplifying genomic DNA of the test feline using primers specific for each of the set of markers and sequencing the amplification product. [0030] In some embodiments, the algorithm used to compare the identity of one or both alleles for each of the markers in the set of markers to a database comprising the one or more, or a plurality, of feline population profiles comprises a genotype clustering program. In some embodiments, the algorithm used to compare the identity of one or both alleles for each of the markers in the set of markers to a database comprising the one or more, or a plurality, of feline population profiles comprises an assignment program. In some embodiments, the algorithm used to compare the identity of one or both alleles for each of the markers in the set of markers to a database comprising the one or more, or a plurality, of feline population profiles comprises both a genotype clustering program and an assignment program. In some embodiments, the clustering program is a Bayesian clustering program. In some embodiments, the assignment program is a likelihood or frequentist program. In some embodiments, the test feline is assigned to the most likely population of origin if the population genotype probability for the most likely population of origin exceeds the value of assignment to any other population of the database. [0031] In some embodiments, the contributions of two or more genetically related feline populations to the test feline genome are discriminated by comparing the alleles in the test feline genome to a database comprising profiles of the two or more genetically related feline populations. For example, in various embodiments, the two or more genetically related feline populations being discriminated are selected from the group consisting of (i) Persian and Exotic Shorthair (SH); (ii) British SH and Scottish Fold; (iii) Australian Mist and Burmese; (iv) Singapura and Burmese; (v) Birman and Korat, and (vi) Siamese and Havana Brown. As appropriate, one or more phenotypic markers can be determined, in addition to determining the identity of a plurality of the SNPs listed in Table 1, to help
15 distinguish between the contributions of two or more genetically related feline populations to the test feline genome. [0032] For example, the genotype of the FGF5 SNP, which causes long hair, can be determined to affirmatively assign a test feline to one or more breeds selected from the group consisting of Persian, Maine Coon, Turkish Angora, Turkish Van and Birman. Similarly, a FGF5 genotype indicative of the presence of long hair can be used to exclude assignment to one or more breeds selected from the group consisting of Abyssinian, Egyptian Mau, Sokoke, Ocicat, and short-haired varieties of other recognized feline breeds. In some embodiments, the genotypes of one or both alleles of one or more of the FGF5 SNPs depicted by SEQ ID NOs: are determined. In some embodiments, the genotypes of one or both alleles of all four of the FGF5 SNPs depicted by SEQ ID NOs: are determined. [0033] In various embodiments, the methods further comprise reporting the results of the analysis. In some embodiments, the methods further comprise the step of providing a document displaying the contributions of one or more feline populations to the genome of the test feline genome. In various embodiments, the document provides additional information regarding the one or more feline populations that contributed to the genome of the test feline. In some embodiments, the document provides health-related information. In some embodiments, the document provides a certification of the contributions of one or more feline populations to the genome of the test feline. In some embodiments, the document provides a representation of the one or more feline populations that contributed to the genome of the test feline. [0034] In another aspect, the invention provides one or more primer sets for determining the identity of one or both alleles a plurality of single nucleotide polymorphisms (SNPs) listed in Table 1. In various embodiments, primer sets for determining the identity of one or both alleles of at least about 5 SNPs, for example, at least about 10, 15, 20, 25, 30, 40, 50, 60, 70, 75, 80, 90, 100, 110, 120, 125, 130, 140, 148 SNPs listed in Table 1 are provided. The primer sets may be provided in a kit. [0035] In a related aspect, the invention provides one or more computer-readable media. In some embodiments, the computer-readable media comprise: (a) a data structure stored thereon for use in distinguishing feline populations, the data structure comprising:
16 (i) marker data, wherein the marker data identifies one or both alleles of each marker of a set of markers in one or more feline population profiles, wherein the set of markers comprises a plurality of single nucleotide polymorphisms (SNPs) listed in Table 1; and (ii) genotype information data, wherein the genotype information data provides genotype information for each marker of a set of markers in a feline population, wherein a record comprises an instantiation of the marker data and an instantiation of the genotype information data and a set of records represents a feline population profile; and (b) computer-executable instructions for controlling one or more computing devices to: (i) identify one or both alleles in a test feline genome for each marker of the set of markers; and (ii) determine the contributions of one or more feline populations to the test feline genome by comparing the identified alleles in the test feline genome to the database comprising one or more feline population profiles, wherein each feline population profile comprises genotype information for the set of markers in the feline population. [0036] In a further aspect, the invention provides one or more computer-readable media comprising a data structure stored thereon for use in distinguishing feline populations. In some embodiments, the data structure comprises: (a) marker data, wherein the marker data identifies one or both alleles of each marker of a set of markers in one or more feline population profiles, wherein the set of markers comprises a plurality of single nucleotide polymorphisms (SNPs) listed in Table 1; and (b) genotype information data, wherein the genotype information data provides genotype information for each marker of a set of markers in a feline population, wherein a record comprises an instantiation of the marker data and an instantiation of the genotype information data and a set of records represents a feline population profile. [0037] Further embodiments in the computer readable media are as described above and herein. DEFINITIONS [0038] Unless defined otherwise, all technical and scientific terms used herein generally have the same meaning as commonly understood by one of ordinary skill in the
17 art to which this invention belongs. Generally, the nomenclature used herein and the laboratory procedures in cell culture, molecular genetics, organic chemistry and nucleic acid chemistry and hybridization described below are those well known and commonly employed in the art. Standard techniques are used for nucleic acid and peptide synthesis. Generally, enzymatic reactions and purification steps are performed according to the manufacturer's specifications. The techniques and procedures are generally performed according to conventional methods in the art and various general references (see generally, Sambrook et al. MOLECULAR CLONING: A LABORATORY MANUAL, 3rd ed. (2001) Cold Spring Harbor Laboratory Press, Cold Spring Harbor, N.Y. and Ausubel, et al., Current Protocols in Molecular Biology, , John Wiley and Sons), which are provided throughout this document. The nomenclature used herein and the laboratory procedures in analytical chemistry, and organic synthetic described below are those well known and commonly employed in the art. Standard techniques, or modifications thereof, are used for chemical syntheses and chemical analyses. [0039] The terms "isolated," "purified," or "biologically pure" refer to material that is substantially or essentially free from components that normally accompany it as found in its native state. Purity and homogeneity are typically determined using analytical chemistry techniques such as polyacrylamide gel electrophoresis or high performance liquid chromatography. Genomic DNA or a polynucleotide that is the predominant species present in a preparation is substantially purified. The term "purified" denotes that a nucleic acid gives rise to essentially one band in an electrophoretic gel. Particularly, it means that the nucleic acid or genomic DNA is at least 85% pure, more preferably at least 95% pure, and most preferably at least 99% pure. [0040] The terms "nucleic acid" and "polynucleotide" are used interchangeably herein to refer to deoxyribonucleotides or ribonucleotides and polymers thereof in either single- or double-stranded form. The term encompasses nucleic acids containing known nucleotide analogs or modified backbone residues or linkages, which are synthetic, naturally occurring, and non-naturally occurring, which have similar binding properties as the reference nucleic acid, and which are metabolized in a manner similar to the reference nucleotides. Examples of such analogs include, without limitation, phosphorothioates, phosphoramidates, methyl phosphonates, chiral-methyl phosphonates, 2-O-methyl ribonucleotides, peptide-nucleic acids (PNAs).
18 [0041] Unless otherwise indicated, a particular nucleic acid sequence also encompasses conservatively modified variants thereof (e.g., degenerate codon substitutions) and complementary sequences, as well as the sequence explicitly indicated. Specifically, degenerate codon substitutions may be achieved by generating sequences in which the third position of one or more selected (or all) codons is substituted with mixed-base and/or deoxyinosine residues (Batzer et al, Nucleic Acid Res. 19:5081 (1991); Ohtsuka et al, J. Biol. Chem. 260: (1985); Rossolini et al., Mol. Cell. Probes 8:91 98 (1994)). The term nucleic acid is used interchangeably with gene, cdna, mrna, oligonucleotide, and polynucleotide. [0042] The terms "identical" or percent "identity," in the context of two or more nucleic acid sequences, refer to two or more sequences or subsequences that are the same or have a specified percentage of nucleotides that are the same (e.g., 80% identity, preferably 85%, 90%, 95%, 96%, 97%, 98%, 99% identity over a specified region such as the nucleic acid sequences of SEQ ID NOs: and SEQ ID NOs: ), when compared and aligned for maximum correspondence over a comparison window, or designated region as measured using a known sequence comparison algorithm (e.g., BLAST, ALIGN) set to default settings or by manual alignment and visual inspection. Such sequences are then said to be "substantially identical." This definition also refers to the complement of a test sequence. Preferably, the identity exists over a region that is at least about 25 nucleotides in length, or more preferably over a region that is nucleotides in length, or over the full length of the contextual sequence flanking the genetic marker. [0043] A "label" or "detectable label" is a composition detectable by spectroscopic, photochemical, biochemical, immunochemical, or chemical means. For example, useful labels include radioisotopes (e.g., H, S, P, Cr, or I) fluorescent dyes, electron-dense reagents, enzymes (e.g., alkaline phosphatase, horseradish peroxidase, or others commonly used in an ELISA), biotin, digoxigenin, or haptens and proteins for which antisera or monoclonal antibodies are available (e.g., the polypeptide comprising a sequence encoded by SEQ ID NO:l can be made detectable, e.g., by incorporating a radiolabel into the peptide, and used to detect antibodies specifically reactive with the peptide). [0044] An "amplification reaction" refers to any chemical reaction, including an enzymatic reaction, which results in increased copies of a template nucleic acid sequence. Amplification reactions include polymerase chain reaction (PCR) and ligase chain reaction (LCR) (see U.S. Pat. Nos. 4,683,195 and 4,683,202; PCR Protocols: A Guide to Methods
19 and Applications (Innis et al, eds, 1990)), strand displacement amplification (SDA) (Walker, et al. Nucleic Acids Res. 20(7): 1691 (1992); Walker PCR Methods Appl 3(1): 1 (1993)), transcription-mediated amplification (Phyffer, et al., J. Clin. Microbiol. 34:834 (1996); Vuorinen, et al, J. Clin. Microbiol. 33:1856 (1995)), nucleic acid sequence-based amplification (NASBA) (Compton, Nature 350(63 13):91 (1991), rolling circle amplification (RCA) (Lisby, Mol. Biotechnol. 12(1):75 (1999)); Hatch et al., Genet. Anal. 15(2):35 (1999)) and branched DNA signal amplification (bdna) (see, e.g., Iqbal et al, Mol. Cell Probes 13(4):315 (1999)). [0045] "Amplifying" refers to submitting a solution to conditions sufficient to allow for amplification of a polynucleotide if all of the components of the reaction are intact. Components of an amplification reaction include, e.g., primers, a polynucleotide template, polymerase, nucleotides, and the like. Thus, an amplifying step can occur without producing a product if, for example, primers are degraded. [0046] "Amplification reagents" refer to reagents used in an amplification reaction. These reagents can include, e.g., oligonucleotide primers; borate, phosphate, carbonate, barbital, Tris, etc. based buffers (see, U.S. Pat. No. 5,508,178); salts such as potassium or sodium chloride; magnesium; deoxynucleotide triphosphates (dntps); a nucleic acid polymerase such as Taq DNA polymerase; as well as DMSO; and stabilizing agents such as gelatin, bovine serum albumin, and non-ionic detergents (e.g. Tween-20). [0047] A "plurality" refers to two or more, for example, 2, 3, 4, 5, 10, 15, 20, 25, 30, 40, 50, 60, 70, 75, 80, 90, 100, 110, 120, 130, 140, 145, 148, 150, or more (e.g., genetic markers, including SNPs, short tandem repeats (STRs), microsatellites, phenotypic markers; feline population profiles). In some embodiments, a plurality refers to concurrent or sequential determination of about 2-150, 5-148, , markers, for example, about 50, 55, 60, 65, 70, 75, 80, 85, 90, 95, 100, 110, 120, 130, 140, 145, 148, 150, or more, markers. In some embodiments, "plurality" refers to all markers listed in one or more tables, e.g., all markers listed in Table 1, and optionally also including all markers listed in Table 3. [0048] A "single nucleotide polymorphism" or "SNP" refers to polynucleotide that differs from another polynucleotide by a single nucleotide exchange. For example, without limitation, exchanging one A for one C, G or T in the entire sequence of polynucleotide constitutes a SNP. Of course, it is possible to have more than one SNP in a particular polynucleotide. For example, at one locus in a polynucleotide, a C may be exchanged for a
20 T, at another locus a G may be exchanged for an A and so on. When referring to SNPs, the polynucleotide is most often DNA and the SNP is one that usually results in a change in the genotype that is associated with a corresponding change in phenotype of the organism in which the SNP occurs. [0049] A "variant" is a difference in the nucleotide sequence among related polynucleotides. The difference may be the deletion of one or more nucleotides from the sequence of one polynucleotide compared to the sequence of a related polynucleotide, the addition of one or more nucleotides or the substitution of one nucleotide for another. The terms "mutation," "polymorphism" and "variant" are used interchangeably herein to describe such variants. As used herein, the term "variant" in the singular is to be construed to include multiple variances; i. e., two or more nucleotide additions, deletions and/or substitutions in the same polynucleotide. A "point mutation" refers to a single substitution of one nucleotide for another. [0050] A nucleic acid "that distinguishes" as used herein refers to a polynucleotide(s) that distinguishes a first polymorphism (e.g., a major allele of a SNP) from a second polymorphism (e.g., a minor allele of the same SNP) at the same position in the genomic sequence. The nucleic acid that distinguishes can allow for polynucleotide extension and amplification after annealing to a polynucleotide comprising the first polymorphism, but will not allow for polynucleotide extension or amplification after annealing to a polynucleotide comprising the second polymorphism. In other embodiments, a nucleic acid that distinguishes a first polymorphism from a second polymorphism at the same position in the sequence will hybridize to a polynucleotide comprising the first polymorphism but will not hybridize to a polynucleotide comprising the second polymorphism. The invention provides polynucleotides that distinguish the SNPs and genetic markers listed in Table 1. [0051] The term "primer" refers to a nucleic acid sequence that primes the synthesis of a polynucleotide in an amplification reaction. Typically a primer comprises fewer than about 100 nucleotides and preferably comprises fewer than about 30 nucleotides. Exemplary primers range from about 5 to about 25 nucleotides. The "integrity" of a primer refers to the ability of the primer to primer an amplification reaction. For example, the integrity of a primer is typically no longer intact after degradation of the primer sequences such as by endonuclease cleavage.
21 [0052] The term "subsequence" refers to a sequence of nucleotides that are contiguous within a second sequence but does not include all of the nucleotides of the second sequence. [0053] A "target" or "target sequence" refers to a single or double stranded polynucleotide sequence sought to be amplified in an amplification reaction. Two target sequences are different if they comprise non-identical polynucleotide sequences. [0054] As used herein a "nucleic acid probe or oligonucleotide" is defined as a nucleic acid capable of binding to a target nucleic acid of complementary sequence through one or more types of chemical bonds, usually through complementary base pairing, usually through hydrogen bond formation. As used herein, a probe may include natural (i.e., A, G, C, or T) or modified bases (7-deazaguanosine, inosine, etc.). In addition, the bases in a probe may bejoined by a linkage other than a phosphodiester bond, so long as it does not interfere with hybridization. Thus, for example, probes may be peptide nucleic acids in which the constituent bases are joined by peptide bonds rather than phosphodiester linkages. It will be understood by one of skill in the art that probes may bind target sequences lacking complete complementarity with the probe sequence depending upon the stringency of the hybridization conditions. The probes are preferably directly labeled as with isotopes, chromophores, lumiphores, chromogens, or indirectly labeled such as with biotin to which a streptavidin complex may later bind. By assaying for the presence or absence of the probe, one can detect the presence or absence of the select sequence or subsequence. [0055] A "labeled nucleic acid probe or oligonucleotide" is one that is bound, either covalently, through a linker or a chemical bond, or noncovalently, through ionic, van der Waals, electrostatic, or hydrogen bonds to a label such that the presence of the probe may be detected by detecting the presence of the label bound to the probe. [0056] "Biological sample" as used herein is a sample of biological tissue or fluid that contains genomic DNA. These samples can be tested by the methods described herein and include body fluids such as whole blood, serum, plasma, cerebrospinal fluid, urine, lymph fluids, and various external secretions of the respiratory, intestinal and genitourinary tracts, tears, saliva, milk, white blood cells, myelomas, and the like; and biological fluids such as cell extracts, cell culture supernatants; fixed tissue specimens; and fixed cell specimens. Biological samples may also include sections of tissues such as biopsy and autopsy samples or frozen sections taken for histologic purposes. A biological sample can also be skin cells, a cheek swab or a hair bulb sample. These samples are well known in the
22 art. A biological sample is obtained from any mammal including, e.g., a cat. A biological sample may be suspended or dissolved in liquid materials such as buffers, extractants, solvents and the like. [0057] The term "feline" refers to an animal that is a member of the family Felidae; including without limitation the subfamilies, Felinae, Pantherinae, and Acinonychinae; the genera Caracal, Catopuma, Felis, Herpailurus, Leopardus, Leptailurus, Lynx, Oncifelis, Oreailurus, Otocolobus, Prionailurus, Profelis, Puma, Neofelis, Panthera, Pardofelis, and Uncia; the species felis, lybica, jubatus, caracal, badia, bieti, chaus, margarita, nigripes, silvestris, gordonii, yaguarondi, pardalis, tigrinus, wiedi, serval, canadensis, lynx, pardinus, rufus, colocolo, geoffroyi, guigna, jacobita, manul, bengalensis, planiceps, rubiginosus, viverrinus, aurata, concolor, nebulosa, leo, onca, pardus, tigris, marmorata, and uncial. [0058] The term "determining the contributions of feline populations" refers to estimating or inferring using statistical methods the contributions of feline populations to draw conclusions regarding whether one or more feline populations contributed to the genome of a test feline. [0059] The term "feline population" refers to a group of felines related by descent, such as a domestic cat breed. [0060] The term "breed" refers to an intraspecies group of animals with relatively uniform phenotypic traits that have been selected for under controlled conditions by man. For example, The International Cat Association (TICA) recognizes 57 Championship Breeds, 2 Advanced New Breeds and 10 Preliminary New Breeds (identified at tica.org). The Cat Fanciers' Association (CFA) lists 40 breeds. The methods of the invention may be used to estimate the genetic contributions of any cat breed, including, but not limited to Abyssinian, American Bobtail, American Bobtail Shorthair (SH), American Curl, American Curl Longhair (LH), American Shorthair, American Wirehair, Balinese, Bengal, Birman, Bombay, British Shorthair, British Longhair, Burmese, Chartreux, Colorpoint Shorthair, Cornish Rex, Cymric, Devon Rex, Egyptian Mau, European Burmese, Exotic Shorthair, Havana Brown, Himalayan, Japanese Bobtail, Japanese Bobtail Longhair, Korat, LaPerm, Maine Coon, Manx, Munchkin, Munchkin Longhair, Nebelung, Norwegian Forest Cat, Ocicat, Oriental Longhair, Oriental Shorthair, Persian, Peterbald, Pixiebob, Pixiebob Longhair, RagaMuffm, Ragdoll, Russian Blue, Scottish Fold, Scottish Fold Longhair, Selkirk Rex, Selkirk Rex Longhair, Siamese, Siberian, Singapura, Snowshoe, Somali, Sphynx, Thai, Tonkinese, Toyger, Turkish Angora, Turkish Van, Chausie, Savannah,
23 Bambino, Donskey, Highlander, Highlander Shorthair, Kurilian Bobtail, Kurilian Bobtail Longhair, Minskin, Ojos Azules, Ojos Azules Longhair, Serengeti and Sokoke, and mixtures thereof. [0061] The term "marker" refers to any polymorphic genomic locus that is sufficiently informative across the feline populations used in the methods of the invention to be useful for estimating the genetic contribution of these feline populations to the genome of a test feline. A genomic locus is polymorphic if it has at least two alleles. [0062] The term "allele" refers to a particular form of a genomic locus that may be distinguished from other forms of the genomic locus by its nucleic acid sequence. Thus, different alleles of a genomic locus represent alternative nucleic acid sequences at that locus. In any individual feline genome, there are two alleles for each marker. If both alleles are the same, the genome is homozygous for that marker. Conversely, if the two alleles differ, the genome is heterozygous for that marker. [0063] Population-specific alleles are alleles that are present at some frequency in one feline population but have not been observed in the sampled feline from comparison feline populations (although they may be present at a significantly lower frequency). Population-specific alleles may be used to assign an individual to a particular population. Accordingly, the difference in allele frequencies between populations can be used for determining genetic contributions. [0064] A "set of markers" refers to a minimum number of markers that are sufficient for determining the genetic contribution of the feline populations used in the methods of the invention to the genome of a test feline. The minimum number of markers required depends on the informativeness of the markers for the particular feline populations that are being used, as further described below. The set of markers may comprise at least about 5, 10, 25, 50, 75, 100, 125, 150 markers, or more, as appropriate. [0065] A "feline population profile" as used herein refers to the collection of genotype information for the set of markers in a feline population. Thus, a feline population profile may comprise genotype information for most or all alleles of most or all markers in the set of markers in the feline population. [0066] An "allele frequency" refers to the rate of occurrence of an allele in a population. Allele frequencies are typically estimated by direct counting. Generally, allele
24 frequencies in a feline population are estimated by obtaining the identity of one or both alleles for each of the set of markers in at least about five members of that feline population. [0067] A "database of feline population profiles" refers to the collection of feline population profiles for all of the feline populations used in an exemplary method of the invention. In some embodiments, the database of feline population profiles comprises between about five and about 500 feline population profiles, such as about 20 feline population profiles, about 50 feline population profiles, or about 100 feline population profiles. [0068] A "computer-readable medium" refers to any available medium that can be accessed by computer and includes both volatile and nonvolatile media, removable and non removable media. [0069] The term "modulated data signal" means a signal that has one or more of its characteristics set or changed in such a manner as to encode information in the signal. [0070] A "data structure" refers to a conceptual arrangement of data and is typically characterized by rows and columns, with data occupying or potentially occupying each cell formed by a row-column intersection. BRIEF DESCRIPTION OF THE DRAWINGS [0071] Figure 1 illustrates a map of random bred cat sampling locations. The pie charts represent the percentage of the eight worldwide lineages found at each location. The shading indicates the strength of the predominating lineage for each region of the world. [0072] Figures 2A-F illustrate Delta K plots of random bred cat population structuring. Graphs of both the mean Ln(K) and Κ calculations based on the results of Bayesian clustering. Top) SNPs only, Middle) STRs only, Bottom) SNPs and STRs combined. Points where a peaks in a Κ plot occur indicate population stratification with higher likelihood than those where valleys occur. [0073] Figures 3A-F illustrate Bayesian clustering of random bred worldwide cat populations. Clustering of cat populations using STRUCTURE A) SNPs K=5, B) SNPs K=8, C) STRs K=5, D) STRs K=7, E) SNPS and STRs K=5, F) SNPs and STRs K=8. [0074] Figures 4A-C illustrate alternate Bayesian clustering of worldwide cat populations. Alternate clustering of cat populations using STRUCTURE based on Κ
25 calculations. A) SNPs at K=l 1 and 23, B) STRs at K=9 and 13, and C) SNPs and STRs combined at K=10, 16, 18, and 22. [0075] Figures 5A-B illustrate principal coordinate analysis of world cat populations. A) SNPs and B) STRs by sampling location calculated via Nei's Unbiased Distance. Colors indicate the eight random bred populations. Circles indicate the five lineages. [0076] Figures 6A-B illustrate neighbor-joining trees of world cat populations. Bootstrap values over 50% indicated on nodes. Branch colors indicate the population as assigned by STRUCTURE. A) SNP-based phylogeny produced with Reynolds, Weir and Cockerham's genetic distance. B) STR-based tree produced with Nei's unbiased genetic distance. [0077] Figures 7A-D illustrate log likelikhood and Delta K plots from the Bayesian clustering of cat breeds. Graphs of both the mean Ln(K) and Κ calculations based on the results of Bayesian clustering. Points where a peaks in a Κ plot occur indicate population stratification with higher likelihood than those where valleys occur. [0078] Figure 8 illustrates Bayesian clustering of cat breeds. Clustering of breeds at K=17 and K=21 as calculated with SNPs and STRs respectively. [0079] Figures 9A-B. Figure 9A illustrates alternate plots of Bayesian clustering analysis for SNPs. Figure 9B illustrates alternate plots of Bayesian clustering analysis for STRs. [0080] Figures 10A-B illustrate principal coordinate analysis of cat breeds and worldwide random bred cat populations. Color shades indicate the population membership of the respective random bred populations. [0081] Figures 11A-B. Figure 11A illustrates crossed assignment rate between breeds as a function of the Reynolds distance between populations using SNPs. Figure 1IB illustrates crossed assignment rate between breeds as a function of the Reynolds distance between populations using STRs. DETAILED DESCRIPTION 1. Introduction [0082] The present invention is based, in part, on the discovery of a panel of biomarkers useful for the assignment of domestic cats to specific breeds or world
26 populations based on the frequency of genetic markers in their genome. Assignment testing utilizes microsatellite and/or single nucleotide polymorphism (SNP) biomarkers, as well as genetic biomarkers that are known to confer a physical characteristic or disease state in the cat. The combined panel of over 200 different genetic tests can be used to determine if a cat is from a specific breed or random bred population of origin within a database of approximately 2000 cats. To conduct the test, the genotypes of the panel of biomarkers are determined in a biological sample of the cat (e.g., blood, tissue, hair bulb, buccal swab) comprising genomic DNA. The genotypic "signature" over the panel of biomarkers of the test cat is compared against a database of the same panel of biomarkers with identified frequency associations with known cat breeds and random bred populations of origin. The frequency of the DNA variants of the test cat are compared to the database to match the test cat to the population with the most similar frequencies, allowing assignment to one or more breeds and/or ancestral lineages of origin. Using the biomarker panels described herein, it is possible to determine the geographical region of the genetic origins of the test cat, whether the test cat is highly related to a known breed, or whether the test cat has a parent or grandparent that is of a known breed. The present genetic assignment tests also find use breeding strategies, e.g., to facilitate the selection of a mating partner that is genetically dissimilar, or as a new foundation for a breed stock. 2. Felines Subject to Testing [0083] The methods find use in determining the contributing feline populations of origin of any feline, e.g., any member of the family Felidae. Oftentimes, the feline will be a domesticated feline. In various embodiments, the feline is a member of the genus Felis. For example, the feline may be a member of Felis silvestris or Felis catus. The feline further can have one or more identifiable phenotypic or morphological features associated with one or more recognized cat breeds, by a cat registry. For example, the feline may have genetic contributions from a cat breed recognized by one or more cat registries selected from the group consisting of The International Cat Association (TICA; tica.org); the Cat Fanciers' Association (CFA; cfa.org); The Australian Cat Federation (ACF; acf.asn.au); Co-Ordinating Cat Council of Australia (CCC of A; cccofa.asn.au); Federation Internationale Feline (FIFe; fifeweb.org); Governing Council of the Cat Fancy (GCCF; gccfcats.org); The New Zealand Cat Fancy (NZCF; nzcatfancy.gen.nz); The Southern African Cat Council (SACC; tsacc.org. za); The World Cat Federation (WCF;wcfonline.de); American Cat Fanciers Association (ACFA; acfacat.com); The Traditional Cat
27 Association, Inc. (TCA; traditionalcats.com); International Progressive Cat Breeders' Alliance (IPCBA; ipcba.8k.com); Canadian Cat Association (CCA; cca-afc.com); Cat Fanciers' Federation (CFF; cffinc.org); American Association of Cat Enthusiasts (AACE; aaceinc.org); Australian National Cats (WNCA; ancats.com.au); Capital Cats Incorporated (CCI; cci.asn.au); Catz Incorporated (catzinc.org); Council of Federated Cat Clubs of Qld (CFCCQ; cfccq.org/index.html); The Feline Association of NSW (TFA of NSW; tfansw.webs.com); Feline Control Council (FCC; hotkey.net.au/%7efccvic); Gold Coast Cat Club Inc. (goldcoastcatclub.com); The Governing Council of the Cat Fancy of South Australia (GCCFSA; users.chariot.net.au/~gccfsa/index.html); NSW Cat Fanciers' Association (NSW CFA; nswcfa.asn.au); Queensland Feline Association (QFA; qfeline.com); Queensland Independent Cat Council (QICC; qicc.org.au); Hong Kong Cat Lovers' Society (hkcls.com); Korea Cat Club (KOCC; kocc.or.kr/link/link.htm or ticakorea.org); The Cat Federation of Southern Africa (CFSA;.cfsa.co.za); The Asian Cat Association (ACA; asiancats.co.uk); Bavarian Cat Fanciers' Association (bavariancfa.de/bcfa.htm); and Feline Federation Europe (FFE; ffe-europe.de). [0084] Illustrative breeds include without limitation Abyssinian, American Bobtail, American Bobtail Shorthair (SH), American Curl, American Curl Longhair (LH), American Shorthair, American Wirehair, Balinese, Bengal, Birman, Bombay, British Shorthair, British Longhair, Burmese, Chartreux, Colorpoint Shorthair, Cornish Rex, Cymric, Devon Rex, Egyptian Mau, European Burmese, Exotic Shorthair, Havana Brown, Himalayan, Japanese Bobtail, Japanese Bobtail Longhair, Korat, LaPerm, Maine Coon, Manx, Munchkin, Munchkin Longhair, Nebelung, Norwegian Forest Cat, Ocicat, Oriental Longhair, Oriental Shorthair, Persian, Peterbald, Pixiebob, Pixiebob Longhair, RagaMuffin, Ragdoll, Russian Blue, Scottish Fold, Scottish Fold Longhair, Selkirk Rex, Selkirk Rex Longhair, Siamese, Siberian, Singapura, Snowshoe, Somali, Sphynx, Thai, Tonkinese, Toyger, Turkish Angora, Turkish Van, Chausie, Savannah, Bambino, Donskey, Highlander, Highlander Shorthair, Kurilian Bobtail, Kurilian Bobtail Longhair, Minskin, Ojos Azules, Ojos Azules Longhair, Serengeti and Sokoke, and mixtures thereof. [0085] The feline breed assignment tests were developed based on the understanding that 44 breeds are genetically definable of the world's 54 major breeds, not including longhaired and shorthaired varieties with the same breed name. The assignment test described herein attempted to include all breeds recognized in three or more of the following registries: CFA (USA), TICA (USA), GCCF (UK), and FIFe (Europe). However,
28 the assignment of a cat to a breed was mainly based on USA populations. Cats representing breeds from other world regions will therefore be assigned to a cat breed in reference to the genetic structuring of USA cats. [0086] Additional populations can also be added. For example, breeds that are considered preliminary or under development, as well as breeds specific to a particular geographic location (e.g., breeds or populations specific to an island location), can be added to the databases described herein, first as a preliminary breed and then as an established breed. For example, the Selkirk Rex and American Curl breeds are under development. Also, additional analyses could be used to further refine population and breed definitions when compared on a less global and more regional scale. [0087] It is recognized that the definitions of cat breeds vary between registries around the world, and that different breed registries accept and refuse different color varieties and variants, sometimes even defining a breed. For example, some registries define a Himalayan as a pointed Persian. For the sake of reference, the CFA definitions of breeds were used in the tests described herein to make assignments. Thus, a pointed Manx, which may be a defined breed in another cat registry, may seem to have an inappropriate assignment. Straight-eared Scottish Folds and tailed Manx may be difficult to define if not only by their breed heritage. These nuances of breed definitions need to be considered in the analysis and interpretation of results. It is further recognized that many breeds may have longhaired and shorthaired varieties, some using a different name, such as Manx and Cymric. [0088] In various embodiments, the feline is a hybrid, e.g., having genomic contributions from one or more wild felids. For example, the Bengal is a cross of various cat breeds and random bred cats with various sub-species of the Asian Leopard cat (Felis bengalensis, a.k.a. Prionailurus bengalensis). The Chaussie breed is a cross of various cat breeds and random bred cats with various sub-species of the Jungle cat (Felis chaus). The Savannah breed is a cross of various cat breeds and random bred cats with various sub species of the Serval (Felis Serval). Some cat breeds are mixtures of these various hybrid breeds, e.g., the Desert Lynx. 3. Biological Sample [0089] The methods may comprise the step of obtaining a biological sample comprising genomic DNA from the feline to be tested. The biological sample may be
29 obtained in the laboratory conducting the analysis or by another party (e.g., a veterinarian, a guardian of the feline). The biological sample can be from solid tissue or a biological fluid that contains a nucleic acid comprising a single nucleotide polymorphism (SNP) described herein, e.g., a genomic DNA sample comprising a plurality of the genetic markers listed in Table 1, particularly the SNPs depicted in SEQ ID NOs: The biological sample can be tested by the methods described herein and include body fluids including whole blood, serum, plasma, cerebrospinal fluid, urine, lymph fluids, semen, and various external secretions of the respiratory, intestinal and genitourinary tracts, tears, saliva, milk, white blood cells, myelomas, and the like; and biological fluids such as cell extracts, cell culture supematants; fixed tissue specimens; and fixed cell specimens. Biological samples can also be from solid tissue, including hair bulb, skin, cheek swab, biopsy or autopsy samples or frozen sections taken for histologic purposes. These samples are well known in the art. A biological sample is obtained from any feline to be tested for the genotype of the genetic markers as described herein. A biological sample can be suspended or dissolved in liquid materials such as buffers, extractants, solvents and the like. 4. Biomarkers Useful to Determine Breed and/or Population of Origin [0090] Genetic markers useful for the determination of the contribution of one of more feline populations or breeds of origin are listed in Table 1. The methods of the invention analyze in a test feline the genotype of a plurality of genetic markers depicted as SEQ ID NOs:l-148 in Table 1, also identified by their chromosomal location. Table 1 - SNP sequences useful for breed identification test SEQ ID NO: SNP ID Sequence 1 A1J TCAATAGCAGGAGAMCAAGATCAMCCATG CCCGGGTTTCAATGCCTTG GGGAAATAAC[A/G]GAGAGAAGGAAACTTTATTAAGGCGATCCCGTCAACT CTACCCATTCCTCGGAGGCGTTT 2 A1J GTAAAACACGACAACATAGAATGACACTCACTGTGGCAGTCGAAAAGAGG TACTTGGCAA[A/G]TACCATGGGAATGTCATACGGGATGCATGCTACTGGA GGGATGTCTATAGCCTTTCCACT 3 A TAGCACCAGATCAAAAAATGAGTGGATTTCCCTGTCTAGCTCCTTCACCA CCACAAGTTC[T/C]GCATGTTTGGTCTCATCAGGCCCCACGATGACATCCA GGGCAAAGTGCTCGCTGGGGGAC 4 A1_ TTGTGGAATGACACCGTCAGAAAGGAGATTTCTTGGGCTACTGTGGTAGC TAGATTCCCG[T/C]GGAAGGGCGTGCCTTTCGGTTACAACGTATTGGTGC TAGGCTGCCTGGACCACTGGCTTT 5 A1_ GAAACGGAGTCACAGGAAGTAAGGGTTGGTATTATATTTTTAGAAGTATTT ATTGGGGGA[C/G]GGGGGATAAATAGGTGGGCTCAGAGAATAATATTTCC AAGGTCACAGGGCTAATGAGCCT
30 Table 1 - SNP sequences useful for breed identification test SEQ ID NO: SNP ID Sequence 6 A1_ AGTGATCCAAGGAGGTGACGAGGGACCATAAGCCTTGATTTATGACCTGA GGTTTCCATC[T/C]CAGAAGCCACATCATCAGTCCCTCTGGGAAAGAGTTT TAACTGGATGAACTGCCCTTCTA 7 A1_ GTTCATTGAGTAAGATGTTCATCACCCTCTTCTTAGAAATAAATTCCCTTT GCTTCATCA[A/G]GGAATCATGAACCCTTAGAGCTAGAAACGACTTTGGAG GTTATGTGTTTAAGTGTTTTTG 8 A1_ AATTACCCAATTCCTCCCTAGTTATCGTATTCAGTGACACAGATAACAAAA GTTAGAAGT[T/G]CTTCGATTCACATTCACAAAGATGCACCATGAAATCATA GTAACTTGGAGTAAGTGGCAG 9 A1_ CTTTTGATTCTATTTTGGGTCACACGTGAAACCCACAGAACAATCGACAAA AGCCATTTC[A/G]TCTTCTCACTCTCTTCAGTTTACCCTTTTGCTTAGTTTAT TTCATTTCGCCAACATTTTT 10 A1_ ATGCAGTCCTGCCTAAATGTAGGAGAGTCCTGAAGATTTTCTGGATCTAA TCTCTACCAT[T/G]TTGTGCCAAGTTTGAGGACTCATTATACTTTAGGCTTT ATAAAATATTTCTCCTCTGGGT 11 A1_ ATTATTTGCAGGATCTACGTTCATTACTTGAGACAGGACGATTCATTAAAT GTTAGAAAT[T/C]AATTCGTGGAGCAAGTAAAAAGGTGGAAGAAGTGTTAG GAAAATCACTTGAGAAAACGTA 12 A1_ AACTCAATCAATCCAGGCATCCTTGTCTGACCAGGAGGAAAAAATAAACA CAGCAACGTG[A/G]AGGCGGAAGCTCGTGCTCTGGAAACAGTCAGACCTG ACTCAATTCCAAGCTCCCGGATGT 13 A1_ GAGTCAAGCTGTCGCTGTTTCTGGTGCAAAACCAGGCACAAGGTACACA GTGATATTAAA[A/G]GCTCGTGGGCAAAACACCTTCCTCAGCCCGGGAGC GACACCTGTGGCAATATAATTTGAT 14 A1_ CCTTCCCTTACTGAGAGACAGTCAATAAACCTTCAGAGGAGGGCTAAGCA TGACCCGCAG[T/G]GATCCAAGAACACACCAGAAGAAAGGGGATCATCAC AGCCAATGCCAACGTAGGGAGTTG 15 A2_ CTAAAACTTCATTTGGTTAAAACAGAAGAAGAGTCAAGCACTTCTCTTCCT TGTGAGCTA[T/C]CATGTAGCCAACACTCTGAACATAACATGCGCAACGGG AATATACTCAGCTTCCCAACTC 16 A2_ TCGAGAAATAGGGGACACAGCAATTCAATCTCCTGGTTAAACCAAAGCTT AGATGAAGAC[A/G]TCTGGTTCTTTAAGCCTTTCTGCTGAAAATAATCATCC GAGGTACTAAGGTCCCTTTTGA 17 A2_ GCAGAATTTGTCGTAAAGAGAATTCTCACACGTGAGGACTTTCCCTCTCTT GTGTTGCAT[T/C]GTCAAACTAGACCTGCATTTAGGCCCCTGGTTGTATAA ACTCCAGCTTAGTTATCCAACG 18 A2_ GTTTTTCCTGAACCTTCCCACCTTTAATGCATCCTGGAGCAGTCCTTCAGC CTGCTTCCC[T/G]CCAGTCTTCTTACTCTTTCATTTTAAATAATGTAATAAC GTTGACATTTTCATTTAGAGT 19 A2_ GAACCCACTTTGCAGATGGGAGAACCATGGGGTTACACTTCGGCATCTC CCTGAAATCTG[A/G]TGAGACACGGAATGGAGGCCTTCTCAGCAGATACT GGGTGAGAGTCACATTGATGTGCTG 20 A3_ CAGATTTCAGGGAGCAAAGGGATCAAATTAACTTTTCTCATGGTTCTATTT TTGTGACTC[A/C]ATTCTTTTGGAGGAGAGAGTCAGGATGACTGGTGGGAT TTCCAGAAAAGCCAGAAACAGT 2 1 A3J CAGACACATTGGGATCATGAAAATCAGCCTCAGTTTCAAAAATAAATCTGT TACCTCCAT[T/C]AATCATGAAAAACAATTGGTCAATGGCCTGCAGGGGTG GCAGCTGTGTCAAAGCAGGGGC 22 A3J ATATGCTCAATAAATAACGATCACTCGTTTGCTTATTACTCGTTCGGGTGG GGATACAGA[T/C]GTATATACCTAAAATTACAAAACAGCGTAAGATCTGTC CTGGTTACATGTACCAGGTGAA
31 Table 1 - SNP sequences useful for breed identification test SEQ ID NO: SNP ID Sequence 23 A CCGCAAGTTGGGCGGAGGTTAGGTGGGCAGACTCACCTTCTTGTCCATG AGGCAACCAAA[C/G]AGTAAGATGAAGACACCCTTAACGGGGGGATACGG GGATAAGTTAGTCACGGAGGAAGGA 24 A ACGAGTCGTGTTAAATAAATCGAGGATGGCATTGTTAGTCCTCTTTCCTAA GTAACCTTC[C/G]AGGCTGTCAGATAAGCTCTCCCTGTGGTTTCTGTTCTC TTTTAGAATGAGCCCTTCCTGA 25 A3_ AGCATTTATCAAAGGAATGATAAGGAGTAAAGTAGAACATTAGTCCATAG GTGAAAGCCC[A/G]TGAGAAAAAAATTAAATGCCCAAGTCATTAAGTGCAT GGCTTGACAAATTGTTTAAAAGg 26 A CTATACTAGTTTTATATCATCCTTGCCTGTTATGGATCGAACGAGTGTTTTT CCTGCTGT[A/G]CAAAAACGTTCCTTGACAATATATTTTCTACCAATAATCA TTATTTTAATAAAACCAGTG 27 A GTTAAGCCCATCTAACTCCTGAATTTTTTCGTGTGATTGTTTCATAGAAAA GGTAAGCTT[T/G]CTGGGAAAGCAGGTATGGAGAATTTTTATTTTAAATCCT TGAAACTGTGACAGATGTTTA 28 A3_ CAGCACAAACATCTCCTATTCCTTCCTTTCTCATTCCATAATCCTTTGAATA TGCATCCA[A/T]TAAAACACTTAACACATTGTTCTGTGTCAGGAGTGTCTGT CTCTGATTAGACCAGCAGTT 29 B GGGTAGGGTTGGGAATGAGGGTGAAGGTAGAAGGAGGGATAGAAGGAC AAGAAGAAGCAA[A/G]GAGCATCCTGGACAATCTGTGTCATTAGCTTCTGT TTGCACATGGCCAAGGCACTTGCTT 30 B CCTTCCTCTTCACCCTGCCTCTCGGGCATGAGTCACCATTTCCTCTTAAAA TATGGAGAA[A/C]TACCAAACGTGGCTTTCATGTGGGTTGCACACGTGGTA ATGACTGAGTTGGGAAGACCAC 3 1 B1J TGGAGGGCATCAGAGATGTTAGACACCATGGGCAGGCTTACCTTGAATTT TAGGTGCTCC[A/G]AGGCTCTGAGGTTCTCCATCATAAAGTCAAGGATTTG ACAAGACTTGAAGTTGTTATTGA 32 B1_ TACTTGGAAATGTTCATTTCTGAGCTTCCTGTCTGTCGTGGAATTGCTGGA GAATGGAAA[A/G]TGGGTTTCGTTTTCTCTGAGTAGTGAGGACTTTAAGCC TCTGCACACATTTGTTGCCTTT 33 B AGTCATCTATAACTCAGAAAAAATAAGCAACAGTATAATCCTTAACCTTGT TAACAGGGC[A/G]GGGGTGTAGGGGGCAAGCACAAACTAAAATGACACAG GGTATTTCACTAGTTTTTTTTTT 34 B1_ TTTTAATGTATGCTCTTTTATAAAATCTGCATGGCCATTCCGTGTATATGC GTTTTTAGC[A/G]TGTGCATAAATGATATGTTCTGCGTCTCATTTGGTTTCT TATGGTTCAGTCAGCACTGTT 35 B1_ tatgtaaacacttattgagtatctattgccctaaagggattcaacaacagct CGATCATA[A/G]TTATAAGGCACAAAAGAGAGATGAGTTTAAGTCTCTACTT TGATTTTAAAAACTTATATT 36 B CAAGGACCCAACTTGGGTCCCATCCCCATGCCCCACCTCACCCCACAGC AAGACGTCTTT[T/C]CCATATTCACTGCTCTTCCCTTGACTTCTGAGAGCTT TTGCAATCTACATTTTGACATTT 37 B2_ TAGGAGGTTGATGAAAGGCATCCGGATCAGGGCCAAGGGTTTGATCAAA AGCCCAGTAAT[A/G]AGAGTGAGCAAAGTGTAATGTTAAAGAATCAGAGTG CATCCTACTCAGATGTGGCAAAGG 38 B2_ ACAGATAAGTGTCCGTGTTCAGTGGGCTCAAGCCTCCTGGCTCAAGAGA CTATGGTTTGA[T/C]CAGTCTTCTAGGTGAATCAAAGATAGCTGACTCTGA GGCTTTGACCCTGGATTTCAAGAG 39 B ACAGAGGGCAGTCACCATGGTCACTAGTGGGGACAACGAGGGAAGACTC TCAGGAGACAC[A/G]AAGGTCAGAGTTTACTCTAGTGCCAATAGTAATAAC ATTTACGAGGTCCCCACTGTGTGC
32 Table 1 - SNP sequences useful for breed identification test SEQ ID NO: SNP ID Sequence 40 B AGCTCTACAGTTCTGGAAGCTTCCTTAGGCTCCTCCTCTACAGTCCTAGG CTCAGGCACA[T/C]TCTTCTGGGTGAGGAAGCATCTGTTCCAGAGGATGA GTGTTTCAAGGTTGACTTCCTGAA 4 1 B CAAATGGGCATAGGTGTTCAAAATTAAAATTAAGTCGTCTGGCATCCAGAT GAGAGAAAT[A/G]GAAGTTAGAAGTCAGGGAGACGTTGTGCACTGGGCCC GTGATTTGCTGCAGGGCCTCCAT 42 B3_ GGGTTACACTGTTTATGCGGTTGTACAGATCTACAGTTCTTAACAGTTGG GTTCTGCAGT[A/G]TATTACTCTGGTGTTAAATGGAGGATCATCTGTTTTAG ATCACAGATTTATTATTCTATT 43 B AAGCAACCAAAAGGTGAACTGTTGATGAGCAGTGTCCTGCTTGATGATAT TTATCATGTG[T/C]AGCCCCTCCTGAACGTTGACTCCGCGTCATGGCACAC AATTTTCTGATGACAATATACTT 44 B AACAAAGCAGCCCAGCTTCTCAGGGAAGTCTTCTACCTGGGTGATTACTT AACCTTTCTA[C/G]AGTTCTGCGGTATTTTTCTCTAGGGCAAAGTCGTAAAA CCGCCAGGTTTGGGTACAGCCC 45 B3J CCAGACAGCTGCCAGATCCGGGGGGTGGGGATGAGGGTAAAGGGGATG GGAGTTATCTCC[T/C]TGCCTTTATGGCTGGCACCTGGAGCCAGGCTGGG TGATTCAAAAGCACTTGGCCAGAGAC 46 B GGCAGTGTGGGAATAAATATTTATAGGCTGGGCTCTGAAACCAACATATT CTCATTTTTT[A/G]TAGAGCCTTGGGCCAGGCCTATGCCAAGTGAAAATTA ATTTACCCAAGAATTTCTTTTCA 47 B TCCTGCCATCACAGTGGGCACCTGTCAGGTCACAACTACTGACCAAAGA GAAACCCAGCT[C/G]CTCACTTCTGCCCCTCCCACAGATAAGCAGAACCC CCAGGACCACCATCACTGTGAATGA 48 B3_ GCCTGATGTTTTCTGGTTGGTGGGTGTATTTATCCTTGTTCCTTCTGTCCT GACCAAGTC[A/C]CTTGCTTCTACAGAGTGAATGGAGCCTAGACTAGCTAA AAATCAAGATTCTACCACTTAC 49 B4_ ATTAGAAACATACCAATAAATGTTATTATTTGAAAAAAGATTTTAGACTCAC TGAAGCCC[A/G]CAAATATTTAGGCTTTGCCCAAATTTATTTCTACACTACA GGAATTTGCTCAACTACTTT 50 B AGGCCAGAACAATAATATGCCCTTCCGGAAAGGTCTATCACATTCTCAGG AGGCAAAGGT[A/G]GCTTGAAAAAGCATACTGTAATGTACACATCTAGGAA GGTGGAAGGAGCCTTCACCTGAT 5 1 B TTTAATTATTAGTTGTACATGATGCATAACCACTGAACTTTCTCTGCATTAA CAGGATGA[A/G]TATCAGGTAATTAGTGCTCTGACAGTGCTCTGATAATTA GTGCTCTGAGTCCTAGCATTT 52 B4_ CTTCTCTTGGCCTGGAGAGAGCATTGAAGCCACTCCCTCTGTGGGTGCC TCGCTCCATAC[A/G]TAAACACATGTCTACCATATATACACAGGCACACAC ATTTGTCATTCCTTCCCAGAATGA 53 B4_ AGTTTGTGCTCACTTGTGTTTTTTCCTAATTGTTTTATGTGGAAATGTTTTA TCTTCATG[A/G] CAGCAGAACACATTCCTTGAGGAAAAAACAATATGTCTT CACTTTATTTTGTCCCCTAAT 54 B TGAGGCCTGGCCAGATCTCCCTGGCCATCTGGGTCCCCTGGCACAGCTT CCTTTGGTGAC[T/C]CGAGTAATCGTAACAGTTGCCATATAATTGAGGAGC GGCCATGGTGTGCCATACGTCAGC 55 B4_ GGTGTAAGGAGAGAAAACGGAAAAGCTATTTTAACATGAGTTCTCTCAGA ATGGCGTCAT[T/C]GTGAGACCCTTGTACTTTATTCTCTTTTTGCTTATCTG CATTGTTAAGTGATCTGTAGTA 56 B4_ TTTGTTTGTTACAGGAGATTAAGGGCCTGGCTTCTCTTTGACTCTTTCAAG TTTACCCAA[A/G]TTCAGAAGTAGGATCACAACACAGCATTTTGTGTGGAG AACCATGTCTCAAATATACAAC
33 Table 1 - SNP sequences useful for breed identification test SEQ ID NO: SNP ID Sequence 57 B TCGCCCATATGGAGTGCAGCAGCCCCTCTGTTAAGGCAATTATCTCATTA TCGTGGGACT[T/C]TTGAGGCTGTCTTTTATGCTCACCATGACTTTCTTAAT GGGTTTCATCATGTTCGCCTTT 58 B GCCCCGTCATCCAAACTGTTCAACAGGGGAAGGGTGTGAGGCTGACCTA TGTTGTCCACA[T/C]GACCCCAGAAGGTCTAAGAGAAGCAGGTGTCGTTG GTGCTCAGCAAGTGCCCAGAGCCCC 59 B4_ TTCATAATGAAGCCTGGAATGCCTTCCTCCCAGTTCCATTTGTCCTGCTCC TCACCCCAT[T/C]ACTCTTTATTTCCTCTCCTGCTTAAGTTTTCTTCAGAGC TCCCACCCTGTGGGACATGCC 60 B ACCCCTGCCTCCTTTCCCTCATACCTAATAGGAGTCCTCTGTATGTTCACC AGTGCAGCT[A/G]AATCAAGCTGCTGAGAGTTAACCAAATAAAAGAAATAG GTCTAGCTCTCCTGTAACTGGC 6 1 C ATCTATCTGGCAGCCCTTCCACCAGCAGTGTATTTCCAAATATCCCACGG GGCTGTCCTC[T/C]GTCTCTACTGTGCCATCCTTTCTGTCTGGACCATCTA AACAGAGTTTTGGAAGCACCACA 62 C1_ GTTAAGTGTAAGCTGCTGTATGGGGATTATCATTATTTCTTTTGTCAGTGA ACCATCACT[A/G]CTCTTTGCTCCCTTGCCTCCCCACCTCTGTCTGCCCAC CCCCTTCTTGCCAACCTTTCTT 63 C GCCCCTCTCATCTTGGGCAACACTTCACTGGGTGAGTGATTACAGCATTT TTCCTCTCAC[T/C]GCCAAGCTGGTCCTCCTGTCCCCTACTTTGCTCTCAG TCTATAAAAACTACTTTTTAAGG 64 C TGTTGACTAATGTGAATAATGATTCTTTTTTTCTATTAAGAAAAGAGAGGAA CGCATCCA[A/C]GTATTGAGTACACTACCAGCCAGGAATGGTGTATTTTAC AGGTGGGCATCTAATCTAAGA 65 C1_ TGACTATCTTGCCCCCTTCCTTTTGTAGCAACCCTGTTCTCCAGGGTCTA GTAAGACAAG[A/G]CATGGGAAAACACTTTGCCGTTGCAAAAGCATTGTAT AAAGTGATGCACAGAAAATGGGA 66 C1_ TGTGAGGATATGGAGACATCACATAAACTAACAGACAACTAGACTTAATCA ATGGTGGCT[A/C]ATTAGGAGAAGACTCAACAGTGGAAGCTTCTTAGTTGG GCACCGAAGGTTTCCTGGGAGC 67 C TGTTCAGATATTTGGGTGTTCTGGTTCAAAACTGGTTTCTCTCAAGATTCT GATAGACCT[T/C]GCCAGCTGCAGATCCCAGCCACCTTCAAACCCATCCTT AGGTGGCCTCCTCTCGAGACTC C1J96397 AGACAGCGCCATGCCCGCATCCCGCCACCCTCCCCTCACGCGTCTTCCC TGGTAATTATG[A/G]TTTTCAAAACTCACCTGATATAAAATTTACCACTTAAC CTTTTTTATTACTTACTTATTA 69 C1_ TCAGGTACGAAGGCTCAGGTATGGAAGGCGGGTATTTTTTAGCCTTGAGA AAGGTTTAAG[A/G]TCAAGAAGGACAATGGGTTAAGCCATCTGAGCAAAG GATCATCTGGTCAGAGACAGGAAA 70 C GGGGAGAGCACATGGCGGGGAGTGGGGGGGCAGGTATACGAGATGTTG CTCCAGTGGAAC[A/G]GATAGAAAATGAGAGGAAGAGGTTAGACAGGAAG GGGTTCGGGTTGATGCTTAGTTCTAG 7 1 C2_ AAAAGTTGTAGAAAGAAAAAGAAGCATACAAAAGTGCTCAGTGAAAAATG AGAGGATATC[A/G]CCCAAAGGCAAAGGAGCTACAAGCATGTATTGACAT CATAGTACGGAGTACAGACTCAAA 72 C2_ GTTCTCTTCACACACGCCAGGATATAAACACAAACTTTGCAAAGGCACTT GTGCCTCACC[T/C]GCTCATTTTCATGCATAAATCAACGGCTATTTCTTACA CAAATGGAAACAAATTTAAATT 73 C TTCAGCAATGGTATAATATCTCTGCAGTCTGGATTACCCAACAGGCAGTT CAAATACACA[A/G]TTAGGTGTCCCAAACTTTTATTGCTATACTTTTTCATTT TTAATATACCTATGGAGAGTT
34 Table 1 - SNP sequences useful for breed identification test SEQ ID NO: SNP ID Sequence 74 C2J TTGCTACTGCTACCAGGCACAGAGACTATTCTGCCAGGGCAGTTAATTTT CAATCAGGAT[A/G]CACATTTCAGGGTCTGGGGTGCAGGCATATGCAGTT AGGGCAAGTTCCCCAAGAGATTTT 75 C2_ TTGTTCCAAGCGGGAGGGTAGACCTGAGTTCTCTTGTCTGAATTATCCTA TTTCCTCATT[T/C]TTTACCGTGGAGCCGTCTCCTCTGGCCCAGAAGCTTC CTGGAGCCGAGTCTATGGGTTGT 76 C2_ TAAATAAAG GAGCAAATGAATATAATGG GCTTATTCAACTCTCAAG AATAA AGATGGGTC[A/G]CTGCTTTTAGGAAATGGGATGTGTAAACACCCACCCA CACCGTCCTTCCCTTTCACCATG 77 D1_ AGGAAGAAGGTTATGTTATCCAGTGTACCTGGTGTTCTAAGGGGAGGCTC TTGGAATTCA[A/G]ATACAGGCCTGTCTAATGCTGAAGGTCTTGACTTCTT GGCCAGGCCATCTTGTTTTCAGT 78 D1J GATATTCTGTACAGCTGTTGTGCAGCTTGTTGCCACAGCAATGGCTAAAT TTCAAAG GTG[A/G] GCCCAGGATATGTGAAGTAG GGCATAGAAGATTTCC AACACACCCAGGAACCTTTCCGGG 79 D1J GCAGATGTCTTGTCAAAACAGAATAAGAAACTGTGAAGAAATAGTCTGTG AAACCCAGCC[A/G]TGTCCTGCTTCCTCTCATTTCTGGGGTAAAATAGCAG CGGGGGGAAAAATGGCTTTTAGT 80 D1_ GTGAAGAAAGAGGAGTGATGGGGAAATCTGGGCTCACTAGGTGTAGCCA CTCTCTCCTTT[A/G]GAATGTACTGGCTAAGCACTGACATGTTCTTACTATT CAGTTGCCTTCCTTATACAATTT 8 1 D1_ TGGGTCCAACCTTTTAACCCATTTCTTCACCCATTTGTCTACAGTGGAGAC ACCAGAAGT[T/C]GTCTAGCATCTTAAGAACAATTGCTCTCACTCTGAATG GTGGGATAGTCTGGTTGCCTGG 82 D1_ CACCGAAATCTCTTCCATCGATGTCCAGGTGGTGCCAATTGCAAAATATT GCTTCCCTTC[A/G]ATAGTATAAGGAAGTACACGGTCTTTTGCTCCGTACT CGTGAATAACGAATGGGAAGCTT 83 D1_ CTGGCCTTTGGCTCAGGAATCTGTCGGCGAAACCAGTTCTGATTTCTTTT GCCCCAAATC[A/G]TTTGCTCAAAGGTAATGAATGCGGTGGCAATTCTCAG TTTGTGTCCTGCTGTAAATATCT 84 D1J CAGTGAAAGGGCACCTTACCAGCAAATAGGCTTAAGCGACGACCTTACAT AAAGACAGGC[A/G]TTTGGAACCTTCTGCCCAGAGCAGCTCCACCCTGGA GATCCTGCCCAACTTCCTGATCGC 85 D1J ATGGGCATGGCTTCCCAAGACATATTTATGAATTGAGGATCTGATAGAGA AGGTAAGATG[A/G]GGTCAAAGTGGGGAAGTAGTCAGCTCTAAAACAAAA ATGAGAAATCCCGGGGATTTTAAG 86 D1J GTGGCGTGAACCAAGATAGTAGAAAAAATGGTACCAGTTTCGGGGAGTC ATCAAAGGGTG[A/G]TGTGTTATCTATCACTCATCTTCGGTACGGAATTCC TGCCTACCCTGAAGATAAGCCTGG 87 D1J TTCTTGTGAAAGCCTACCCTTCCCACACAGCTGCAGCTGCTTTGAATGAA TGGGAGTTCA[T/C] CTG GGGGGAAATG GTCTATTG CTCTGGGGAATTGCT GTCCTCCCCAGAGGCTGGAGGGCA 88 D1J CCCCCCCCCAAGCTTGGGTGGGTTCTCTTACTAACAATTTGTAAGCACCT GGGAGATGCA[A/G]AG GTGCTTTTTATTAATTTCTTAACTTAAG GAAACATA GCTGAAAGGAAATTCTGGATTA 89 D1_ AGACCAGAATGGGCACAAAAGGGGTGTTAAGAGAGTGCCACCTAATGGA AAATAGGAACG[T/C]CTCCCTGGGTTGCAGAGACAGGTTCCAGAGCCCCA GAGACCCAGAGCACCAGCCTTAAAA 90 D2_ TGAGCTAAATTTGCTTTTTGTGAGAAATTGATGTCAGTGTTTTCACTGCAT TTATGAACA[T/C]GTTATCATCTTTGGGAGAGAGACCAGAAGAGTAAAATT GAAGAAGAGTACAAAGGGATTG
35 Table 1 - SNP sequences useful for breed identification test SEQ ID NO: SNP ID Sequence 9 1 D2J ATGGGAAGAACGGGGACCGCTCCCGAAAGTTCCGAGACTTTCTATCCTG GAAGAATGAAG[T/C]AATTCCCACTCTTGTCTCCAGCCGGGGAAGGGGGG GGTGGAGAGTCATGTGAGCCGCCCC 92 D2_ AATGGAGGAATTTTGCCTTGTGAGCCTTCACTTACCAACAATGATGTGGG TACCTAACTT[T/C]TGGCGCATTGATCTCTTGACTTTGCTGTACAATTTTAA CCTCTGCAGCTTTAATTATCTT 93 D2_ TACCAGGTTGGAATCTTCCTTTCTGTGTTTTCTCTAGGGTTTCTAGGACAC ATCTGCTTC[A/G]TTTGCCCTAAATCTGAGTCCCACGGGGATGTGTAAACA GTTATTACATTTCCCGCAGGAC 94 D2_ GGGGCCCAGACTGTGAGTGTGTGCAGAACCAGAAGAAATAGGAGTGGCC CATGTAGGCTG[T/C]TCCTTCTAGAAGTGCAAAGAAGAAGCTGGAGGACA GCTCAAGAAGGGTGTGGGGTCAGGG 95 D2_ AGGAAGGATGACACTG ACTGAATTCAG GCCCTGGGAACTTTAAATTTCAA TCCTATCTCC[T/C]CTGCTTGACCACAGTGCTCACAGATAGGACCGTGTTT TTGTTGTGAACTTAATTACACAC 96 D3J GCAATGCTTCATTGTGGTTATTCCAGAGAAGACAGAGCAATCCAAGCCAC CCCACTGATG[T/C]TCAGGAACAGGTCAACCAATTCATTTGGGGGCACAG CGTATCCTTATCCGTGCCACACCG 97 D3J AATAAGAGACTGCATTTCATTGAATCCTCTTTGAACCCGTTTTGCTATTCC AATAAAGAG[A/C]CCTGCAAGTCCTGATTTCTCTGGAAAATGAATAATAATC TTCTAATTTGTTGTTTCCTCA 98 D3_ TTTATGGAATGGAAGATGAACCTTGATGGATGATAAAGCATGTCATGAAA GTGGATGCAC[A/G]GAAGGCCAGAATTCTTCAAGTTCACAAGAACCTGAC CAGCGCAGTGACTTCTTTATGTAC 99 D3_ TGGTCTCATGGCTGAGTCAGCACCTGTGCAGAGGCGCAGAGGCACTAGA CTTCTCCCACT[C/G]GTTGCATTTAACTGAGGGGACACAGCCTGTGTGCTT CCTGTAGGGAACAGAACAAGTAAA 100 D3_ CACACAGGCATAGCCAGAAGAAGGCAGCCAAGCCAGATGCTGGACCAGA CTCCACAGTCT[T/C]CTGGAAAATCATGAGTTGAAAAGGAAACCCTTAGCC ACCATATAATCTTGTGGCTTAGTA 101 D4_ TAGCTGACTTTAATTCTCCCACAAAGAGAGGAAATTAGCCACATTATTTTA AAAAGAGAT[T/G]CTTCATTTTACAAAAAGATTGCTGAACATTTCCTAAATG ACAATAG GACATTCAAAAAAT 102 D4_ TTCCAGAGTGACGAGGACGCATAGTCGCTGCCCAGAGAAGATGAAGCAC TCTGGAGAGAT[C/G]AAAGGCCATTGAGGCCTGAGTGGCTGTACAATTTA GCACTGGGGGTTCTATTCAGCAGTC 103 D4_ CCTCAATGTATGGTGGTGGCTGAAAAGCTGTTGCAGCTTCATGCCCAGAA ATGCACGTGT[A/G]TACATGAATACATGGGTTTGTGGATGGATTTTGCATG AGTGCATATGTGGGTCTGCATGT 104 E1_ CTGCGTGACTGTAATTTTCCCCTTGAGCCCTGGATACAAATAAAGAGCCA GCTAATACTT[T/G]CTTTGCCCTTTTTCTACTCTCCCTTTGCTTAACCCACA GGTATTTACAAGGTTTTGGTTG 105 E1_ GTGAGTAACATGGTCCACATACCCATGGAATGGGTGTCCTGAACAAGGTC TGGGCAGTAG[T/G]TGACAATGAACTGAAAATAAGTGGAGTCATTTCCATG ACCGTAATGATAACTCTATGATG 106 E1_ TTTTATTTTGTTGATTTAGCGAACATTTATCATGTGCCTTCCATGTGTGTGG TCCCAAAG[T/G]TGGAGTAGTATTGAATAAGGAGGGCAATTCTGACCCTCA CCCAAGAGGCGGTATGAAGAA 107 E1_ AACAGGAGAGTAGGGCTCATATTGATTAGATATCTGTCACGGGTTGGGAA GGTTTACCGT[A/C]ACTGTGCTATCCATTTTGCATATCAGTCTTCTGACATG TCCTCTTACATCCATTTTATAG
36 Table 1 - SNP sequences useful for breed identification test SEQ ID NO: SNP ID Sequence 108 E1_ GACGCTTAACCAACCGAGCCACCCGGGTGCCCCTCCTAGGAGGCGATCT TGAAAAGACAG[A/T]CATAACAGTGCTCCATTATGTGATTTTCAACTTTCTC AGTAAGCATTACAGACTGCCCAG 109 E1_ TCATAAATTCCACCTCCTTTTGCAAAGGACTCCTATGCTTCAGCGTTTCAT TTTAGATCG[A/G]TAGAATTTAAATTTTCTTGGAATTTTAAAATTCACAGAGA ATCTGGTCTTTTCTTTTAAA 110 E2_ GCAAGATTTGCTTTCCTCTGTATCACCGAGGCAGTTTGCTTCAAAGAACA ACTATTTGAC[T/C]G GTCAGATG CTACTTGCAGG CAGAGGGGAGTCAAG C CTCAGCACCTTTG GGTGGCACATG 111 E2J TTTACTTGTAGTATAATAAATGCCATTAGCATGACTAATCACACACCTGATT AGACAAAC[T/C]GCCCCTCCTCCCCTAGTGTATTTCCTGGATCCTACACCC AATAAATCCAGCATTGATGCA 112 E2_ GGAGGGCAGGGCCTGGTCTTACCCAGTATATCAGAAGCAGCCAGGGTCG GTCGCCTTCCC[T/C]CCATCAAGTGCTCCCTATGTCCTCCTTGGCTGCATT CTGTGAAAGCACTAGAAGGGAGCT 113 E2_ TTAGGGGAGCAGGAGTTCAGAGACAGGCTTTTCTAAGGACAGGCTTTCAA AAAAAATGTG[T/G]TTTTTTTGGTTTATTTTACCCTTTTGAAGACCTCACAAC GTATAGTAAGTCACGTCAGGG 114 E2_ AAGCCATGTTGGACGATCTCCAGTCTCTGCGAAAACATGTGACACCATTG TACATTCCCC[T/C]GGTTAAAACACTTCATTCCCAGTTTTATTGTGTTGCCT GTGGCCCCTTACTTTTGAGGCT 115 E2_ TCTGGGGGACGATGGACTCAGGAGGGGACCTGAGAAGTATGTAGGAGAA GGCAGGCTAAC[A/G]AAAGGAGGGAGAGTCAGCCGAGTACCAGAGGTGG GGGCAGAGAGGCTCAGTGAGGGAGCC 116 E2_ TACATTCTAGTTCAGGATGGAATGAATGAGGGAAAGAAAAAGACGTTTTA ATTCCTCAAG[T/G]CTTTCTGGTGTGCAAGTCCCTTTCTGGGAAAGCACAG GTGCTGGTCGAATTCGTTCCCTG 117 E2_ GCTAATTTCTCTGAGAAATGGCTATGCCATGGGGACCTCCTGCTAAATGC ATGCAACAGA[A/G]TATTCTAGAAGCATGCTAAAATAGATTCAGGGTCCCA TGCCAGCCCACCTGGGCTTGCTA 118 E3J CAGTTAGTAAGCACTCCTTTGGTTAGTACAGAAAAAGTGAAATGTTGGAG GTGTGAGAAA[T/C]GCGGTTGGGGGCATGTTGAAGGACAGGGACACGCG CTTTGTGACTGCCAGGTTTTGAGAG 119 E3_ TGCCGCTTCAGATTGGGGAGACAGGTTCAAGGTGACTGCCTCAACATAC CCAAGTTCAGA[A/G]GGAGGAGCTCCGATCATACACTGTGTCTTCCCCGT GACACCACATGCCCTGCCCCTGAGG 120 F1_ TCTGTGGAGGTGATGTGACAGCCAGGGCACTGTTGTCACCCAGAGAATA CAGGCATTTGG[A/G]ACTGCTATTAAATCTACTGAAAGCCAGTCACTGCAG AAGAAGGCAAGCTATAGGCCTGCT 121 F1_ TGACCCAGGGTCAAATTTGGTGGCCTCTTCCTTAGCGGTCAGCTTAGCAG TGAAGGTCTG[A/G]CACATGCTTCCACAGCACATGCTTCGATAAGTGGCTA ACGAAGAAATGAATAAAAGAGCT 122 F1_ CCAAAAGAAACAAAACTGCCAAGTAAAATTGCACTCCAAGAACTGGGCAT ATGCTTTATT[A/T]ACCCAAACCTCATGTTTATAAGACTCAGTACCGACTCT AATTCAGGCTAGTGGGTCACAA 123 F1_ CACATTATTTGTCTGTTCCCACATGATCTCAATGAATGTAAATTCCTTTCAT CCTGAAGT[A/G]GCCAGTAAGAACACACTCTTCCAGTGAGGCTCCCTTCCT TCAGACCTTTCTGATTTGCAC 124 F1J CTTTACAACGAAGAGGTACACATTGCTAATGGGAGTCACAGTACGGTGTG GGCAAAGGTT[A/G]ATTTTTTCTTAATTCTTGTAGAGGCGCCAAAAAGTACA CACAACTCCTACTCAAGTTCAC
37 Table 1 - SNP sequences useful for breed identification test SEQ ID NO: SNP ID Sequence 125 F TGAGAGTTTGGACTTGAGGTATCCTCGTGTTAAAAACGTAGACATTGGTG TTTCGAAATG[A/G]TGGGAGAATCAGACATTGAATATAGTCAACGCGTTGT AAATTAACATTTCCTTCTAGTTG 126 F CTCCTTTTCCAATCTCATCTCTTATCAACTCTTTCTATGCACCTTATATTCA GGCTATAC[T/G]GAATTACTGGTGGTAGCCTGAAATGCTGACCTCTTTACT GGAATACCACCTTTTCCTTAT 127 F1_ TGCTTATCCACCTAATAATATAATTCAGTAATAGCAATACAAAAGTATGATC TTTGTTTG[A/G]TCCCGATTCACACAACCCAACTGCAAAAAGACCGTTGAG GATATTTGGGTGCTTACTGGA 128 F TAACCTAAAAACGTACAGTGGGAATGCACGAGTACCCAGCAGTGCTTCAG GCAATGCGTG[A/G]CTTGTTAGTTTGCTATGTTTGGGGACAGATTCTTAAT GTCCTCAAATAAAATTCCAGATA 129 F AAGACAGCTACATTCCAGAGGATCCAATTTTGCCTTGTAGAGTATAGACAT CCATGGCAC[A/G]GGCCTTGAAATAGCCCAGCAGGGGGAATGGTTGAAAC TCCAGGAGCTGTGCCTTTATAGA 130 F2_ TTCCTTTTATGGCCTGGAGAAGGTTTTCTAACTTTCCGCTACATGCCATCC GGTCTGGTA[T/C]AACTGACGAAAACAATTGTTGAAAGTACTGTCCTCTGG TTAAATAAATTATGGTACGTCT 131 F TGACTGCACTTCCTTCTGAGCTGGAGGAGGGGCATACAATGCACCCACT AACTAGGTATG[T/C]GATTCCCGGTCCATCAGAACCTGCATTCCCACCAGC ACCTTAGCCCCTCTCCACGTTCTC 132 F AAAGTGTCATCGATGCCCAAACCACGACTGATGAAGGATGGGAATCAAAT CGTCTGTCTT[T/C]GTAGAGGCCACCAATGGTACTAACCACGCTGGAAAC GAACGCCTGTTGGTTAAATGTACA 133 F2_ CCAGTGTACCTTTTGGTAACCATTTGCATGGGTGTTTTGCTGCATTAGAAC ATGTGAGTC[C/G]CTCTAGCACTTGTGTGCGGGAATCCCACCACCAGGAT AATCTGGAGGTCATGTTACGGAG 134 F2_ ATTTTGTCACGTAAGCAACACTGGAATTCTGAATGTGTGTTCGCAGGCGC TCACATAATT[A/G]CCAACTGTGATTTTAGACGAGCCTGTGCCTCGGATCC CAATATTATTTATCATGCACGTT 135 C AATCCTAACATTCATTAAAAGGAAACTGTAAGCCGCGACCGTGTGAGATC ACGTGCTTCT[A/C]GATTTACAAAAGAATTCTAGTCCTTCAGCAGCTGTTTA AAAGTACTTTTAACTAACTAAA 136 D2_ acagatattcttttttatagccttttacttattagaagaacgataggtactc GTGATACT[A/G]CGTTTTGAGCTCTGAGAAGATACGTAGAATCATTAAGTC ACCGGGGGTAACTGTCGTCAG 137 B4J CTCTTGCTGCCCTAAAGGTGGACTGAAAATGGAGTTGGGTGATCATCCCC AGTGGATGCT[T/C]GTAGCACTTAGCTCATGATATGTGCTCTATAAATATCA GCCTTTATAAATTATTAGTGCT 138 D ACTTAACCCAGGGAATTCTTCCAGGAAGCACTTCAGAAAATGGAAAGCAC CACATGGCAG[T/G]TTTCTTCTGGGTTTAAAAACTGCTATTTGCGGGTACC TTTGTTTGTATTTTCAAGCAGGA 139 A3_ AGAACATTGACCTTGAATGCATGCAGTTTAGGAAGTGAAGGCCAGACCAC CAAGGAGGCC[T/C]ATGTTGGCTGTGTTTTCACATCTTGCTTCCCCTGGGG AAACCAGGGCTGGGGCAGGAAGG 140 D1J GGTTTCTGGAAGTGCAATTCCTCAATATCCTGCCTCCCAACCAGGTAGGC AGGAGAGGAA[A/G]ACCTAAAATCTG CTGAATTACTTTCTTGAATTTG GCC TGTTTTCCAGGCTGTCTACTATG 141 E ACTAACGTCAAGACCCGTCTGCATCCCGAGGACAGGAAATAAGCAACTCT GTGCATTTGC[A/G]CAAGACCTTGCGGAAGACCTCATTACAGACGAGTGG ATGTTTGCCCATCAAGCTCTTTGT
38 Table 1 - SNP sequences useful for breed identification test SEQ ID NO: SNP ID Sequence 142 E CCCGGACGGCCCACTGTGAAGTTCTGCCCCGCATGTCCCTGAGCGTCAT CCACCACCTGA[T/C] CAGCTCATAATAGAGCTGGACTCCCCAG CACTCCG GCATCCCTCCCCCTCCCACCTGGGA 143 F AGCTATTGTTCCAATAAAATTACTTCCTAAAACTGCACTCAAATTTCAATTT ATCCCATG[T/C]GAATCTATTCAGCAATTTCCCCAACTTCTCTTAGCTGTCT GAAACCTCCTTTTCATATTT 144 F1_ CTGTAGTAACATTCCATAATGAGAATATGAGATTATTCCGGATAGTCATAG ACACAAGAT[A/C]CACTACCCTTCAGTCCCTGATAAATGCTCAGTGTCTGT GGTTTCCCTTCCATTATTATTT 145 E TCGCTGCTGGATGGCTGACGGTTTTTCAAAACCTGCAG AAAGAAACAAAG TTAGTTCTAA[T/C]CACACACTGGAAGCTCCTCGGTATCCCTGTTTAAGCC CTCACCCCCACCCCTCCTAACCC 146 B CCCCGATGTGGAAATGCTAGCTTGGGGCCCAAGTCTCTGTCTTAAGGGT AACAGGGAATG[A/G]TGTCTAGAAAGGACCTTGTGCCAAATGGCTGTGGC ACATGCCATAAGGCATCCAGGTTGA 147 C1_ CCTTCCTGAATTCTCTGCCCTCCCGTTCCTGCACCATTGAAATCCAGAGG GCATAAGTTC[A/G]TGAAACTAATAGCAAGTAGAGCGGCATAAACAGAAAT AGTTCTTACTATAAATG GAGCCT 148 C GTTAGATTCAGGGAAATTTGCATGACCTGCCCGAGCTCAGTCTTCTGAGT GAAATGGAGA[T/C]CGTCACGAGGATGGAGTTGGCTCATGTGTGTGCATG TGCTTGTCAGCCTGTATACACCCA
39 Table 2a - Intergenic SNP minor allele frequencies by breed and population. Major Minor Allele Allele chra A G chra1_ C T chra1_ G A chra1_ G A chra1_ C G chra1_ C A G chra1_ A G chra1_ c C A chra1_ G A chra1_ C A chra1_ A G chra1_ C T chra1_ C T chra1_ G T chra2_ T C chra2_ C T chra2_ c C T chra2_ G T chra2_ T C chra3_ T G chra3_ C T chra3_ G A chra3_ T C chra3_ c G C chra3_ C G chra G A
40 Table 2a - Intergenic SNP minor allele frequencies by breed and population. 2.. Major Minor Allele Allele chra3_ G A chra3_ A C chra3_ A T chrb1_ C T chrb1_ T G chrb1_ T C chrb1_ G A chrb1_ C T chrb1_ G A chrb1_ G A chrb1_ T C chrb2_ G A chrb2_ c C T chrb2_ G A chrb2_ A G chrb2_ G A chrb3_ c G A chrb3_ A G chrb3_ C G chrb3_ G A chrb3_ C T chrb3_ G C chrb3_ A C chrb4_ T C chrb4_ A G chrb4_ A G chrb4_ G A chrb4_ T C
41 Table 2a - Intergenic SNP minor allele frequencies by breed and population. Major Minor Allele Allele chrb4_ T C chrb4_ C T chrb4_ C T chrb4_ T C chrb4_ C T chrb4_ G A chrb4_ C T chrb4_ C T chrb4_ A G chrc1_ E C T chrc1_ C T chrc1_ e G A chrc G A chrc1_ ^ C A chrc1_ G A chrc1_ T C chrc G T chrc1_ A G chrc1_ G A chrc C T chrc G A chrc2_ C T chrc2_ c T C chrc2_ A G chrc2_ E T C chrc2_ C A chrc2_ G A chrc2_ T C
42 Table 2a - Intergenic SNP minor allele frequencies by breed and population. Major Minor Allele Allele chrd1_ A G chrd1_ / C T chrd T C chrd1_ G A chrd1_ C T chrd1_ G A chrd1_ G A chrd1_ T C chrd1_ T C chrd1_ A G chrdu G A chrdu A G chrd1_ A G chrd1_ G A chrd2_ A G chrd2_ A G chrd2_ G A chrd2_ C T chrd2_ C T chrd2_ C T chrd2_ G A chrd3_ C T chrd3_ C G T chrd3_ T G chrd3_ G A chrd3_ C G chrd3_ T C chrd4_ A C
43 Table 2a - Intergenic SNP minor allele frequencies by breed and population. 2.. Major Minor Allele Allele chrd4_ G C chrd4_ G A chre1_ C A chre1_ G A chre1_ G T chre1_ g t chre1_ C A chre1_ A T chre1_ G A chre2_ G A chre2_ G A chre2_ C T chre2_ G T chre2_ C T chre2_ C T chre2_ C T chre2_ C A chre2_ A G chre3_ G A chre3_ C T chre3_ C T chrf1_ G A chrf1_ C T chrf1_ A T chrf1_ C T chrf1_ A G chrf1_ G A chrf1_ G T
44 Table 2a - Intergenic SNP minor allele frequencies by breed and population. Major Minor o Allele Allele chrf C A chrf C T chrf G A chrf C T chrf T C chrf G A chrf G A chrf T C chrf2_ G C chrf A G Table 2b - Intergenic SNP minor allele frequencies by breed and population. Minor Allele Frequency Major Minor Allele Allele o cs> m m o 3 o ) o o o ' σ o in in < > n 3 co ' ro o. n chra1_ A G chra1_ C T chra1_ G A chra1_ G A chra1_ C G o < > n co '
45 Table 2b - Intergenic SNP minor allele frequencies by breed and population. Major Minor Allele Allele chra1_ G chra1_ G chra1_ A chra1_ A chra1_ A chra1_ G chra1_ T chra1_ T chra1_ T chra2_ c chra T chra2_ T chra2_ T chra2_ c chra3_ G chra T chra3_ A chra3_ C chra3_ C chra3_ G chra3_ A chra3_ A chra3_ C chra3_ T chrb1_ T chrb1_ G chrb1_ C chrb1_ A chrb1_ T
46 Table 2b - Intergenic SNP minor allele frequencies by breed and population. Major Minor Allele Allele chrb1_ A chrb1_ A chrb1_ C chrb2_ A chrb2_ T chrb2_ A chrb2_ G chrb2_ A chrb3_ A chrb3_ G chrb G chrb3_ A chrb3_ T chrb3_ c chrb3_ c chrb c o. chrb4_ G chrb4_ G chrb A chrb4_ T C chrb4_ C chrb4_ T chrb4_ T chrb4_ c chrb4_ T chrb4_ A chrb4_ T chrb4_ T chrb4_ G
47 Table 2b - Intergenic SNP minor allele frequencies by breed and population. Major Minor Allele Allele chrc C T chrc1_ C T chrc1_ G A chrc1_ G A chrc1_ C A chrc1_ G A chrc1_ T C chrc1_ G T chrc1_ A G chrc1_ G A chrc1_ C T chrc1_ G A chrc2_ C T chrc2_ T C chrc2_ A G chrc T C chrc2_ C A chrc2_ G A chrc2_ T C chrd1_ A G chrd1_ C T chrd1_ T C chrd1_ G A chrd C T chrd1_ G A chrd1_ G A chrd1_ T C chrd1_ T C chrd1_ A G
48 Table 2b - Intergenic SNP minor allele frequencies by breed and population. Major Minor Allele Allele chrd1_ A chrd1_ G chrd1_ G chrd1_ A chrd2_ G chrd2_ G chrd2_ A chrd2_ T chrd2_ T chrd2_ T chrd2_ A chrd3_ T chrd3_ T chrd3_ G chrd3_ A o. chrd3_ G chrd3_ C chrd4_ C chrd4_ C O. chrd4_ A O. chre1_ A O. chre1_ A O. chre1_ T chre1_ t chre1_ A chre1_ T O. chre1_ A O. chre2_ A chre2_ A O.
49 Table 2b - Intergenic SNP minor allele frequencies by breed and population. Major Minor Allele Allele chre2_ C T chre2_ G T chre2_ C T chre2_ C T chre2_ T chre2_ c A O. chre2_ A G chre3_ G A o. chre3_ C T O. chre3_ C T o. chrf G A o. chrf1_ C T chrf1_ A T chrf1_ C T chrf1_ A G chrf G A o. chrf1_ G T chrf1_ C A chrf1_ C T o. chrf2_ G A chrf2_ C T chrf2_ T C chrf2_ G A chrf2_ G A chrf2_ T C chrf2_ G C O. chrf2_ A G
50 [0091] As appropriate, the genotypes of at least about 3, 5, 10, 15, 20, 25, 30, 40, 50, 60, 70, 80, 90, 100, 110, 120, 130, 140, 145, 148 or more, SNPs from Table 1 are determined. In some embodiments, the expression levels of all listed SNPs of SEQ ID NOs: listed in Table 1 are determined. [0092] In addition to determination of the plurality of SNPs listed in Table 1, one or more morphological features and/or the genotype of one or more phenotypic markers can be determined. The morphologic and phenotypic markers can relate to hair length, coat color, coat texture, ear, paw and tail morphology, or a known disease marker. For example, the feline may be evaluated for coat color (e.g., chocolate, cinnamon, dilute, orange, white), coat patterning (e.g., agouti, tabby, spotted, ticked, calico, point coloring), coat texture (e.g., straight or rex), coat length (e.g., hairless, short or long), ear morphology (e.g., normal, curled or folded, paw morphology (e.g., normal or polydactyl), and tail morphology (e.g., manx, bobtail, long). Such phenotypic and morphologic features can be evaluated by visual inspection and/or genetic analysis of the feline. [0093] Some phenotypic markers can be evaluated by genetic analysis, without visual inspection of the feline. In various embodiments, the methods may further comprise determining the genotype of one or more phenotypic markers identified in Table 3, i.e., as SEQ ID NOs: [0094] As appropriate, the genotypes of at least about 3, 5, 10, 15, 20, 25, 30, 40, 50, or more, phenotypic markers, e.g., listed in Table 3, are determined. In some embodiments, the expression levels of all listed phenotypic marker of SEQ ID NOs: are determined. [0095] Genetic markers for phenotypic traits, especially traits that are breed specific, find use to distinguish genetically related feline populations. For example, Birman or Siamese are homozygous for the G940A TYR mutation. This same mutation would exclude a Havanna Brown from very closely related breeds, e.g., Siamese, Birman and Himalayan. Colorpoints in the chocolate variety, such as Havana Brown, cannot be homozygous for the mutation. A Korat, Russian Blue or Charteux are by definition solid blue; therefore no other colors or patterns are present. Thus, the presence of mutations that would exhibit other patterns and colors would exclude a cat as one of these breeds. [0096] A genetic marker for long hair, e.g., the A475C FGF5 mutation, can be used as a means for identifying members of the Persian, Maine Coon, Turkish Angora, Turkish
51 Van and Birman breeds, and likewise a means for discrimination as an exclusion maker for breeds such as the Abyssinian, Egyptian Mau, Sokoke and Ocicat. The long hair mutations can also be used to distinguish different breeds that are long haired varietes within the breed family. For example, a Balinese is a longhaired Siamese and a Cymric is a longhaired Manx. Many cat breeds are designated as a breed, such as Oriental Longhair or Oriental Shorthair, just based on the FGF5 mutations. The frequency of the long hair mutations could also be used to support a breed selection. For example, the Norwegian Forest Cat and the Ragdoll have FGF5 mutations that are less common in other breeds. [0097] Other single gene traits may be used to identify members of certain cat breeds as well. For example, the G715T TYR mutation, which defines Burmese points, is found in the genomes of felines of Burmese and Singapura breeds. The cinnamon mutation, C298T TYRP1, is common to the red Abyssinian. Certain dominant traits can be homozygous or heterozygous, such as the ear curl of American Curls or the bobtail of the Japanese Bobtail. Tonkinese felines are genetically compound heterozygous for the G940A and the G715T TYR mutations and can produce both pointed and sepia cats, and genetically resemble a Siamese or Burmese, respectively. However, breeding restrictions would not allow these Tonkinese variants to be registered as Siamese or Burmese. Additional phenotypic SNPs that find use include the Norwegian Forest Cat color variant amber (Peterschmitt et al. (2009) Animal Genetics, 40: ), three additional long-haired mutations (Kehler et al. (2007) Journal of Heredity, 98: ), and the mutations responsible for hairless of Sphynx and rexing of the Devon Rex (Gandolfi et al., Mamm Genome. (2010) (9-10):509-15). A mutation in KIT (c. 1035_1036delinsCA) for Birman glove white spotting should be restricted to the Birman breed. Phenotypic genetic markers, as well as disease mutations, find use to further delineate cat breeds. [0098] Accordingly, morphological and/or phenotypic markers find use to distinguish between genetically related feline breeds, e.g., (i) Persian and Exotic Shorthair (SH); (ii) British SH and Scottish Fold; (iii) Australian Mist and Burmese; (iv) Singapura and Burmese; (v) Birman and Korat, and (vi) Siamese and Havana Brown. For example, determination of whether the feline has the phenotype for long hair can be used to distinguish between Persian and Exotic Shorthair; determination of whether the feline has curled ear morphology can be used to distinguish between British SH and Scottish Fold; determination of fur color and/or pattern can be used to distinguish between Australian Mist and Burmese; between Singapura and Burmese; between Birman and Korat; or between
52 Siamese and Havana Brown. Whereas a Burmese will lack barring and/or spotting, a Singapura possesses the dominant ticked tabby gene, Ta; and an Australian Mist will have spotting and barring. Whereas a Birman and a Siamese will have the mutation for Siamese points (i. e, homozygous for the G940A TYR mutation), a Korat and a Havana Brown will not. [0099] The use of phenotypic markers to further refine the assignment of a test feline to a breed or ancestral population is demonstrated in Tables 4 and 5. Table 3 - Phenotypic Markers useful for breed identification test SEQ ID NO: SNP ID Sequence 149 Phen CMAH G139A AATTTCTTG AGAAACAAGAAGACC RGCAAAGATTTCATTCTGTACAAG AGC AAGAATYGY[G/A]TG AGGGCGTGCAAGAACGTGTG CAAGCATCAAGGAGK CCTGTTCRTAAAAGACATCGAAG 150 Phen_ASIP_del CCACCCTGCTGGTCTGCCTGTGCCTCCTCACTGCCTACAGTCACCTGGC ACCTGAG GAAAAACCCAGAGATGACAGGAACCTGAGGAGCAACTCCT[CA /-]TGAACATGTTGGATCTCTCTTCTGTCTCTATTGTAGCGCTGAACAAGAA ATCCAAAAAGATCAG CAGAAAAGAGGCGGAAAAGAAGAGATCTTCCAAGA AAAAGGCTTCG 151 Phen_MLPH_T83del GGCAGAGATGGGGAAAAAACTGGATCTTTCCAAGCTCACGGACGACGAG GCCAAGCACATCTGGGAAGTGGTTCAGCGGGACTTTGATC[T/-]AGAAGGA AAGAAGAGGAAAGGCTGGGGTGAGTGTATGAGGCCGAGCCCGTCCCTC CGGTGTCCCCTGGAAGGGGGGGCCTCCCCGGGACGCTGGGGGTGAGC A 152 Phen_MC1 R_G250A CCTGGGGCTGGTGAGCGTGGTGGAGAACGTGCTGGTGGTGGCCGCCAT TGCCAAGAACCGCAACCTGCACTCGCCCATGTATTACTTCATCTGTTGCC TGGCCGTGTCC[G/A]ACCTGCTGGTGAGCGTGAGCAGTGTGCTGGAGAC GGCCGTCATGCTGCTGCTGGAGGCAGGCGCCCTGGCCGGCCGGGCCG CCGTGGTGCAGCGGCTGGA 153 Phen TYRP1 C298T CCGCATGATGGCAGAGATGATCGGGAGGCTTGGCCCACGAGGTTCTTCA ACAGGACATGC[T/C]GATGCAATG GCAATTTCTCAGGACACAACTGTGG G ACTTGCCGTCCTGGATGGAAAGGAG 154 Phen TYRP1 5IVS6 CCTTCACAATTTGGCTCATCTATTCCTGAATGGAACAGGGGGACAAACCC ATTTATCTCCAAACGATCCTATTTTTGTCCTCCTGCACACTTTCACTGACG CAGTCTTTGATGAATGGCTGAGGAGATATAATGCTGGTGA[G/A]ACATTCT CCTATGCTTTTTTGCAGGCTCAGCAAG 155 Phen_TYR_del975C TTAGCCGATTGGAGGAGTACAATAGCCGTCAGGCTTTATGTGATGGAACT CCAGAGGGACCATTACTGCGCAATCCCGGAAACCATGACAAAGCCAGGA CCCCAAGGCT[C/-]CCTCCTCTGCTGATGTGGAATTTTGCCTAAGTCTGAC ACAATATGAATCGGGTTCCATGGATAAAGCTGCA 156 Phen_TYR_G715T TTCCTGCCTTGGCACAGACTCTTCTTGTTGCTGTGGGAACAAGAAATCCA GAAGCTGACC[T/G]GGGATGAGAACTTCACTATTCCATATTGGGATTGGC GAGATGCTAAAAGCTGTGA 157 Phen TYR G940A TACAATAGCCGTCAGGCTTTATGTGATGGAACTCCAGAGGGACCATTACT GCGCAATCCC[A/G]GAAACCATGACAAAGCCAGGACCCCAAGGCTCCCCT CCTCTGCT
53 Table 3 - Phenotypic Markers useful for breed identification test SEQ ID NO: SNP ID Sequence 158 Phen_KIT_G1035C_BI TTTCATTAACATCTTCCCTATGATGAATACCACAATATTCGTGAATGATGG CGAGAATGTGGATCTGATTGTCGAATATGAGGCATATCCCAAGCCTGA[G/ C]MACCAACGGTGGGTCTATATGAACAGAACCCTCACTGATAAATGGGAA GATTATCCCAAGTCTGACAACGAAAGTAATATCAGGTAAGAAAAAAGCCTT ACGCTGAGGATCAGATGTTTTCC 159 Phen_FGF5_475 TGCTGAAAATATTATTACTATTTACAAGTTTTTCTTCTTTCCCCCCACCAGG CCAAATTT[A/C]CCGATGACTGCAAGTTCAGGGAGCGATTCCAAGAAAACA GCTATAATACCTATGCCTCAG 160 Phen_FGF5_474 TGCTGAAAATATTATTACTATTTACAAGTTTTTCTTCTTTCCCCCCACCAGG CCAAATT[T/-]ACCGATGACTGCAAGTTCAGGGAGCGATTCCAAGAAAACA GCTATAATACCTATGCCTCAG 161 phen_fgf5_406 ATTTCTGTCATCCTAGGTATTTTGGAAATATTTGCTGTGTCTCAGGGGATT GTAGGAATA[C/T]GAGGAGTTTTCAGCAACAAATTTTTAGCGATGTCAAAA AAAGGAAAACTCCATGCAAGTGTAAGTAGAACCACTTTATGTT 162 Phen_FGF5_356 GTGGAGCCCCTCGGGGCGCCGGACCGGCAGCCTCTACTGCAGAGTGGG CATCGGTTTCCATCTGCAGATCTACCCGGATTGGCAAAGTCAATGGCTCC CATGAAGCCAATA[T/-]GTTAAGTAAGTTGCTCGCCCTCCTGGCAAAGCGC GTCCTAAGCGGGCGATGGGGGGRTTCGGGAGGGACAGAGGCTATTCCC TGGCCCACAGGCGCACCTTCCGGAGCCCTGGCTCCTGGGACTCAGCTGT CCCTCGGAACC 163 Phen_GBL1_G1457C CCCAGGGAGTCCTGGAGCGAAGTTACGTGATCACTCTGAACATAACAGG SIA_KOR GCAAGCCGGAGCCACTCTGGACCTTCTGGTGGAGAACATGGGGC[G/C]T GTGAACTATGGCAGATACATCAATG ATTTCAAG GTAGGACCAGCCTCG CT GTCGAGGTCGATAGGACTGTGTCTGTGCCACCCGAGGA 164 Phen_HEXB_Dellntr_B ACCATGAACTGACCAAGGGACCAGTAATTGCCTCTGTCAGACTACTACTG UR CATTTTGCCTATTGCCTCTGCAACTACTTCATTTACAGCCATTCAATGATTT [TAATGTAGGTTCTCA/-]AGAACAGAAAAAACTTGTCATTGGTGGAGAAGCT TGTCTGTGGGGAGAATTTGTGGATGCAACTAACCTTACTCCAAGATTATG GTATGGAAT Phen_HEXB_del39C KOR GGCTGGGGCTGGCGGCGCTGCTGGCGCTGCTGGCGGCCGTGGCCCCG CGCTCCTCCGCCGCCGCGGAGCCGCCCTGTGGCCTATGCCGCTCTCGG TGAAGACGTCTCCGCGCCTGCTGCA[C/-]CTCTCCCGCGACAACTTCTCCA TCGGCTACGGCCCCTCGTCCACCGCCGGCCCCACCTGCTCCCTCCTGCA GGAAGCTTTTCGGCGATATCACGAATACATTTTTGGTTTCGACAAGAGG 166 Phen GBE1 Ins NFC TTAAGAATATTCATTCTAGGGGCGCCTGGGTGGCGCAGTCGGTTAAGCG TCCGACTTCAGCCAGGTCACGATCTCGCGGTCTGTGAGTTCGAGCCCCG CGTCGGGCTCTGGGCTGATG[C/-]CCAGAGCCCGACGACATGGGTCAAAC TCACCGACCGCGAGATCGTGTACCTGAGCTGAAGTCGGACGCTTCACCG TACTGAGCCACCCAGGC Phen_KRT71_G/Aintro 4_SPX Phen_MYBPC_G93C MCC Phen_MYBPC_C2460 T_RAG GCCAATAAGGAGGAGCTCCAGGCCAAGGTGGACTCCATGGATCAGGAGA TCAAGTTTTTCAAGTGCCTCTATGAAGCC[G/A]TAAGTCTGTCTCTCCACC CACCCCTCTGAGGGCAGCCAGCGGGTAAAACTCTGTTCTGG GCCTTCAGCAAGAAGCCAAGGTCAGTGGAAGTGGCAGCCAGCAGCTCTG CTGTGTTCGAG[C/G]CCGAGACAGAGCGGTCAGGAGTAAAGGTGCGCTG GCAGCGGGGGGGCAGTGACATCAGCG GTCCCCCCTTCATCAGGCTACATCCTGGAGCGCAAGAAGAAGAAGAGCT TCCGGTGGATG[T/C]GGCTGAACTTTGACCTGCTGCAGGAGCTGAGCCAC GAGGCACGGCGCATGATTGAGGGCG
54 Table 3 - Phenotypic Markers useful for breed identification test SEQ ID NO: SNP ID Sequence 170 phen_mpo_alc GTGCAGTTGGGGGATCGCAGAAGAGGGCTGGGCACATGCAGCTCCTGG TGCCAAGGTCAC[T/C]CCAGTGGGCAGGTCTTCACCAGGGAATCAAGGTC TCAAGGTATAATGCCATTCAGACTTG 171 Phen_PLAU_AG_ALC TGTATCTAAGGAAGAATGTGAGGATGAGAGATATTAGAAAGAGGAGGAAA TTCAGACAGG[T/C]GTTTTAGAGATCCTGTCAGGCCTTGCATGATTTCAGA CCTGG 172 Phen_FCAT_ALC AAAAGCTGATGTACTTGTGCCCAGGGAAGATGTCAATATTTACCATTAACT GTTGTGAAA[A/G]ATTCAACCAATGTACTCAGTTGAAGTTCTTTTCATTTTA TTGGATTAAAAAAATCACTAT 173 Phen_PKLR_1 3delE6_ CGCCCACCGGTGCCTGTTCCGTGCACGGCCCAGGCCCCAAGGTGGACA Aby GGCAATAGGACACGGGTTCCTGATTTCCTGGGGGCCCACGCCCCGTGCC CCCGCTCCAC[G/A]ACTCTGCCCCCGGCTYGCCCCTGACCTGCGCTGGC TCTTCCCATGCCTGCAGGCCCGGAGGGGCTGGAGACCCACGTGGAGAA CGGCGGCGTCCTGGGC 174 Phen_PKD1_C10063A CTCCCTCTGGGACCGGCCTCCTCGGAGCCGCTTCACCCGCGTCCAGCG _PER GGCCACCTGTTG[A/C]GTCCTCCTCGTCTGCCTCTTCCTGGGCGCCAATG CTGTGTGGTACGGGGTCGTGGGAGAC 175 Phen_SHH_A479G_H CCAGTGGCTAATTTGTCTCAGGCCTCCGTCTTAAAGAGACAC[A/G]GAAAT w GAGTAGGAAGTCCAGCGTGGTCTCAGAGAGCT 176 Phen_CEP290_PRA_ AACAGAGAGGGAGCAAAAAGCTAAGAAATACACTGAAGACCTTGAGCAAC Aby AAGCAAGTAA[T/G]TTTTCTTTATGAGAAAATAATGCATTTCATCTCAAGCC ACTCCTTGGCATTGTTTTAA 177 Phen_CRX_546_Aby TCCCCCACCTCGGCCGTGGCCACGGTGTCCATCTGGAGTCCCGCCTCG GAGTCCCCTCTGCCCGAGGCCCAGCGGGCGGGGCTGGTGGCGGC[C/-]G GGCCCCCTCTGACCTCCGCGCCCTACGCCATGACCTACACCCCCGCCTC TGCTTTCTGCTCTTCCCCCTCGGCCTACGGGTCTCCGAGCTCCTATTTCA GTGGCC 178 Phen_CMAH_del AGTAGTGAACCGCGTGCATATGCATCCTCCGTCTCATACTTTGTGGGAGC A[AACGAGCAACCGAAGCTG/-]AACGAGCAACCACCGTCCTTTCAGAATTC CCAGGGAGAGGCAGCTGCGGACCATGGGCAGGCAAGTGACAGGGGCAT TGGGTCTGGAGGAACCCGAGACCAACACTGAGCA 179 Phen_HEXB_C667T_ TCTCTGTCTCATGTTTATACACCAAACGATGTCCATACGGTGATTGAATAT DSH GCCAGATTA[T/C]GAGGGATTCGAGTCATACCAGAATTTGATAGCCCTGGA CATACACAGTCTTGGGGAAAAG 180 Phen_GM2A_Del_DS TCACTGCCGGAGAGTGATTTCACCCTGCCCCAGCTGGAGGTGCCCGGCT H GGCTTAGCTCTGGGCACTACCGCATCAAGAGGT[C/T]CCTCAGCAGCGGT GGGGAGCGTCTGGGCTGTGTCAAGATCTCTGCCTCTCTGAAGGGCAAAT AATGTGGCACCAGCCACA 181 Phen_GRHPR_DSH ACCTGGAGAGGATGATCTTCTCCCCCTGGGGGTTCTGGGTCTGTGAGTT TGCAGTGAGCCCTCATCTTTGCCCAAGGTGGGGTCCTCTTACCCACCCCT TCTCTCCTCACA[G/A]CGGTGGCTGGACCTCATGGAAGCCCCTGTGGATG TGTGGCTATGGACTCACGCAGAGCACTGTCGGCATCATCGGGCTGGGGC GC 182 Phen_LPL_G1234A_D GAGCGATTCATACTTCAGCTGGTCAGACTGGTGGAGCAGCCCTGGGTTT SH ACTATTGAGAAGATCAGAGTAAAAGCA[G/A]GAGAGACTCAAAAAAAGGTA ATCTTCTGTTCCAG GGAGAAAGTATCTCATCTG CAGAAAGGAAAGGCATC TGTGGTATTTGTGAAATGCCATG
55 Table 3 - Phenotypic Markers useful for breed identification test SEQ ID NO: SNP ID Sequence 183 Phen_LAMAN_del_PE ACGGTCAGGAACTGCTTTTCCCAGCCTCGGTGCCTGCCCTGGGCTTCAG R CATCTACTCAGTAAGCCAGGTGCCTG[GCCA/-]KCGCCCCCACGCCCACA AACCCCAGCCCAGATCCCAGCGGCCCTGGTCCCGTGTCTTGGCCATCCA AAATGAGCACATCCGGGC 184 Phen_IDUA_del_DSH GGACATCCCGACCCCCTGGACCCCCGCAGGTCATTGCGCAGCACCAGAA CCTGCTGGTGGCCAACACCAGCTCCCCCGTGCGCTACGCGCTCCTGAGC AAC[GAC/-]ACGCCTTCCTGAGCTACCACCCGCACCCCTTCACGCAGCGC ACGCTCACGGCGCGCTTCCAGGTCAACAACACCCGCCCGCCGCACGTG CAGCTGCTGC Phen_ARSB_G1558A SIA Phen_ARSB_T1427C Sia Phen_GUSB_A1052G DSH Phen_MYBPC_A74T Poly Phen_NPC1_G2864C PER Phen_SHH_G257C_U K 1 Phen_SHH_A481T_U K2 Phen_HMBS_del842_ SIA CTCCAGTTCTACCACAAACATTCAGTGCCTGTGCATTTCCCGGCACAG[A/ G]ACCCCCGCTGTGACCCCAAGGGCACTGGGGCCTGGGGCCCTTGGGTA TAGGAC CGTCTCCATACAACGATTCTGCGATACCCTCATCAGACCCACCGACCAAG ACCCTCTGGC[T/C]CTTTGATATTGATCAGGACCCAGAAGAAAGACATGAC CTGTCAAGAGACTATCCCCATAT GATTCGCACGGTGGCTGTCACAGAGCACCAGTTCCTCATCAATGGGACC TTTCTATTTCCACGGGGTCAACAAGCAC[G/A]AGGATGCAGATATCCGAG GGAAGGGCTTTGACTGGCCACTGCTGGTGAAGGACTTCAATTTGCTTCG CTGGCTCGGGGCCAACGCCTCCGCACCAGTCACTACCCCTA CTTCAGCAAGAAGCCAAGGTCAGTGGAAGTGGCAGCCAGCAGCTCTGCT GTGTTCGAGSCCGAGACAGAGCGGTCAGGAGTAAAGGTGCGCTGGCAG CGGGGGGGCAGTGACATCAGCGCCAGTGACAAGTATGGCCTAGCARCC GAGGGCACGAGGCACACTCTGACAGTGCGGGACGTGGGCCCC[G/A]CCG ACCAGGGACCCTACGCAGTCATCGCT GCTTTGCTCCCTCTTCCTGGATCGACGATTACTTTGATTGGGTCAAGCCT CAGTCTTCTT[C/G]CTGTAGAGTCTACAACAGCACCGATCGGTTCTGCAAT GCTTCAGGTACTTTCATCTCCTT TAATTAGACTGACCAGGTGGCAGCAAAGAGCCGGGTGCC[C/G]GTGCTG GGAAGGCCTATAAAGCTGAGCGCTGTGACAGCACA CCAGTGGCTAATTTGTCTCAGGCCTCCGTCTTAAAGAGAC[A/T]CAGAAAT GAGTAGGAAGTCCAGCGTGGTCTCAGAGAGCT GTCCCCGTGCACGTCAAGTTGTCCACAAGAGCCCAGGTTTCTAACCAGTT CTCTCAGAATATGCTGAGATAACCATTTTCTTTCCCAGCTGTACCTGACAG GAG[GAG/-]TCTGGAGTCTAGACGGCTCAGATAGCATGCAAGAGACCATG CAGGCCACCATTTGTGTCACTGCCCAGGTGCCAAAGCTGGAGGGTGAGG GAGAGGGTGAG 193 Phen- TTAGTACAGTGCTGGGCTCAGTAGGGGCTCGTTAAACGCCAATAGATGA HMBS_189TT_SIA GCACGTGACTGATTCTCTCCTCAGTTGCTATGTCCACCACAGGGGACAAG ATT[-/T]CTTGATACTGCGCTCTCTAAGGTAACGTGTTCCCCCCAATCCCTT TCCCTCCTTTCTCTTTCCTTCCCCCAAAAGATTCACTCTGAGGCTTTTTCT TGACC 194 Phen CYP21 B 1 GGAGGCACCCGCCTGGGTTTCTCAGTGCCCTGACAGCGCCCCCTCGCG CCCAGGGATAGCCGCCGTGCTCCTGGGTTCACGCCTGGGCTGCCTGGA GGCCGAAGTGCCTCCAGACACAGAGACCTTCATCCGCGCGGTGGGATC GGTATTTGTGTCCACGCTGCTGACCATGGCGATGCCTAGCTGGCTTCAC C[G/-]CCTCGTGCCCGGACCCTGGGGCCGCCTCTGCCGAGACTGGG
56 Table 3 - Phenotypic Markers useful for breed identification test SEQ ID NO: SNP ID Sequence 195 Phen_TAS1R2_CAT CCCTCCTGGGCCACCAGATCTTTTTTGACCAGCGAGGGGACCTACTCAT GCGCCTGGAGATCATCCAGGGACGGTGGGACCTGAGCCAGAAC[T/-]TTT CTGGAGCGTCGCCTCCTACTGCCCGGTGCTACGACGGCTGAGGGCCAT CCGTGACGTCTCCTGGCACACGGCCAACAACAC 196 Phen_TAS1R2_G8224 TTGCAGACGAGTTTGGCTGCCGGCCCTGCCCGAGTTGCGGGTGGTCCC A_CAT GGAGGAACGACGCTTCGTGCTTCAAGCGGCGGCTGGCCTCCCTTGAATG [G/A]CGCGAGGCACCCGCCGTCGCTGTGGCCGTGCTGTCCATCCTGGGC TCCCTCTGCACCCTGGCCATCCTGGTGATCTTCTGGAGGCACCGCCACG CGCC 197 Phen_CYP27B1_Rob GGAGGCACCCGCCTGGGTTTCTCAGTGCCCTGACAGCGCCCCCTCGCG CCCAGGGATAGCCGCCGTGCTCCTGGGTTCACGCCTGGGCTGCCTGGA GGCC[G/T]AAGTGCCTCCAGACACAGAGACCTTCATCCGCGCGGTGGGAT CGGTATTTGTGTCCACGCTGCTGACCATGGCGATGCCTAGCTGGCTTCA CC 198 Phen ZFX GGTTTTCGTCACCCGTCAGAGCTCAAGAAGCACATGCGAATCCATACTGG GGAGAAGCCGTACCAGTGCCAGTACTGCGA[G/A]TATAGGTCTGCAGACT CTTCTAACTTGAAAACGCATGTAAAAACTAAGCATAGTAAAGAGATGCCAT TCAAGTGTGACATCTGTCTTCTGACT 199 KRT71-Del Drex GGTGGGCATCCCTGCCNGGGAATCAGCAAGCNCTAGTGNGATTTGGATT TGGATGACTCGAATTACCCCTTCCAGTTTTTGAACTTCTCCAACTCCCTGT [TTAGGCTTCCAACCTGGAGACGGCCATCGCCGATGCCGAGCAGCGGGG CGACAGTGCCCTGAAGGATGCCCGGGCCAAGCT/-][-/AGTTGGAG]GGAC GAGCTGGA[-/T]GTCCGCCCTGCACCAGGCCAAGGAGGAGCTGGCCCGG ATGCTGCGGGAGTACCAGGAGCTCATGAGCCTGAAGCTGGCCCTGGACA TGGAGATCGCCACCTACC 200 P2RY5 CRex ACACTTTGTATGGCCGCATGTTTAGTATGGTATTTGTGCTTGGGTTAATAT CTAACTGTGTTGCCATATACATTTTCATCTGCACCCTCAAAGTGCGAAATG AAACTACAACATACATGATTAACTTGGCAATGTCAGACTTGCTTTTCGTTT TTACTTTACCCTTCAGGATTTTTTACTTTGCAACCCAGAATTGGCC[GTTT/- ]GGAGATCAACTCTGTAAAATTTCAGTGATGCTATTCTATACCAACATGTAT GGAAGCATTCTGTTCTTAACCTGTATTAGTGTCGATCGGTTTCTGGCAAT 201 WNK4 Burm HKL TGCCCCTCTGCTTCCCCCCTTCCGTCCACCACAGCAGCCCCTCTCCTCTC TCTGGCTAGTGCCTTCTCACTGGCTGTGATGACTGTGGCCCAGTCCCTG CTGTCTCCCTCACCTGGGCTCCTGTCCCAGTCTCCTCCAGCCCCTCCTG CTCCCCTCCCTAGCTTGCCCCTGCCCCCTCCCCCTGCTCCTTGTGGC[C/T ]AGGATAGGCCTTCACCCCCAACAGCTGAGACCGAGAGTGAGGTGAGTA GGAAACCAAGAGGGATGGTTAGGGGAGCTCCACTCTGGATCATTTCCCT TCTCATGGACCCACACTTTGCAGGTCCCGCCAAATCCTGCTCGGCCACTC 202 CART1 del Burm CTCCCGTGAAGGGGATGCCAGAAAAGGGAGAACTAGATGAACTTGGGGA TAAATGTGACAGCAACGTATCCAG CAGCAAGAAGCGGAGACACAGAACC ACCTTCACCAG CCTGCAGCTCGAGGAGCTGGAGAAGGTCTTTCAGAAAA CCCATTACCCGGATGTATACGTCAGAGAACAGCTTG[CTCTCAGGACTG/-] AGCTCACGGAGGCCAGAGTCCAGGTAGGAGCCAAATGAAGGACGTGGG TGTGCGTGTTGGGGGCCGGTGTGTGGAGATACTGTTAGAATAATTCAGT GGTTGCATTTTGCCAAAAGGAAGAAACTGATCCTCTCACTAAAGACTAGA ACC
57 J\ Table 4 No. Defining Variant Phenotypic SNPs genotypes (Inclusive (I) / Exclusive (E)) Registry Breed Category Family for family Agouti Brown Color Dilute Extension Glove Hairless Inhibitor Orange Spotting White Long Rex Rex 2 4 Abyssinian 1 Abyssinian aa - E bb = E CC = I E E E E E E E L- = l E E 2 American Shorthair 1 cbcb = E E E E L- = l E E 4 Birman 1 aa = I cscs = I E I E E II - I E E 4 British Shorthair 1 Persian C- = l E E E E E 4 Burmese 1 Burmese aa = I cbcb=l E E E E E E E 3 Chart reux 1 aa = I BB, Bb = I C- = l d = I E E E E E E E 4 Cornish Rex* 1 Rex cbcb = E E E E I E 4 Devon Rex 1 cbcb = E E E E E rere = I 4 Egyptian Mau 1 C- = l E E E E E E E 3 Japanese Bobtail 1 cbcb = E E E E E E 4 Korat 1 aa = I BB, Bb = I C- = l dd = I E E E E E E L- = E E E 4 Maine Coon 1 C- = l E E E II - I E E 4 Manx? 1 C- = l E E E E E 4 Norwegian Forest 1 C- = l I E E E E 4 Persian 1 Persian cbcb = E E E E E E 4 Russian Blue 1 aa = I BB, Bb = I cbcb = E dd = I E E E E E E E 4 Siamese 1 Siamese aa = I blbl = E cscs = I E E E E E E 3 Turkish Angora 1 cbcb = E E E E E E 4 Turkish Van 1 cbcb = E E E E E E X Asian 2 Burmese E E E E E 4 Balinese 2 Siamese Long/Brown/Dilute aa = I bibi = cscs = I E E E E E E 3 Bombay 2 Burmese Color aa = I B- = l C- = l dd - E E E E E E E E 2 Colorpoint 2 Siamese Agouti cscs = I E E E E E 2 Cymric^ 2 Manx Long cbcb = E E E E E E 4 Exotic Shorthair 2 Persian Long cbcb = E E E E E E 3 Havana Brown 2 Siamese Color aa = I bb = I C- = l dd = E E E E E E E E X Himalayan 2 Persian Color cscs = I E E E E E 4 Oriental 2 Siamese Color cscs = E E E E E E
58 J\ Table 4 Disease info: F disease SNP is frequent in the breed and may be breed specific V the SNP variant has different frequencies in different breeds, Categories: founder breed (N = 19, genetically defined by SNPs) 2 = Breed variants (N = 16), distinguish with other phenotypic SNPs or DNA variants 3 = Breeds may be like random breds (N = 9), but if found mutation, could distinguish. 4 = Hybrid breed (N = 2), need wildcat diagnostics, Y STRs 5 = F ndom bred (N = 4), regional, 3 completed, Euro SH underway, but define as breeds in breed only comparison 6 = concoction breeds (N = 3), will show mixture, defining variants will be of assistance 7 = Foreign Burmese may have distinct gene pool from USA Burmese, separate breed Variant found, unpublished Could share fur type variant
59 Table 5 Structural Trait Disease Traits Aby Aby Defining Variant Blood Korat Korat Burmese NFC MCC Ragdoll PRA PRA Persian Aby Ear Poly- Type Breed Family for family Dwarf Curl Fold Bobtail Tailless dactyla B GM1 GM2 GM2 GSD HCM HCM CEP290 CRX PKD PKLR Abyssinian Abyssinian E E E E E E V F F F American Shorthair E E E E E E V Birman E E E E E E V British Shorthair Persian E E E E E E V Burmese Burmese E E E E E E V Chartreux E E E E E E V Cornish Rex* Rex E E E E E E V Devon Rex E E E E E E V Egyptian Mau E E E E E E V Japanese Bobtail E E E 1 E E V Korat E E E E E E V Maine Coon E E E E E F V Manx E E E E 1 E V Norwegian Forest E E E E E E V Persian Persian E E E E E E V Russian Blue E E E E E E V Siamese Siamese E E E E E E V Turkish Angora E E E E E E V Turkish Van E E E E E E V Asian Burmese E E E E E E V Balinese Siamese Long/Brown/Dilute E E E E E E V Bombay Burmese Color E E E E E E V Colorpoint Siamese Agouti E E E E E E V Cymric Manx Long E E E E 1 E V Exotic Shorthair Persian Long E E E E E E V
60 Table 5 Structural Trait Disease Traits Aby Aby Defining Variant Blood Korat Korat Burmese NFC MCC Ragdoll PRA PRA Persian Aby Ear Type Breed Cat. Family for family Dwarf Curl Fold Bobtail Tailless B GM1 GM2 GM2 GSD HCM HCM CEP290 CRX PKD PKLR Havana Brown 2 Siamese Color E E E E E E V Himalayan 2 Persian Color E E E E E E V Oriental 2 Siamese Color E E E E E E V Ragamuffin 2 Ragdoll Not pointed E E E E E E V Singapura 2 Burmese Agouti E E E E E E V Somali 2 Abysinnian Long E E E E E E V Sphynx 2 Devon Rex Hairless/Rex E E E E E E V Tiffanie 2 Burmilla Long/Silver E E E E E E V Scottish Fold 3 Persian Fold E E I E E E V European Shorthair 5 E E E E E E V Ragdoll 5 Ragdoll E E E E E E V Siberian 5 E E E E E E V Sokoke 5 E E E E E E V Australian Mist 6 Burmese E E E E E E V Burmese Non-USA 7 E E E E E E V Tonkinese 2/6 Burmese/Siamese Color E E E E E E V Bengal 1/4/6 Aby/Mau Ticked E E E E E E V Snowshoe? Birman? bicolor, sh E E E E E E V Ocicat 1 (6) Aby/Siamese Color/Ticked/Tabby E E E E E E V
61 [0100] In addition to determination of the plurality of SNPs listed in Table 1, the genotype of one or more microsatellite markers and/or short tandem repeats (STRs) can be determined. For example, the genotype of one or more feline STRs selected from the group consisting of selected from the group consisting of FCA005, FCA008, FCA023, FCA026, FCA035, FCA043, FCA045, FCA058, FCA069, FCA075, FCA077, FCA080B, FCA088, FCA090, FCA094, FCA096, FCA097, FCA105, FCA123, FCA126, FCA132, FCA149, FCA21 1, FCA220, FCA223, FCA224, FCA229, FCA262, FCA293, FCA305, FCA310, FCA391, FCA441, FCA453, FCA628, FCA649, FCA678 and FCA698. The identity and location of feline microsatellites and STRs have been characterized and mapped, as described, e.g., in Menotti-Raymond, et al., Genomics (1999) 57(l):9-23; Menotti- Raymond, et al., Journal of Heredity (2003) 94(1):95 106; and Menotti-Raymond, et al., Genomics (2009) 93(4): [0101] As appropriate, the genotypes of at least about 3, 5, 10, 15, 20, 25, 30, 35, 38, or more, feline STRs are determined. In some embodiments, the expression levels of all STRs selected from FCA005, FCA008, FCA023, FCA026, FCA035, FCA043, FCA045, FCA058, FCA069, FCA075, FCA077, FCA080B, FCA088, FCA090, FCA094, FCA096, FCA097, FCA105, FCA123, FCA126, FCA132, FCA149, FCA21 1, FCA220, FCA223, FCA224, FCA229, FCA262, FCA293, FCA305, FCA310, FCA391, FCA441, FCA453, FCA628, FCA649, FCA678 and FCA698 are determined. 5. Methods of Detecting Biomarkers [0102] In some embodiments, methods comprise obtaining the identity of one or both alleles in a test feline genome for each marker of a set of markers. The genetic markers described herein, including the SNPs, STRs and phenotypic markers, can be detected using any methods known in art, including without limitation amplification, sequencing and hybridization techniques. Detection techniques for evaluating nucleic acids for the presence of a single base change involve procedures well known in the field of molecular genetics. Methods for amplifying nucleic acids find use in carrying out the present methods. Ample guidance for performing the methods is provided in the art. Exemplary references include manuals such as PCR Technology: PRINCIPLES AND APPLICATIONS FOR DNA AMPLIFICATION (ed. H. A. Erlich, Freeman Press, NY, N.Y., 1992); PCR PROTOCOLS: A GUIDE TO METHODS AND APPLICATIONS (eds. Innis, et al, Academic Press, San Diego, Calif, 1990); CURRENT PROTOCOLS IN
62 MOLECULAR BIOLOGY, Ausubel, , including supplemental updates; Sambrook & Russell, Molecular Cloning, A Laboratory Manual (3rd Ed, 2001). [0103] According to one aspect of the present invention, there is provided a method for assigning a feline to one or more breeds and/or populations of origin based on the genotypes of a set of gene polymorphisms. The method comprises the steps of first isolating a genomic DNA sample from a feline, and then detecting, e.g., amplifying a region genomic DNA including the one or more of the genetic markers using an oligonucleotide pair to form nucleic acid amplification products of the one or more gene polymorphism sequences. Amplification can be by any of a number of methods known to those skilled in the art including PCR, and the invention is intended to encompass any suitable methods of DNA amplification. A number of DNA amplification techniques are suitable for use with the present invention. Conveniently, such amplification techniques include methods such as polymerase chain reaction (PCR), strand displacement amplification (SDA), nucleic acid sequence based amplification (NASBA), rolling circle amplification, T7 polymerase mediated amplification, T3 polymerase mediated amplification, SP6 polymerase mediated amplification, and GoldenGate amplification assays. The precise method of DNA amplification is not intended to be limiting, and other methods not listed here will be apparent to those skilled in the art and their use is within the scope of the invention. [0104] In some embodiments, the polymerase chain reaction (PCR) process is used (see, e.g., U.S. Pat. Nos. 4,683,195 and 4,683,202. PCR involves the use of a thermostable DNA polymerase, known sequences as primers, and heating cycles, which separate the replicating deoxyribonucleic acid (DNA), strands and exponentially amplify a gene of interest. Any type of PCR, including quantitative PCR, RT-PCR, hot start PCR, LA-PCR, multiplex PCR, touchdown PCR, finds use. In some embodiments, real-time PCR is used. [0105] The amplification products are then analyzed in order to detect the presence or absence of at least one polymorphism in the feline genome that is associated with the desired genotypes and/or phenotypes, as discussed herein. By practicing the methods of the present invention and analyzing the amplification products it is possible to determine the genotype of individual animals with respect to the polymorphism. [0106] In some embodiments, the genetic markers may be detected by restriction fragment length polymorphism (RFLP) analysis of a PCR amplicon produced by amplification of genomic DNA with the oligonucleotide pair. In order to simplify detection
63 of the amplification products and the restriction fragments, those of skill will appreciate that the amplified DNA will further comprise labeled moieties to permit detection of relatively small amounts of product. A variety of moieties are well known to those skilled in the art and include such labeling tags as fluorescent, bioluminescent, chemiluminescent, and radioactive or colorigenic moieties. [0107] A variety of methods of detecting the presence and restriction digestion properties of amplification products are also suitable for use with the present invention. These can include methods such as gel electrophoresis, mass spectroscopy or the like. The present invention is also adapted to the use of single stranded DNA detection techniques such as fluorescence resonance energy transfer (FRET). For FRET analysis, hybridization anchor and detection probes may be used to hybridize to the amplification products. The probes sequences are selected such that in the presence of the SNP, for example, the resulting hybridization complex is more stable than if there is a G or C residue at a particular nucleotide position. By adjusting the hybridization conditions, it is therefore possible to distinguish between animals with the SNP and those without. A variety of parameters well known to those skilled in the art can be used to affect the ability of a hybridization complex to form. These include changes in temperature, ionic concentration, or the inclusion of chemical constituents like formamide that decrease complex stability. It is further possible to distinguish animals heterozygous for the SNP versus those that are homozygous for the same. The method of FRET analysis is well known to the art, and the conditions under which the presence or absence of the SNP would be detected by FRET are readily determinable. [0108] Suitable sequence methods of detection also include e.g., dideoxy sequencing-based methods and Maxam and Gilbert sequence (see, e.g., Sambrook and Russell, supra). Suitable HPLC-based analyses include, e.g., denaturing HPLC (dhplc) as described in e.g., Premstaller and Oefner, LC-GC Europe 1-9 (July 2002); Bennet et al, BMC Genetics 2:17 (2001); Schrimi et al, Biotechniques 28(4):740 (2000); and Nairz et al, PNAS USA 99(16): (2002); and ion-pair reversed phase HPLC-electrospray ionization mass spectrometry (ICEMS) as described in e.g., Oberacher et al.; Hum. Mutat. 21(1):86 (2003). Other methods for characterizing single base changes in alleles of genetic markers include, e.g., single base extensions (see, e.g., Kobayashi et al, Mol. Cell. Probes, 9: , 1995); single-strand conformation polymorphism analysis, as described, e.g, in Orita et al, Proc. Nat. Acad. Sci. 86, (1989), allele specific oligonucleotide
64 hybridization (ASO) (e.g., Stoneking et al, Am. J. Hum. Genet. 48:70-382, 1991; Saiki et al, Nature 324, , 1986; EP 235,726; and WO 89/1 1548); and sequence-specific amplification or primer extension methods as described in, for example, WO 93/22456; U.S. Pat. Nos. 5,137,806; 5,595,890; 5,639,61 1; and U.S. Pat. No. 4,851,331; 5*- nuclease assays, as described in U.S. Pat. Nos. 5,210,015; 5,487,972; and 5,804,375; and Holland et al, 1988, Proc. Natl. Acad. Sci. USA 88: [0109] Methods for detecting single base changes well known in the art often entail one of several general protocols: hybridization using sequence-specific oligonucleotides, primer extension, sequence-specific ligation, sequencing, or electrophoretic separation techniques, e.g., singled-stranded conformational polymorphism (SSCP) and heteroduplex analysis. Exemplary assays include 5' nuclease assays, template-directed dye-terminator incorporation, molecular beacon allele-specific oligonucleotide assays, single-base extension assays, and SNP scoring by real-time pyrophosphate sequences. Analysis of amplified sequences can be performed using various technologies such as microchips, fluorescence polarization assays, and matrix-assisted laser desorption ionization (MALDI) mass spectrometry. In addition to these frequently used methodologies for analysis of nucleic acid samples to detect single base changes, any method known in the art can be used to detect the presence of the genetic markers described herein. [0110] For example FRET analysis can be used as a method of detection. Conveniently, hybridization probes comprising an anchor and detection probe, the design of which art is well known to those skilled in the art of FRET analysis, are labeled with a detectable moiety, and then under suitable conditions are hybridized an amplification product containing the genetic marker of interest in order to form a hybridization complex. A variety of parameters well known to those skilled in the art can be used to affect the ability of a hybridization complex to form. These include changes in temperature, ionic concentration, or the inclusion of chemical constituents like formamide that decrease complex stability. The presence or absence of the genetic marker is then determined by the stability of the hybridization complex. The parameters affecting hybridization and FRET analysis are well known to those skilled in the art. The amplification products and hybridization probes described herein are suitable for use with FRET analysis. 6. Methods of Analyzing Biomarkers [0111] The methods comoprise determining the contributions of one or more feline populations (e.g., ancestral lineage and/or breed contributions) to the test feline genome by
65 comparing the alleles at the predetermined genetic markers in the test feline genome (e.g., a plurality of the SNPs listed in Table 1; optionally one or more phenotypic markers and/or microsatellite markers) to a database comprising feline population profiles, wherein each feline population profile comprises genotype information for alleles of the markers in the set of markers in the feline population. For example, a feline population profile may comprise genotype information for each allele of each marker in the set of markers in the feline population. The genotype information in a feline population profile may comprise information such as the identity of one or both alleles of most or all of the markers in the set of markers in one or more felines that are members of that feline population, and/or estimated allele frequencies for at least one allele of most or all of the markers in the set of markers in that feline population. The collection of feline population profiles can be collected in a database for use in practicing the invention. In some embodiments, the database of feline population profiles comprises one or more feline population profiles. In various embodiments, the database of feline population profiles comprises a plurality of feline population profiles, e.g., between about five and about 500 feline population profiles, such as about 10, 20, 30, 40, 50, 60, 70, 80, 90, 100, 200, 300, 400, 500, or more, feline population profiles. [0112] Determining the contributions of feline populations to the test feline genome can encompass both assigning a feline genome to one or more particular feline populations and/or determining the fraction of the feline genome that was derived from one or more feline populations. In one embodiment, the test feline is suspected of having at least about 25% of the feline genome, e.g., at least about 30%, 40%, 50%, 60%, 70%, 80%, 90% or 100%, derived from a single defined feline population (e.g., ancestral lineage and/or breed). [0113] Many methods of assignment testing have been developed in the past decade using common population genetic markers and a variety of statistical methods (Rannala & Mountain (1997) Proc Natl Acad Sci USA. 94(1 7): ; Pritchard et al. (2000) Genetics, 155: ; Baudouin & Lebrun (2001) In: Proc. Int. Symp. on Molecular Markers, pp ; Paetkau et al. (2004) Molecular Ecology, 13:55-65). These methods have been applied to various breeding populations including pigs, cattle, and dogs (Schelling et al. (2005) Journal of Animal Breeding and Genetics, 122:71-77; Negrini et al. (2009) Animal Genetics, 40:18-26; Boitard et al. (2010) Anim Genet (6): See also, U.S. Patent Nos. 7,729,863 and 6,770,437. In some embodiments of the method, a
66 Bayesian model-based clustering approach is used, e.g., as described by Rannala & Mountain, supra; Pritchard, supra; and/or Baudouin & Lebrun, supra. [0114] There are two broad classes of clustering methods that are used to assign individuals to populations (Pritchard, supra). Distance-based methods calculate a pairwise distance matrix to provide the distance between every pair of individuals. Model-based methods proceed by assuming that observations from each cluster are random draws from some parametric model; inference for the parameters corresponding to each cluster is then done jointly with inference for the cluster membership of each individual, using standard statistical methods. In some embodiments of the method, a likelihood or frequentist modelbased approach is used, e.g., as described by Paetkau, supra; and/or Negrini, supra. Any standard statistical method may be used in the methods of the invention, including maximum likelihood, bootstrapping methodologies, Bayesian methods and any other statistical methodology that can be used to analyze genotype data. These statistical methods are well-known in the art. [0115] Many software programs for population genetics studies have been developed and may be used in the methods of the invention, including, but not limited to TFPGA, Arlequin, GDA, GENEPOP, GeneStrut, POPGENE (Labate (2000) Crop. Sci. 40: ), Geneclass2 (Piry et al, (2004) Journal of Heredity 95, ) and STRUCTURE (Pritchard et al. (2000) Genetics 155:945-59). [0116] An exemplary Bayesian model-based clustering approach is provided by the genotype clustering program STRUCTURE (Pritchard et al. (2000) Genetics 155:945-59), which has proven useful for defining populations within a species (Rosenburg et al. (2001) Genetics 159: ; Rosenburg et al. (2002) Science 298:2381-5; Falush et al. (2003) Genetics 164(4): ). The clustering method used by STRUCTURE requires no prior information about either phenotype or genetic origin to accurately place an individual or set of related individuals in a population. [0117] Any algorithms useful for multi-locus genotype analysis may be used in the methods of the invention, for example, classic assignment algorithms. Suitable algorithms include those described in Rannala & Mountain (1997) Proc. Natl. Acad. Sci. U.S.A. 94: , Paetkau et al. (2004) Molecular Ecology, 13:55-65 and Cornuet et al. (1999) Genetics 153: and variations thereof. Exemplary programs available for multi-locus genotype analysis include Doh (available on the internet at biology.ualberta.ca/jbrzusto/doh.php) and GeneClass (available at
67 montpellier.inra.fr/urlb/geneclass/genecass.htm). Cluster iterations can be combined, e.g., through the program CLUMP (Jakobsson & Rosenberg, Bioinformatics 23(14): ) and DISTRUCT (Rosenberg, (2004) Molecular Ecology Notes 4, ) to create a consensus clustering. Migrants within populations can be detected, e.g., using the program Geneclass2 (Piry et al, (2004) Journal of Heredity 95, [0118] In some embodiments, the methods of the invention comprise determining the probability that a specific feline population contributed to the genome of the test feline by determining the conditional probability that the alleles in the test feline genome would occur in the specific feline population divided by the sum of conditional probabilities that the alleles in the test feline genome would occur in each feline population in the database. [0119] Some embodiments of the methods of the invention comprise discriminating between the contributions of two or more genetically related feline populations to the test feline genome by comparing the alleles in the test feline genome to a database comprising profiles of the two or more genetically related feline populations. In various embodiments, the two or more genetically related feline populations may comprise (i) Persian and Exotic Shorthair (SH); (ii) British SH and Scottish Fold; (iii) Australian Mist and Burmese; (iv) Singapura and Burmese; (v) Birman and Korat, and (vi) Siamese and Havana Brown. [0120] Using an assignment algorithm on genotype information for all 148 SNPs listed in Table 1, 38 microsatellite markers and 5 phenotypic markers listed in Table 3 from 477 felines representing 29 feline breeds, the methods of the invention have been used to assign individual test felines to its breed with at least about 50% sensitivity and specificity, for example, at least about 60%, 70%, 75%, 80%, 85%, 90%, 95% sensitivity and specificity, or greater. As used herein, sensitivity specifically indicates the percentage of individuals sampled from a breed that could be assigned back to that breed. Specificity takes into account individuals sampled from other breeds that were misassigned to that breed. Sensitivity and specificity are properly used to describe the power of the testing in assignment testing. See, Example 2. [0121] The methods of the invention are also useful for determining the contributions of feline populations to felines having genetic contributions from more than one breed or defined ancestral lineage. Preferably, the test feline has at least 25% of the markers, e.g., at least about 30%, 40%, 50%, 60%, 70%, 80%, 90% or 100% of the markers, associated with a defined ancestral lineage or breed. Models that detect an individual's admixed state can be considered to group into two classes: models that require a
68 combinatoric set of unique alleles for each of the possible mixtures of ancestral populations (Nason & Ellstrand (1993) J. Hered. 84: 1-12; Epifanio & Philipp (1997) J. Hered. 88:62-5), and Bayesian methods where ancestral populations are not required to contain a combination describing unique alleles, but instead assign individuals to admixed states probabilistically based on differences in allele frequencies between populations (Corander et al. (2003) Genetics 163(1): ; Anderson & Thompson (2002) Genetics 160: , Pritchard et al. (2000) Genetics 155:945-59, Rannala & Mountain (1997) Proc. Natl. Acad. Sci. U.S.A. 94: The latter set of models are more informative for most populations and data sets as they allow for a Bayesian posterior probabilistic assignment vector for each population/generation combination, thereby allowing for uncertainty analysis to be incorporated into the assignment vector; but existing models for the exact, recent admixture assignments of individuals from multiple ancestral populations are limited in their scope as they have been developed thus far only for two generation prediction and allow for only a few ancestral populations. For example, the methods of Anderson & Thompson (2002) are developed for a two generation, two population model with unlinked microsatellite data. 7. Reporting Results of Analysis [0122] In various embodiments, the methods may further comprise the step of reporting the results of the assignment analysis, e.g., to the purchaser, to the owner or guardian of the feline, to a breed registry, to a veterinarian or another interested individual. The methods may further comprise the step of providing a document displaying the contributions of one or more feline populations to the genome of the test feline genome. The document may be a chart, certificate, card, or any other kind of documentation. The document may be electronic or paper copy. The document may display the contributions of one or more feline populations to the test feline genome in a numeric format or in a graphic format. For example, the document may include photographs or other depictions, drawings, or representations of the one or more feline populations. The document may also provide confidence values for the determined contributions (such as 80%, 85%, 90%> 95%, or 99% confidence). In some embodiments, the document provides a certification of the contributions of one or more feline populations to the genome of the test feline genome. [0123] In some embodiments, the document additionally provides information regarding the one or more feline populations that contributed to the genome of the test feline or the test feline. The information regarding feline populations that contributed to the
69 genome of the test feline may include information related to the characteristics and origin of the feline population (e.g., ancestral origin and/or contributing breed(s)) or any other kind of information that would be useful knowledge concerning the test feline. In some embodiment, the information includes health-related information. Many feline populations have predispositions to particular diseases or conditions. For example, heart disease in the Maine Coon and Ragdoll (Meurs et al. (2005) Human Molecular Genetics, 14: ; Meurs et al. (2007) Genomics, 90: ), polycystic kidney disease in the Persian (Lyons et al. 2004, supra), progressive retinal atrophy in the Abyssinian (Menotti- Raymond et al. (2007) Journal of Heredity, 98: ) and a craniofacial defect and hypokalemia in Burmese. Therefore, information regarding the contributions of one or more feline populations to the genome of the test feline genome is particularly valuable to mixed-breed feline owners or caretakers (both professional and non-professional) for the purpose of proactively considering health risks for individual tested animals. For example, a mixed breed cat that is found to be a mixture of a breed with known association or predisposition for certain disease conditions could be proactively monitored for such disease conditions that occur with rare frequency in the general population of cats, but occur with significant frequency in these specific breeds. [0124] Health-related information may also include potential treatments, special diets or products, diagnostic information, and insurance information. 8. Computer-Readable Media [0125] In a further aspect, the invention provides one or more computer-readable media comprising a data structure stored thereon for use in distinguishing feline populations. In some embodiments, the data structure comprises: a marker field, which is capable of storing the name of a marker (for example, an SNP marker) or the name of an allele of a marker; and a genotype information field, which is capable of storing genotype information for the marker (for example, the identity of one or both alleles of the marker in a feline genome or an estimate of the frequency of an allele of the marker in a feline population), wherein a record comprises an instantiation of the marker field and an instantiation of the genotype information field and a set of records represents a feline population profile. [0126] A "computer-readable medium" refers to any available medium that can be accessed by computer and includes both volatile and nonvolatile media, removable and non removable media. Computer readable media that are non-transitory find use. By way of
70 example, and not limitation, computer-readable media may comprise computer storage media and communication media. Computer storage media includes both volatile and nonvolatile, removable and non-removable media implemented in any method or technology for storage of information, such as computer-readable instructions, data structures, program modules, or other data. Computer storage media include, but are not limited to, RAM, ROM, EEPROM, flash memory or other memory technology, CD-ROM, digital versatile disks (DVD) or other optical disk storage, magnetic cassettes, magnetic tapes, magnetic disk storage or other magnetic storage devices, or any other computer storage media. Communication media typically embody computer-readable instructions, data structures, program modules or other data in a modulated data signal, such as a carrier wave or other transport mechanism that includes any information delivery media. The term "modulated data signal" means a signal that has one or more of its characteristics set or changed in such a manner as to encode information in the signal. By way of example, and not limitation, communication media include wired media, such as a wired network or direct-wired connection, and wireless media, such as acoustic, RF infrared, and other wireless media. A combination of any of the above should also be included within the scope of computer-readable media. [0127] A "data structure" refers to a conceptual arrangement of data and is typically characterized by rows and columns, with data occupying or potentially occupying each cell formed by a row-column intersection. In some embodiments, a data structure in the computer-readable medium can comprise a marker field and a genotype information field, as described above. The instantiation of the marker field and the genotype information field provides a record, and a set of record provides a feline population profile. Thus, the data structure may be used to create a database of feline population profiles. [0128] In some embodiments, the computer readable medium comprises a substrate having stored thereon: (a) a data structure for use in distinguishing feline populations, the data structure comprising: (i) a marker field, which is capable of storing the name of a marker or of an allele of a marker; and (ii) a genotype information field, which is capable of storing genotype information for the marker, wherein a record comprises an instantiation of the marker field and an instantiation of the frequency field and a set of records represents a feline population profile; and (b) computer-executable instructions for implementing a method for determining the contributions of feline populations to a feline genome, comprising: (i) obtaining the identity of one or both alleles in a test feline genome for each
71 marker of a set of markers; and (ii) determining the contributions of feline populations to the test feline genome by comparing the alleles in the test feline genome to a database comprising feline population profiles, wherein each feline population profile comprises genotype information for the set of markers in the feline population. 9. Kits [0129] In another aspect, the invention provides nucleic acid sequences for determining the identity of one or both alleles in a feline genome for each marker of a set of markers, e.g., as listed in Table 1. The nucleic acid sequences can be primer sets. In some embodiments, the primer sets are provided in a kit. [0130] The invention further provides kits useful for determining the population of origin {e.g., ancestral lineage and/or breed contributions) of a feline. In general, the kits comprise one or more oligonucleotide primer pairs as described herein suitable to amplify the portions of a feline genome comprising a plurality of the SNPs listed in Table 1. In some embodiments, the kit comprises oligonucleotide primer pairs for determining all 148 SNPs listed in Table 1. In various embodiments, the kits may further comprise one or more oligonucleotide primer pairs for determining one or more biomarkers listed in Table 3, e.g., for determining the SNPs in one or more of SEQ ID NOs: The kits comprise forward and reverse primers suitable for amplification of a genomic DNA sample taken from a feline. As described above, the biological sample can be from any tissue or fluid in which genomic DNA is present. Conveniently, the sample may be taken from blood, skin {e.g., cheek swab) or a hair bulb. EXAMPLES [0131] The following examples are offered to illustrate, but not to limit the claimed invention. Example 1 Genetic Structure of Worldwide Random Bred Cat Populations [0132] This example describes the specific pinpointing of the geographic source of domestic cats. For this study, 944 cats from 37 random bred worldwide populations particularly from within the Middle East, Egypt and other Old World areas were genotyped at 148 SNPs and 38 cat-specific STRs. Thirty-eight wildcats were examined as outgroups. Principal Coordinate Analysis (PCA) and Bayesian clustering methods indicated eight
72 modern worldwide cat populations belonging to at least five distinct ancestral groups; populations were geographically distributed, consistent with isolation by distance. Genetic indices were a gradient across the world, with the highest genetic diversity and lowest inbreeding in the region of historical Mesopotamia and the Levant, current day Iraq, Lebanon and Israel of the 37 sampled locations, more so than cats from Egypt, suggesting cats shared their cradle of domestication with the earliest human civilization and only later branching out towards Europe and Asia. Materials and Methods: [0133] Cat Sample Collection. This study included 944 domestic cats from 37 locations worldwide, including 20 locations and 481 cats novel to this study (Figure 1). Samples (n = 463) from a previous study included random bred cats from 17 locations (Lipinski et al, (2008) Genomics 91, 12-21). Samples were collected via buccal (cheek) swabs and extracted with a QIAamp DNA blood mini kit following the manufacturer's protocol (Qiagen, Valencia, CA, USA), or as whole blood spotted onto an FTA Card (Whatman International Ltd.) followed by a modified whole genome amplification (REPLI-g Mini Kit, Qiagen) as follows. A 0.12 cm punch was taken from the bloodstained card and washed with 5 minutes of gentle rocking a total of 5 times: 3 times with 0.5 ml of FTA purification mix made out of one part FTA-Reagents (Whatman International Ltd.), two parts PBS and 0.5% TWEEEN, and 2 washes with 0.5 ml of l x TE Buffer (10 ml Tris HC1 1M, 2 ml EDTA 0.5M). This was dried at 60 C for 30 min. Two clean, dry punches were combined with 2.5 µΐ PBS and processed following the REPLI-g whole genome amplification kit protocol for amplification of genomic DNA from blood or cells (Qiagen, Valencia, CA, USA). Following whole genome amplification, consumed punches were discarded. Wildcat samples (N=38) were collected as part of other studies and provided as extracted DNA that had been whole genome amplified. [0134] SNP and STRs. Thirty-eight autosomal STRs were genotyped following the PCR and analysis procedures of a previous study (Lipinski et al., 2008, supra). Unlinked non-coding autosomal SNPs (n=169), which were defined by one Abyssinian cat, were selected to represent all autosomes from the 1.9x coverage cat genomic sequence (Pontius, et al., 2007, (2007) Genome Research 17, ). Primers were designed with the VeraCode Assay Designer software (Illumina Inc., San Diego, CA, USA). Only SNPs that received a design score of 0.75 or higher (with a mean design score of 0.95) (n = 162) were included in the analysis (Table 6).
73 [0135] Golden Gate Assay amplification and BeadXpress reads were performed per the manufacturer's protocol (Illumina Inc.) on ng of DNA or whole genome amplified product. BeadStudio software v with the Genotyping module v (Illumina Inc.) was used to analyze the data. Any samples with a call rate less than 0.80 (n = 21) were removed from further clustering analysis. Additionally, only SNPs with a Gentrain Score of > 0.55 (n = 148) were included in the study (Table 6). Table 6 SNPs for the analysis of worldwide random bred cat populations. Minor Allele Locus Name Call Frequency Frequency Gentrain Score Desiqi chra1_ chra1_ chra1_ chra1_ chra1_ chra1_ chra1_ chra1_ chra1_ chra1_ < chra1_ chra1_ chra1_ chra1_ chra1_ chra2_ chra2_ < chra2_ chra2_ chra2_ chra2_ chra2_ < chra3_ chra3_ chra3_ chra3_ chra3_ chra3_ chra3_ chra3_ chra3_ chra3_ chrb1_ chrb1_ chrb1_ < chrb1_ chrb1_ chrb1_ chrb1_
74 Table 6 SNPs for the analysis of worldwide random bred cat populations. Minor Allele Locus Name Call Frequency Frequency Gentrain Score Desiqn Score chrb1_ chrb1_ chrb2_ chrb2_ chrb2_ < chrb2_ chrb2_ < chrb2_ chrb2_ chrb3_ chrb3_ chrb3_ chrb3_ < chrb3_ chrb3_ chrb3_ chrb3_ chrb4_ chrb4_ chrb4_ chrb4_ chrb4_ chrb4_ chrb4_ chrb4_ chrb4_ chrb4_ chrb4_ chrb4_ chrb4_ chrb4_ chrc1_ < chrc1_ chrc1_ chrc1_ chrc1_ chrc1_ < chrc1_ chrc1_ chrc1_ < chrc1_ chrc1_ chrc1_ chrc1_ chrc1_ chrc1_ chrc2_ chrc2_ chrc2_ chrc2_
75 Table 6 SNPs for the analysis of worldwide random bred cat populations. Minor Allele Locus Name Call Frequency Frequency Gentrain Score Desigi chrc2_ chrc2_ chrc2_ chrc2_ < chrd1_ chrd1_ chrd1_ chrd1_ chrd1_ chrd1_ chrd1_ chrd1_ chrd1_ chrd1_ chrd1_ chrd1_ < chrd1_ chrd1_ chrd1_ chrd2_ chrd2_ < chrd2_ chrd2_ chrd2_ chrd2_ chrd2_ chrd2_ chrd3_ chrd3_ chrd3_ chrd3_ chrd3_ chrd3_ chrd4_ chrd4_ chrd4_ chre1_ chre1_ chre1_ chre1_ chre1_ chre1_ chre1_ chre2_ chre2_ chre2_ chre2_ chre2_ chre2_ chre2_
76 Table 6 SNPs for the analysis of worldwide random bred cat populations. Minor Allele Locus Name Call Frequency Frequency Gentrain Score Design Score chre2_ chre2_ chre3_ chre3_ < chre3_ chre3_ chrf1_ chrf1_ chrf1_ chrf1_ chrf1_ chrf1_ chrf1_ chrf1_ chrf1_ chrf2_ chrf2_ chrf2_ chrf2_ chrf2_ chrf2_ chrf2_ chrf2_ Locus name includes the chromosome and location of each SNP. [0136] Data analysis. Data sets were analyzed with the Bayesian clustering program STRUCTURE (Pritchard et al, (2000) Genetics 155, ) under the admixture model with correlated allele frequencies and a burn-in of 100,000 with 100,000 additional iterations. Values of K were calculated from K = 1 to K = 25, each run was replicated 10 times. Posterior log likelihoods were used in the calculation of Κ in order to best estimate the number of ancestral populations through the program Harvester (Evanno et al, (2005) Molecular Ecology 14, ) (Figure 2). To assess the effects of varying marker types on the final results, STRUCTURE analysis was conducted on the data in three different permutations: only SNPs, only STRs, and SNPs and STRs together. Images were created with CLUMPP v (Jakobsson and Rosenberg, (2007) Bioinformatics 23(14): ) to combine replicates and DISTRUCT v. 1.1 (Rosenberg, (2004) Molecular Ecology Notes 4, ) to create final images. A map of cat domestication was created using an inverse distance function. Each point on the map has an interpolated likelihood for each cluster; the color is the most likely cluster. Color saturation
77 is based on the value of the likelihood (e.g. low saturation means low likelihood) (Figure 1). [0137] First generation migrants within populations identified by STRUCTURE were detected with the program Geneclass2 (Piry et al, (2004) Journal of Heredity 95, ) under the Rannala and Mountain (Proc Natl Acad Sci USA. (1997) 94(17): ) Bayesian model, with 1000 Monte-Carlo re-sampling simulations (Paetkau et al., (2004) Molecular Ecology 13, 55-65), and the p-value threshold set at From both STRs and SNPs, samples that were below the threshold of 0.01 for originating from the same lineage as that assigned for the majority of the cats from the same sampling location were considered recent immigrants and removed from subsequent analyses. These individuals were compared to the first generation migration test applied to the output from STRUCTURE as in previous studies (Randall et al, (2010) Conservation Genetics 11, ), where individuals that clustered with a lineage other than that of the majority of their sampling location with a posterior probability of >0.5 were considered to be first generation immigrants to that sampling location (n = 56). All migrants were removed from further analyses (n = 63). FIS was calculated with Fstat v (Goudet, (1995) J Hered (1995) 86(6): ) and observed and expected heterozygosites with GenAlEx v.6.3 (Peakall, Smouse, (2006) Molecular Ecology Notes 6, ). F-statistics were calculated both by sampling location and based on the populations as assigned by STRUCTURE. [0138] Principal coordinates analyses were conducted on a matrix of Nei's unbiased genetic distance and plotted via the standardized co-variance using the software GenAlEx (Peakall, Smouse, 2006, supra). [0139] Phylogenetic trees were created with the software package PHYLIP version 3.67 (Felsenstein, (1989) Cladistics 5, ). Allele frequencies for each data set were analyzed sequentially with SeqBoot, Genedist, Neighbor, and Consense to create a consensus tree. Trees were replicated with 1,000 bootstraps; genetic distance was calculated following Nei's unbiased method (Nei, Roychoudhury, (1974) Genetics 1'6: ) with the STRs to account for not only genetic drift, but also the fast mutation rate of the markers. The method of Reynolds et al. (Reynolds et al, (1983) Genetics 105, ) was applied to the SNP data to account for genetic drift only. Final unrooted trees were produced with the neighbor-joining method and visualized with FigTree v l.3. 1 (on the internet at tree.bio.ed.ac.uk/software/figtree).
78 Results: [0140] The final analyses consisted of cat DNA samples (n = 944) from worldwide populations, including 463 domestic cats used previously (Lipinski et al, 2008, supra), and 481 domestic cat samples collected from 20 additional locations in the Middle East, Kenya, India, and Japan (Figure 1). Thirty-eight wildcats of known genetic origin (F. silvestris silvestris (Western Europe), F. s. libyca (assorted African locations), and F.s. tristrami (Israel)) (Lipinski et al, 2008, supra) were used as outgroups for the analyses. The 38 STRs had an average call rate of 92.3% and the 148 SNPs had an average call rate of 95.5%. [0141] Bayesian clustering suggested a value of K = 5 (Figure 2) for both SNPs and STRs resulting in five groupings corresponding to Europe, Mediterranean (including Western portions of the Middle East), Iraq/Iran, South Asia, and East Asia (Figure 3A, C) (alternate plots are available as Figure 4). The sampling locations along the Indian Ocean, including India and Sri Lanka, appeared to be admixtures of all five ancestral lineages, which are more strongly depicted by the STR data (Figure 3C). A secondary peak in Κ values was observed at K=7 in the STRs and K=8 in SNPs, however, the two marker types resolved with some discrepancies (Figure 3B, D). SNPs and STRs both separated the Egyptian cats from the other Mediterranean cats, STRs indicating a stronger distinction (Figure 3D) than the SNPs (Figure 3B). STRs additionally indicated the Arabian Sea (Dubai, Pate, and Lamu), to be distinct from the cats of India, Sri Lanka and Southern Asia (Thailand and Vietnam). SNPs were able to discern the Arabian Sea cats and the Southern Asian cats as distinct populations but maintained the cats of India as highly admixed. [0142] When SNPs and STRs were combined for analysis, a consensus of both the individual SNP and STR analyses is observed, suggesting five distinct ancestral lineages (Figure 3E) and eight modern populations (Figure 3). The division between the Arabian Sea and the Indian populations is supported by the STR data, but not the SNP data set, while the division between Indian and South Asian populations is supported by the SNP but not the STR data. Besides the Indian cats, the cats from Taiwan and Sapporo, Japan have the most amount of admixture. [0143] When analyzed for first generation migrants, 2 1 individuals had a p-value of less than 0.01 indicating that these cats were likely not native to the sampling location. Additionally, detection of first generation migrants using the posterior probabilities of assignment with STRUCTURE detected 56 individuals (42 additional migrants), for a
79 combined total of 63 individuals when the cats from the two methods were combined (Table 7). Europe is the source for a majority of the migrant cats that are found in other parts of the world (33%). The remainder of migrant cats appears to have traveled a short distance to adjoining populations. Individuals that were categorized as first generation migrants were removed from further analyses. Table 7 First generation migration test of eight worldwide cat populations *. Total First Generation Migrants from Each Source Sampling East South East Lineage location Europe Mediterranean Egypt Iraq/Iran India Asia Asia Europe Germany 1 Italy-Milan 4 Kenya-Nairobi 1 1 East Mediterranean Turkey Cyprus 4 Lebanon Israel 2 Egypt Cairo Luxor 1 Arabian Sea Dubai 1 1 India Sri Lanka 1 1 South Asia Vietnam 1 East Asia Taiwan 7 1 Japan-Oita 2 Japan- Kanazawa 2 Japan-Ohmiya 1 Japan-Sapporo 4 2 South Korea 1 Total N = *Number of individuals that were determined migrants with a p-value < 0.01 calculated using Geneclass2 (Peakall, Smouse, 2006, supra). Populations with no detected migrants are not presented. [0144] Population statistics are presented both for each sampling site (Table 8) and population (Table 9) including the average effective number of alleles, inbreeding coefficients (FIS) and observed heterozygosity (HO) based on SNPs and STRs. No population had a diagnostic / unique SNP. The range of the SNP minor allele frequencies (MAF) throughout the world suggests insignificant ascertainment bias (Table 10). The populations with the highest number of STR alleles were the Mediterranean lineage and the modern Egyptian population, the lowest were found in East Asia. Private alleles were most common in the lineages from the Arabian Sea/Asia, Mediterranean and Iraq/Iran, and the modern lineages of the Arabian Sea and Iraq/Iran.
80 Table 8 Cat population statistics based on sampling locations *. Sampling Location n Private FlS (SNP) Fis Ho (SNP) Ho (STR) (Migrants Alleles (STR) 1 Europe USA-NY (sites=9) USA-MS USA-HI Brazil Finland Germany Italy-Milan Italy-Rome Kenya-Nairobi Eastern Turkey Mediterr. Basin Cyprus (sites=4) Lebanon Israel-Tel Aviv Egypt Cairo (sites=4) Assuit Luxor Abu Simbel Iraq/Iran Iraq-Western (sites= 3) Baghdad Iran Arabian Sea Dubai (sites=3) Kenya-Pate Kenya-Lamu India Udaipur/Agra (sites=5) Hyderbad Andhra Kolkata Sri Lanka South Asia Thailand (sites=2) Vietnam East Asia Taiwan (sites=7) Japan-Oita Japan-Kanazawa Japan-Ohmiya Japan-Sapporo China-Henan South Korea Total sites = (63) *First generation migrants were not included. N = sample size. F IS = average inbreeding coefficient of an individual relative to its source population, H 0 = observed heterozygosity.
81 Table 9 Population statistics of worldwide cat populations Total Private Aver. Population n Alleles Alleles N F,s (SNP) F,s(STR) Ho(SNP) Ho(STR) Ancient Basal Lineage Europe Mediterranean Iraq/Iran Arabian Sea/Asia East Asia Modern Lineage Europe East Mediterranean Basin Egypt Iraq/Iran Arabian Sea India South Asia East Asia *First generation migrants were not included n = sample size. Aver. N e = average effective number of alleles F IS = average inbreeding coefficient of an individual relative to its source population, H 0 = observed heterozygosity.
82 Table 10 Minor Allele Frequency based on population < Locus chra1_ chra1_ chra1_ chra1_ chra1_ chra1_ chra1_ chra1_ chra1_ chra1_ chra1_ chra1_ chra1_ chra1_ chra2_ chra2_ chra2_ chra2_ chra2_ chra3_ chra3_ chra3_ chra3_ chra3_ chra3_ chra
83 Table 10 Minor Allele Frequency based on population Locus chra3_ chra3_ chra3_ chrb1_ chrb1_ chrb1_ chrb1_ chrb1_ chrb1_ chrb1_ chrb1_ chrb2_ chrb2_ chrb2_ chrb2_ chrb2_ chrb3_ chrb3_ chrb3_ chrb3_ chrb3_ chrb3_ chrb3_ chrb4_ chrb4_ chrb
84 Table 10 Minor Allele Frequency based on population Locus chrb4_ chrb4_ chrb4_ chrb4_ chrb4_ chrb4_ chrb4_ chrb4_ chrb4_ chrb4_ chrb4_ chrc1_ chrc1_ chrc1_ chrc1_ chrc1_ chrc1_ chrc1_ chrc1_ chrc1_ chrc1_ chrc1_ chrc1_ chrc2_ chrc2_ chrc
85 Table 10 Minor Allele Frequency based on population Locus chrc2_ chrc2_ chrc2_ chrc2_ chrd1_ chrd1_ chrd1_ chrd1_ chrd1_ chrd1_ chrd1_ chrd1_ chrd1_ chrd1_ chrd1_ chrd1_ chrd1_ chrd1_ chrd2_ chrd2_ chrd2_ chrd2_ chrd2_ chrd2_ chrd2_ chrd
86 Table 10 Minor Allele Frequency based on population Locus chrd3_ chrd3_ chrd3_ chrd3_ chrd3_ chrd4_ chrd4_ chrd4_ chre1_ chre1_ chre1_ chre1_ chre1_ chre1_ chre1_ chre2_ chre2_ chre2_ chre2_ chre2_ chre2_ chre2_ chre2_ chre2_ chre3_ chre
87 Table 10 Minor Allele Frequency based on population Locus chre3_ E 1u r ope chrf1_ chrf1_ M dter anean chrf1_ Etgyp chrf1_ chrf1_ / raqran chrf1_ chrf1_ AbSr aanea chrf1_ chrf1_ chrf2_ dna chrf2_ ShAt ousa chrf2_ chrf2_ EA t assa13 chrf2_ chrf2_ chrf2_ chrf2_ [0145] Principal coordinates analyses (PCA) (Figure 5) broadly correlated with the STRUCTURE analyses. PCA consistently grouped individuals from the same geographic cluster together as delineated by Bayesian clustering (Figure 3). Differences of SNP (Figure 5A) versus STR (Figure 5B) based analyses are most notably in the distance of the Arabian Sea populations from those of the Iraqi/Iranian populations (more distant with SNPs and less so with STRs). Also, SNPs position the South Asian populations close to that of the Indian populations as opposed to closer to the East Asian populations when STRs
88 are used. Despite these slight changes in comparative distance, both PCA analyses show genetic distances to be correlated with that of geographical or physical distances of the populations and sampling sites. [0146] The SNP (Figure 6A) and STR-based (Figure 6B) Neighbor-joining phylogenetic trees were also broadly concordant with the STRUCTURE and PCA defined lineages through forming groups along geographical lines. Very high bootstrap values are noted between cats that show strong associations in the other analyses, including, cats from Vietnam and Thailand, cats from the Kenyan Islands, Lamu and Pate, and Dubai, and those from various cities of Japan. However, at a fine-scale, minor discrepancies are observed. For example, mainland Kenyan cats, when analyzed with STRs, are in the middle of the European branch with a bootstrap value of 100%, but in the SNP-based tree, mainland Kenyan individuals are in between the European/Mediterranean and the Iraq/Iran/Asian clades with a lower bootstrap of 43%. Additionally, the northwestern populations in India weakly grouped with either the Iraq/Iran clade or the Indian depending upon the marker. [0147] The wildcat outgroups also showed significant differences between markers. With SNPs, Felis s. libyca is more closely associated with the Mediterranean cats, while F. s. silvestris associated with the European cats. With STRs, the two wildcat groups form their own clade, in between the Mediterranean/European/ Iraqi/Irani populations and more eastern populations. Discussion [0148] Cultural histories, archeological evidence, and more recently, genetic investigations all support the theory of at least one cat domestication event in the 450,000 km2 region of the Fertile Crescent. The Fertile Crescent spreads from the land between the Tigris and Euphrates Rivers (currently Iraq), extending into modern Syria and Turkey, along the Mediterranean coast of Israel (the Levant region) and into the fertile regions of the Nile River Valley in Egypt. As agriculture and civilization spread, the provision of vermin population control to surrounding refuse piles and grain stores was an important benefit of the symbiotic relationship between the regional wildcats and humans. Bold wildcats may have repeatedly approached humans as the sedentary agricultural lifestyle proliferated throughout the Fertile Crescent. Over time, some cats may have moved with mobile tribes over short distances. Both natural and human-induced barriers have posed limits to feline migrations over the past 10,000 years, as well as varying human migrations due to stochastic political barriers. But as humans became increasingly mobile, so too have the
89 cats, by hitching rides around the world on ships and colonizing new regions with limited founders. DNA sampling and genetic evaluations of modern cats provide only a presentday snapshot of cat population stratifications around the world. However, large DNA sample sets of cats from diverse geographical regions combined with an assortment of genetic markers with a variety of resolution powers can help define these cat populations, tracing recent migrations, and clarifying those more ancient relationships of the cats around the world. [0149] This study focused on cat populations within the Fertile Crescent, Egypt, and eastern regions, examining the effect of different genetic markers on refining the site of cat domestication and clarifying the paths of migration. STRUCTURE analysis of SNPs and STRs genetically refined the cat population stratifications of the world, especially with the addition of cats from the Middle East and Asia. The previous STR study by Lipinski et al. (2008) suggests that worldwide cats divide into 4 basal lineages; Western European, Mediterranean basin, East African (Lamu and Pate), and Asian. By doubling the sample set and including 148 random SNP markers, the previous population demarcations were reinforced and an additional lineage in Iraq/Iran was detected. The previously defined African lineage, cats from the Kenyan islands of Lamu and Pate, appears to be rather a lineage that defines cats of Indian Ocean/Arabian Sea including cats from Dubai, India and Sri Lanka, Thailand, and Vietnam. The SNPs more clearly defined this lineage than the STRs. [0150] Additional stratifications can be resolved, dividing cats into seven modern populations for each marker type, eight overall populations considering a combined analysis. These population divisions align mostly along geographic regions, specifically Europe (including the Americas), East Mediterranean Basin (Turkey, Cyprus, Lebanon, and Israel), Egypt, Iraq/Iran, Arabian Sea, India (including Sri Lanka), Southern Asia (Thailand and Vietnam), and Eastern Asia (Taiwan, Japan, China, and South Korea). Both marker types support Egyptian cats as distinctive, perhaps a result of ancient breeding practices causing drift or strong isolation due to cultural and geographical barriers in the region. SNPs and STRs were discordant with the distinction of the cats from India and Sri Lanka. With SNPs, the Indian cats group with cats around the Arabian Sea, but with STRs, these same cats cluster with a distinctive Southern Asian group. The slower mutation rate of SNPs should strengthen their resolving power in the older cat populations; STRs should illuminate the more recent migrations that may not be visible with SNPs. Perhaps the
90 differences in the SNP versus STR demarcations suggest that historically the India cats arrived from the West, whereas more recent migrations have come from the East. [0151] In support of recent cat movements, approximately 66% of migrants appear to have originated from geographically close neighbors. However, the cat migrants in Taiwan and Japan are most likely due to human-mediated movement subsequent to human colonization or migration by European people. For example, 9.5% of the Japanese cats and 24. 1% of Taiwanese cats appear to have a significant portion of European ancestry. The Nairobi Kenyan cats appear to be highly correlated with that of Europe, consistent with the European colonization of Kenya, which is readily depicted by the STR neighbor-joining phylogenetic analysis. A similar result was indicated in the previous study with cats from Tunisia, which appeared to also have European origins (Lipinski et al., 2008). An individual example is a cat sample that was collected in Luxor, Egypt, a city deep within the Nile Valley. This longhaired cat belonged to a woman who had recently moved from the coastal Mediterranean city of Alexandria. Her cat clearly owes most of its ancestry to that of European cats. While signs of historical colonization by western countries can be detected, Iraq's short history of British rule resulted in very little influence of the European cats in the feral populations of Iraq and Iran. Overall, the stratification of cats from these analyses is sufficient to define regional origins of modern cats, and recent migrations can be tracked by the cat's genetic constitution. [0152] PCA analyses depicted a great divide between the regions of Europe, East Mediterranean Basin, and Egypt versus cats from Southern Asian, and Eastern Asian populations, suggesting these larger regional groupings as the most genetically distinct. The phylogenetic relationships presented in the neighbor-joining trees also relay a significant difference between Eastern and Western domestic cats. Both approaches place the Irani/Iraqi and Arabian Sea groups somewhat in between the Eastern - Western divisions. The wildcat species group with the Western European clusters of cats, leaving speculation as to whether the significant divide between western and eastern cats is due to more than one domestication event, or the ancient diaspora of early cat domesticates, followed by a decrease of migration and isolationism. [0153] Population statistics assist the identification of the older cat populations and lineages, indicating that Egypt and the Mediterranean lineage have the lowest inbreeding and highest heterozygosity based on STRs, as well as the highest averages for effective number of alleles of the populations included in this study. FIS calculations based on SNPs
91 show the Asuit, Egypt and Iraqi/Irani lineage to have the least amount in inbreeding but likely not statistically significant from other Egyptian and Mediterranean areas. Additionally the Assuit collection was partially made up of cats that had been presented to the Veterinary School of Assuit University, and may likely represent cats from a variety of origins. Thus, the oldest cat lineages are represented in the Near East, primarily the Eastern Mediterranean countries and Egypt, supporting sites of cat domestication. The isolation of the cat populations in Iraq and Iran has undoubtedly prevented admixture, despite this, the population has not suffered from inbreeding. Cats from India, including Sri Lanka, show significant admixture with representation from all groups. Bootstrap values are low for the Indian cats, while STRUCTURE analysis indicated gene flow from surrounding areas, suggesting the Indian peninsula as a potential mixing pot for domestic cats. Overall, the regions of highest diversity focus around the location of the first human agricultural settlements, including Egypt, Israel, Lebanon, and Iraq. [0154] Together, the various SNP and STR data of this study indicate that cats were first domesticated in the Fertile Crescent and Levant regions, potentially near Lebanon and Iraq. The Iraq/Iran clade is clearly delineated early in the Baysean clustering analysis as one of the first lineages, show little sign of admixture with the other lineages, and maintains a high diversity even when compared to the modern populations. Iraq has also had the benefit of relatively few influences from Europe; the modern populations found there are most likely to represent some of the first domesticated cats. The high diversity of other populations is a result of large numbers of migrations and introgressions from other regions of the world (such as northwestern India and northern Egypt). From the northern Fertile Crescent, domesticated cats have spread throughout the world, first out towards Iraq, the Eastern Mediterranean and then down through Egypt before extending to Asia and Europe. Since then, as Europeans traveled throughout the world, they brought with them their fellow felines, which have subsequently left their genetic pawprints in areas such as Kenya, Taiwan, Japan, and the Americas. Example 2 Assessment of Genetic Assignment of Domestic Cats to Breeds and Worldwide Random Bred Populations [0155] In this example, 477 cats representing 29 fancy breeds were analyzed with 38 microsatellites (STRs), 148 intergenic SNPs, and 5 causative and linked phenotypic SNPs. Results of this study suggest that contrary to previous studies, the frequentist
92 methods of Paekau (accuracy SNPs = 0.78, STRs = 0.88) surpass the Bayesian methods of Rannala and Mountain (SNPs = 0.56, STRs = 0.83). Additionally, a post-assignment verification step with the phenotypic SNPs will accurately identify between 0.31 and 0.58 of the mis-assigned individuals. Materials and Methods: [0156] Sample Collection. Twenty-nine breeds were represented by 477 cats. This study included 354 cats from the work of Lipinski et al. ((2008) Genomics 91:12-21) that analyzed 22 breeds. The 123 additionally collected samples represented seven additional breeds (Scottish Fold, Cornish Rex, Ragdoll, Manx, Bengal, Ocicat, and Australian Mist). All cats were representatives of their breed as found within the USA, except for a few Turkish Angora and Turkish Vans from an international collaboration. All cats were pedigreed and verified to be unrelated to the grandparent level. Worldwide random bred data (N=944) was included from results discussed in Example 1 in order to assess the origins of each of the breed populations. New samples were collected via a buccal (cheek) swab and extracted following the manufacturer's protocol (Qiagen). Table 11 Origins of cat Breeds * Indicative Phenotypic Traits Origins Based on Historical Breed Inclusion Exclusion Evidence 1 Persian LH SH British RB, Siamese, Maine Coon Persian, American SH, Abyssinian, Exotic SH SH LH Burmese British SH SH LH British RB, Persian Scottish Scottish RB, British SH, American SH, Fold Ear Fold Persian, Exotic SH Chartreux Blue French RB, Persian, British SH American British RB, American RB, Persian, SH SH LH Burmese Sphynx Hairless American RB Japanese Bobtail Bobtail Japanese RB Cornish Rex Cornish curl British RB, Siamese Ragdoll LH American RB, Birman Maine Coon LH American RB Abyssinian SH, Ticked, Agouti LH British RB, Egyptian RB, African RB Siberian LH Russian RB 2 Norwegian FC LH Norwegian RB Manx Tailless, SH LH British RB
93 Table 11 Origins of cat Breeds * Indicative Phenotypic Traits Origins Based on Historical Breed Inclusion Exclusion Evidence 1 Egyptian Mau Egyptian RB Turkish Angora Turkish RB Turkish Van Turkish RB Bengal Asian leopard cat, American RB Sokoke Kenyan randombred Ocicat Spotted, SH LH Abyssinian, Siamese Russian Blue Blue, SH British RB, Siamese Australian Mist Burmese, Abyssinian, Australian RB 4 Non-Agouti, Burmese RB, Siamese, European RB, Burmese Agouti, Sepia Silver British SH Non-Agouti, Singapura Agouti Silver Singaporean RB, Abyssinian Birman LH, Points Burmese RB, various breed outcrosses Korat Blue, Non-agouti Thai RB Havana Chocolate, Non- Brown Agouti Points Siamese, British SH, Russian Blue SH, Siamese Points, Siamese Non-Agouti Thai RB RB = randombred, SH = shorthair, LH = Long hair. Unless noted origins are according to: 'Gebhardt, 1991(Gebhardt (1991). The Complete Cat Book. Howell Book House, New York, The Royal Canin Cat Encyclopedia, 2000, Groupe Royan Canin, Paris, France, The International Cat Association (on the internet at tica.org), or 4 Australian Mist Breed Council (on the internet at australianmist.info/home.html). [0157] Thirty eight micro satellites were genotyped in the 123 newly acquired cats following the PCR and analysis procedures of Lipinski et al. (2008), supra. The 148 intergenic SNPs were assayed in all 477 breed cats for this study as described in Example 1. Five additional phenotypic SNPs were also evaluated in all cats. The phenotypic SNPs consisted of a causative mutation for the most common form of long hair in cats (FGF5 A475C) (Kehler et al. (2007) J Hered 98, ), Burmese and Siamese color points (TYR G715T and G940A, respectively) (Lyons et al. (2005) Animal Genetics, 36, ), and the mutations for the color variants chocolate and cinnamon (Phen_TYRPl_5IVS6 and C298T) (Lyons et al. (2005) Mammalian Genome, 16, ). Golden Gate Assay amplification and BeadXpress reads were performed per the manufacturer's protocol (Illumina Inc., San Diego) on ng of DNA, using the same oligo primer pool as used in Example 1. Each run of the SNP assay contained both an internal positive and negative control in order to validate repeatability and contamination.
94 [0158] Population Statistics. Hardy-Weinberg Equilibrium (HWE) with associated chi squared tests was performed by population, as well as observed and expected heterozygosites with GenAlEx v.6.3 (Peakall & Smouse 2006, supra). FIS and FST were calculated with Fstat v (Goudet 1995, supra). F-statistics were calculated both by sampling location, and based on the populations as assigned by STRUCTURE, regardless of sampling location. Reynold's genetic distance was calculated between all pairs of breeds due to the predicted recent separation of these populations (Reynolds et al. 1983, supra). Population Structuring [0159] Bayesian Clustering. Data sets were analyzed with the Bayesian clustering program STRUCTURE (Pritchard et al. 2000) under the admixture model with correlated allele frequencies and a burn-in of 100,000 with 100,000 additional iterations. Values of K were calculated from K = l to K = 33, each run was replicated 10 times. Posterior log likelihoods were used in the calculation of Κ to best estimate the number of ancestral populations through the program Harvester (Evanno et al. 2005, supra). All ten iterations were then combined through the program CLUMP (Jakobsson & Rosenberg 2007, supra) to create a consensus clustering. To assess the effects of varying marker types on the final results, STRUCTURE analysis was conducted on the data with the two different permutations: SNPs and STRs. [0160] Principal Coordinate Analysis. Principal components analyses were conducted through the calculation of Nei's genetic distance using the software GenAlEx v.6.3 (Peakall & Smouse 2006, supra). For the PCA plots, both the data in the present example and data from the worldwide random bred populations discussed in Example 1 were considered to show the relationship of the cat breeds and their random bred population origins. [0161] Breed Lineage Assignment. Cat breed populations were assigned to the eight ancestral lineages of random bred worldwide populations of cats (Europe, Mediterranean, Egypt, Iraq/Iran, Arabian Sea, India, Southeast Asia, and East Asia) identified in Example 1 by calculating -log(likelihood) values using the Bayesian population assignment methods available in the software Geneclass2 (Piry et al. 2004, supra). [0162] Assignment Testing. Ten sets of 50 individuals were randomly selected from the sample set and assigned to a population of origin using the remaining samples as the reference populations. The Bayesian method of Rannala and Mountain (1997), supra, and
95 the Frequentist method suggested by Paetkau et al. (2004), supra, were compared as they performed best in the previous assignment study of Negrini et al. (2009) Animal Genetics, 40:18-26) when compared to the Pritchard et al. (2000) Genetics, 155: ) and the Baudoulin & Lebrun methods (2001) Proc. Int. Symp. on Molecular Markers, pp Additionally, the assignment tests were performed in three iterations: intergenic SNPs, intergenic and phenotypic SNPs combined, and STRs. Tallies of type I error (an individual not reassigning to its population of origin) and type II error (an individual not from that population assigning to it) were used to calculate the sensitivity and specificity of the assignment method (Negrini et al. 2009, supra). [0163] Phenotypic SNPs were also used post-assignment test to compare both STRs with and without phenotypic SNP input, as well as comparing the use of phenotypic SNPs combined with intergenic SNPs for the assignment test as opposed to only post assignment testing. Cats were considered mis-assigned if they had genotypes exclusionary for the breed. For example, an individual assigned to the Exotic short haired group was identified as mis-assigned if it was homozygous for long-hair. Results: [0164] Summary Statistics. Pedigreed cats (N = 477), representing 29 recognized breeds were included in this study (Table 12). The number of cats per breed ranged from 7 to 25 with an average of 16.4 individuals per breed. STRs had a call rate of 88.2% and SNPs had a 94.0% average call rate. While the chi-squared goodness-of-fit test indicated that 126 of the 148 SNPs and 36 of the 38 STRs were not in HW equilibrium in at least one breed group, only one SNP marker (chrf2_ ) was found to be not in HW equilibrium in more than 50% of the breeds (Table 13). Twenty-seven breeds have SNPs not in HWE; however the Russian Blue and Turkish Van breeds have 31 and 33 of the total 186 genetic markers out of HWE. This is suggestive of potential population substructuring or recent inbreeding. The frequency of the genotypes and alleles for the phenotypic SNPs were calculated by counting (Table 14). The FGF5 A475C mutation causing long coated cats in the homozygous state was by far the most prevalent of the phenotypic SNPs as it was found in all but eight of the breeds. In contrast, cinnamon, caused by TYRPl C298T, was only seen in five breeds two of which had a frequency lower than 0.1.
96 Table 12 Population statistics of cat breeds. Total Total PA PA Na Na Ho Ho Fis Fis( Alleles Breed N S Allele Persian Exotic SH British SH Scottish Fold Chartreux American SH Sphynx Japanese Bob Cornish Rex Ragdoll Maine Coon Abyssinian Siberian Norwegian FC Manx Egyptian Mau Turkish Angora Turkish Van Bengal Sokoke Ocicat Russian Blue Australian Mist Burmese Birman Havana Brown Korat Siamese Singapura Total N implies number of samples, PA B implies private alleles between breeds, PA implies private alleles between breeds and worldwide randombred populations, Na implies average effective number of alleles, Ho implies observed heterozygosity, F IS implies inbreeding coefficient
97 o o o o o o o ο o o o o o o o o o o o O o o o O > > > > > > > > > > > > > > > > > > > > > > > > to to to to to to to to to to to to to Cn Cn Cn Cn Cn Cn Cn Cn Cn Cn Cn Cn Cn Cn Cn Cn Cn Cn Cn Cn Cn Cn Cn Cn ersian cn cn cn cn cn cn cn cn cn Exotic SH cn cn cn cn cn cn cn cn cn cn cn cn cn cn cn cn cn cn cn cn cn cn 3ritish SH cn cn cn cn cn cn cn cn cn cn cn cn cn cn cn cn cn cn cn cn cn cn cn Scottish Fold cn cn cn cn cn cn cn cn cn cn cn cn cn cn cn cn cn cn cn cn cn Chartreux cn cn cn cn cn cn cn cn cn cn cn cn cn cn cn cn cn cn cn cn cn American SH cn cn cn cn cn cn cn cn cn cn cn cn cn cn cn cn cn cn cn cn cn cn cn Sphynx cn cn cn cn cn cn cn cn cn cn cn cn cn cn cn cn cn cn cn cn cn cn cn Japanese BobtailiJ cn cn cn cn cn cn cn cn cn cn cn cn cn cn cn cn cn cn cn cn cn cn Cornish Rex cn cn cn cn cn cn cn cn cn cn cn cn cn cn cn cn cn cn cn cn cn cn cn cn Ragdoll cn cn cn cn cn cn cn cn cn cn cn cn cn cn cn cn cn cn cn cn cn Vlaine Coon cn cn cn cn cn cn cn cn cn cn cn cn cn cn cn cn cn cn cn cn cn Abyssinian cn cn cn cn cn cn cn cn cn cn cn cn cn cn cn cn cn cn cn cn cn cn Siberian cn cn cn cn cn cn cn cn cn cn cn cn cn cn cn cn cn cn cn cn cn Norwegian FC cn cn cn cn cn cn cn cn cn cn cn cn cn cn cn cn cn cn cn cn cn cn Vlanx cn cn cn cn cn cn cn cn cn cn cn cn cn cn cn cn cn cn cn cn cn cn cn Egyptian Mau cn cn cn cn cn cn cn cn cn cn cn cn cn Turkish Angora cn cn cn cn cn cn cn cn cn cn cn cn cn cn cn cn cn cn Turkish Van cn cn cn cn cn cn cn cn cn cn cn cn cn cn cn cn cn cn cn cn cn cn cn cn 3engal cn cn cn cn cn cn cn cn cn cn cn cn cn cn cn cn cn cn cn cn cn cn cn Sokoke cn cn cn cn cn cn cn cn cn cn cn cn cn cn cn cn cn cn cn cn cn cn cn Dcicat cn cn cn cn cn cn cn cn cn cn cn cn cn cn cn cn cn cn cn cn cn Russian Blue cn cn cn cn cn cn cn cn cn cn cn cn cn cn cn cn cn cn cn cn cn cn cn Australian Mist cn cn cn cn cn cn cn cn cn cn cn cn cn cn cn cn cn cn 3urmese cn cn cn cn cn 3irman cn cn cn cn cn cn cn cn cn cn cn cn cn Havana Brown cn cn cn cn cn cn cn cn cn cn cn cn cn cn cn cn cn cn cn cn cn cn Korat cn cn cn cn cn cn cn cn cn cn cn cn cn cn cn cn cn cn cn cn cn cn Siamese cn cn cn cn cn cn cn cn cn cn cn cn cn cn cn cn cn cn Bingapura ho - cn co co cn Total 0 8 0/ 0 S l /I d ZLL SI ZI Z OAV
98 o o o o O o O o o o o o o o o o o o o o o o o o 3 " 3 " 3 " 3 " 3 " 3 " 3 " 3 " 3-3 " " 3 - ro ro ro ro ro ro ro ro ro ro ro ro ro ro ro ro ro ro ro -> c co co co co co ro ro ro ro ro co c > o c > o c > o c > o cn cn co cn co co cn ro j co co cn co co ro cn co c n co ro cn cn cn co ro cn ro cn j ro cn cn co c n j cn c n ro cn cn co ro co cn co cn co c n co cn c n j co c n co ro co co ro co c n cn c n co ro J cn co cn co cn co co co c n j J j cn cn co co co ro cn ro cn cn co cn ro c n co ro ro co co ro c n cn cn cn cn cn cn cn cn cn cn cn cn cn cn cn cn cn cn cn cn ersian Exotic SH cn cn cn cn cn cn cn cn cn cn cn cn cn cn cn cn cn cn cn cn cn cn 3ritish SH Scottish Fold Chartreux cn cn cn cn cn cn cn cn cn cn cn cn cn cn cn cn cn cn cn cn American SH Sphynx Japanese Bobtail) Cornish Rex «Ragdoll cn cn cn cn cn cn cn cn cn cn cn cn cn cn cn cn cn cn Vlaine Coon S " cn cn cn cn cn cn cn cn cn cn cn cn cn cn cn cn cn cn cn cn Abyssinian " C cn cn cn cn Siberian cn cn cn cn cn cn cn cn cn cn cn cn cn cn cn cn cn cn cn cn cn Norwegian FC S cn cn cn cn cn cn cn cn cn cn cn cn cn cn cn cn cn cn cn cn cn cn cn Vlanx cn cn cn cn cn cn cn cn cn cn cn cn cn cn cn cn cn cn cn cn cn cn Egyptian Mau 3 cn cn cn cn cn cn cn cn cn cn cn cn cn cn cn cn Turkish Angora cn cn cn cn cn cn cn cn cn cn cn cn cn cn cn cn cn cn cn cn cn Turkish Van cn cn cn cn cn cn cn cn cn cn cn cn cn cn cn cn cn cn cn cn cn cn cn 3engal cn cn cn cn cn cn cn cn cn cn cn cn cn cn cn cn cn cn cn cn cn cn cn cn Sokoke cn cn cn cn cn cn cn cn cn cn cn cn cn cn cn cn cn cn cn cn cn cn cn cn Dcicat cn cn cn cn cn cn cn cn cn cn cn cn cn cn cn cn Russian Blue Australian Mist 3urmese 3irman Havana Brown Korat Siamese cn cn cn cn cn cn Singapura o ho ho ho ho ho ho ho ho ho Total 0 8 0/ 0 S l /1 d
99 o o o o o o o o o o o o o o o o o o o o o O o o 3-3 " 3-3 " 3 " 3 " 3 " 3 " 3 " 3 " 3 " 3 " 3 " 3 " 3 " 3 " 3 " 3 " 3 " 3 " 3 " 3 " 3-3 " o o o o o o o o o ro. ro. ro ro. ro. ro ro ro ro. ro ro. ro. ro ro. c roo r ro ro ro. c o ro ro ro j c o t c o ro j CD CD cn CD cn CD j to j cn cn CD co cn cn co to cn CD CD c o to cn co ro cn CD c o CD c o cn c o co co co to J cn ro cn CD cn J to ro c o cn CD cn cn cn c o to c o CD c o. co CD c o to CD cn CD CD ro ro ro ro cn cn ro cn co c o ro cn cn co cn c o cn CD cn c o cn cn to J ro J CD j. to c o to to co. CD cn J n cn c o J co cn to c o ro to c o. cn c o CD to to cn co cn c o cn cn co c o. 3 C C 3 3 C co co co co co co co co ersian 3 3 C C O O O co co co co co co co co Exotic SH co co co co co co co co co co co co co co co co 3ritish SH co co co co co co co co co co co co co co co co co co co co co co co Scottish Fold co co co co co co co co co co co co co co co co co co co co co co co co Chartreux co co co co co co co co co co co co co American SH co co co co co co co co co co co co co co co co co co co co co Sphynx co co co co co co co co co co co co co co co co co co co co co Japanese Bobtail co co co co co co co co co co co co co co co Cornish Rex co co co co co co co co co co co co co co co co co Ragdoll co co co co co co co co co co co Vlaine Coon co co co co co co co co co co co co co co co co co co co co co co co Abyssinian co co co co co co co co co co co co co co co co co Siberian co co co co co co co co co co co co co co co co co co co Norwegian FC co co co co co co co co co co co co co co co co co co co Vlanx co co co co co co co co co co co Egyptian Mau Turkish Angora co co co co co co co co co co co co co Turkish Van co co co co co co co co co co co co co 3engal co co co co co co co co co co co co co co co co Sokoke co co co co co co co co co co co co co Dcicat co co co co co co co co co co co co co co co Russian Blue co co co co co co co co co co co co co co co Australian Mist 3urmese 3irman Havana Brown co co co co co co co co co co co co co co co co co Korat co co co co co co co co co co co co co co co co co Siamese Bingapura Total 0 8 0/ 0 S l /I d ZZ8 / 0 OAV
100 o 3 - σ σ > j σ > r 0 8 0/ 0 S l /X d ZLL S IZ Z OAV
101 cn cn cn cn cn cn cn cn cn cn cn cn cn cn cn cn cn cn cn cn cn cn cn ersian Exotic SH cn cn cn cn cn cn cn cn cn cn cn cn cn cn cn cn cn cn cn cn cn cn 3ritish SH cn cn cn cn cn cn cn cn cn cn cn cn cn cn cn cn cn cn cn cn cn cn Scottish Fold cn cn cn cn cn cn cn cn cn cn cn cn cn cn cn cn cn cn cn cn cn cn cn cn Chartreux cn cn cn cn cn cn cn cn cn cn cn cn cn cn cn cn cn cn cn cn American SH cn cn cn cn cn cn cn cn cn cn cn cn cn cn cn cn cn Sphynx cn cn cn cn cn cn cn cn cn cn cn cn cn cn cn cn cn cn cn cn Japanese Bobtail) cn cn cn cn cn cn cn cn cn cn cn cn cn cn cn cn cn cn cn Cornish Rex cn cn cn cn cn cn cn cn cn cn cn cn cn cn cn cn cn cn cn cn cn cn cn Ragdoll cn cn cn cn cn cn cn cn cn cn cn cn cn cn cn cn cn cn cn cn cn cn Vlaine Coon cn cn cn cn cn cn cn cn cn cn cn cn cn cn cn cn cn cn cn cn cn cn Abyssinian cn cn cn cn cn cn cn cn cn cn cn cn cn cn cn cn cn cn cn cn cn Siberian cn cn cn cn cn cn cn cn cn cn cn cn cn cn cn cn cn cn cn Norwegian FC cn cn cn cn cn cn cn cn cn cn cn cn cn cn cn cn cn cn cn cn cn cn Vlanx cn cn cn cn cn cn cn cn cn cn cn cn cn cn cn cn cn cn cn cn cn Egyptian Mau r cn cn cn cn cn cn cn cn cn cn cn cn cn cn cn cn cn cn cn cn cn cn Turkish Angora cn cn cn cn cn cn cn cn cn cn cn cn cn cn cn cn cn cn Turkish Van r cn cn cn cn cn cn cn cn cn cn cn cn cn cn cn cn cn cn cn cn cn cn cn 3engal cn cn cn cn cn cn cn cn cn cn cn cn cn cn cn cn cn cn Sokoke cn cn cn cn cn cn cn cn cn cn cn cn cn cn cn cn cn cn cn cn cn Dcicat cn cn cn cn cn cn cn cn cn cn cn cn cn cn cn cn cn cn cn cn cn cn Russian Blue cn cn cn cn cn cn cn cn cn cn cn cn cn cn cn cn cn cn cn cn cn cn cn Australian Mist cn cn cn cn cn cn cn cn cn cn cn cn 3urmese cn cn cn 3irman cn cn cn cn cn cn cn cn cn cn cn cn cn cn cn Havana Brown cn cn cn cn cn cn cn Korat cn cn cn cn cn cn cn cn cn cn cn cn cn Siamese cn cn cn cn cn cn cn cn cn cn cn cn cn cn cn cn cn cn cn Singapura ho ho ho ho cn cn - o cn cn - ho Total 0 8 0/ 0 S l / d..8 / 0 OAV
102 o o o o O o o o o o o o o o o o o o O o o o o o 3-3 " 3 " 3 " 3 " 3 " 3 " 3 " 3 " 3 " 3 " 3 " 3 " 3 " 3 " 3 " 3 " 3 " 3 " 3 " 3 " 3 " 3 " 3 " ro ro ro ro σ >. co ro to co co cn co ro ro ro ro cn cn co co cn co co co co co co σ > co cn ro ro cn co cn CD J cn cn. to cn to co cn cn. n co co co cn CD cn CD co CD. CD ro cn ro co to to CD j cn to co cn ro cn ro CD to CD CD co ro CD co cn co ro ro cn cn cn J cn co ro. CD to to cn. to cn CD cn j cn to co. ro ro co to cn cn co cn ro CO cn cn cn cn CD co to ~-l σ > j CD CD j ro co to. ro j CD ro co cn co co ro co cn co CD CD ro ro cn cn. to cn ro ro to to J cn co co co co co co co co co co co co co ersian co co co co co co co co co co co co co co co co co Exotic SH cn cn cn cn cn cn cn cn cn cn cn cn 3ritish SH n co co co co co co co co co co co co co co co co co co co co co co Scottish Fold co co co co co co co co co cn cn cn cn cn cn cn cn cn cn cn cn Chartreux 3E cn cn cn cn cn cn co co co co 3c E o co co co co cn cn cn cn American SH S cn cn cn cn cn cn co co co co co co co co 3 c E o co co Sphynx E2 co co co co co co co co cn cn cn cn cn cn cn cn cn Japanese Bobtail E2 cn cn cn cn cn cn cn cn cn cn cn cn cn cn cn cn cn cn c E2 n cn cn cn cn cn Cornish Rex E2 cn cn cn cn cn cn cn cn cn cn co co co co co co co co Ragdoll E2 cn cn cn cn cn cn cn cn cn cn cn cn co co co co co co co ce2o co co Vlaine Coon E2 co co co co co co co co co co co co cn cn cn cn cn cn cn E2 Abyssinian cn cn cn cn cn cn cn cn cn co co co co co co co co co co Siberian co co co co co co co co co co co co co co co co co co co co co Norwegian FC cn cn cn cn co co co co co co co co co co co co co co co co co Vlanx cn cn cn co co co co co co co co co co co co cn cn cn Egyptian Mau r co co co co co co co co co co co co co co co co co co co co co Turkish Angora cn cn cn cn co co co co co co co co co co co co cn cn cn cn Turkish Van r co co co co co co co co co co co co co co co co co co co co co co 3engal co co co co co co co co co co co co co co co co co co co cn cn cn cn Sokoke co co co co co co co co co co co co co co co cn cn cn cn cn cn cn Dcicat cn cn cn cn cn cn cn cn cn cn cn cn cn cn cn Russian Blue cn cn cn cn co co co co co co co co co co co co co co co co co Australian Mist co co co co co co co co co co co cn cn cn cn cn cn 3urmese co co co co co co co co co co co cn cn cn 3irman co co co co co co co co co co co co cn cn cn cn Havana Brown co co co co co co co co co co co co co cn cn cn cn cn cn Korat cn cn cn cn cn cn cn cn cn cn cn cn cn cn cn cn cn cn cn cn cn Siamese Bingapura Total 0 8 0/ 0 S l / d..8 / 0 OAV
103 o o o o o o o o o 3 " 3 " 3 " 3 " > > > > > > > > > > > > > > > > > > > > -n -n -n -n CD CD C D C D C D C D C D C D C D C D C D C D C D C D C D C D C D ro ro ro ro r ro CD to to oo co J cn cn co ro ro CD CD σ > cn J cn CD co CD J cn to co cn co cn cn co co cn co j j j ro to co ro cn co co j co CD cn co ro co co cn ro co CD ro ro ro ersian Exotic SH 3ritish SH Scottish Fold Chartreux American SH Sphynx Japanese Bobtail Cornish Rex Ragdoll Vlaine Coon Abyssinian Siberian Norwegian FC Vlanx Egyptian Mau Turkish Angora Turkish Van 3engal Sokoke Dcicat Russian Blue Australian Mist 3urmese 3irman Havana Brown Korat Siamese Bingapura ho ho c co ho ho ho co ho Total 0 8 0/ 0 S l /I d ζζ8 τ/ το OAV
104 Table 13 - Chi-squared test for Hardy-Weinberg Equilibrium by cat breed FCA132 ns ns ns ns ns ns ns ns ns ns ns ns ns ns ns ns ns ns ns ns ns ns ns ns ns 4 FCA149 ns ns ns ns ns ns ns ns ns ns ns ns ns ns ns ns ns ns ns ns ns ns ns ns ns 4 FCA21 1 ns ns ns ns ns ns ns ns ns ns ns ns ns ns ns ns ns ns ns ns ns ns ns ns ns ns ns 2 FCA220 ns ns ns ns ns ns ns ns ns ns ns ns ns ns ns ns ns ns ns ns ns ns ns ns ns ns 3 FCA223 ns ns ns ns ns ns ns ns ns ns ns ns ns ns ns ns ns ns ns ns ns ns 7 FCA224 ns ns ns ns ns ns ns ns ns ns ns ns ns ns ns ns ns ns ns ns ns ns ns ns ns 4 FCA229 ns ns ns ns ns ns ns ns ns ns ns ns ns ns ns ns ns ns ns ns ns ns ns ns 5 FCA262 ns ns ns ns ns ns ns ns ns ns ns ns ns ns ns ns ns ns ns ns ns ns ns 6 FCA293 ns ns ns ns ns ns ns ns ns ns ns ns ns ns ns ns ns ns ns ns ns ns ns ns ns ns ns ns 1 FCA305 ns ns ns ns ns ns ns ns ns ns ns ns ns ns ns ns ns ns ns ns ns ns ns ns ns 4 FCA310 ns ns ns ns ns ns ns ns ns ns ns ns ns ns ns ns ns ns ns ns ns ns ns ns ns ns ns ns ns 0 FCA391 ns ns ns ns ns ns ns ns ns ns ns ns ns ns ns ns ns ns 11 FCA441 ns ns ns ns ns ns ns ns ns ns ns ns ns ns ns ns ns ns ns ns ns ns ns ns ns ns ns ns 1 FCA453 ns ns ns ns ns ns ns ns ns ns ns ns ns ns ns ns ns ns ns ns ns ns ns ns ns ns ns ns 1 FCA628 ns ns ns ns ns ns ns ns ns ns ns ns ns ns ns ns ns ns ns ns ns ns ns ns ns 4 FCA649 ns ns ns ns ns ns ns ns ns ns ns ns ns ns ns ns ns ns ns ns ns ns ns ns 5 FCA678 ns ns ns ns ns ns ns ns ns ns ns ns ns ns ns ns ns ns ns ns ns ns ns ns ns ns 3 FCA698 ns ns ns ns ns ns ns ns ns ns ns ns ns ns ns ns ns ns ns ns ns ns ns ns ns ns ns 2 Total ns = not significantly out of Hardy-Weinberg Equilibrium, = significantly out of HWE with p-value < 0.05
105 14 - Phenotypic SNP Frequencies Long Hair Burmese Points Siamese Points Chocolate Cinnamon FGF5 A475C TYR G715T TYR G940A Phen_TYRP1_5IVS6 TYRP1 C298T Freq. Freq. Breed N AA AC CC C N GG GT TT T N GG GA AA A N CC CG GG Freq. N CC CT TT Persian Exotic SH British SH Scottish Fold Chartreux American SH Sphynx Japanese Bobl Cornish Rex Ragdoll Maine Coon Abyssinian Siberian Norwegian FC Manx Egyptian Mau Turkish Angors Turkish Van Bengal Sokoke Ocicat Russian Blue Australian Mist Burmese Birman Havana Brown Korat Siamese Singapura
106 [0165] Genetic Diversity. The population genetic data is presented in Table 12. The average effective number of SNP alleles observed averaged across breeds, ranging from in Sokoke to in Norwegian Forest and Turkish Angora. The average effective number of STR alleles observed averaged 4.54 across breeds, ranging from 2.42 in Sokoke to 7.23 in Turkish Angora. Private STR alleles within breeds ranged from 0-10, however, when the breeds were compared to worldwide random bred populations, private alleles within breeds dropped to between 0-2 per breed. No SNPs had private alleles in a breed. [0166] The average SNP-based observed heterozygosity was 0.287, ranging from in Sokoke to in Manx. The average STR-based observed heterozygosity was 0.534, ranging from in Singapura to in Siberian. Inbreeding coefficients (FIS) were lowest in the Ragdoll (-0.057) and Siberian (-0.060) with SNPs and STRs, respectively, and highest within the Australian Mist Cats (0.160) and Burmese (0.158). Between population variation FST values were ± with SNPs and ± with STRs. [0167] Breed Clustering. The most likely value of K, the number of structured groupings, could not be decisively determined. A significant difference between the log likelihoods was not evident for either marker type between K = (Figure 7), however, a plateau was suggested near K = 2 1 for STRs and K = 17 for SNPs (Figure 8). As a result, a combination of the Κ plots and common sense directed selection of the most likely number of populations. For STRs, at K > 24 (Figure 9B), different lineages within specific breeds, such as Norwegian Forest Cat and Turkish Angora, became apparent before five other breed groups would split: Persian / Exotic SH, British SH / Scottish Fold, Australian Mist / Burmese, Birman / Korat, and Siamese / Havana Brown. Similar results were found for the SNPs-based analyses; however the associations of the Asian based breeds varied. SNPs appear to resolve the Birman and Singapura breeds from the other Asian breeds more readily. Considering both SNPs and STRs, Persians appear to have influenced several younger and older breeds: Exotic shorthair, Scottish Fold, British Shorthair and Chartreux. For breeds with Asian heritage, Siamese have a strong influence on the Havana Brown, Korats, Birmans, and Singapura (Figure 8). [0168] The principal coordinate analyses indicate the relationship of the sub-groups of breeds and their likely closest random bred origins (Figure 10). The breeds that originated solely from European and American random bred cats cluster with the random
107 bred populations of Europe and America. Likewise, breeds with Asian decent grouped with the South Asian populations of random bred cats, and the Sokoke shows a strong influence from its roots in Kenya. The breeds that do not share similar coordinates with a random bred population such as, Russian Blue, Ocicat, Singapura, Australian Mist and Birman, show a strong influence from both Europe and Asia. [0169] Using Bayesian clustering, the breeds were then assigned back to the eight random bred lineages discussed in Example 1 (Table 15). Four regional areas have contributed to the development of cat breeds. Asian breeds, such as Birman, Burmese, Siamese and others grouped with Southern Asian cats, Western breeds, such as Persian, Norwegian Forest Cat, Maine Coon and others grouped with the Western European random bred cats. Turkish Angora and Turkish Van assigned to the Eastern Mediterranean cats and the Sokoke to the Arabian Sea region. Three breeds showed regional variation depending on the marker type used for assignment. When analyzed with data from SNPs and STRs, the Turkish Angora assigned to the Eastern Mediterranean or Europe, Bengal assigned to the Arabian Sea or Europe, and the Ocicat assigned to Europe or South Asia, respectively. Table 15a Assignment of cat breeds to random bred cat populations using SNPs. Breed SNPs (N=148) Lineage "-log(l)" South East Europe East Med South Medraqlran Arabian India Asia Asia Birman South Asia , , Burmese South Asia , H. Brown South Asia , , , Korat South Asia , , Siamese South Asia , , Singapura South Asia 610, , , , Abyssinian Europe , , , Russian Blue South Asia , , , , American SH Europe 214, , British SH Europe , , Chartreux Europe , Japanese Bob. Europe 241, , Maine Coon Europe , , , Norwegian FC Europe , , Persian Europe 210, , Exotic SH Europe , Sphynx Europe , , Siberian Europe 177, , , Egyptian Mau Europe , , Sokoke W Indian , ,
108 Table 15a Assignment of cat breeds to random bred cat populations using SNPs. Breed SNPs (N=148) Lineage "-log(l)" South East Europe East Med South Medraqlran Arabian India Asia Asia Turkish Angora * Europe Turksih Van East Med Cornish Rex Europe Manx Europe Ragdoll Europe Scottish Fold Europe Australian Mist South Asia Bengal* Europe Ocicat* South Asia *Indicates breeds that assigned to varying origins based on the genetic marker type. Table 15b Assignment of cat breeds to random bred cat populations using STRs. Breed STRs (N=38) Lineage "-log(l)" South East Europe East Me South Me Iraqlran Arabian India Asia Asia Birman South Asia Burmese South Asia H. Brown South Asia Korat South Asia Siamese South Asia Singapura South Asia Abyssinian Europe Russian Blue South Asia American SH Europe British SH Europe Chartreux Europe Japanese Bob. Europe Maine Coon Europe Norwegian FC Europe Persian Europe Exotic SH Europe Sphynx Europe Siberian Europe Egyptian Mau Europe Sokoke W Indian Turkish Angora * East Med Turksih Van East Med Cornish Rex Europe Manx Europe Ragdoll Europe Scottish Fold Europe Australian Mist South Asia
109 Table 15b Assignment of cat breeds to random bred cat populations using STRs. Breed STRs (N=38) Lineage "-log(l)" South East Europe East Me South Me Iraqlran Arabian India Asia Asia Bengal* W Indian Ocicat* Europe *Indicates breeds that assigned to varying origins based on the genetic marker type. [0170] Assignment Testing. The accuracy of assignment testing varied depending upon not only the assignment method, but also the marker type used to differentiate the cat breeds. For example, when comparing the Bayesian method of Rannala & Mountain (1997) versus the Frequentist method of Paetkau et al. (2004), supra, the average sensitivity of assignment for the 148 non-phenotypic SNPs was 0.56 and 0.78, respectively (Table 16). When the five phenotypic SNPs were included with the random SNPs, the average assignment sensitivity was 0.54 and 0.83, respectively. Overall, the STRs had higher average sensitivities of 0.83 and 0.88, respectively. In six breeds, adding phenotypic SNPs into the Frequentist assignment of individuals reduced the sensitivity of the test, and in five breeds it reduced specificity. As this may be due to the strength of selection imposed on these markers we looked to use the phenotypic SNPs as a method of post assignment verification of breed origin for these cats. For many breeds these single-gene traits are the sole selection criteria for breed allocation, and can be seen in the frequency of the causative mutation in the breed (Table 14). Using just the five phenotypic SNPs included in this study, it was possible to correct for miss-assignment of individuals post-assignment testing in 57.5% of the individuals miss-assigned by the Bayesian method and in 50% of the individuals incorrectly assigned by the Frequentist method (Table 17). This would increase the sensitivity and specificity of the Bayesian method to and respectively, and the Frequentist to 0.89 and 0.888, resulting in better resolution than the use of STRs alone. The influence of recent breed development on the mis-allocation of individuals may be further visualized by plotting the crossed assignment rate as a function of the Reynold's distance between breeds (Figure 14). In all cases, the crossed assignment rate increased as the distance between breeds decreased.
110 Table 16a - Assignment accuracy with the Bayesian method of Rannala & Mountain (Rannala & Mountain 1997). Intergenic SNPs Intergenic and phenotypic SNPs STRs Ave. Ave. Breed n Ei E N Sens. Spec. Ave. Prot E Ell Sens. Spec. Prob. Ei Ell Sens. Spec. Prob. Persian * * * Exotic SH British SH Scottish Fold Chartreux American SH Sphynx Japanese Bob Cornish Rex Ragdoll * * Maine Coon Abyssinian Siberian * Manx Egyptian Mau Turkish Angora Turkish Van Bengal Sokoke Ocicat Russian Blue Australian Mist Burmese Birman Havana Brown Korat Norwegian FC * Siamese Singapura All Breeds * Essentially zero due to lack of sensitivity, n = Number of samples from this breed tested over ten iterations, = Members of a breed that were incorrectly assigned to another breed, E Members of a different breed that were incorrectly assigned to the breed in question, Sens. = Sensitivity, Spec. = Specificity, Ave. Prob. = Average Probability of assignment.
111 Table 16b - Assignment accuracy with the Frequentist method of Paetkau et al. (Paetkau et al. 2004). Intergenic SNPs Intergenic and phenotypic SNPs STRs Breed n Ei E N Sens. Spec. Ave. Prob Ei E N Sens. Spec. Ave. Prob. Ei E n Sens. Spec. Prob. Persian Exotic SH British SH Scottish Fold Chartreux American SH Sphynx Japanese Bobtail Cornish Rex Ragdoll Maine Coon Abyssinian Siberian Manx Egyptian Mau Turkish Angora Turkish Van Bengal Sokoke Ocicat Russian Blue Australian Mist Burmese Birman Havana Brown Korat Norwegian FC Siamese Singapura All Breeds * Essentially zero due to lack of sensitivity, n = Number of samples from this breed tested over ten iterations, = Members of a breed that were incorrectly assigned to another breed, E Members of a different breed that were incorrectly assigned to the breed in question, Sens. = Sensitivity, Spec. = Specificity, Ave. Prob. = Average Probability of assignment. Ave.
112 Table 17 Total mis-assigned individuals identified post-assignment by phenotypic SNPs. Assigned by SNPs Assigned by STRs Bayesian Frequentist Bayesian Frequentist Total Freq. Total Freq. Total Freq. Total Freq. Long Hair Burmese Points Siamese Points Chocolate Cinnamon Total* Frequency (SNPs: Bayesian = 221, Frequentist = 110 STRs: Bayesian = 86, Frequentist = 62) *A few individuals were identified as mis-assigned with multiple phenotypic SNPs. Discussion: [0171] The artificial selection and population dynamics of domestic cats and its associated fancy breeds are unique amongst domesticated species. Cats are one of the more recent mammalian domesticates, arguably they exist in a unique quasi-domesticated state. Unlike other agricultural species and the domestic dog, for thousands of years, cats have had minimal artificial selection pressures on their form and function as they have naturally performed their required task of vermin control. Cats are transported between countries via accidental human-mediated travel or by direct importations, reducing barriers to gene flow; however, rabies control legislation has reduced the migration of cats between some countries. Overlapping niches between the wildcat progenitors, random bred feral cats, random bred house cats, and fancy breeds likely produces continual, however limited, gene flow throughout domestic cat world. [0172] The overall selection on the cat genome may be predicted as less intense than in other domesticated species and their breeds. The cat fancy is less than 200 years old, and a majority of cat breeds were developed in the past years. Human selection has focused on aesthetic qualities, such as coat colors and fur types, as opposed to complex behaviors, such as hunting skills, meat or milk production. Many of the cat's phenotypic traits, even ones that affect body and appendage morphologies, are simple traits with basic Mendelian inheritance patterns. One simple genetic change, such as long hair of the Persian versus short hair of the Exotic Shorthair, can be the defining characteristic between two breeds. Cat registries have recognized that some breeds are "natural", such as the Korat and Turkish Van, being specific population isolates, therefore random bred cats of similar
113 origins can be used to augment the gene pools of these selected breeds. Other breeds are recognized as "hybrids", developed from purposeful cross-breeding. Breeds that are interspecies hybrids also exist in the cat fancy, such as the Bengal, which is a hybrid between an Asian leopard cat and various domestic breeds, such as Abyssinian and Egyptian Mau. Thus, some cat breeds may be a concoction of various genetic backgrounds. [0173] Breed assignment studies of cats can be of great value to humans and the cat itself in a variety of applications. As models for human disease, cat population structuring is important to the proper selection of cases and controls in the study design of genomewide association studies. Cross-bred cats may unknowing transport undesired mutations into naive breed populations, and affect the breed's health and veterinary care. Polycystic kidney disease (PKD) is found in roughly 40% of Persians worldwide and has been documented in breeds with Persian influence, such as Scottish Folds and British Shorthairs (Lyons et al. (2004) Journal of the American Society of Nephrology, 15: ). The identification of migrants or hybridized individuals may affect the registration policies of a breed association. Out of curiosity, many of the lay public may like to know the origins of their cat and if their cat has pedigreed roots. Thus, this study has focused on the feasibility and power of genetic markers to delineate 29 of the world's cat breeds. SNPs and STRs were evaluated to assess the effects of genetic markers with different mutation rates on domestic cat regional clustering, breed clustering, and individual breed assignment. The selected 29 breeds were expected to represent the major breeds of the cat fancy. Several breeds were purposely selected that had been clearly derived from another breed, such as Persians and Exotics, while others were selected because they were recently developed hybrid breeds, such as the Ocicat and the Australian Mist. More slowly evolving SNPs and relatively quickly evolving STRs were examined as to their power to resolve these cat breeds that have different patterns and ages of ancestry. [0174] Genetic Diversity. Significant genetic variation is present in many cat breeds. The Turkish Angora, a breed from Turkey, an area near the seat of cat domestication, had the highest effective number of alleles for both SNPs and STRs. A continuum of increasing heterozygosity and decreasing inbreeding, whether SNP- or STRbased, is found between the least variable and most variable domesticated cat breeds. Two of the more popular breeds of the USA and the world are Persians and Bengals (on the internet at tica.org/). Persians were one of the first breeds to be recognized and Bengals, although only introduced in the past 40 years have risen to worldwide fame. Both breeds
114 had moderate levels of heterozygosity and inbreeding. Several less popular breeds, such as the Cornish Rex, had fairly high levels of variation and low inbreeding. Two relatively new breeds, the Siberian and Ragdoll, have high variation, perhaps a reflection of their recent development from random bred populations. Thus, levels of variation and inbreeding cannot entirely be predicted based on breed popularity and breed age, implying management by the cat breeders may be the most significant dynamic for breed genetic population health. Interestingly, the Burmese had one of the highest levels of inbreeding and lowest levels of genetic variation. Burmese were established in the post-world War II breed boom, and has been a moderately popular breed. However, concerns for two diseases, a craniofacial defect and hypokalemia, has limited migration of cats between countries and within the USA. Fractionation of the breeding pool by color preferences within the USA has also caused poor breeding dynamics. Thus, a reduction in observed heterozygosity due to the Wahlundeffect may be likely, resulting in an under-estimation of the already severely high inbreeding coefficients, possibly sending the Burmese into extinction. A breed management plan that balances diversity, health and breed type may need to be implemented to help the Burmese breed survive. [0175] Breed Clustering. The most likely value of K, the number of structured groupings, could not be decisively determined. Several factors that violate many of the assumptions in the models implemented by Structure may have caused this difficulty. Cat breeds have variation in age of development, significantly different genetic population origins, and the variation in breeding practices can create distinct lines within one breed that may be as unique as one of the more recently established breeds. Many breeds were created through the crossing of two often highly divergent populations of cats resulting in a hybrid of sorts while other breeds still allow the introduction of cats from random bred populations. However, the Bayesian cluster analysis supported the breed demarcations from previous studies, especially the STR analyses of Lipinski et al. (2007) Animal Genetics, 38, Previously, 22 breeds, which included 15 of 16 "foundation" cat breeds designated by the Cat Fanciers Association, delineated as separate populations. This study added seven additional breeds, including the missing 16th "foundation" breed, the Manx. As in previous studies, the novel breeds that were not deemed significantly distinct from another breed can be very clearly explained by the breed history. The two large breed families of Siamese and Persians were re-identified and the Persian family expanded with Scottish Folds. In addition to the previously recognized grouping of the Siamese / Havana Brown, the
115 Australian Mist, which was created by cross-breeding with Burmese, grouped with the Burmese. However, more recent breeds, such as Ragdoll and Bengal, are resolved as separate breed populations, suggesting STRs alone can differentiate about 24 of 29 breeds, as well as Turkish-origin versus USA-origin Turkish Angoras. At K = 17, SNPs could not differentiate the Singapura, however, the Birman separation from other Asiatic breeds could be defined. Thus, both sets of markers provide valuable insight to the relationship of the breeds. [0176] Regional Clustering. Regardless of the marker assayed and using both Bayesian assignment testing and principal coordinate analyses, the majority of the breeds assigned back to the random bred population most influential to the creation of that breed, as suggested by popular breed histories. Sixteen breeds originate from European populations, six breeds form South Asian populations, two breeds from the Eastern Mediterranean, the Turkish Van and the Turkish Angora, and the Sokoke from the Arabian Sea region. However, some exceptions were noted depending on the marker of analysis. For SNPs versus STRs, the Turkish Angora assigned to the Eastern Mediterranean or Europe, respectively, Bengal assigned to the Arabian Sea or Europe, respectively, and the Ocicat assigned to Europe or South Asia, respectively. The Turkish Angora breed was reconstituted from the Persian (European) pedigree post World Wars and recently, has been increasing genetic diversity via the outcrossing of pedigreed Turkish Angora cats to the random bred cats of Turkey. The identified lineages within the breed may be identifying the recent influx of random bred cats. The confusion in the Bengal and the Ocicat assignments could be a result of the contribution of the Abyssinian and Egyptian Mau and the Abyssinian and the Siamese, respectively, which are breeds with different regional assignments. [0177] Assignment Testing. Overall, the Frequentist method of Paetkau et al. (2004), supra, outperformed the Bayesian method of Rannala and Mountain (1997), supra. In addition, while the 38 highly polymorphic STRs consistently outperformed the SNPs, the addition of phenotypic SNPs as a post-assignment verification significantly improved the assignment rates using the frequentist method. For the 29 breeds, when intergenic SNPs were used with the frequentist method for assignment, the sensitivity of assignment was equal to or better than that of the STRs in 12 breeds and the specificity in 19 breeds. With the addition of only five phenotypic determining SNPs, specificity improved to 15 breeds,
116 equaling or surpassing in the sensitivity of assignment of the STRs and 19 breeds equaling or outperforming in specificity of assignment. [0178] In six breeds, adding phenotypic SNPs into the frequentist assignment of individuals reduced the sensitivity of the test, and in five breeds it reduced specificity. As this may be due to the strength of selection imposed on these markers we looked to use the phenotypic SNPs as a method of post assignment verification of breed origin for these cats. For many breeds these single-gene traits are the sole selection criteria for breed allocation, and can be seen in the frequency of the causative mutation in the breed (Table 14). In general, breeds that were more inbred and both not used in outcrosses, nor developed through the crossing of pre-existing breeds had a higher accuracy in reassignment. Breeds such as the Russian Blue, Sokoke and Abyssinian are examples of such. In contrast, breeds where outcrossing is common either with other breeds or random bred populations tended to confuse the assignment algorithm and had a high probability of both Type I and II error. These would be breeds such as the Persians, Turkish Angoras, Siamese and Ragdoll. The most common error in assignment by far was cross assignment between Exotic shorthairs and Persians - a problem easily remedied through exploiting the FGF5 SNP shown to cause long hair in Persians. [0179] The influence of recent breed development on the mis-allocation of individuals may be further visualized by plotting the crossed assignment rate as a function of the Reynold's distance between breeds (Figure 11). In all cases, the crossed assignment rate increased as the distance between breeds decreased. This correlates exactly with what would be expected. Breeds that are considered separate solely on a color variant or hair length would be very close genetically and as a result, more prone to cross assignment. [0180] The advantage was tipped in favor of SNPs when the five phenotypic SNPs were included as a post-assignment check. Initially, cats could be localized to a regional population and a breed family by STRs and / or SNPs. Secondary differentiation within the breed family could be determined by genotyping mutations for phenotypic traits, especially traits that are breed specific to or fixed within a breed. Some traits are required for breed membership; a Birman or Siamese must be pointed, implying homozygous for the G940A TYR mutation. Some traits are grounds for exclusion, all Korats are solid blue, no other colors or patterns are acceptable. Therefore, a trait such as the long haired A475C FGF5 mutation could be used as a means for identifying members of the Persian, Maine Coon, Turkish Angora, Turkish Van and Birman breeds, and likewise a means for discrimination
117 as an exclusion maker for breeds such as the Abyssinian, Egyptian Mau, Sokoke and Ocicat. Other single gene traits may be used to identify members of a small family of cat breeds as well, such as the Burmese points, G715T TYR, are a prerequisite for membership to the Burmese and Singapura breeds, and Siamese points, G940A TYR, as their name suggests, are a requirement for Birmans, Himalayans and, of course, Siamese cats. The cinnamon mutation, C298T TYRP1, is very rare and is common to the red Abyssinian. Certain dominant traits can be homozygous or heterozygous, such as the ear curl of American Curls or the bobtail of the Japanese Bobtail. Some dominant traits are homozygous lethal in utero, such as tailless of the Manx (Todd (1961) Journal of Heredity, 52: ), or cause health problems, such as osteochondroplasia caused by the ear fold mutation in Scottish Folds (Malik et al. (1999) Australian VeterinaryJournal, 77:85-92). As a result, the breed may have cats that conform to the breed except do not express the breed-specific trait, such as straight-eared Scottish Folds, or tailed Manx. These varieties would currently be difficult to distinguish within the breed family or region. [0181] Cat fancy registries may not agree with assignments due to breeding restrictions. The Tonkinese, which is genetically compound heterozygous for the G940A and the G715T TYR mutations, can produce both pointed and sepia cats, thus they would genetically resemble a Siamese or Burmese, respectively. However, breeding restrictions would not allow these Tonkinese variants to be registered as Siamese or Burmese. Since the development of this SNP panel, additional phenotypic SNPs have been discovered in cats including the Norwegian Forest Cat color variant amber (Peterschmitt et al. (2009) Animal Genetics, 40: ), three additional long-haired mutations (Kehler et al. (2007) Journal of Heredity, 98: ), and the mutations responsible for hairless of Sphynx and rexing of the Devon Rex (Gandolfi et al, Mamm Genome. (2010) (9-10):509-15). These additional mutations, as well as disease mutations, could further delineate cat breeds. [0182] Conclusions. Aside from the public interest in knowing their prized family pet is descendent from a celebrated pedigree, breed assignment is a vital tool in tracing the spread of genetically inherited diseases throughout the cat world. Much like humans and dogs, certain populations of cats are known to be at higher risk for particular diseases, such as heart disease in the Maine Coon and Ragdoll (Meurs et al. (2005) Human Molecular Genetics, 14: ; Meurs et al. (2007) Genomics, 90: ), polycystic kidney disease in the Persian (Lyons et al. 2004, supra), and progressive retinal atrophy in the Abyssinian (Menotti-Raymond et al. (2007) Journal of Heredity, 98: ). Knowing if
118 a particular feline descended from one of these at risk populations may influence treatments in a clinical setting and help us to better care for our animal companions. With additional phenotypic and perhaps disease-causing SNPs, the power of this STR / SNP panel to accurately assign individuals to specific cat breeds would be greatly increased, in particular those breeds that are defined expressively by single-gene traits. Example 3 Tables of Population Clustering at Different K Values
119 Table 18 - Population clustering of each pedigreed individual in the database by STRs at K = 21 Feline ID Missing Groups Population No. Data Persian , , Persian Persian O. Persian , , O. Persian , , O. Persian , , O. Persian , , O. Persian , , O. Persian O. Persian , , O. Persian , , O. Persian , , O. Persian , , O. Persian , , O. Persian O. Exotic SH O. Exotic SH , , O. Exotic SH , , O. Exotic SH , , O. Exotic SH , , O. Exotic SH , , O. Exotic SH O. Exotic SH , , O. Exotic SH , , O. Exotic SH , , O. Exotic SH , , O. Exotic SH , , O. Exotic SH O. Exotic SH O. Exotic SH , , O. Exotic SH , , O. Exotic SH , , O. Exotic SH , , O. Exotic SH , , O. British SH O. British SH , , O. British SH , O.
120 Table 18 - Population clustering of each pedigreed individual in the database by STRs at K = 21 Feline ID Missing Groups Population No. Data British SH , British SH , British SH , British SH British SH O. British SH , O. British SH , O. British SH , O. British SH , O. British SH , O. British SH O. British SH , O. British SH , O. British SH , O. British SH , O. Scottish Fold , O. Scottish Fold O. Scottish Fold O. Scottish Fold , O. Scottish Fold , O. Scottish Fold , O. Scottish Fold , O. Scottish Fold , O. Scottish Fold O. Scottish Fold , O. Scottish Fold , O. Scottish Fold , O. Scottish Fold , O. Scottish Fold , O. Scottish Fold O. Scottish Fold O. Scottish Fold , O. Chartreux , O. Chartreux , O. Chartreux , O. Chartreux , O. Chartreux O. Chartreux O. Chartreux O.
121 Table 18 - Population clustering of each pedigreed individual in the database by STRs at K = 21 Feline ID Missing Groups Population No. Data Chartreux , , Chartreux , , Chartreux , , Chartreux Chartreux O. Chartreux , , O. American SH , , O. American SH , , O. American SH , , O. American SH , , O. American SH O. American SH , , O. American SH , , O. American SH , , O. American SH , , O. American SH , , O. American SH O. American SH O. American SH , , O. American SH , , O. Sphynx , , O. Sphynx , , O. Sphynx , , O. Sphynx O. Sphynx , , O. Sphynx , , O. Sphynx , , O. Sphynx , , O. Sphynx , , O. Sphynx O. Sphynx O. Sphynx , , Sphynx , , O. Sphynx , , O. Sphynx , , O. Sphynx , , O. Sphynx O. Japanese BT , , O. Japanese BT , , O.
122 Table 18 - Population clustering of each pedigreed individual in the database by STRs at K = 21 Feline ID Missing Groups Population No. Data Japanese BT , , Japanese BT , , Japanese BT , , , Japanese BT Japanese BT O. Japanese BT , , O. Japanese BT , , O. Japanese BT , , Japanese BT , , Japanese BT , , , O. Japanese BT O. Japanese BT , , , O. Japanese BT , , O. Japanese BT , , O. Japanese BT , , O. Japanese BT , , O. Japanese BT O. Cornish Rex O. Cornish Rex , , O. Cornish Rex , , O. Cornish Rex , , O. Cornish Rex , , O. Cornish Rex , , , O. Cornish Rex O. Cornish Rex , , , O. Cornish Rex , , , O. Cornish Rex , , , O. Cornish Rex , , , O. Cornish Rex , , , O. Cornish Rex O. Cornish Rex O. Cornish Rex , , O. Ragdoll , , O. Ragdoll , O. Ragdoll , , O. Ragdoll , , , O. Ragdoll O. Ragdoll , , O. Ragdoll , , O.
123 Table 18 - Population clustering of each pedigreed individual in the database by STRs at K = 21 Feline ID Missing Groups Population No. Data Ragdoll , , , Ragdoll , , , Ragdoll , , , Ragdoll Ragdoll O. Ragdoll , , O. Ragdoll , , O. Ragdoll , , O. Maine Coon , , O. Maine Coon , , , O. Maine Coon O. Maine Coon , , , O. Maine Coon , , , O. Maine Coon , , , O. Maine Coon , , , O. Maine Coon , , , O. Maine Coon O. Maine Coon O. Maine Coon , , , O. Maine Coon , , , O. Maine Coon , , , O. Maine Coon , , , O. Maine Coon , , , O. Maine Coon O. Maine Coon , , , O. Maine Coon , , , O. Maine Coon , , , O. Abyssinian , , , O. Abyssinian , , , O. Abyssinian O. Abyssinian O. Abyssinian , , , O. Abyssinian , , , O. Abyssinian , , O. Abyssinian , , O. Abyssinian , , , O. Abyssinian O. Abyssinian , , , O. Abyssinian , O.
124 Table 18 - Population clustering of each pedigreed individual in the database by STRs at K = 21 Feline ID Missing Groups Population No. Data Abyssinian , Abyssinian , Abyssinian , Siberilan Siberiian O. Siberiian , O. Siberi an , O. Siberi an , O. Siberiian , O. Siberiian , O. Siberiian O. Siberiian , O. Siberiian , O. Siberiian , O. Siberiian , O. Siberiian , O. Siberiian Siberiian O. Siberiian , O. Siberiian , O. Norwegian FC O. Norwegian FC , O. Norwegian FC , O. Norwegian FC O. Norwegian FC , O. Norwegian FC , O. Norwegian FC , O. Norwegian FC , O. Norwegian FC , O. Norwegian FC O. Norwegian FC O. Norwegian FC , O. Norwegian FC , O. Norwegian FC , O. Norwegian FC , O. Manx , O. Manx O. Manx , O. Manx , O.
125 Table 18 - Population clustering of each pedigreed individual in the database by STRs at K = 21 Feline ID Missing Groups Population No. Data Manx , , Manx , , Manx , , Manx Manx O. Manx , , O. Manx , O. Manx , , O. Manx , , O. Manx , , O. Manx O. Manx , , O. Manx , , O. Egypt an Mau , , O. Egypt an Mau , , O. Egypt an Mau , , O. Egypt an Mau O. Egypt an Mau O. Egypt an Mau , , O. Egypt an Mau , , O. Egypt an Mau , , O. Egypt an Mau , , O. Egypt an Mau , , O. Egypt an Mau O. Egypt an Mau , , O. Egypt an Mau , , O. Egypt ian Mau , , O. Turk. Angora , , O. Turk. Angora , , O. Turk. Angora O. Turk. Angora O. Turk. Angora , , O. Turk. Angora , , O. Turk. Angora , , O. Turk. Angora , , O. Turk. Angora , , O. Turk. Angora O. Turk. Angora , , O. Turk. Angora , O.
126 Table 18 - Population clustering of each pedigreed individual in the database by STRs at K = 21 Feline ID Missing Groups Population No. Data Turk. Angora , , Turk. Angora , , Turk. Angora , , Turk. Angora Turk. Angora O. Turk. Angora , , O. Turk. Angora , , O. Turk. Angora , , O. Turk. Angora , , O. Turkish Van , , O. Turkish Van O. Turkish Van , , O. Turkish Van , , O. Turkish Van , , O. Turkish Van , , O. Turkish Van , , O. Turkish Van O. Turkish Van O. Turkish Van , , O. Turkish Van , , O. Turkish Van , , O. Turkish Van , , O. Turkish Van , , O. Turkish Van O. Turkish Van , , O. Turkish Van , , O. Turkish Van , , O. Turkish Van , , O. Turkish Van , , O. Bengal O. Bengal O. Bengal , , O. Bengal , , O. Bengal , , O. Bengal , , O. Bengal , , O. Bengal O. Bengal , , O. Bengal , , O.
127 Table 18 - Population clustering of each pedigreed individual in the database by STRs at K = 21 Feline ID Missing Groups Population No. Data Bengal , Bengal , Bengal , Bengal Bengal O. Bengal , O. Bengal O. Bengal , O. Sokoke , O. Sokoke , O. Sokoke O. Sokoke , , O. Sokoke , , O. Sokoke , , O. Sokoke , , O. Ocicat , , o. Ocicat O. Ocicat O. Ocicat , , O. Ocicat , , O. Ocicat , O. Ocicat , , O. Ocicat , , O. Ocicat O. Ocicat , , O. Russian Blue , O. Russian Blue , O. Russian Blue , O. Russian Blue , O. Russian Blue O. Russian Blue , , O. Russian Blue , , O. Russian Blue , , O. Russian Blue , O. Russian Blue , O. Russian Blue , O. Russian Blue O. Russian Blue , O. Russian Blue O.
128 Table 18 - Population clustering of each pedigreed individual in the database by STRs at K = 21 Feline ID Missing Groups Population No. Data Russian Blue , , Russian Blue , , Russian Blue , , Aust. Mist Aust. Mist O. Aust. Mist , , O. Aust. Mist , , O. Aust. Mist , , O. Aust. Mist , , O. Aust. Mist , , O. Aust. Mist O. Aust. Mist , , O. Aust. Mist , , O. Aust. Mist , , O. Aust. Mist , , O. Aust. Mist , , O. Aust. Mist O. Aust. Mist O. Burmese , , O. Burmese , , O. Burmese , , O. Burmese , , O. Burmese , , O. Burmese O. Burmese , , O. Burmese , , O. Burmese , , O. Burmese , , O. Burmese , , O. Burmese O. Burmese , , Burmese , , O. Burmese , , O. Burmese , , O. Burmese , O. Burmese , , O. Burmese O. Birman , , O. Birman , , O.
129 Table 18 - Population clustering of each pedigreed individual in the database by STRs at K = 21 Feline ID Missing Groups Population No. Data Birman , , Birman , , Birman , , Birman Birman O. Birman , , O. Birman , , O. Birman , , O. Birman , , O. Birman , O. Birman O. Birman , O. Birman , O. Birman , , O. Birman , , O. Birman , , O. Birman O. Birman O. Havana Brn , , o. Havana Brn , , Havana Brn , , o. Havana Brn , , o. Havana Brn , , o. Havana Brn o. Havana Brn , , o. Havana Brn , , Havana Brn , , o. Havana Brn , , Havana Brn , , Havana Brn o. Havana Brn , , o. Havana Brn , , o. Korat , , o. Korat , , o. Korat , , o. Korat , , o. Korat o. Korat , , o. Korat , , o.
130 Table 18 - Population clustering of each pedigreed individual in the database by STRs at K = 21 Feline ID Missing Groups Population No. Data Korat , , o. Korat , , o. Korat , , o. Korat o. Korat o. Korat , , o. Korat , , o. Korat , , o. Korat , , o. Korat , , o. Korat o. Korat , , o. Korat , , o. Korat , , o. Korat , , o. Korat , , o. Korat o. Korat o. Siamese , , o. Siamese , , Siamese , , o. Siamese , , Siamese , , o. Siamese o. Siamese , , o. Siamese , , o. Siamese , , Siamese , , Siamese , , o. Siamese Siamese , , Siamese , , Siamese , , Singapura , , O. Singapura , , Singapura , , Singapura Singapura , , Singapura , ,
131 Table 18 - Population clustering of each pedigreed individual in the database by STRs at K = 2 1 Feline ID Missing Groups Population No. Data Singapura ,.001 0, , ,.001 0,.001 0, , ,.001 0, , , , , , ,.001 0,.001 Singapura ,.001 0, , ,.001 0,.001 0,.001 0, ,.001 0, , , , , , , ,.001 Singapura ,.001 0, , , , , , ,.001 0, , , , , , , ,.001 Singapura ,.002 0, , , ,.005 0, , ,.002 0, , , ,.001 0, , , ,.002 Singapura , ,.002 0, , , , , , , , ,.002 0, , , , ,.005 Singapura , , ,.002 0,.002 0,.001 0,.002 0, ,.001 0, , , , , , , ,.003 Singapura , , , ,.001 0,.001 0, , , , , , , , , , ,.001 Singapura ,.001 0, , , , ,.001 0, , , , , , , , , ,.003 Singapura , , , ,.002 0,.001 0, , , , , , , , , , ,.003 Singapura ,.001 0,.001 0,.001 0,.001 0,.001 0,.001 0,.001 0,.001 0, , ,.001 0,.001 0, , , ,.001 Singapura , , ,.002 0, ,.001 0, ,.003 0, , , ,.002 0, , , ,.001 0,.002 o
132 Table 19 - Population clustering of each pedigreed individual in the database by SNPs at K = 17 Feline ID Missing Groups Population No. Data Persian ,.001 0,0034 0, , , , Persian ,.001 0,0019 0, , , , Persian Persian , ,0684 0, , , , Persian , ,002 0, , , , Persian , ,0071 0, , , , Persian ,.002 0,0068 0, , , , Persian , ,0062 0, , , , Persian , ,0126 0, , , , Persian , ,0896 0, , , , Persian Persian , ,0092 0, , , , Persian ,.001 0,002 0, , , , Persian , ,001 0, , , , Persian ,.001 0,002 0, , , , Exotic SH Exotic SH ,.005 0,0171 0, , , , Exotic SH , ,0107 0, , , , Exotic SH ,.001 0,0021 0, , , , Exotic SH , ,0228 0, , , , Exotic SH Exotic SH , ,6721 0, , , , Exotic SH , ,3718 0, , , , Exotic SH ,.001 0,4978 0, , , , Exotic SH , ,475 0, , , , Exotic SH Exotic SH , ,6168 0, , , , Exotic SH ,.002 0,2903 0, , , , Exotic SH , ,3558 0, , , , Exotic SH , ,5542 0, , , , Exotic SH Exotic SH , ,3267 0, , , , Exotic SH , ,544 0, , , , Exotic SH British SH , ,4419 0, , , ,
133 Table 19 - Population clustering of each pedigreed individual in the database by SNPs at K Feline ID Missing Groups Population No. Data British SH British SH British SH British SH British SH British SH British SH British SH British SH British SH British SH British SH British SH British SH British SH British SH British SH Scottish Fold Scottish Fold Scottish Fold Scottish Fold Scottish Fold Scottish Fold Scottish Fold Scottish Fold Scottish Fold
134 able 19 - Population clustering of each pedigreed individual in the database by SNPs at K = 17 Feline ID Missing Groups Population No. Data Scottish Fold Scottish Fold Scottish Fold Scottish Fold Scottish Fold Scottish Fold Scottish Fold Scottish Fold Chartreux , , , , , ,0026 0, ,001 0, , Chartreux , , , , ,.001 0,0013 0,.001 0,001 0, , Chartreux , , , , , ,0036 0,.003 0,0019 0, , Chartreux , , , , , ,0086 0, ,0015 0, ,.002 0,0038 Chartreux Chartreux , , , , , ,0089 0, ,002 0, , ,0078 Chartreux , , , , , ,0123 0, ,0186 0, , ,01 14 Chartreux , , , , , ,003 0, ,0037 0, , ,0072 Chartreux , , , , , ,0941 0, ,0021 0, , ,063 Chartreux Chartreux , , , , , ,0282 0, ,0044 0, , ,0317 Chartreux , , , , , ,0259 0, ,0044 0, , Chartreux , , , , , ,0043 0, ,002 0, , American SH American SH , , ,0418 0, , , , ,1848 American SH , , ,0106 0, ,.001 0, ,.01 0,2377
135 able 19 - Population clustering of each pedigreed individual in the database by SNPs at K = 17 Feline ID Missing Groups Population No. Data American SH American SH American SH American SH American SH American SH American SH American SH American SH American SH American SH , , , ,0023 0, ,3483 0, ,0036 0, , , Sphynx , , , ,0016 0, ,4479 0, ,001 0, , , Sphynx , , , ,0018 0, ,3616 0, ,001 0, , , Sphynx , , , ,0037 0,.003 0,3736 0, ,001 0, , , Sphynx Sphynx , , , ,0018 0, ,4772 0, ,001 0, , , Sphynx , , ,.001 0,0022 0, ,399 0, ,0021 0, , , Sphynx , , , ,0025 0, ,3356 0, ,001 0, , , Sphynx , , , ,002 0, ,4309 0, ,0017 0, , , Sphynx Sphynx , , , ,0109 0, ,1648 0, ,0018 0, , , Sphynx , , , ,0277 0, ,2448 0, ,002 0, , , Sphynx Sphynx , , , ,0025 0, ,3368 0, ,0046 0, , ,
136 Feline ID Missing Groups Population No. Data Sphynx Sphynx Sphynx Sphynx Japanese BT Japanese BT Japanese BT Japanese BT Japanese BT Japanese BT Japanese BT Japanese BT Japanese BT Japanese BT Japanese BT Japanese BT Japanese BT Japanese BT Japanese BT Japanese
137 Table 19 - Population clustering of each pedigreed individual in the database by SNPs at K Feline ID Missing Groups Population No. Data BT Japanese BT Japanese BT , , ,.004 0,0027 0,.003 0,001 0, ,002 0, , , Japanese BT , , , ,001 0, ,001 0, ,001 0, , , Cornish Rex , , , ,0049 0, , , ,0079 0, , , Cornish Rex Cornish Rex , , ,.003 0,0045 0, ,0181 0, ,0021 0, , , Cornish Rex , , ,.002 0,0223 0, ,0055 0, ,0064 0, , , Cornish Rex , , , ,0151 0, ,0012 0, ,0109 0, , , Cornish Rex , , , ,0166 0, ,0065 0, ,0034 0, , , Cornish Rex Cornish Rex , , , ,0015 0, ,001 0,.002 0,002 0, , , Cornish Rex , , ,.002 0,0046 0, ,0032 0, ,0017 0, , , Cornish Rex , , ,.002 0,0018 0,.002 0,0012 0, ,0035 0, , , Cornish Rex , , , ,0135 0,.008 0,0051 0, ,0032 0, , , Cornish Rex Cornish Rex , , , ,0166 0, ,0055 0, ,0136 0, , , Cornish Rex , , , ,0042 0,.002 0,001 0, ,001 0, , ,
138 J able 19 - Population clustering of each pedigreed individual in the database by SNPs at K = 17 Feline ID Missing Groups Population No. Data Cornish Rex Ragdoll Ragdoll Ragdoll Ragdoll Ragdoll Ragdoll Ragdoll Ragdoll Ragdoll Ragdoll Ragdoll Ragdoll Ragdoll Ragdoll Ragdoll Maine Coon Maine Coon Maine Coon i Coon Coon Maine Coon a i e Coon Maine Coon Ma i e Coon
139 J able 19 - Population clustering of each pedigreed individual in the database by SNPs at K = 17 Feline ID Missing Groups Population No. Data Maine Coon , , , ,0034 0, ,2196 0, ,0023 0, , ,002 0, ,0506 Ivl l N Coon , , , ,0173 0, ,002 0, ,0034 0, , ,0034 0, ,0057 ai e Coon , , ,.002 0,0071 0, ,0036 0, ,0021 0, ,.161 0,0107 0, ,1601 Maine Coon , , , ,0054 0, ,0237 0, ,003 0, , ,0025 0, ,171 1 i Coon , , , ,0071 0, ,0027 0, ,0102 0, , ,0023 0, ,1657 a ine Coon , , , ,0034 0, ,0038 0, ,0313 0, , ,0036 0, ,1946 Maine Coon , , , ,0034 0, ,1474 0, ,0109 0, , ,002 0, ,1387 iv ft iaine Coon iviaine Coon , , , ,0212 0, ,0018 0, ,0023 0, , ,0037 0, ,0983 ai e Coon , , , ,0043 0, ,002 0, ,0071 0, , ,0038 0, ,1618 Abyssinian Abyssinian , , , ,0028 0,.02 0,0071 0, ,0018 0, , ,0016 0, ,2179 Abyssinian , , , ,0035 0, ,0027 0,.007 0,004 0, , ,0097 0, ,2003 Abyssinian , , , ,0037 0, ,0222 0, ,0017 0, , ,0036 0, ,1997 Abyssinian , , , ,0046 0, ,0963 0, ,0042 0, , , , ,1909 Abyssinian Abyssinian , , , ,005 0, ,0179 0, ,002 0, ,.005 0,0063 0, ,0051 Abyssinian , , ,.001 0,002 0, ,0018 0, ,0012 0, , ,001 0, ,0016 Abyssinian , , , ,0046 0, , , ,0021 0, , ,0531 0, ,0019 Abyssinian , , , ,0129 0,.007 0,0033 0, ,0337 0, , ,0093 0, ,0149 Abyssinian Abyssinian , , ,.002 0,0059 0, ,002 0, ,002 0, , ,0023 0, ,0064 Abyssinian , , , ,0187 0, ,001 0, ,0218 0, , ,003 0, ,0038 Abyssinian Abyssinian , , ,.008 0,005 0, ,0016 0, ,0968 0, , ,0044 0,.821 0,003
140 Table 19 - Population clustering of each pedigreed individual in the database by SNPs at K Feline ID Missing Groups Population No. Data Siberian , , ,0058 0, ,0121 0, Siberian , , ,0031 0,.002 0,0094 0, Siberian Siberian , , ,0264 0, ,0125 0, Siberian , ,.002 0,0033 0, ,0036 0, Siberian , ,.002 0,001 0, ,0054 0, Siberian , , ,0069 0, ,0123 0, Siberian , , ,1061 0, ,0121 0, Siberian , , ,0016 0, ,0033 0, Siberian , , ,003 0, ,0049 0, Siberian Siberian , , ,0038 0, ,0047 0, Siberian , , , , ,0028 0, Siberian , ,.002 0,0146 0, ,0147 0, Siberian , , ,0021 0, ,0033 0, Siberian Siberian , , ,021 0,.008 0,0077 0, Norwegian FC Norwegian FC Norwegian FC Norwegian FC Norwegian FC Norwegian FC Norwegian FC Norwegian FC Norwegian FC
141 Table 19 - Population clustering of each pedigreed individual in the database by SNPs at K = 17 Feline ID Missing Groups Population No. Data Norwegian FC , , ,0023 0, , , , , Norwegian FC , ,.005 0,0028 0, ,0058 0, , , Norwegian FC , , ,002 0, ,0071 0, , , Norwegian FC , , ,0046 0, ,0078 0, , , Norwegian FC , , ,001 0, ,002 0, , , Norwegian FC , , ,0031 0, ,0096 0, , , Manx , ,.002 0,002 0, ,0123 0, , , Manx , , ,0062 0, ,016 0, , , Manx , , ,001 0, ,0046 0, , , Manx Manx , , ,0019 0, ,0085 0, , , Manx , , ,0013 0,.002 0,0131 0, , , Manx , , ,0023 0, ,033 0, , , Manx , , ,0014 0, ,0056 0, , , Manx Manx , , ,0015 0, ,0041 0, , , Manx , , ,0022 0, ,0256 0, , , Manx , , ,0591 0, ,6295 0, , , Manx , , ,0031 0,.012 0,2192 0, , , Manx Manx , , ,002 0,.002 0,0078 0, , , Manx , , ,0074 0, ,0327 0, , , Manx , , ,0037 0,.014 0,1974 0, , , Egyptian Mau Egyptian Mau , , ,0021 0, ,0094 0, , , Egyptian Mau , , ,001 0,.002 0,0088 0, , ,
142 Table 19 - Population clustering of each pedigreed individual in the database by SNPs at K = 17 Feline ID Missing Groups Population No. Data Egyptian Mau Egyptian Mau Egyptian Mau Egyptian Mau Egyptian Mau Egyptian Mau Egyptian Mau Egyptian Mau Egyptian Mau Egyptian Mau Egyptian Mau Turk. Angora Turk. Angora Turk. Angora Turk. Angora Turk. Angora Turk. Angora Turk
143 Table 19 - Population clustering of each pedigreed individual in the database by SNPs at K Feline ID Missing Groups Population No. Data Angora Turk. Angora Turk. Angora , , , ,087 0, ,0051 0, ,0123 0, , ,0121 0, Turk. Angora , , , ,0854 0, ,0046 0, ,0049 0, , ,019 0, Turk. Angora , , ,.023 0,0289 0, ,0028 0, ,0055 0, , ,0066 0, Turk. Angora Turk. Angora , , , ,0244 0, ,0024 0, ,0038 0, , ,003 0, Turk. Angora , , ,.005 0,006 0, ,0016 0, ,0036 0, , ,0197 0, Turk. Angora , , ,.021 0,0041 0, ,005 0, ,0056 0, , ,0052 0, Turk. Angora , , , ,0065 0, ,0123 0,.006 0,0085 0, , ,01 1 0, Turk. Angora Turk. Angora , , , ,0404 0, ,0025 0, ,0061 0, , ,0031 0, Turk. Angora , , , ,0052 0, ,0036 0, ,0266 0, , ,0099 0, Turk. Angora , , , ,0258 0, ,0019 0,.766 0,0355 0, , ,0026 0, Turk. Angora , , , ,0035 0, ,0018 0, ,018 0, , ,0159 0, Turkish Van Turkish Van , , , , ,.005 0,0012 0,.852 0,0031 0, , , , Turkish Van , , , ,0042 0, ,0028 0, ,0165 0, , , ,
144 Table 19 - Population clustering of each pedigreed individual in the database by SNPs at K Feline ID Missing Groups Population No. Data Turkish Van Turkish Van Turkish Van Turkish Van Turkish Van Turkish Van Turkish Van Turkish Van Turkish Van Turkish Van Turkish Van Turkish Van Turkish Van Turkish Van Turkish Van Turkish Van Turkish Van Bengal
145 Table 19 - Population clustering of each pedigreed individual in the database by SNPs at K = 17 Feline ID Missing Groups Population No. Data Bengal , , ,3067 0, , , Bengal , ,.026 0, , , , Bengal Bengal , , ,2309 0,.263 0, , Bengal , , ,0395 0, , , Bengal , , ,022 0, , , Bengal , , ,5038 0, , , Bengal , , ,0251 0, , , Bengal , , ,0071 0, , , Bengal , , ,0064 0,.023 0, , Bengal Bengal , , ,0079 0, , , Bengal , , ,0022 0, , , Bengal , , ,0044 0, , , Bengal , , ,006 0, , , Bengal Bengal , , ,002 0, , , Sokoke , ,0073 0, , , Sokoke , ,0042 0, , , Sokoke ,.002 0,002 0, , , Sokoke Sokoke , ,0054 0, , , Sokoke , ,002 0,.002 0, , Sokoke , ,001 0,.001 0, , Ocicat , , ,003 0,.003 0, , Ocicat Ocicat , ,.968 0,002 0, , , Ocicat , , ,0088 0, , , Ocicat , , ,0141 0, , , Ocicat , , ,01 1 0, , , Ocicat Ocicat , , ,0073 0, , , Ocicat , , ,006 0, , , Ocicat Russian , , ,1095 0,.735 0, ,
146 Table 19 - Population clustering of each pedigreed individual in the database by SNPs at K Feline ID Missing Groups Population No. Data Blue Russian Blue Russian Blue Russian Blue Russian Blue Russian Blue Russian Blue Russian Blue Russian Blue Russian Blue Russian Blue Russian Blue Russian Blue Russian Blue Russian Blue Russian Blue Russian Blue , ,.009 0, ,.001 0,0056 0, ,0058 0,.002 0,0066 0, ,0016 0, ,0461 0, Aust. Mist Aust. Mist , , ,0021 0, ,0043 0, ,0018 0, ,0012 0, ,0043 0, ,002 0,
147 Table 19 - Population clustering of each pedigreed individual in the database by SNPs at K = 17 Feline ID Missing Groups Population No. Data Aust. Mist , ,0078 0, ,029 0, , , , Aust. Mist , ,003 0, ,0047 0, , , , Aust. Mist Aust. Mist , ,003 0, ,0058 0, , , , Aust. Mist , ,0046 0,.002 0,002 0, , , , Aust. Mist , ,0024 0, ,0044 0, , , , Aust. Mist , ,0046 0, ,0054 0, , , , Aust. Mist ,.001 0,001 0,.002 0,005 0, , , , Aust. Mist ,.03 0,0061 0, ,0336 0, , , , Aust. Mist , ,0032 0, ,0127 0, , , , Aust. Mist Aust. Mist , ,0019 0, ,0021 0,. 1 0, , , Aust. Mist , ,0022 0, ,0215 0, , , , Burmese , , ,018 0, ,121 0, , , , Burmese , , ,0039 0, ,0539 0, , , , Burmese Burmese , , ,0322 0, ,002 0,.001 0, , , Burmese , ,.002 0,005 0, ,0032 0,.002 0, , , Burmese , , ,0019 0, ,0075 0, , , , Burmese , , ,0029 0, ,0029 0, , , , Burmese Burmese , ,.002 0,0024 0, ,002 0, , , , Burmese , ,.001 0,0025 0, ,0029 0, , , , Burmese , , ,0059 0, ,004 0, , , , Burmese , , ,0149 0, ,0082 0, , , , Burmese Burmese , , ,0079 0, ,0036 0, , , , Burmese , , ,0031 0, ,0055 0, , , , Burmese , ,.002 0,0028 0,.002 0,0035 0, , , , Burmese , , ,002 0,.003 0,0022 0, , , , Burmese Burmese , , ,0071 0, ,0166 0, , , , Birman , , ,002 0,.007 0,0052 0, , , , Birman Birman , , ,001 0,.002 0,013 0, , , ,
148 Table 19 - Population clustering of each pedigreed individual in the database by SNPs at K Feline ID Missing Groups Population No. Data Birman , , ,.03 0, , Birman , , ,1181 0, , Birman Birman , , ,0235 0, , Birman , , ,0045 0, , Birman , , ,0049 0, , Birman , , ,0106 0, , Birman , , ,0149 0, , Birman , , ,0092 0, , Birman , , ,0056 0, , Birman Birman , ,.001 0,0062 0, , Birman , , ,2812 0, , Birman , , ,8459 0, , Birman , , ,9448 0, , Birman Birman , , ,8791 0, , Havana Brn , , ,9431 0, , Havana Brn Havana Brn , , ,8498 0, , Havana Brn , ,.002 0,9278 0, , Havana Brn , , ,7075 0, , Havana Brn , ,.002 0,9295 0, , Havana Brn Havana Brn , , ,8938 0, , Havana Brn , , ,9396 0, ,
149 J able 19 - Population clustering of each pedigreed individual in the database by SNPs at K = 17 Feline ID Missing Groups Population No. Data Havana Brn , , ,.002 0,9191 0, ,0021 0, ,0066 0, , ,0028 0, Brn , , , ,8921 0, ,0223 0, ,0028 0, , ,0025 0, navana Brn , , ,.002 0,034 0, ,0082 0, ,002 0, , ,0053 0, Havana Brn , , , ,0068 0, ,0527 0, ,0013 0, , ,002 0, navana Brn , , , ,0071 0, ,0063 0,.044 0,002 0, , ,0016 0, Korat Korat , , , ,0037 0, ,0021 0, ,0024 0, , ,0092 0, Korat , , , ,002 0,.002 0,0012 0, ,0025 0, , ,001 0, Korat , , ,.001 0,0021 0, ,0025 0, ,0018 0, , ,001 0, Korat , , ,.001 0,0013 0, , , ,0012 0, , ,001 0, Korat Korat , , , ,0024 0, ,0018 0, ,0031 0, , ,0018 0, Korat , , , ,004 0, ,0012 0, ,0048 0, , , , Korat , , , ,0029 0, ,0014 0,.002 0,002 0, , ,001 0, Korat , , ,.004 0,021 0, ,0076 0,.038 0,0049 0, , ,0094 0, Korat Korat , , , ,1226 0, ,0449 0, ,002 0, , ,0093 0, Korat , , ,.002 0,0092 0, ,0605 0, ,006 0, , ,0074 0, Korat , , ,.002 0,0041 0, ,0021 0, ,0042 0, , ,003 0, Korat , , , ,0103 0, ,0055 0, ,01 0, , , , Korat Korat , , , ,0043 0, ,0557 0, ,0057 0, , ,8313 0, Korat , , , ,0069 0,.002 0,0407 0, ,0027 0, , ,8697 0, Korat , , ,.004 0,0048 0,.007 0,0024 0,.012 0,002 0, , ,7572 0, Korat , , , ,0338 0, ,0145 0, ,0036 0, ,.003 0,1927 0, Korat Korat , , , ,0103 0, ,0021 0, ,0043 0, , ,8213 0, Korat , , , ,0054 0,.006 0,0087 0, ,0247 0, , ,8672 0, Korat Korat , , , ,0206 0, ,0433 0,.012 0,0089 0, , ,7825 0,
150 Table 19 - Population clustering of each pedigreed individual in the database by SNPs at K = 17 Feline ID Missing Groups Population No. Data Siamese , ,044 0, ,0097 0, , , Siamese , ,004 0, , , , , Siamese Siamese ,.002 0,0029 0, ,0067 0, , , Siamese , ,002 0, ,0032 0, , , Siamese ,.001 0,0061 0, ,004 0, , , Siamese ,.001 0,0028 0,.006 0,005 0, , , Siamese , ,0023 0, ,0064 0, , , Siamese , ,0037 0, ,0033 0, , , Siamese , , , ,0061 0, , , Siamese Siamese ,.004 0,0167 0,.002 0,0071 0, , , Siamese , ,0063 0, ,0057 0, , , Siamese , ,0024 0,.002 0,0183 0, , , Siamese , ,0404 0, ,008 0, , , Singapura Singapura , , ,0088 0, ,0231 0,.004 0, , Singapura , , ,0087 0, ,0076 0, , , Singapura , , ,0023 0, ,0059 0, , , Singapura , , ,0126 0, ,0036 0, , , Singapura Singapura , , ,0041 0, ,0061 0, , , Singapura , ,.033 0,2708 0, ,0181 0, , , Singapura , , ,4249 0, ,0704 0,.041 0, , Singapura , , ,2706 0, ,347 0, , , Singapura Singapura , , ,3816 0, ,0231 0, , , Singapura , , ,1946 0, ,208 0,.006 0, , Singapura , , ,3331 0, ,0161 0, , , Singapura , , ,3062 0, ,0068 0, , , Singapura Singapura , , ,1489 0, ,0889 0, , ,
151 Table 20 - Population clustering of each random bred Table 20 - Population clustering of each random bred individual in the database by SNPs at K = 5 individual in the database by SNPs at K = 5 Sampling ID Missing Population Sampling ID Missing Population Location No. Data Location No. Data USA-NY Brazil USA-NY Brazil USA-NY Brazil USA-NY Brazil USA-NY Brazil USA-NY Brazil USA-NY Brazil USA-NY Brazil USA-NY Brazil USA-MS Brazil USA-MS Brazil USA-MS Brazil USA-MS Brazil USA-MS Brazil USA-MS Brazil USA-MS Brazil USA-MS Brazil USA-MS Brazil USA-MS Brazil USA-HI Brazil USA-HI Brazil USA-HI Brazil USA-HI Brazil USA-HI Brazil USA-HI Finland USA-HI Finland USA-HI Finland USA-HI Finland USA-HI Finland Brazil Finland Brazil Finland Brazil Finland Brazil Finland Brazil Finland
152 Table 20 - Population clustering of each random bred Table 20 - Population clustering of each random bred individual in the database by SNPs at K = 5 individual in the database by SNPs at K = 5 Sampling ID Missing Population Sampling ID Missing Population Location No. Data Location No. Data Finland Italy-Milan Germany Italy-Milan Germany Italy-Milan Germany Italy-Milan Germany Italy-Milan Germany Italy-Milan Germany Italy-Milan Germany Italy-Milan Germany Italy-Milan Germany Italy-Milan Germany Italy-Rome Germany Italy-Rome Germany Italy-Rome Germany Italy-Rome Germany Italy-Rome Germany Italy-Rome Germany Italy-Rome Germany Italy-Rome Germany Italy-Rome Germany Italy-Rome Germany Italy-Rome Germany Italy-Rome Germany Italy-Rome Germany Italy-Rome Germany Italy-Rome Germany Turkey Germany Turkey Germany Turkey Germany Turkey Germany Turkey Italy-Milan Turkey Italy-Milan Turkey Italy-Milan Turkey Italy-Milan Turkey
153 Table 20 - Population clustering of each random bred Table 20 - Population clustering of each random bred individual in the database by SNPs at K = 5 individual in the database by SNPs at K = 5 Sampling ID Missing Population Sampling ID Missing Population Location No. Data Location No. Data Turkey Turkey Turkey Turkey Turkey Turkey Turkey Turkey Turkey Turkey Turkey Turkey Turkey Turkey Turkey Turkey Turkey Cyprus Turkey Cyprus Turkey Cyprus Turkey Cyprus Turkey Cyprus Turkey Cyprus Turkey Cyprus Turkey Cyprus Turkey Cyprus Turkey Cyprus Turkey Cyprus Turkey Cyprus Turkey Cyprus Turkey Cyprus Turkey Cyprus Turkey Cyprus Turkey Cyprus Turkey Cyprus Turkey Cyprus Turkey Cyprus Turkey Cyprus Turkey Cyprus Turkey Cyprus Turkey Cyprus Turkey Cyprus Turkey Cyprus
154 Table 20 - Population clustering of each random bred Table 20 - Population clustering of each random bred individual in the database by SNPs at K = 5 individual in the database by SNPs at K = 5 Sampling ID Missing Population Sampling ID Missing Population Location No. Data Location No. Data Cyprus Lebanon Cyprus Lebanon Cyprus Lebanon Cyprus Lebanon Lebanon Lebanon Lebanon Lebanon Lebanon Lebanon Lebanon Lebanon Lebanon Lebanon Lebanon Lebanon Lebanon Lebanon Lebanon Lebanon Lebanon Lebanon Lebanon Lebanon Lebanon Lebanon Lebanon Lebanon Lebanon Lebanon Lebanon Lebanon Lebanon Lebanon Lebanon Lebanon Lebanon Lebanon Lebanon Lebanon Lebanon Lebanon Lebanon Lebanon Lebanon Lebanon Lebanon Lebanon Lebanon Lebanon Lebanon Lebanon Lebanon Lebanon Lebanon Lebanon Lebanon Lebanon Lebanon Israel Lebanon Israel Lebanon Israel
155 Table 20 - Population clustering of each random bred Table 20 - Population clustering of each random bred individual in the database by SNPs at K = 5 individual in the database by SNPs at K = 5 Sampling ID Missing Population Sampling ID Missing Population Location No. Data Location No. Data Israel Israel Israel Israel Israel Israel Israel Israel Israel Israel Israel Israel Israel Israel Israel Israel Israel Israel Israel Egypt-Cairo Israel Egypt-Cairo Israel Egypt-Cairo Israel Egypt-Cairo Israel Egypt-Cairo Israel Egypt-Cairo Israel Egypt-Cairo Israel Egypt-Cairo Israel Egypt-Cairo Israel Egypt-Cairo Israel Egypt-Cairo Israel Egypt-Cairo Israel Egypt-Cairo Israel Egypt-Cairo Israel Egypt-Cairo Israel Egypt-Cairo Israel Egypt-Cairo Israel Egypt-Cairo Israel Egypt-Cairo Israel Egypt-Cairo Israel Egypt-Cairo Israel Egypt-Cairo Israel Egypt-Cairo Israel Egypt-Cairo Israel Egypt-Cairo
156 Table 20 - Population clustering of each random bred Table 20 - Population clustering of each random bred individual in the database by SNPs at K = 5 individual in the database by SNPs at K = 5 Sampling ID Missing Population Sampling ID Missing Population Location No. Data Location No. Data Egypt-Cairo Egypt-Cairo Egypt-Cairo Egypt-Cairo Egypt-Cairo Egypt-Cairo Egypt-Cairo Egypt-Cairo Egypt-Cairo Egypt-Cairo Egypt-Cairo Egypt-Cairo Egypt-Cairo Egypt-Cairo Egypt-Cairo Egypt-Cairo Egypt-Cairo Egypt-Cairo Egypt-Cairo Egypt-Cairo Egypt-Cairo Egypt-Cairo Egypt-Cairo Egypt-Cairo Egypt-Cairo Egypt-Cairo Egypt-Cairo Egypt-Cairo Egypt-Cairo Egypt-Cairo Egypt-Cairo Egypt-Cairo Egypt-Cairo Egypt-Cairo Egypt-Cairo Egypt-Cairo Egypt-Cairo Egypt-Cairo Egypt-Cairo Egypt-Cairo Egypt-Cairo Egypt-Cairo Egypt-Cairo Egypt-Cairo Egypt-Cairo Egypt-Cairo Egypt-Cairo Egypt-Asuit Egypt-Cairo Egypt-Asuit Egypt-Cairo Egypt-Asuit Egypt-Cairo Egypt-Asuit Egypt-Cairo Egypt-Asuit Egypt-Cairo Egypt-Asuit Egypt-Cairo Egypt-Asuit Egypt-Cairo Egypt-Asuit Egypt-Cairo Egypt-Asuit Egypt-Cairo Egypt-Asuit Egypt-Cairo Egypt- Luxor
157 Table 20 - Population clustering of each random bred Table 20 - Population clustering of each random bred individual in the database by SNPs at K = 5 individual in the database by SNPs at K = 5 Sampling ID Missing Population Sampling ID Missing Population Location No. Data Location No. Data Egypt-Luxor Simbel Egypt-Luxor Egypt-Abu Egypt-Luxor Simbel Egypt-Luxor Iraq-West Egypt-Luxor Iraq-West Egypt-Luxor Iraq-West Egypt-Luxor Iraq-West Egypt-Luxor Iraq-West Egypt-Luxor Iraq-West Egypt-Luxor Iraq-West Egypt-Luxor Iraq-West Egypt-Luxor Iraq-West Egypt-Luxor Iraq-West Egypt-Luxor Iraq-West Egypt-Luxor Iraq-West Egypt-Luxor Iraq-Baghdad Egypt-Luxor Iraq-Baghdad Egypt-Luxor Iraq-Baghdad Egypt-Luxor Iraq-Baghdad Egypt-Luxor Iraq-Baghdad Egypt-Luxor Iraq-Baghdad Egypt-Luxor Iraq-Baghdad Egypt-Luxor Iraq-Baghdad Egypt-Luxor Iraq-Baghdad Egypt-Luxor Iraq-Baghdad Egypt-Luxor Iraq-Baghdad Egypt-Luxor Iraq-Baghdad Egypt-Abu Iraq-Baghdad Simbel Iraq-Baghdad Egypt-Abu Iraq-Baghdad Simbel Iraq-Baghdad Egypt-Abu Iraq-Baghdad Simbel Iraq-Baghdad Egypt-Abu Iraq-Baghdad
158 Table 20 - Population clustering of each random bred Table 20 - Population clustering of each random bred individual in the database by SNPs at K = 5 individual in the database by SNPs at K = 5 Sampling ID Missing Population Sampling ID Missing Population Location No. Data Location No. Data raq-baghdad Iran raq-baghdad Iran raq-baghdad Iran raq-baghdad Iran raq-baghdad Iran raq-baghdad Iran raq-baghdad Iran raq-baghdad Iran raq-baghdad Iran raq-baghdad Iran raq-baghdad Iran raq-baghdad Iran raq-baghdad Iran raq-baghdad Iran ran Iran ran Iran ran Iran ran Iran ran Iran ran Iran ran Iran ran Iran ran Iran ran Iran ran Iran ran Iran ran Iran ran Iran ran Iran ran Iran ran Iran ran Iran ran Iran ran Iran
159 Table 20 - Population clustering of each random bred Table 20 - Population clustering of each random bred individual in the database by SNPs at K = 5 individual in the database by SNPs at K = 5 Sampling ID Missing Population Sampling ID Missing Population Location No. Data Location No. Data Iran Iran Iran Iran Iran Iran Iran Iran Iran Iran Iran Iran Iran Iran Iran Iran Iran Iran Iran Iran Iran Iran Iran Iran Iran Iran Iran Iran Iran Iran Iran Iran Iran Iran Iran Iran Iran Iran Iran Iran Iran Iran Iran Iran Iran Dubai Iran Dubai Iran Dubai Iran Dubai Iran Dubai Iran Dubai Iran Dubai Iran Dubai Iran Dubai Iran Dubai Iran Kenya-Nairobi Iran Kenya-Nairobi
160 Table 20 - Population clustering of each random bred Table 20 - Population clustering of each random bred individual in the database by SNPs at K = 5 individual in the database by SNPs at K = 5 Sampling ID Missing Population Sampling ID Missing Population Location No. Data Location No. Data Kenya- Nairobi Kenya-Pate Kenya- Nairobi Kenya-Pate Kenya- Nairobi Kenya-Pate Kenya- Nairobi Kenya-Pate Kenya- Nairobi Kenya-Pate Kenya- Nairobi Kenya-Pate Kenya- Nairobi Kenya-Pate Kenya- Nairobi Kenya-Pate Kenya- Nairobi Kenya-Pate Kenya- Nairobi Kenya-Lamu Kenya- Nairobi Kenya-Lamu Kenya- Nairobi Kenya-Lamu Kenya- Nairobi Kenya-Lamu Kenya-Nairobi Kenya-Lamu Kenya- Nairobi Kenya-Lamu Kenya- Nairobi Kenya-Lamu Kenya- Nairobi Kenya-Lamu Kenya- Nairobi Kenya-Lamu Kenya- Nairobi Kenya-Lamu Kenya- Nairobi Kenya-Lamu Kenya- Nairobi Kenya-Lamu Kenya- Nairobi Kenya-Lamu Kenya- Nairobi Kenya-Lamu Kenya- Nairobi Kenya-Lamu Kenya-Nairobi Kenya-Lamu Kenya- Nairobi Kenya-Lamu Kenya- Nairobi Kenya-Lamu Kenya- Nairobi Kenya-Lamu Kenya- Nairobi Kenya-Lamu Kenya- Nairobi India-Udaipur Kenya- Nairobi India-Udaipur Kenya- Nairobi India-Udaipur Kenya- Nairobi India-Agra Kenya- Nairobi India-Agra
161 Table 20 - Population clustering of each random bred Table 20 - Population clustering of each random bred individual in the database by SNPs at K = 5 individual in the database by SNPs at K = 5 Sampling ID Missing Population Sampling ID Missing Population Location No. Data Location No. Data India-Agra India- India-Agra Hyderbad India-Agra India- India-Agra Hyderbad India-Agra India- India-Agra Hyderbad India-Agra India- India-Agra Hyderbad India-Agra India- India-Agra Hyderbad India- India- Hyderbad Hyderbad India- India- Hyderbad Hyderbad India- India- Hyderbad Hyderbad India- India-Andhra Hyderbad India-Andhra India- India-Andhra Hyderbad India-Andhra India- India-Andhra Hyderbad India-Andhra India- India-Andhra Hyderbad India-Andhra India- India-Andhra Hyderbad India-Andhra India- India-Andhra Hyderbad India-Andhra India- India-Andhra Hyderbad India-Andhra India- India-Andhra Hyderbad India-Andhra India- India-Andhra Hyderbad India-Andhra
162 Table 20 - Population clustering of each random bred Table 20 - Population clustering of each random bred individual in the database by SNPs at K = 5 individual in the database by SNPs at K = 5 Sampling ID Missing Population Sampling ID Missing Population Location No. Data Location No. Data India-Andhra Sri Lanka India-Andhra Sri Lanka India-Andhra Thailand India-Andhra Thailand India-Andhra Thailand India-Kolkata Thailand India-Kolkata Thailand India-Kolkata Thailand India-Kolkata Thailand India-Kolkata Thailand India-Kolkata Thailand India-Kolkata Thailand Sri Lanka Thailand Sri Lanka Thailand Sri Lanka Thailand Sri Lanka Thailand Sri Lanka Thailand Sri Lanka Thailand Sri Lanka Thailand Sri Lanka Vietnam Sri Lanka Vietnam Sri Lanka Vietnam Sri Lanka Vietnam Sri Lanka Vietnam Sri Lanka Vietnam Sri Lanka Vietnam Sri Lanka Vietnam Sri Lanka Vietnam Sri Lanka Vietnam Sri Lanka Vietnam Sri Lanka Vietnam Sri Lanka Vietnam Sri Lanka Vietnam Sri Lanka Vietnam
163 Table 20 - Population clustering of each random bred Table 20 - Population clustering of each random bred individual in the database by SNPs at K = 5 individual in the database by SNPs at K = 5 Sampling ID Missing Population Sampling ID Missing Population Location No. Data Location No. Data Vietnam Japan-Oita Vietnam Japan-Oita Vietnam Japan-Oita Vietnam Japan-Oita Vietnam Japan-Oita Taiwan Japan-Oita Taiwan Japan-Oita Taiwan Japan-Oita Taiwan Japan-Oita Taiwan Japan-Oita Taiwan Japan-Oita Taiwan Japan-Oita Taiwan Japan-Oita Taiwan Japan-Oita Taiwan Japan-Oita Taiwan Japan-Oita Taiwan Japan-Oita Taiwan Japan- Taiwan Kanazawa Taiwan Japan- Taiwan Kanazawa Taiwan Japan- Taiwan Kanazawa Taiwan Japan- Taiwan Kanazawa Taiwan Japan- Taiwan Kanazawa Taiwan Japan- Taiwan Kanazawa Taiwan Japan- Taiwan Kanazawa Taiwan Japan- Taiwan Kanazawa Taiwan Japan
164 Table 20 - Population clustering of each random bred Table 20 - Population clustering of each random bred individual in the database by SNPs at K = 5 individual in the database by SNPs at K = 5 Sampling ID Missing Population Sampling ID Missing Population Location No. Data Location No. Data Kanazawa Sapporo Japan- Japan- Kanazawa Sapporo Japan- Japan- Kanazawa Sapporo Japan- Japan- Kanazawa Sapporo Japan- Japan- Kanazawa Sapporo Japan- Japan- Kanazawa Sapporo Japan- Japan- Kanazawa Sapporo Japan-Ohmiya Japan- Japan-Ohmiya Sapporo Japan-Ohmiya Japan- Japan-Ohmiya Sapporo Japan-Ohmiya Japan- Japan-Ohmiya Sapporo Japan-Ohmiya Japan- Japan-Ohmiya Sapporo Japan-Ohmiya Japan- Japan-Ohmiya Sapporo Japan-Ohmiya Japan- Japan-Ohmiya Sapporo Japan-Ohmiya China-Henan Japan-Ohmiya China-Henan Japan-Ohmiya China-Henan Japan-Ohmiya China-Henan Japan- China-Henan Sapporo China-Henan Japan- China-Henan Sapporo China-Henan Japan China-Henan
165 Table 20 - Population clustering of each random bred Table 20 - Population clustering of each random bred individual in the database by SNPs at K = 5 individual in the database by SNPs at K = 5 Sampling ID Missing Population Sampling ID Missing Population Location No. Data Location No. Data China-Henan South Korea China-Henan South Korea China-Henan South Korea China-Henan South Korea China-Henan South Korea China-Henan South Korea China-Henan South Korea China-Henan South Korea China-Henan South Korea China-Henan South Korea China-Henan South Korea South Korea South Korea South Korea South Korea South Korea South Korea South Korea South Korea South Korea South Korea South Korea South Korea South Korea South Korea South Korea South Korea South Korea South Korea South Korea South Korea South Korea South Korea South Korea South Korea South Korea South Korea South Korea
166 Table Population clustering of each random bred Table Population clustering of each random bred individual in the database by STRs at K = 5 individual in the database by STRs at K = 5 Sampling ID Missing Population Sampling ID Missing Population Location No. Data Location No. Data USA-NY Brazil USA-NY Brazil USA-NY Brazil USA-NY Brazil USA-NY Brazil USA-NY Brazil USA-NY Brazil USA-NY Brazil USA-NY Brazil USA-MS Brazil USA-MS Brazil USA-MS Brazil USA-MS Brazil USA-MS Brazil USA-MS Brazil USA-MS Brazil USA-MS Brazil USA-MS Brazil USA-MS Brazil USA-HI Brazil USA-HI Brazil USA-HI Brazil USA-HI Brazil USA-HI Brazil USA-HI Finland USA-HI Finland USA-HI Finland USA-HI Finland USA-HI Finland Brazil Finland Brazil Finland Brazil Finland Brazil Finland Brazil Finland
167 Table Population clustering of each random bred Table Population clustering of each random bred individual in the database by STRs at K = 5 individual in the database by STRs at K = 5 Sampling ID Missing Population Sampling ID Missing Population Location No. Data Location No. Data Finland Italy-Milan Germany Italy-Milan Germany Italy-Milan Germany Italy-Milan Germany Italy-Milan Germany Italy-Milan Germany Italy-Milan Germany Italy-Milan Germany Italy-Milan Germany Italy-Milan Germany Italy-Rome Germany Italy-Rome Germany Italy-Rome Germany Italy-Rome Germany Italy-Rome Germany Italy-Rome Germany Italy-Rome Germany Italy-Rome Germany Italy-Rome Germany Italy-Rome Germany Italy-Rome Germany Italy-Rome Germany Italy-Rome Germany Italy-Rome Germany Italy-Rome Germany Turkey Germany Turkey Germany Turkey Germany Turkey Germany Turkey Italy-Milan Turkey Italy-Milan Turkey Italy-Milan Turkey Italy-Milan Turkey
168 Table Population clustering of each random bred Table Population clustering of each random bred individual in the database by STRs at K = 5 individual in the database by STRs at K = 5 Sampling ID Missing Population Sampling ID Missing Population Location No. Data Location No. Data Turkey Turkey Turkey Turkey Turkey Turkey Turkey Turkey Turkey Turkey Turkey Turkey Turkey Turkey Turkey Turkey Turkey Cyprus Turkey Cyprus Turkey Cyprus Turkey Cyprus Turkey Cyprus Turkey Cyprus Turkey Cyprus Turkey Cyprus Turkey Cyprus Turkey Cyprus Turkey Cyprus Turkey Cyprus Turkey Cyprus Turkey Cyprus Turkey Cyprus Turkey Cyprus Turkey Cyprus Turkey Cyprus Turkey Cyprus Turkey Cyprus Turkey Cyprus Turkey Cyprus Turkey Cyprus Turkey Cyprus Turkey Cyprus Turkey Cyprus
169 Table Population clustering of each random bred Table Population clustering of each random bred individual in the database by STRs at K = 5 individual in the database by STRs at K = 5 Sampling ID Missing Population Sampling ID Missing Population Location No. Data Location No. Data Cyprus Lebanon Cyprus Lebanon Cyprus Lebanon Cyprus Lebanon Lebanon Lebanon Lebanon Lebanon Lebanon Lebanon Lebanon Lebanon Lebanon Lebanon Lebanon Lebanon Lebanon Lebanon Lebanon Lebanon Lebanon Lebanon Lebanon Lebanon Lebanon Lebanon Lebanon Lebanon Lebanon Lebanon Lebanon Lebanon Lebanon Lebanon Lebanon Lebanon Lebanon Lebanon Lebanon Lebanon Lebanon Lebanon Lebanon Lebanon Lebanon Lebanon Lebanon Lebanon Lebanon Lebanon Lebanon Lebanon Lebanon Lebanon Lebanon Lebanon Lebanon Lebanon Lebanon Israel Lebanon Israel Lebanon Israel
170 Table Population clustering of each random bred Table Population clustering of each random bred individual in the database by STRs at K = 5 individual in the database by STRs at K = 5 Sampling ID Missing Population Sampling ID Missing Population Location No. Data Location No. Data Israel Israel Israel Israel Israel Israel Israel Israel Israel Israel Israel Israel Israel Israel Israel Israel Israel Israel Israel Egypt-Cairo Israel Egypt-Cairo Israel Egypt-Cairo Israel Egypt-Cairo Israel Egypt-Cairo Israel Egypt-Cairo Israel Egypt-Cairo Israel Egypt-Cairo Israel Egypt-Cairo Israel Egypt-Cairo Israel Egypt-Cairo Israel Egypt-Cairo Israel Egypt-Cairo Israel Egypt-Cairo Israel Egypt-Cairo Israel Egypt-Cairo Israel Egypt-Cairo Israel Egypt-Cairo Israel Egypt-Cairo Israel Egypt-Cairo Israel Egypt-Cairo Israel Egypt-Cairo Israel Egypt-Cairo Israel Egypt-Cairo Israel Egypt-Cairo
171 Table Population clustering of each random bred Table Population clustering of each random bred individual in the database by STRs at K = 5 individual in the database by STRs at K = 5 Sampling ID Missing Population Sampling ID Missing Population Location No. Data Location No. Data Egypt-Cairo Egypt-Cairo Egypt-Cairo Egypt-Cairo Egypt-Cairo Egypt-Cairo Egypt-Cairo Egypt-Cairo Egypt-Cairo Egypt-Cairo Egypt-Cairo Egypt-Cairo Egypt-Cairo Egypt-Cairo Egypt-Cairo Egypt-Cairo Egypt-Cairo Egypt-Cairo Egypt-Cairo Egypt-Cairo Egypt-Cairo Egypt-Cairo Egypt-Cairo Egypt-Cairo Egypt-Cairo Egypt-Cairo Egypt-Cairo Egypt-Cairo Egypt-Cairo Egypt-Cairo Egypt-Cairo Egypt-Cairo Egypt-Cairo Egypt-Cairo Egypt-Cairo Egypt-Cairo Egypt-Cairo Egypt-Cairo Egypt-Cairo Egypt-Cairo Egypt-Cairo Egypt-Cairo Egypt-Cairo Egypt-Cairo Egypt-Cairo Egypt-Cairo Egypt-Cairo Egypt-Asuit Egypt-Cairo Egypt-Asuit Egypt-Cairo Egypt-Asuit Egypt-Cairo Egypt-Asuit Egypt-Cairo Egypt-Asuit Egypt-Cairo Egypt-Asuit Egypt-Cairo Egypt-Asuit Egypt-Cairo Egypt-Asuit Egypt-Cairo Egypt-Asuit Egypt-Cairo Egypt-Asuit Egypt-Cairo Egypt- Luxor
172 Table Population clustering of each random bred Table Population clustering of each random bred individual in the database by STRs at K = 5 individual in the database by STRs at K = 5 Sampling ID Missing Population Sampling ID Missing Population Location No. Data Location No. Data Egypt-Luxor Simbel Egypt-Luxor Egypt-Abu Egypt-Luxor Simbel Egypt-Luxor Iraq-West Egypt-Luxor Iraq-West Egypt-Luxor Iraq-West Egypt-Luxor Iraq-West Egypt-Luxor Iraq-West Egypt-Luxor Iraq-West Egypt-Luxor Iraq-West Egypt-Luxor Iraq-West Egypt-Luxor Iraq-West Egypt-Luxor Iraq-West Egypt-Luxor Iraq-West Egypt-Luxor Iraq-West Egypt-Luxor Iraq-Baghdad Egypt-Luxor Iraq-Baghdad Egypt-Luxor Iraq-Baghdad Egypt-Luxor Iraq-Baghdad Egypt-Luxor Iraq-Baghdad Egypt-Luxor Iraq-Baghdad Egypt-Luxor Iraq-Baghdad Egypt-Luxor Iraq-Baghdad Egypt-Luxor Iraq-Baghdad Egypt-Luxor Iraq-Baghdad Egypt-Luxor Iraq-Baghdad Egypt-Luxor Iraq-Baghdad Egypt-Abu Iraq-Baghdad Simbel Iraq-Baghdad Egypt-Abu Iraq-Baghdad Simbel Iraq-Baghdad Egypt-Abu Iraq-Baghdad Simbel Iraq-Baghdad Egypt-Abu Iraq-Baghdad
173 Table Population clustering of each random bred Table Population clustering of each random bred individual in the database by STRs at K = 5 individual in the database by STRs at K = 5 Sampling ID Missing Population Sampling ID Missing Population Location No. Data Location No. Data raq-baghdad Iran raq-baghdad Iran raq-baghdad Iran raq-baghdad Iran raq-baghdad Iran raq-baghdad Iran raq-baghdad Iran raq-baghdad Iran raq-baghdad Iran raq-baghdad Iran raq-baghdad Iran raq-baghdad Iran raq-baghdad Iran raq-baghdad Iran ran Iran ran Iran ran Iran ran Iran ran Iran ran Iran ran Iran ran Iran ran Iran ran Iran ran Iran ran Iran ran Iran ran Iran ran Iran ran Iran ran Iran ran Iran ran Iran ran Iran
174 Table Population clustering of each random bred Table Population clustering of each random bred individual in the database by STRs at K = 5 individual in the database by STRs at K = 5 Sampling ID Missing Population Sampling ID Missing Population Location No. Data Location No. Data Iran Iran Iran Iran Iran Iran Iran Iran Iran Iran Iran Iran Iran Iran Iran Iran Iran Iran Iran Iran Iran Iran Iran Iran Iran Iran Iran Iran Iran Iran Iran Iran Iran Iran Iran Iran Iran Iran Iran Iran Iran Iran Iran Iran Iran Dubai Iran Dubai Iran Dubai Iran Dubai Iran Dubai Iran Dubai Iran Dubai Iran Dubai Iran Dubai Iran Dubai Iran Kenya-Nairobi Iran Kenya-Nairobi
175 Table Population clustering of each random bred Table Population clustering of each random bred individual in the database by STRs at K = 5 individual in the database by STRs at K = 5 Sampling ID Missing Population Sampling ID Missing Population Location No. Data Location No. Data Kenya- Nairobi Kenya-Pate Kenya- Nairobi Kenya-Pate Kenya- Nairobi Kenya-Pate Kenya-Nairobi Kenya-Pate Kenya-Nairobi Kenya-Pate Kenya- Nairobi Kenya-Pate Kenya- Nairobi Kenya-Pate Kenya- Nairobi Kenya-Pate Kenya- Nairobi Kenya-Pate Kenya- Nairobi Kenya-Lamu Kenya- Nairobi Kenya-Lamu Kenya- Nairobi Kenya-Lamu Kenya-Nairobi Kenya-Lamu Kenya-Nairobi Kenya-Lamu Kenya- Nairobi Kenya-Lamu Kenya- Nairobi Kenya-Lamu Kenya- Nairobi Kenya-Lamu Kenya- Nairobi Kenya-Lamu Kenya- Nairobi Kenya-Lamu Kenya- Nairobi Kenya-Lamu Kenya- Nairobi Kenya-Lamu Kenya- Nairobi Kenya-Lamu Kenya-Nairobi Kenya-Lamu Kenya-Nairobi Kenya-Lamu Kenya- Nairobi Kenya-Lamu Kenya- Nairobi Kenya-Lamu Kenya- Nairobi Kenya-Lamu Kenya- Nairobi Kenya-Lamu Kenya- Nairobi Kenya-Lamu Kenya- Nairobi India-Udaipur Kenya- Nairobi India-Udaipur Kenya- Nairobi India-Udaipur Kenya-Nairobi India-Agra Kenya- Nairobi India-Agra
176 Table Population clustering of each random bred Table Population clustering of each random bred individual in the database by STRs at K = 5 individual in the database by STRs at K = 5 Sampling ID Missing Population Sampling ID Missing Population Location No. Data Location No. Data India-Agra India- India-Agra Hyderbad India-Agra India- India-Agra Hyderbad India-Agra India- India-Agra Hyderbad India-Agra India- India-Agra Hyderbad India-Agra India- India-Agra Hyderbad India- India- Hyderbad Hyderbad India- India- Hyderbad Hyderbad India- India- Hyderbad Hyderbad India- India-Andhra Hyderbad India-Andhra India- India-Andhra Hyderbad India-Andhra India- India-Andhra Hyderbad India-Andhra India- India-Andhra Hyderbad India-Andhra India- India-Andhra Hyderbad India-Andhra India- India-Andhra Hyderbad India-Andhra India- India-Andhra Hyderbad India-Andhra India- India-Andhra Hyderbad India-Andhra India- India-Andhra Hyderbad India-Andhra
177 Table Population clustering of each random bred Table Population clustering of each random bred individual in the database by STRs at K = 5 individual in the database by STRs at K = 5 Sampling ID Missing Population Sampling ID Missing Population Location No. Data Location No. Data India-Andhra Sri Lanka India-Andhra Sri Lanka India-Andhra Thailand India-Andhra Thailand India-Andhra Thailand India-Kolkata Thailand India-Kolkata Thailand India-Kolkata Thailand India-Kolkata Thailand India-Kolkata Thailand India-Kolkata Thailand India-Kolkata Thailand Sri Lanka Thailand Sri Lanka Thailand Sri Lanka Thailand Sri Lanka Thailand Sri Lanka Thailand Sri Lanka Thailand Sri Lanka Thailand Sri Lanka Vietnam Sri Lanka Vietnam Sri Lanka Vietnam Sri Lanka Vietnam Sri Lanka Vietnam Sri Lanka Vietnam Sri Lanka Vietnam Sri Lanka Vietnam Sri Lanka Vietnam Sri Lanka Vietnam Sri Lanka Vietnam Sri Lanka Vietnam Sri Lanka Vietnam Sri Lanka Vietnam Sri Lanka Vietnam
178 Table Population clustering of each random bred Table Population clustering of each random bred individual in the database by STRs at K = 5 individual in the database by STRs at K = 5 Sampling ID Missing Population Sampling ID Missing Population Location No. Data Location No. Data Vietnam Japan-Oita Vietnam Japan-Oita Vietnam Japan-Oita Vietnam Japan-Oita Vietnam Japan-Oita Taiwan Japan-Oita Taiwan Japan-Oita Taiwan Japan-Oita Taiwan Japan-Oita Taiwan Japan-Oita Taiwan Japan-Oita Taiwan Japan-Oita Taiwan Japan-Oita Taiwan Japan-Oita Taiwan Japan-Oita Taiwan Japan-Oita Taiwan Japan-Oita Taiwan Japan- Taiwan Kanazawa Taiwan Japan- Taiwan Kanazawa Taiwan Japan- Taiwan Kanazawa Taiwan Japan- Taiwan Kanazawa Taiwan Japan- Taiwan Kanazawa Taiwan Japan- Taiwan Kanazawa Taiwan Japan- Taiwan Kanazawa Taiwan Japan- Taiwan Kanazawa Taiwan Japan
179 Table Population clustering of each random bred Table Population clustering of each random bred individual in the database by STRs at K = 5 individual in the database by STRs at K = 5 Sampling ID Missing Population Sampling ID Missing Population Location No. Data Location No. Data Kanazawa Sapporo Japan- Japan- Kanazawa Sapporo Japan- Japan- Kanazawa Sapporo Japan- Japan- Kanazawa Sapporo Japan- Japan- Kanazawa Sapporo Japan- Japan- Kanazawa Sapporo Japan- Japan- Kanazawa Sapporo Japan-Ohmiya Japan- Japan-Ohmiya Sapporo Japan-Ohmiya Japan- Japan-Ohmiya Sapporo Japan-Ohmiya Japan- Japan-Ohmiya Sapporo Japan-Ohmiya Japan- Japan-Ohmiya Sapporo Japan-Ohmiya Japan- Japan-Ohmiya Sapporo Japan-Ohmiya Japan- Japan-Ohmiya Sapporo Japan-Ohmiya China-Henan Japan-Ohmiya China-Henan Japan-Ohmiya China-Henan Japan-Ohmiya China-Henan Japan- China-Henan Sapporo China-Henan Japan- China-Henan Sapporo China-Henan Japan China-Henan
180 Table Population clustering of each random bred Table Population clustering of each random bred individual in the database by STRs at K = 5 individual in the database by STRs at K = 5 Sampling ID Missing Population Sampling ID Missing Population Location No. Data Location No. Data China-Henan South Korea China-Henan South Korea China-Henan South Korea China-Henan South Korea China-Henan South Korea China-Henan South Korea China-Henan South Korea China-Henan South Korea China-Henan South Korea China-Henan South Korea China-Henan South Korea South Korea South Korea South Korea South Korea South Korea South Korea South Korea South Korea South Korea South Korea South Korea South Korea South Korea South Korea South Korea South Korea South Korea South Korea South Korea South Korea South Korea South Korea South Korea South Korea South Korea South Korea South Korea
181 Table 22 - Population clustering of each random bred Table 22 - Population clustering of each random bred individual in the database by SNPs and STRs at K = 5 individual in the database by SNPs and STRs at K = 5 Sampling ID Missing Population Sampling ID Missing Population Location No. Data Location No. Data USA-NY Brazil USA-NY Brazil USA-NY Brazil USA-NY Brazil USA-NY Brazil USA-NY Brazil USA-NY Brazil USA-NY Brazil USA-NY Brazil USA-MS Brazil USA-MS Brazil USA-MS Brazil USA-MS Brazil USA-MS Brazil USA-MS Brazil USA-MS Brazil USA-MS Brazil USA-MS Brazil USA-MS Brazil USA-HI Brazil USA-HI Brazil USA-HI Brazil USA-HI Brazil USA-HI Brazil USA-HI Brazil USA-HI Brazil USA-HI Finland USA-HI Finland USA-HI Finland Brazil Finland Brazil Finland Brazil Finland
182 Table 22 - Population clustering of each random bred Table 22 - Population clustering of each random bred individual in the database by SNPs and STRs at K = 5 individual in the database by SNPs and STRs at K = 5 Sampling ID Missing Population Sampling ID Missing Population Location No. Data Location No. Data Finland Germany Finland Germany Finland Italy-Milan Finland Italy-Milan Finland Italy-Milan Germany Italy-Milan Germany Italy-Milan Germany Italy-Milan Germany Italy-Milan Germany Italy-Milan Germany Italy-Milan Germany Italy-Milan Germany Italy-Milan Germany Italy-Milan Germany Italy-Milan Germany Italy-Milan Germany Italy-Rome Germany Italy-Rome Germany Italy-Rome Germany Italy-Rome Germany Italy-Rome Germany Italy-Rome Germany Italy-Rome Germany Italy-Rome Germany Italy-Rome Germany Italy-Rome Germany Italy-Rome Germany Italy-Rome Germany Italy-Rome Germany Italy-Rome Germany Italy-Rome Germany Turkey
183 Table 22 - Population clustering of each random bred Table 22 - Population clustering of each random bred individual in the database by SNPs and STRs at K = 5 individual in the database by SNPs and STRs at K = 5 Sampling ID Missing Population Sampling ID Missing Population Location No. Data Location No. Data Turkey Turkey Turkey Turkey Turkey Turkey Turkey Turkey Turkey Turkey Turkey Turkey Turkey Turkey Turkey Turkey Turkey Turkey Turkey Turkey Turkey Turkey Turkey Turkey Turkey Turkey Turkey Turkey Turkey Turkey Turkey Turkey Turkey Turkey Turkey Turkey Turkey Cyprus Turkey Cyprus Turkey Cyprus Turkey Cyprus Turkey Cyprus Turkey Cyprus Turkey Cyprus Turkey Cyprus Turkey Cyprus Turkey Cyprus Turkey Cyprus Turkey Cyprus Turkey Cyprus Turkey Cyprus
184 Table 22 - Population clustering of each random bred Table 22 - Population clustering of each random bred individual in the database by SNPs and STRs at K = 5 individual in the database by SNPs and STRs at K = 5 Sampling ID Missing Population Sampling ID Missing Population Location No. Data Location No. Data Cyprus Lebanon Cyprus Lebanon Cyprus Lebanon Cyprus Lebanon Cyprus Lebanon Cyprus Lebanon Cyprus Lebanon Cyprus Lebanon Cyprus Lebanon Cyprus Lebanon Cyprus Lebanon Cyprus Lebanon Cyprus Lebanon Cyprus Lebanon Cyprus Lebanon Cyprus Lebanon Lebanon Lebanon Lebanon Lebanon Lebanon Lebanon Lebanon Lebanon Lebanon Lebanon Lebanon Lebanon Lebanon Lebanon Lebanon Lebanon Lebanon Lebanon Lebanon Lebanon Lebanon Lebanon Lebanon Lebanon Lebanon Lebanon Lebanon Lebanon Lebanon Lebanon Lebanon Lebanon
185 Table 22 - Population clustering of each random bred Table 22 - Population clustering of each random bred individual in the database by SNPs and STRs at K = 5 individual in the database by SNPs and STRs at K = 5 Sampling ID Missing Population Sampling ID Missing Population Location No. Data Location No. Data Lebanon Israel Lebanon Israel Lebanon Israel Lebanon Israel Lebanon Israel Lebanon Israel Lebanon Israel Lebanon Israel Lebanon Israel Lebanon Israel Lebanon Israel Lebanon Israel Lebanon Israel Israel Israel Israel Israel Israel Israel Israel Israel Israel Israel Israel Israel Israel Israel Israel Israel Israel Israel Israel Israel Israel Israel Israel Israel Israel Israel Israel Israel Israel Egypt-Cairo Israel Egypt-Cairo Israel Egypt-Cairo Israel Egypt-Cairo Israel Egypt-Cairo
186 Table 22 - Population clustering of each random bred Table 22 - Population clustering of each random bred individual in the database by SNPs and STRs at K = 5 individual in the database by SNPs and STRs at K = 5 Sampling ID Missing Population Sampling ID Missing Population Location No. Data Location No. Data Egypt-Cairo Egypt-Cairo Egypt-Cairo Egypt-Cairo Egypt-Cairo Egypt-Cairo Egypt-Cairo Egypt-Cairo Egypt-Cairo Egypt-Cairo Egypt-Cairo Egypt-Cairo Egypt-Cairo Egypt-Cairo Egypt-Cairo Egypt-Cairo Egypt-Cairo Egypt-Cairo Egypt-Cairo Egypt-Cairo Egypt-Cairo Egypt-Cairo Egypt-Cairo Egypt-Cairo Egypt-Cairo Egypt-Cairo Egypt-Cairo Egypt-Cairo Egypt-Cairo Egypt-Cairo Egypt-Cairo Egypt-Cairo Egypt-Cairo Egypt-Cairo Egypt-Cairo Egypt-Cairo Egypt-Cairo Egypt-Cairo Egypt-Cairo Egypt-Cairo Egypt-Cairo Egypt-Cairo Egypt-Cairo Egypt-Cairo Egypt-Cairo Egypt-Cairo Egypt-Cairo Egypt-Cairo Egypt-Cairo Egypt-Cairo Egypt-Cairo Egypt-Cairo Egypt-Cairo Egypt-Cairo Egypt-Cairo Egypt-Cairo Egypt-Cairo Egypt-Cairo Egypt-Cairo Egypt-Cairo Egypt-Cairo Egypt-Cairo Egypt-Cairo Egypt-Cairo
187 Table 22 - Population clustering of each random bred Table 22 - Population clustering of each random bred individual in the database by SNPs and STRs at K = 5 individual in the database by SNPs and STRs at K = 5 Sampling ID Missing Population Sampling ID Missing Population Location No. Data Location No. Data Egypt-Cairo Egypt- Luxor Egypt-Cairo Egypt- Luxor Egypt-Cairo Egypt- Luxor Egypt-Cairo Egypt- Luxor Egypt-Cairo Egypt- Luxor Egypt-Cairo Egypt- Luxor Egypt-Cairo Egypt- Luxor Egypt-Cairo Egypt- Luxor Egypt-Cairo Egypt- Luxor Egypt-Cairo Egypt- Luxor Egypt-Cairo Egypt- Luxor Egypt-Cairo Egypt- Luxor Egypt-Cairo Egypt- Luxor Egypt-Asuit Egypt- Luxor Egypt-Asuit Egypt- Luxor Egypt-Asuit Egypt- Luxor Egypt-Asuit Egypt- Luxor Egypt-Asuit Egypt- Luxor Egypt-Asuit Egypt- Luxor Egypt-Asuit Egypt-Abu Egypt-Asuit Simbel Egypt-Asuit Egypt-Abu Egypt-Asuit Simbel Egypt-Luxor Egypt-Abu Egypt-Luxor Simbel Egypt-Luxor Egypt-Abu Egypt-Luxor Simbel Egypt-Luxor Egypt-Abu Egypt-Luxor Simbel Egypt-Luxor Iraq-West Egypt-Luxor Iraq-West Egypt-Luxor Iraq-West
188 Table 22 - Population clustering of each random bred Table 22 - Population clustering of each random bred individual in the database by SNPs and STRs at K = 5 individual in the database by SNPs and STRs at K = 5 Sampling ID Missing Population Sampling ID Missing Population Location No. Data Location No. Data raq-west Iraq-Baghdad raq-west Iraq-Baghdad raq-west Iraq-Baghdad raq-west Iraq-Baghdad raq-west Iraq-Baghdad raq-west Iraq-Baghdad raq-west Iraq-Baghdad raq-west Iraq-Baghdad raq-west Iraq-Baghdad raq-baghdad Iraq-Baghdad raq-baghdad Iran raq-baghdad Iran raq-baghdad Iran raq-baghdad Iran raq-baghdad Iran raq-baghdad Iran raq-baghdad Iran raq-baghdad Iran raq-baghdad Iran raq-baghdad Iran raq-baghdad Iran raq-baghdad Iran raq-baghdad Iran raq-baghdad Iran raq-baghdad Iran raq-baghdad Iran raq-baghdad Iran raq-baghdad Iran raq-baghdad Iran raq-baghdad Iran raq-baghdad Iran raq-baghdad Iran
189 Table 22 - Population clustering of each random bred Table 22 - Population clustering of each random bred individual in the database by SNPs and STRs at K = 5 individual in the database by SNPs and STRs at K = 5 Sampling ID Missing Population Sampling ID Missing Population Location No. Data Location No. Data Iran Iran Iran Iran Iran Iran Iran Iran Iran Iran Iran Iran Iran Iran Iran Iran Iran Iran Iran Iran Iran Iran Iran Iran Iran Iran Iran Iran Iran Iran Iran Iran Iran Iran Iran Iran Iran Iran Iran Iran Iran Iran Iran Iran Iran Iran Iran Iran Iran Iran Iran Iran Iran Iran Iran Iran Iran Iran Iran Iran Iran Iran Iran Iran
190 Table 22 - Population clustering of each random bred Table 22 - Population clustering of each random bred individual in the database by SNPs and STRs at K = 5 individual in the database by SNPs and STRs at K = 5 Sampling ID Missing Population Sampling ID Missing Population Location No. Data Location No. Data Iran Dubai Iran Dubai Iran Kenya-Nairobi Iran Kenya-Nairobi Iran Kenya-Nairobi Iran Kenya-Nairobi Iran Kenya-Nairobi Iran Kenya-Nairobi Iran Kenya-Nairobi Iran Kenya-Nairobi Iran Kenya-Nairobi Iran Kenya-Nairobi Iran Kenya-Nairobi Iran Kenya-Nairobi Iran Kenya-Nairobi Iran Kenya-Nairobi Iran Kenya-Nairobi Iran Kenya-Nairobi Iran Kenya-Nairobi Iran Kenya-Nairobi Iran Kenya-Nairobi Iran Kenya-Nairobi Iran Kenya-Nairobi Iran Kenya-Nairobi Dubai Kenya-Nairobi Dubai Kenya-Nairobi Dubai Kenya-Nairobi Dubai Kenya-Nairobi Dubai Kenya-Nairobi Dubai Kenya-Nairobi Dubai Kenya-Nairobi Dubai Kenya-Nairobi
191 Table 22 - Population clustering of each random bred Table 22 - Population clustering of each random bred individual in the database by SNPs and STRs at K = 5 individual in the database by SNPs and STRs at K = 5 Sampling ID Missing Population Sampling ID Missing Population Location No. Data Location No. Data Kenya- Nairobi Kenya-Lamu Kenya- Nairobi Kenya-Lamu Kenya- Nairobi Kenya-Lamu Kenya- Nairobi India-Udaipur Kenya- Nairobi India-Udaipur Kenya-Nairobi India-Udaipur Kenya- Pate India-Agra Kenya- Pate India-Agra Kenya- Pate India-Agra Kenya- Pate India-Agra Kenya- Pate India-Agra Kenya- Pate India-Agra Kenya- Pate India-Agra Kenya- Pate India-Agra Kenya- Pate India-Agra Kenya-Lamu India-Agra Kenya-Lamu India-Agra Kenya-Lamu India-Agra Kenya-Lamu India- Kenya-Lamu Hyderbad Kenya-Lamu India- Kenya-Lamu Hyderbad Kenya-Lamu India- Kenya-Lamu Hyderbad Kenya-Lamu India- Kenya-Lamu Hyderbad Kenya-Lamu India- Kenya-Lamu Hyderbad Kenya-Lamu India- Kenya-Lamu Hyderbad Kenya-Lamu India- Kenya-Lamu Hyderbad
192 Table 22 - Population clustering of each random bred Table 22 - Population clustering of each random bred individual in the database by SNPs and STRs at K = 5 individual in the database by SNPs and STRs at K = 5 Sampling ID Missing Population Sampling ID Missing Population Location No. Data Location No. Data India- India-Andhra Hyderbad India-Andhra India- India-Andhra Hyderbad India-Andhra India- India-Andhra Hyderbad India-Andhra India- India-Andhra Hyderbad India-Andhra India- India-Andhra Hyderbad India-Andhra India- India-Andhra Hyderbad India-Andhra India- India-Andhra Hyderbad India-Andhra India- India-Andhra Hyderbad India-Andhra India- India-Andhra Hyderbad India-Kolkata India- India-Kolkata Hyderbad India-Kolkata India- India-Kolkata Hyderbad India-Kolkata India- India-Kolkata Hyderbad India-Kolkata India- Sri Lanka Hyderbad Sri Lanka India-Andhra Sri Lanka India-Andhra Sri Lanka India-Andhra Sri Lanka India-Andhra Sri Lanka India-Andhra Sri Lanka India-Andhra Sri Lanka
193 Table 22 - Population clustering of each random bred Table 22 - Population clustering of each random bred individual in the database by SNPs and STRs at K = 5 individual in the database by SNPs and STRs at K = 5 Sampling ID Missing Population Sampling ID Missing Population Location No. Data Location No. Data Sri Lanka Thailand Sri Lanka Vietnam Sri Lanka Vietnam Sri Lanka Vietnam Sri Lanka Vietnam Sri Lanka Vietnam Sri Lanka Vietnam Sri Lanka Vietnam Sri Lanka Vietnam Sri Lanka Vietnam Sri Lanka Vietnam Sri Lanka Vietnam Sri Lanka Vietnam Sri Lanka Vietnam Sri Lanka Vietnam Sri Lanka Vietnam Thailand Vietnam Thailand Vietnam Thailand Vietnam Thailand Vietnam Thailand Vietnam Thailand Taiwan Thailand Taiwan Thailand Taiwan Thailand Taiwan Thailand Taiwan Thailand Taiwan Thailand Taiwan Thailand Taiwan Thailand Taiwan Thailand Taiwan Thailand Taiwan
194 Table 22 - Population clustering of each random bred Table 22 - Population clustering of each random bred individual in the database by SNPs and STRs at K = 5 individual in the database by SNPs and STRs at K = 5 Sampling ID Missing Population Sampling ID Missing Population Location No. Data Location No. Data Taiwan Japan-Oita Taiwan Japan-Oita Taiwan Japan-Oita Taiwan Japan- Taiwan Kanazawa Taiwan Japan- Taiwan Kanazawa Taiwan Japan- Taiwan Kanazawa Taiwan Japan- Taiwan Kanazawa Taiwan Japan- Taiwan Kanazawa Taiwan Japan- Taiwan Kanazawa Taiwan Japan- Taiwan Kanazawa Taiwan Japan- Japan-Oita Kanazawa Japan-Oita Japan- Japan-Oita Kanazawa Japan-Oita Japan- Japan-Oita Kanazawa Japan-Oita Japan- Japan-Oita Kanazawa Japan-Oita Japan- Japan-Oita Kanazawa Japan-Oita Japan- Japan-Oita Kanazawa Japan-Oita Japan- Japan-Oita Kanazawa Japan-Oita Japan
195 Table 22 - Population clustering of each random bred Table 22 - Population clustering of each random bred individual in the database by SNPs and STRs at K = 5 individual in the database by SNPs and STRs at K = 5 Sampling ID Missing Population Sampling ID Missing Population Location No. Data Location No. Data Kanazawa Sapporo Japan-Ohmiya Japan- Japan-Ohmiya Sapporo Japan-Ohmiya Japan- Japan-Ohmiya Sapporo Japan-Ohmiya Japan- Japan-Ohmiya Sapporo Japan-Ohmiya Japan- Japan-Ohmiya Sapporo Japan-Ohmiya Japan- Japan-Ohmiya Sapporo Japan-Ohmiya Japan- Japan-Ohmiya Sapporo Japan-Ohmiya Japan- Japan-Ohmiya Sapporo Japan-Ohmiya China-Henan Japan-Ohmiya China-Henan Japan- China-Henan Sapporo China-Henan Japan- China-Henan Sapporo China-Henan Japan- China-Henan Sapporo China-Henan Japan- China-Henan Sapporo China-Henan Japan- China-Henan Sapporo China-Henan Japan- China-Henan Sapporo China-Henan Japan- China-Henan Sapporo China-Henan Japan China-Henan
196 Table 22 - Population clustering of each random bred Table 22 - Population clustering of each random bred individual in the database by SNPs and STRs at K = 5 individual in the database by SNPs and STRs at K = 5 Sampling ID Missing Population Sampling ID Missing Population Location No. Data Location No. Data China-Henan South Korea China-Henan South Korea China-Henan South Korea South Korea South Korea South Korea South Korea South Korea South Korea South Korea South Korea South Korea South Korea South Korea South Korea South Korea South Korea South Korea South Korea South Korea South Korea South Korea South Korea South Korea South Korea South Korea South Korea South Korea South Korea South Korea South Korea South Korea South Korea South Korea South Korea South Korea South Korea South Korea
197 Table 23 - Population clustering of each random bred individual in the database by SNPs at K = 8 Sampling ID Missing Population Location No. Data USA-NY USA-NY USA-NY USA-NY USA-NY USA-NY USA-NY USA-NY USA-NY USA-MS USA-MS USA-MS USA-MS USA-MS USA-MS USA-MS USA-MS USA-MS USA-MS USA-HI USA-HI USA-HI USA-HI USA-HI USA-HI USA-HI USA-HI USA-HI USA-HI Brazil Brazil Brazil Brazil Brazil Brazil Brazil Brazil Brazil Brazil Brazil Brazil Brazil Brazil Brazil Brazil Brazil Brazil Brazil Brazil Brazil Brazil Brazil Brazil Brazil Brazil Brazil
198 Table 23 - Population clustering of each random bred individual in the database by SNPs at K = 8 Sampling ID Missing Population Location No. Data Brazil Brazil Finland Finland Finland Finland Finland Finland Finland Finland Finland Finland Finland Germany Germany Germany Germany Germany Germany Germany Germany Germany Germany Germany Germany Germany Germany Germany Germany Germany Germany Germany Germany Germany Germany Germany Germany Germany Germany Germany Germany Germany Italy-Milan Italy-Milan Italy-Milan Italy-Milan Italy-Milan Italy-Milan Italy-Milan Italy-Milan Italy-Milan Italy-Milan Italy-Milan Italy-Milan Italy-Milan Italy-Milan
199 Table 23 - Population clustering of each random bred individual in the database by SNPs at K = 8 Sampling ID Missing Population Location No. Data Italy-Rome Italy-Rome Italy-Rome Italy-Rome Italy-Rome Italy-Rome Italy-Rome Italy-Rome Italy-Rome Italy-Rome Italy-Rome Italy-Rome Italy-Rome Italy-Rome Italy-Rome Turkey Turkey Turkey Turkey Turkey Turkey Turkey Turkey Turkey Turkey Turkey Turkey Turkey Turkey Turkey Turkey Turkey Turkey Turkey Turkey Turkey Turkey Turkey Turkey Turkey Turkey Turkey Turkey Turkey Turkey Turkey Turkey Turkey Turkey Turkey Turkey Turkey Turkey Turkey Turkey Turkey
200 Table 23 - Population clustering of each random bred individual in the database by SNPs at K = 8 Sampling ID Missing Population Location No. Data Turkey Turkey Turkey Turkey Turkey Turkey Turkey Turkey Turkey Turkey Cyprus Cyprus Cyprus Cyprus Cyprus Cyprus Cyprus Cyprus Cyprus Cyprus Cyprus Cyprus Cyprus Cyprus Cyprus Cyprus Cyprus Cyprus Cyprus Cyprus Cyprus Cyprus Cyprus Cyprus Cyprus Cyprus Cyprus Cyprus Cyprus Cyprus Lebanon Lebanon Lebanon Lebanon Lebanon Lebanon Lebanon Lebanon Lebanon Lebanon Lebanon Lebanon Lebanon Lebanon Lebanon Lebanon
201 Table 23 - Population clustering of each random bred individual in the database by SNPs at K = 8 Sampling ID Missing Population Location No. Data Lebanon Lebanon Lebanon Lebanon Lebanon Lebanon Lebanon Lebanon Lebanon Lebanon Lebanon Lebanon Lebanon Lebanon Lebanon Lebanon Lebanon Lebanon Lebanon Lebanon Lebanon Lebanon Lebanon Lebanon Lebanon Lebanon Lebanon Lebanon Lebanon Lebanon Lebanon Lebanon Lebanon Lebanon Lebanon Lebanon Lebanon Lebanon Lebanon Lebanon Lebanon Lebanon Lebanon Lebanon Lebanon Israel Israel Israel Israel Israel Israel Israel Israel Israel Israel Israel
202 Table 23 - Population clustering of each random bred individual in the database by SNPs at K = 8 Sampling ID Missing Population Location No. Data Israel Israel Israel Israel Israel Israel Israel Israel Israel Israel Israel Israel Israel Israel Israel Israel Israel Israel Israel Israel Israel Israel Israel Israel Israel Israel Israel Israel Israel Israel Israel Israel Israel Israel Israel Egypt-Cairo Egypt-Cairo Egypt-Cairo Egypt-Cairo Egypt-Cairo Egypt-Cairo Egypt-Cairo Egypt-Cairo Egypt-Cairo Egypt-Cairo Egypt-Cairo Egypt-Cairo Egypt-Cairo Egypt-Cairo Egypt-Cairo Egypt-Cairo Egypt-Cairo Egypt-Cairo Egypt-Cairo Egypt-Cairo Egypt-Cairo
203 Table 23 - Population clustering of each random bred individual in the database by SNPs at K = 8 Sampling ID Missing Population Location No. Data Egypt-Cairo Egypt-Cairo Egypt-Cairo Egypt-Cairo Egypt-Cairo Egypt-Cairo Egypt-Cairo Egypt-Cairo Egypt-Cairo Egypt-Cairo Egypt-Cairo Egypt-Cairo Egypt-Cairo Egypt-Cairo Egypt-Cairo Egypt-Cairo Egypt-Cairo Egypt-Cairo Egypt-Cairo Egypt-Cairo Egypt-Cairo Egypt-Cairo Egypt-Cairo Egypt-Cairo Egypt-Cairo Egypt-Cairo Egypt-Cairo Egypt-Cairo Egypt-Cairo Egypt-Cairo Egypt-Cairo Egypt-Cairo Egypt-Cairo Egypt-Cairo Egypt-Cairo Egypt-Cairo Egypt-Cairo Egypt-Cairo Egypt-Cairo Egypt-Cairo Egypt-Cairo Egypt-Cairo Egypt-Cairo Egypt-Cairo Egypt-Cairo Egypt-Cairo Egypt-Cairo Egypt-Cairo Egypt-Cairo Egypt-Cairo Egypt-Cairo Egypt-Cairo Egypt-Cairo Egypt-Cairo Egypt-Cairo Egypt-Cairo
204 Table 23 - Population clustering of each random bred individual in the database by SNPs at K = 8 Sampling ID Missing Population Location No. Data Egypt-Cairo Egypt-Cairo Egypt-Cairo Egypt-Cairo Egypt-Cairo Egypt-Asuit Egypt-Asuit Egypt-Asuit Egypt-Asuit Egypt-Asuit Egypt-Asuit Egypt-Asuit Egypt-Asuit Egypt-Asuit Egypt-Asuit Egypt-Luxor Egypt-Luxor Egypt-Luxor Egypt-Luxor Egypt-Luxor Egypt-Luxor Egypt-Luxor Egypt-Luxor Egypt-Luxor Egypt-Luxor Egypt-Luxor Egypt-Luxor Egypt-Luxor Egypt-Luxor Egypt-Luxor Egypt-Luxor Egypt-Luxor Egypt-Luxor Egypt-Luxor Egypt-Luxor Egypt-Luxor Egypt-Luxor Egypt-Luxor Egypt-Luxor Egypt-Luxor Egypt-Luxor Egypt-Luxor Egypt-Luxor Egypt-Abu Simbel Egypt-Abu Simbel Egypt-Abu Simbel Egypt-Abu Simbel Egypt-Abu Simbel Iraq-West Iraq-West Iraq-West Iraq-West Iraq-West Iraq-West Iraq-West Iraq-West
205 Table 23 - Population clustering of each random bred individual in the database by SNPs at K = 8 Sampling ID Missing Population Location No. Data Iraq-West Iraq-West Iraq-West Iraq-West Iraq-Baghdad Iraq-Baghdad Iraq-Baghdad Iraq-Baghdad Iraq-Baghdad Iraq-Baghdad Iraq-Baghdad Iraq-Baghdad Iraq-Baghdad Iraq-Baghdad Iraq-Baghdad Iraq-Baghdad Iraq-Baghdad Iraq-Baghdad Iraq-Baghdad Iraq-Baghdad Iraq-Baghdad Iraq-Baghdad Iraq-Baghdad Iraq-Baghdad Iraq-Baghdad Iraq-Baghdad Iraq-Baghdad Iraq-Baghdad Iraq-Baghdad Iraq-Baghdad Iraq-Baghdad Iraq-Baghdad Iraq-Baghdad Iraq-Baghdad Iraq-Baghdad Iraq-Baghdad Iraq-Baghdad Iran Iran Iran Iran Iran Iran Iran Iran Iran Iran Iran Iran Iran Iran Iran Iran Iran Iran Iran
206 Table 23 - Population clustering of each random bred individual in the database by SNPs at K = 8 Sampling ID Missing Population Location No. Data Iran Iran Iran Iran Iran Iran Iran Iran Iran Iran Iran Iran Iran Iran Iran Iran Iran Iran Iran Iran Iran Iran Iran Iran Iran Iran Iran Iran Iran Iran Iran Iran Iran Iran Iran Iran Iran Iran Iran Iran Iran Iran Iran Iran Iran Iran Iran Iran Iran Iran Iran Iran Iran Iran Iran Iran
207 Table 23 - Population clustering of each random bred individual in the database by SNPs at K = 8 Sampling ID Missing Population Location No. Data Iran Iran Iran Iran Iran Iran Iran Iran Iran Iran Iran Iran Iran Iran Iran Iran Iran Iran Iran Iran Iran Iran Iran Iran Iran Iran Iran Iran Iran Iran Iran Iran Iran Iran Iran Dubai Dubai Dubai Dubai Dubai Dubai Dubai Dubai Dubai Dubai Kenya-Nairobi Kenya-Nairobi Kenya-Nairobi Kenya-Nairobi Kenya-Nairobi Kenya-Nairobi Kenya-Nairobi Kenya-Nairobi Kenya-Nairobi Kenya-Nairobi Kenya-Nairobi
208 Table 23 - Population clustering of each random bred individual in the database by SNPs at K = 8 Sampling ID Missing Population Location No. Data Kenya-Nairobi Kenya-Nairobi Kenya-Nairobi Kenya-Nairobi Kenya-Nairobi Kenya-Nairobi Kenya-Nairobi Kenya-Nairobi Kenya-Nairobi Kenya-Nairobi Kenya-Nairobi Kenya-Nairobi Kenya-Nairobi Kenya-Nairobi Kenya-Nairobi Kenya-Nairobi Kenya-Nairobi Kenya-Nairobi Kenya-Nairobi Kenya-Nairobi Kenya-Nairobi Kenya-Nairobi Kenya-Nairobi Kenya-Nairobi Kenya-Nairobi Kenya-Pate Kenya-Pate Kenya-Pate Kenya-Pate Kenya-Pate Kenya-Pate Kenya-Pate Kenya-Pate Kenya-Pate Kenya-Lamu Kenya-Lamu Kenya-Lamu Kenya-Lamu Kenya-Lamu Kenya-Lamu Kenya-Lamu Kenya-Lamu Kenya-Lamu Kenya-Lamu Kenya-Lamu Kenya-Lamu Kenya-Lamu Kenya-Lamu Kenya-Lamu Kenya-Lamu Kenya-Lamu Kenya-Lamu Kenya-Lamu Kenya-Lamu India-Udaipur India-Udaipur
209 Table 23 - Population clustering of each random bred individual in the database by SNPs at K = 8 Missing Population Data India-Udaipur India-Agra India-Agra India-Agra India-Agra India-Agra India-Agra India-Agra India-Agra India-Agra India-Agra India-Agra India-Agra India-Hyderbad India-Hyderbad India-Hyderbad India-Hyderbad India-Hyderbad India-Hyderbad India-Hyderbad India-Hyderbad India-Hyderbad India-Hyderbad India-Hyderbad India-Hyderbad India-Hyderbad India-Hyderbad India-Hyderbad India-Hyderbad India-Hyderbad India-Hyderbad India-Hyderbad India-Hyderbad India-Andhra India-Andhra India-Andhra India-Andhra India-Andhra India-Andhra India-Andhra India-Andhra India-Andhra India-Andhra India-Andhra India-Andhra India-Andhra India-Andhra India-Andhra India-Andhra India-Andhra India-Andhra India-Andhra India-Andhra India-Andhra India-Andhra India-Andhra
210 Table 23 - Population clustering of each random bred individual in the database by SNPs at K = 8 Sampling ID Missing Population Location No. Data India-Kolkata India-Kolkata India-Kolkata India-Kolkata India-Kolkata India-Kolkata India-Kolkata Sri Lanka Sri Lanka Sri Lanka Sri Lanka Sri Lanka Sri Lanka Sri Lanka Sri Lanka Sri Lanka Sri Lanka Sri Lanka Sri Lanka Sri Lanka Sri Lanka Sri Lanka Sri Lanka Sri Lanka Sri Lanka Sri Lanka Sri Lanka Sri Lanka Sri Lanka Sri Lanka Sri Lanka Thailand Thailand Thailand Thailand Thailand Thailand Thailand Thailand Thailand Thailand Thailand Thailand Thailand Thailand Thailand Thailand Thailand Vietnam Vietnam Vietnam Vietnam Vietnam Vietnam Vietnam Vietnam
211 Table 23 - Population clustering of each random bred individual in the database by SNPs at K = 8 Sampling ID Missing Population Location No. Data Vietnam Vietnam Vietnam Vietnam Vietnam Vietnam Vietnam Vietnam Vietnam Vietnam Vietnam Vietnam Taiwan Taiwan Taiwan Taiwan Taiwan Taiwan Taiwan Taiwan Taiwan Taiwan Taiwan Taiwan Taiwan Taiwan Taiwan Taiwan Taiwan Taiwan Taiwan Taiwan Taiwan Taiwan Taiwan Taiwan Taiwan Taiwan Taiwan Taiwan Taiwan Japan-Oita Japan-Oita Japan-Oita Japan-Oita Japan-Oita Japan-Oita Japan-Oita Japan-Oita Japan-Oita Japan-Oita Japan-Oita Japan-Oita Japan-Oita Japan-Oita Japan-Oita
212 Table 23 - Population clustering of each random bred individual in the database by SNPs at K = 8 Sampling ID Missing Population Location No. Data 1 8 Japan-Oita Japan-Oita Japan-Kanazawa Japan-Kanazawa Japan-Kanazawa Japan-Kanazawa Japan-Kanazawa Japan-Kanazawa Japan-Kanazawa Japan-Kanazawa Japan-Kanazawa Japan-Kanazawa Japan-Kanazawa Japan-Kanazawa Japan-Kanazawa Japan-Kanazawa Japan-Kanazawa Japan-Ohmiya Japan-Ohmiya Japan-Ohmiya Japan-Ohmiya Japan-Ohmiya Japan-Ohmiya Japan-Ohmiya Japan-Ohmiya Japan-Ohmiya Japan-Ohmiya Japan-Ohmiya Japan-Ohmiya Japan-Ohmiya Japan-Ohmiya Japan-Ohmiya Japan-Ohmiya Japan-Sapporo Japan-Sapporo Japan-Sapporo Japan-Sapporo Japan-Sapporo Japan-Sapporo Japan-Sapporo Japan-Sapporo Japan-Sapporo Japan-Sapporo Japan-Sapporo Japan-Sapporo Japan-Sapporo Japan-Sapporo Japan-Sapporo China-Henan China-Henan China-Henan China-Henan China-Henan China-Henan China-Henan China-Henan
213 Table 23 - Population clustering of each random bred individual in the database by SNPs at K = 8 Sampling ID Missing Population Location No. Data China-Henan China-Henan China-Henan China-Henan China-Henan China-Henan China-Henan China-Henan China-Henan China-Henan China-Henan China-Henan South Korea South Korea South Korea South Korea South Korea South Korea South Korea South Korea South Korea South Korea South Korea South Korea South Korea South Korea South Korea South Korea South Korea South Korea South Korea South Korea South Korea South Korea South Korea South Korea South Korea South Korea South Korea South Korea South Korea South Korea South Korea South Korea South Korea South Korea South Korea South Korea South Korea South Korea
214 Table 24 - Population clustering of each random bred individual in the database by STRs at K = 7 Sampling ID Missing Population Location No. Data USA-NY USA-NY USA-NY USA-NY USA-NY USA-NY USA-NY USA-NY USA-NY USA-MS USA-MS USA-MS USA-MS USA-MS USA-MS USA-MS USA-MS USA-MS USA-MS USA-HI USA-HI USA-HI USA-HI USA-HI USA-HI USA-HI USA-HI USA-HI USA-HI Brazil Brazil Brazil Brazil Brazil Brazil Brazil Brazil Brazil Brazil Brazil Brazil Brazil Brazil Brazil Brazil Brazil Brazil Brazil Brazil Brazil Brazil Brazil Brazil Brazil Brazil Brazil
215 Table 24 - Population clustering of each random bred individual in the database by STRs at K = 7 Sampling ID Missing Population Location No. Data Brazil Brazil Finland Finland Finland Finland Finland Finland Finland Finland Finland Finland Finland Germany Germany Germany Germany Germany Germany Germany Germany Germany Germany Germany Germany Germany Germany Germany Germany Germany Germany Germany Germany Germany Germany Germany Germany Germany Germany Germany Germany Germany Italy-Milan Italy-Milan Italy-Milan Italy-Milan Italy-Milan Italy-Milan Italy-Milan Italy-Milan Italy-Milan Italy-Milan Italy-Milan Italy-Milan Italy-Milan Italy-Milan
216 Table 24 - Population clustering of each random bred individual in the database by STRs at K = 7 Sampling ID Missing Population Location No. Data Italy-Rome Italy-Rome Italy-Rome Italy-Rome Italy-Rome Italy-Rome Italy-Rome Italy-Rome Italy-Rome Italy-Rome Italy-Rome Italy-Rome Italy-Rome Italy-Rome Italy-Rome Turkey Turkey Turkey Turkey Turkey Turkey Turkey Turkey Turkey Turkey Turkey Turkey Turkey Turkey Turkey Turkey Turkey Turkey Turkey Turkey Turkey Turkey Turkey Turkey Turkey Turkey Turkey Turkey Turkey Turkey Turkey Turkey Turkey Turkey Turkey Turkey Turkey Turkey Turkey Turkey Turkey
217 Table 24 - Population clustering of each random bred individual in the database by STRs at K = 7 Sampling ID Missing Population Location No. Data Turkey Turkey Turkey Turkey Turkey Turkey Turkey Turkey Turkey Turkey Cyprus Cyprus Cyprus Cyprus Cyprus Cyprus Cyprus Cyprus Cyprus Cyprus Cyprus Cyprus Cyprus Cyprus Cyprus Cyprus Cyprus Cyprus Cyprus Cyprus Cyprus Cyprus Cyprus Cyprus Cyprus Cyprus Cyprus Cyprus Cyprus Cyprus Lebanon Lebanon Lebanon Lebanon Lebanon Lebanon Lebanon Lebanon Lebanon Lebanon Lebanon Lebanon Lebanon Lebanon Lebanon Lebanon
218 Table 24 - Population clustering of each random bred individual in the database by STRs at K = 7 Sampling ID Missing Population Location No. Data Lebanon Lebanon Lebanon Lebanon Lebanon Lebanon Lebanon Lebanon Lebanon Lebanon Lebanon Lebanon Lebanon Lebanon Lebanon Lebanon Lebanon Lebanon Lebanon Lebanon Lebanon Lebanon Lebanon Lebanon Lebanon Lebanon Lebanon Lebanon Lebanon Lebanon Lebanon Lebanon Lebanon Lebanon Lebanon Lebanon Lebanon Lebanon Lebanon Lebanon Lebanon Lebanon Lebanon Lebanon Lebanon Israel Israel Israel Israel Israel Israel Israel Israel Israel Israel Israel
219 Table 24 - Population clustering of each random bred individual in the database by STRs at K = 7 Sampling ID Missing Population Location No. Data Israel Israel Israel Israel Israel Israel Israel Israel Israel Israel Israel Israel Israel Israel Israel Israel Israel Israel Israel Israel Israel Israel Israel Israel Israel Israel Israel Israel Israel Israel Israel Israel Israel Israel Israel Egypt-Cairo Egypt-Cairo Egypt-Cairo Egypt-Cairo Egypt-Cairo Egypt-Cairo Egypt-Cairo Egypt-Cairo Egypt-Cairo Egypt-Cairo Egypt-Cairo Egypt-Cairo Egypt-Cairo Egypt-Cairo Egypt-Cairo Egypt-Cairo Egypt-Cairo Egypt-Cairo Egypt-Cairo Egypt-Cairo Egypt-Cairo
220 Table 24 - Population clustering of each random bred individual in the database by STRs at K = 7 Sampling ID Missing Population Location No. Data Egypt-Cairo Egypt-Cairo Egypt-Cairo Egypt-Cairo Egypt-Cairo Egypt-Cairo Egypt-Cairo Egypt-Cairo Egypt-Cairo Egypt-Cairo Egypt-Cairo Egypt-Cairo Egypt-Cairo Egypt-Cairo Egypt-Cairo Egypt-Cairo Egypt-Cairo Egypt-Cairo Egypt-Cairo Egypt-Cairo Egypt-Cairo Egypt-Cairo Egypt-Cairo Egypt-Cairo Egypt-Cairo Egypt-Cairo Egypt-Cairo Egypt-Cairo Egypt-Cairo Egypt-Cairo Egypt-Cairo Egypt-Cairo Egypt-Cairo Egypt-Cairo Egypt-Cairo Egypt-Cairo Egypt-Cairo Egypt-Cairo Egypt-Cairo Egypt-Cairo Egypt-Cairo Egypt-Cairo Egypt-Cairo Egypt-Cairo Egypt-Cairo Egypt-Cairo Egypt-Cairo Egypt-Cairo Egypt-Cairo Egypt-Cairo Egypt-Cairo Egypt-Cairo Egypt-Cairo Egypt-Cairo Egypt-Cairo Egypt-Cairo
221 Table 24 - Population clustering of each random bred individual in the database by STRs at K = 7 Sampling ID Missing Population Location No. Data Egypt-Cairo Egypt-Cairo Egypt-Cairo Egypt-Cairo Egypt-Cairo Egypt-Asuit Egypt-Asuit Egypt-Asuit Egypt-Asuit Egypt-Asuit Egypt-Asuit Egypt-Asuit Egypt-Asuit Egypt-Asuit Egypt-Asuit Egypt-Luxor Egypt-Luxor Egypt-Luxor Egypt-Luxor Egypt-Luxor Egypt-Luxor Egypt-Luxor Egypt-Luxor Egypt-Luxor Egypt-Luxor Egypt-Luxor Egypt-Luxor Egypt-Luxor Egypt-Luxor Egypt-Luxor Egypt-Luxor Egypt-Luxor Egypt-Luxor Egypt-Luxor Egypt-Luxor Egypt-Luxor Egypt-Luxor Egypt-Luxor Egypt-Luxor Egypt-Luxor Egypt-Luxor Egypt-Luxor Egypt-Luxor Egypt-Abu Simbel Egypt-Abu Simbel Egypt-Abu Simbel Egypt-Abu Simbel Egypt-Abu Simbel Iraq-West Iraq-West Iraq-West Iraq-West Iraq-West Iraq-West Iraq-West Iraq-West
222 Table 24 - Population clustering of each random bred individual in the database by STRs at K = 7 Sampling ID Missing Population Location No. Data Iraq-West Iraq-West Iraq-West Iraq-West Iraq-Baghdad Iraq-Baghdad Iraq-Baghdad Iraq-Baghdad Iraq-Baghdad Iraq-Baghdad Iraq-Baghdad Iraq-Baghdad Iraq-Baghdad Iraq-Baghdad Iraq-Baghdad Iraq-Baghdad Iraq-Baghdad Iraq-Baghdad Iraq-Baghdad Iraq-Baghdad Iraq-Baghdad Iraq-Baghdad Iraq-Baghdad Iraq-Baghdad Iraq-Baghdad Iraq-Baghdad Iraq-Baghdad Iraq-Baghdad Iraq-Baghdad Iraq-Baghdad Iraq-Baghdad Iraq-Baghdad Iraq-Baghdad Iraq-Baghdad Iraq-Baghdad Iraq-Baghdad Iraq-Baghdad Iran Iran Iran Iran Iran Iran Iran Iran Iran Iran Iran Iran Iran Iran Iran Iran Iran Iran Iran
223 Table 24 - Population clustering of each random bred individual in the database by STRs at K = 7 Sampling ID Missing Population Location No. Data Iran Iran Iran Iran Iran Iran Iran Iran Iran Iran Iran Iran Iran Iran Iran Iran Iran Iran Iran Iran Iran Iran Iran Iran Iran Iran Iran Iran Iran Iran Iran Iran Iran Iran Iran Iran Iran Iran Iran Iran Iran Iran Iran Iran Iran Iran Iran Iran Iran Iran Iran Iran Iran Iran Iran Iran
224 Table 24 - Population clustering of each random bred individual in the database by STRs at K = 7 Sampling ID Missing Population Location No. Data Iran Iran Iran Iran Iran Iran Iran Iran Iran Iran Iran Iran Iran Iran Iran Iran Iran Iran Iran Iran Iran Iran Iran Iran Iran Iran Iran Iran Iran Iran Iran Iran Iran Iran Iran Dubai Dubai Dubai Dubai Dubai Dubai Dubai Dubai Dubai Dubai Kenya-Nairobi Kenya-Nairobi Kenya-Nairobi Kenya-Nairobi Kenya-Nairobi Kenya-Nairobi Kenya-Nairobi Kenya-Nairobi Kenya-Nairobi Kenya-Nairobi Kenya-Nairobi
225 Table 24 - Population clustering of each random bred individual in the database by STRs at K = 7 Sampling ID Missing Population Location No. Data Kenya-Nairobi Kenya-Nairobi Kenya-Nairobi Kenya-Nairobi Kenya-Nairobi Kenya-Nairobi Kenya-Nairobi Kenya-Nairobi Kenya-Nairobi Kenya-Nairobi Kenya-Nairobi Kenya-Nairobi Kenya-Nairobi Kenya-Nairobi Kenya-Nairobi Kenya-Nairobi Kenya-Nairobi Kenya-Nairobi Kenya-Nairobi Kenya-Nairobi Kenya-Nairobi Kenya-Nairobi Kenya-Nairobi Kenya-Nairobi Kenya-Nairobi Kenya-Pate Kenya-Pate Kenya-Pate Kenya-Pate Kenya-Pate Kenya-Pate Kenya-Pate Kenya-Pate Kenya-Pate Kenya-Lamu Kenya-Lamu Kenya-Lamu Kenya-Lamu Kenya-Lamu Kenya-Lamu Kenya-Lamu Kenya-Lamu Kenya-Lamu Kenya-Lamu Kenya-Lamu Kenya-Lamu Kenya-Lamu Kenya-Lamu Kenya-Lamu Kenya-Lamu Kenya-Lamu Kenya-Lamu Kenya-Lamu Kenya-Lamu India-Udaipur India-Udaipur
226 Table 24 - Population clustering of each random bred individual in the database by STRs at K = 7 Sampling ID Missing Population Location No. Data ndia-udaipur ndia-agra ndia-agra ndia-agra ndia-agra ndia-agra ndia-agra ndia-agra ndia-agra ndia-agra ndia-agra ndia-agra ndia-agra ndia-hyderbad ndia-hyderbad ndia-hyderbad ndia-hyderbad ndia-hyderbad ndia-hyderbad ndia-hyderbad ndia-hyderbad ndia-hyderbad ndia-hyderbad ndia-hyderbad ndia-hyderbad ndia-hyderbad ndia-hyderbad ndia-hyderbad ndia-hyderbad ndia-hyderbad ndia-hyderbad ndia-hyderbad ndia-hyderbad ndia-andhra ndia-andhra ndia-andhra ndia-andhra ndia-andhra ndia-andhra ndia-andhra ndia-andhra ndia-andhra ndia-andhra ndia-andhra ndia-andhra ndia-andhra ndia-andhra ndia-andhra ndia-andhra ndia-andhra ndia-andhra ndia-andhra ndia-andhra ndia-andhra ndia-andhra ndia-andhra
227 Table 24 - Population clustering of each random bred individual in the database by STRs at K = 7 Sampling ID Missing Population Location No. Data India-Kolkata India-Kolkata India-Kolkata India-Kolkata India-Kolkata India-Kolkata India-Kolkata Sri Lanka Sri Lanka Sri Lanka Sri Lanka Sri Lanka Sri Lanka Sri Lanka Sri Lanka Sri Lanka Sri Lanka Sri Lanka Sri Lanka Sri Lanka Sri Lanka Sri Lanka Sri Lanka Sri Lanka Sri Lanka Sri Lanka Sri Lanka Sri Lanka Sri Lanka Sri Lanka Sri Lanka Thailand Thailand Thailand Thailand Thailand Thailand Thailand Thailand Thailand Thailand Thailand Thailand Thailand Thailand Thailand Thailand Thailand Vietnam Vietnam Vietnam Vietnam Vietnam Vietnam Vietnam Vietnam
228 Table 24 - Population clustering of each random bred individual in the database by STRs at K = 7 Sampling ID Missing Population Location No. Data Vietnam Vietnam Vietnam Vietnam Vietnam Vietnam Vietnam Vietnam Vietnam Vietnam Vietnam Vietnam Taiwan Taiwan Taiwan Taiwan Taiwan Taiwan Taiwan Taiwan Taiwan Taiwan Taiwan Taiwan Taiwan Taiwan Taiwan Taiwan Taiwan Taiwan Taiwan Taiwan Taiwan Taiwan Taiwan Taiwan Taiwan Taiwan Taiwan Taiwan Taiwan Japan-Oita Japan-Oita Japan-Oita Japan-Oita Japan-Oita Japan-Oita Japan-Oita Japan-Oita Japan-Oita Japan-Oita Japan-Oita Japan-Oita Japan-Oita Japan-Oita Japan-Oita
229 Table 24 - Population clustering of each random bred individual in the database by STRs at K = 7 Sampling ID Missing Population Location No. Data Japan-Oita Japan-Oita Japan-Kanazawa Japan-Kanazawa Japan-Kanazawa Japan-Kanazawa Japan-Kanazawa Japan-Kanazawa Japan-Kanazawa Japan-Kanazawa Japan-Kanazawa Japan-Kanazawa Japan-Kanazawa Japan-Kanazawa Japan-Kanazawa Japan-Kanazawa Japan-Kanazawa Japan-Ohmiya Japan-Ohmiya Japan-Ohmiya Japan-Ohmiya Japan-Ohmiya Japan-Ohmiya Japan-Ohmiya Japan-Ohmiya Japan-Ohmiya Japan-Ohmiya Japan-Ohmiya Japan-Ohmiya Japan-Ohmiya Japan-Ohmiya Japan-Ohmiya Japan-Ohmiya Japan-Sapporo Japan-Sapporo Japan-Sapporo Japan-Sapporo Japan-Sapporo Japan-Sapporo Japan-Sapporo Japan-Sapporo Japan-Sapporo Japan-Sapporo Japan-Sapporo Japan-Sapporo Japan-Sapporo Japan-Sapporo Japan-Sapporo China-Henan China-Henan China-Henan China-Henan China-Henan China-Henan China-Henan China-Henan
230 Table 24 - Population clustering of each random bred individual in the database by STRs at K = 7 Sampling ID Missing Population Location No. Data China-Henan China-Henan China-Henan China-Henan China-Henan China-Henan China-Henan China-Henan China-Henan China-Henan China-Henan China-Henan South Korea South Korea South Korea South Korea South Korea South Korea South Korea South Korea South Korea South Korea South Korea South Korea South Korea South Korea South Korea South Korea South Korea South Korea South Korea South Korea South Korea South Korea South Korea South Korea South Korea South Korea South Korea South Korea South Korea South Korea South Korea South Korea South Korea South Korea South Korea South Korea South Korea South Korea
231 Table 25 - Population clustering of each random bred individual in the database by SNPs and STRs at K = 8 Sampling ID Missing Population Location No. Data USA-NY USA-NY USA-NY USA-NY USA-NY USA-NY USA-NY USA-NY USA-NY USA-MS USA-MS USA-MS USA-MS USA-MS USA-MS USA-MS USA-MS USA-MS USA-MS USA-HI USA-HI USA-HI USA-HI USA-HI USA-HI USA-HI USA-HI USA-HI USA-HI Brazil Brazil Brazil Brazil Brazil Brazil Brazil Brazil Brazil Brazil Brazil Brazil Brazil Brazil Brazil Brazil Brazil Brazil Brazil Brazil Brazil Brazil Brazil Brazil Brazil Brazil Brazil
232 Table 25 - Population clustering of each random bred individual in the database by SNPs and STRs at K = 8 Sampling ID Missing Population Location No. Data Brazil Brazil Finland Finland Finland Finland Finland Finland Finland Finland Finland Finland Finland Germany Germany Germany Germany Germany Germany Germany Germany Germany Germany Germany Germany Germany Germany Germany Germany Germany Germany Germany Germany Germany Germany Germany Germany Germany Germany Germany Germany Germany Italy-Milan Italy-Milan Italy-Milan Italy-Milan Italy-Milan Italy-Milan Italy-Milan Italy-Milan Italy-Milan Italy-Milan Italy-Milan Italy-Milan Italy-Milan Italy-Milan
233 Table 25 - Population clustering of each random bred individual in the database by SNPs and STRs at K = 8 Sampling ID Missing Population Location No. Data Italy-Rome Italy-Rome Italy-Rome Italy-Rome Italy-Rome Italy-Rome Italy-Rome Italy-Rome Italy-Rome Italy-Rome Italy-Rome Italy-Rome Italy-Rome Italy-Rome Italy-Rome Turkey Turkey Turkey Turkey Turkey Turkey Turkey Turkey Turkey Turkey Turkey Turkey Turkey Turkey Turkey Turkey Turkey Turkey Turkey Turkey Turkey Turkey Turkey Turkey Turkey Turkey Turkey Turkey Turkey Turkey Turkey Turkey Turkey Turkey Turkey Turkey Turkey Turkey Turkey Turkey Turkey
234 Table 25 - Population clustering of each random bred individual in the database by SNPs and STRs at K = 8 Sampling ID Missing Population Location No. Data Turkey Turkey Turkey Turkey Turkey Turkey Turkey Turkey Turkey Turkey Cyprus Cyprus Cyprus Cyprus Cyprus Cyprus Cyprus Cyprus Cyprus Cyprus Cyprus Cyprus Cyprus Cyprus Cyprus Cyprus Cyprus Cyprus Cyprus Cyprus Cyprus Cyprus Cyprus Cyprus Cyprus Cyprus Cyprus Cyprus Cyprus Cyprus Lebanon Lebanon Lebanon Lebanon Lebanon Lebanon Lebanon Lebanon Lebanon Lebanon Lebanon Lebanon Lebanon Lebanon Lebanon Lebanon
235 Table 25 - Population clustering of each random bred individual in the database by SNPs and STRs at K = 8 Sampling ID Missing Population Location No. Data Lebanon Lebanon Lebanon Lebanon Lebanon Lebanon Lebanon Lebanon Lebanon Lebanon Lebanon Lebanon Lebanon Lebanon Lebanon Lebanon Lebanon Lebanon Lebanon Lebanon Lebanon Lebanon Lebanon Lebanon Lebanon Lebanon Lebanon Lebanon Lebanon Lebanon Lebanon Lebanon Lebanon Lebanon Lebanon Lebanon Lebanon Lebanon Lebanon Lebanon Lebanon Lebanon Lebanon Lebanon Lebanon Israel Israel Israel Israel Israel Israel Israel Israel Israel Israel Israel
236 Table 25 - Population clustering of each random bred individual in the database by SNPs and STRs at K = 8 Sampling ID Missing Population Location No. Data Israel Israel Israel Israel Israel Israel Israel Israel Israel Israel Israel Israel Israel Israel Israel Israel Israel Israel Israel Israel Israel Israel Israel Israel Israel Israel Israel Israel Israel Israel Israel Israel Israel Israel Israel Egypt-Cairo Egypt-Cairo Egypt-Cairo Egypt-Cairo Egypt-Cairo Egypt-Cairo Egypt-Cairo Egypt-Cairo Egypt-Cairo Egypt-Cairo Egypt-Cairo Egypt-Cairo Egypt-Cairo Egypt-Cairo Egypt-Cairo Egypt-Cairo Egypt-Cairo Egypt-Cairo Egypt-Cairo Egypt-Cairo Egypt-Cairo
237 Table 25 - Population clustering of each random bred individual in the database by SNPs and STRs at K = 8 Sampling ID Missing Population Location No. Data Egypt-Cairo Egypt-Cairo Egypt-Cairo Egypt-Cairo Egypt-Cairo Egypt-Cairo Egypt-Cairo Egypt-Cairo Egypt-Cairo Egypt-Cairo Egypt-Cairo Egypt-Cairo Egypt-Cairo Egypt-Cairo Egypt-Cairo Egypt-Cairo Egypt-Cairo Egypt-Cairo Egypt-Cairo Egypt-Cairo Egypt-Cairo Egypt-Cairo Egypt-Cairo Egypt-Cairo Egypt-Cairo Egypt-Cairo Egypt-Cairo Egypt-Cairo Egypt-Cairo Egypt-Cairo Egypt-Cairo Egypt-Cairo Egypt-Cairo Egypt-Cairo Egypt-Cairo Egypt-Cairo Egypt-Cairo Egypt-Cairo Egypt-Cairo Egypt-Cairo Egypt-Cairo Egypt-Cairo Egypt-Cairo Egypt-Cairo Egypt-Cairo Egypt-Cairo Egypt-Cairo Egypt-Cairo Egypt-Cairo Egypt-Cairo Egypt-Cairo Egypt-Cairo Egypt-Cairo Egypt-Cairo Egypt-Cairo Egypt-Cairo
238 Table 25 - Population clustering of each random bred individual in the database by SNPs and STRs at K = 8 Sampling ID Missing Population Location No. Data Egypt-Cairo Egypt-Cairo Egypt-Cairo Egypt-Cairo Egypt-Cairo Egypt-Asuit Egypt-Asuit Egypt-Asuit Egypt-Asuit Egypt-Asuit Egypt-Asuit Egypt-Asuit Egypt-Asuit Egypt-Asuit Egypt-Asuit Egypt-Luxor Egypt-Luxor Egypt-Luxor Egypt-Luxor Egypt-Luxor Egypt-Luxor Egypt-Luxor Egypt-Luxor Egypt-Luxor Egypt-Luxor Egypt-Luxor Egypt-Luxor Egypt-Luxor Egypt-Luxor Egypt-Luxor Egypt-Luxor Egypt-Luxor Egypt-Luxor Egypt-Luxor Egypt-Luxor Egypt-Luxor Egypt-Luxor Egypt-Luxor Egypt-Luxor Egypt-Luxor Egypt-Luxor Egypt-Luxor Egypt-Luxor Egypt-Abu Simbel Egypt-Abu Simbel Egypt-Abu Simbel Egypt-Abu Simbel Egypt-Abu Simbel Iraq-West Iraq-West Iraq-West Iraq-West Iraq-West Iraq-West Iraq-West Iraq-West
239 Table 25 - Population clustering of each random bred individual in the database by SNPs and STRs at K = 8 Sampling ID Missing Population Location No. Data Iraq-West Iraq-West Iraq-West Iraq-West Iraq-Baghdad Iraq-Baghdad Iraq-Baghdad Iraq-Baghdad Iraq-Baghdad Iraq-Baghdad Iraq-Baghdad Iraq-Baghdad Iraq-Baghdad Iraq-Baghdad Iraq-Baghdad Iraq-Baghdad Iraq-Baghdad Iraq-Baghdad Iraq-Baghdad Iraq-Baghdad Iraq-Baghdad Iraq-Baghdad Iraq-Baghdad Iraq-Baghdad Iraq-Baghdad Iraq-Baghdad Iraq-Baghdad Iraq-Baghdad Iraq-Baghdad Iraq-Baghdad Iraq-Baghdad Iraq-Baghdad Iraq-Baghdad Iraq-Baghdad Iraq-Baghdad Iraq-Baghdad Iraq-Baghdad Iran Iran Iran Iran Iran Iran Iran Iran Iran Iran Iran Iran Iran Iran Iran Iran Iran Iran Iran
240 Table 25 - Population clustering of each random bred individual in the database by SNPs and STRs at K = 8 Sampling ID Missing Population Location No. Data Iran Iran Iran Iran Iran Iran Iran Iran Iran Iran Iran Iran Iran Iran Iran Iran Iran Iran Iran Iran Iran Iran Iran Iran Iran Iran Iran Iran Iran Iran Iran Iran Iran Iran Iran Iran Iran Iran Iran Iran Iran Iran Iran Iran Iran Iran Iran Iran Iran Iran Iran Iran Iran Iran Iran Iran
241 Table 25 - Population clustering of each random bred individual in the database by SNPs and STRs at K = 8 Sampling ID Missing Population Location No. Data Iran Iran Iran Iran Iran Iran Iran Iran Iran Iran Iran Iran Iran Iran Iran Iran Iran Iran Iran Iran Iran Iran Iran Iran Iran Iran Iran Iran Iran Iran Iran Iran Iran Iran Iran Dubai Dubai Dubai Dubai Dubai Dubai Dubai Dubai Dubai Dubai Kenya-Nairobi Kenya-Nairobi Kenya-Nairobi Kenya-Nairobi Kenya-Nairobi Kenya-Nairobi Kenya-Nairobi Kenya-Nairobi Kenya-Nairobi Kenya-Nairobi Kenya-Nairobi
242 Table 25 - Population clustering of each random bred individual in the database by SNPs and STRs at K = 8 Sampling ID Missing Population Location No. Data Kenya-Nairobi Kenya-Nairobi Kenya-Nairobi Kenya-Nairobi Kenya-Nairobi Kenya-Nairobi Kenya-Nairobi Kenya-Nairobi Kenya-Nairobi Kenya-Nairobi Kenya-Nairobi Kenya-Nairobi Kenya-Nairobi Kenya-Nairobi Kenya-Nairobi Kenya-Nairobi Kenya-Nairobi Kenya-Nairobi Kenya-Nairobi Kenya-Nairobi Kenya-Nairobi Kenya-Nairobi Kenya-Nairobi Kenya-Nairobi Kenya-Nairobi Kenya-Pate Kenya-Pate Kenya-Pate Kenya-Pate Kenya-Pate Kenya-Pate Kenya-Pate Kenya-Pate Kenya-Pate Kenya-Lamu Kenya-Lamu Kenya-Lamu Kenya-Lamu Kenya-Lamu Kenya-Lamu Kenya-Lamu Kenya-Lamu Kenya-Lamu Kenya-Lamu Kenya-Lamu Kenya-Lamu Kenya-Lamu Kenya-Lamu Kenya-Lamu Kenya-Lamu Kenya-Lamu Kenya-Lamu Kenya-Lamu Kenya-Lamu India-Udaipur India-Udaipur
243 Table 25 - Population clustering of each random bred individual in the database by SNPs and STRs at K = 8 Sampling ID Missing Population Location No. Data ndia-udaipur ndia-agra ndia-agra ndia-agra ndia-agra ndia-agra ndia-agra ndia-agra ndia-agra ndia-agra ndia-agra ndia-agra ndia-agra ndia-hyderbad ndia-hyderbad ndia-hyderbad ndia-hyderbad ndia-hyderbad ndia-hyderbad ndia-hyderbad ndia-hyderbad ndia-hyderbad ndia-hyderbad ndia-hyderbad ndia-hyderbad ndia-hyderbad ndia-hyderbad ndia-hyderbad ndia-hyderbad ndia-hyderbad ndia-hyderbad ndia-hyderbad ndia-hyderbad ndia-andhra ndia-andhra ndia-andhra ndia-andhra ndia-andhra ndia-andhra ndia-andhra ndia-andhra ndia-andhra ndia-andhra ndia-andhra ndia-andhra ndia-andhra ndia-andhra ndia-andhra ndia-andhra ndia-andhra ndia-andhra ndia-andhra ndia-andhra ndia-andhra ndia-andhra ndia-andhra
244 Table 25 - Population clustering of each random bred individual in the database by SNPs and STRs at K = 8 Sampling ID Missing Population Location No. Data India-Kolkata India-Kolkata India-Kolkata India-Kolkata India-Kolkata India-Kolkata India-Kolkata Sri Lanka Sri Lanka Sri Lanka Sri Lanka Sri Lanka Sri Lanka Sri Lanka Sri Lanka Sri Lanka Sri Lanka Sri Lanka Sri Lanka Sri Lanka Sri Lanka Sri Lanka Sri Lanka Sri Lanka Sri Lanka Sri Lanka Sri Lanka Sri Lanka Sri Lanka Sri Lanka Sri Lanka Thailand Thailand Thailand Thailand Thailand Thailand Thailand Thailand Thailand Thailand Thailand Thailand Thailand Thailand Thailand Thailand Thailand Vietnam Vietnam Vietnam Vietnam Vietnam Vietnam Vietnam Vietnam
245 Table 25 - Population clustering of each random bred individual in the database by SNPs and STRs at K = 8 Sampling ID Missing Population Location No. Data Vietnam Vietnam Vietnam Vietnam Vietnam Vietnam Vietnam Vietnam Vietnam Vietnam Vietnam Vietnam Taiwan Taiwan Taiwan Taiwan Taiwan Taiwan Taiwan Taiwan Taiwan Taiwan Taiwan Taiwan Taiwan Taiwan Taiwan Taiwan Taiwan Taiwan Taiwan Taiwan Taiwan Taiwan Taiwan Taiwan Taiwan Taiwan Taiwan Taiwan Taiwan Japan-Oita Japan-Oita Japan-Oita Japan-Oita Japan-Oita Japan-Oita Japan-Oita Japan-Oita Japan-Oita Japan-Oita Japan-Oita Japan-Oita Japan-Oita Japan-Oita Japan-Oita
246 Table 25 - Population clustering of each random bred individual in the database by SNPs and STRs at K = 8 Sampling ID Missing Population Location No. Data Japan-Oita Japan-Oita Japan-Kanazawa Japan-Kanazawa Japan-Kanazawa Japan-Kanazawa Japan-Kanazawa Japan-Kanazawa Japan-Kanazawa Japan-Kanazawa Japan-Kanazawa Japan-Kanazawa Japan-Kanazawa Japan-Kanazawa Japan-Kanazawa Japan-Kanazawa Japan-Kanazawa Japan-Ohmiya Japan-Ohmiya Japan-Ohmiya Japan-Ohmiya Japan-Ohmiya Japan-Ohmiya Japan-Ohmiya Japan-Ohmiya Japan-Ohmiya Japan-Ohmiya Japan-Ohmiya Japan-Ohmiya Japan-Ohmiya Japan-Ohmiya Japan-Ohmiya Japan-Ohmiya Japan-Sapporo Japan-Sapporo Japan-Sapporo Japan-Sapporo Japan-Sapporo Japan-Sapporo Japan-Sapporo Japan-Sapporo Japan-Sapporo Japan-Sapporo Japan-Sapporo Japan-Sapporo Japan-Sapporo Japan-Sapporo Japan-Sapporo China-Henan China-Henan China-Henan China-Henan China-Henan China-Henan China-Henan China-Henan
247 Table 25 - Population clustering of each random bred individual in the database by SNPs and STRs at K = 8 Sampling ID Missing Population Location No. Data China-Henan China-Henan China-Henan China-Henan China-Henan China-Henan China-Henan China-Henan China-Henan China-Henan China-Henan China-Henan South Korea South Korea South Korea South Korea South Korea South Korea South Korea South Korea South Korea South Korea South Korea South Korea South Korea South Korea South Korea South Korea South Korea South Korea South Korea South Korea South Korea South Korea South Korea South Korea South Korea South Korea South Korea South Korea South Korea South Korea South Korea South Korea South Korea South Korea South Korea South Korea South Korea South Korea
248 [0183] It is understood that the examples and embodiments described herein are for illustrative purposes only and that various modifications or changes in light thereof will be suggested to persons skilled in the art and are to be included within the spirit and purview of this application and scope of the appended claims. All publications, patents, and patent applications cited herein are hereby incorporated by reference in their entirety for all purposes.
249 CLAIMS What is claimed is: 1. A computer implemented method for determining the contributions of feline populations to a feline genome, comprising: (a) genotyping a sample comprising genomic DNA obtained from a test feline to determine the identity of one or both alleles of each marker of a set of markers, wherein the set of markers comprises a plurality of single nucleotide polymorphisms (SNPs) listed in Table 1; (b) comparing the identity of one or both alleles for each of the markers in the set of markers determined to be present in the test feline genome to a database comprising one or more feline population profiles, wherein each feline population profile comprises genotype information for the set of markers in the feline population; and (c) determining the contribution of the one or more feline populations to the test feline genome. 2. The method of claim 1, wherein the plurality of SNPs comprises at least about 100 SNPs listed in Table SNPs listed in Table The method of claim 1, wherein the plurality of SNPs comprises all 4. The method of any one of claims 1 to 3, wherein the set of markers further comprises one or more microsatellite markers. 5. The method of claim 4, wherein the set of markers further comprises one or more short tandem repeats (STRs) selected from the group consisting of FCA005, FCA008, FCA023, FCA026, FCA035, FCA043, FCA045, FCA058, FCA069, FCA075, FCA077, FCA080B, FCA088, FCA090, FCA094, FCA096, FCA097, FCA105, FCA123, FCA126, FCA132, FCA149, FCA21 1, FCA220, FCA223, FCA224, FCA229, FCA262, FCA293, FCA305, FCA310, FCA391, FCA441, FCA453, FCA628, FCA649, FCA678 and FCA The method of any one of claims 1 to 5, wherein the set of markers further comprises one or more phenotypic markers.
250 7. The method of claim 6, wherein the one or more phenotypic markers are selected from the group consisting of Phen_CMAH_G139A, Phen ASIP del, Phen_MLPH_T83del, Phen_MClR_G250A, Phen_TYRPl_C298T, Phen_TYRPl_5IVS6, Phen_TYR_del975C, Phen_TYR_G7 15T, Phen_TYR_G940A, Phen_KIT_G1035C_BI, Phen_FGF5_475, Phen_FGF5_474, phen_fgf5_406, Phen_FGF5_356, Phen_GBLl_G1457C_SIA_KOR, Phen HEXB Dellntr BUR, Phen_HEXB_del39C_KOR, Phen GBE l lns NFC, Phen_KRT7 l_g/aintro4_spx, Phen_MYBPC_G93C_MCC, Phen_MYBPC_C2460T_RAG, phen MPO ALC, Phen PLAU AG ALC, Phen FCAT ALC, Phen_PKLR_13delE6_Aby, Phen PKD 1_C 10063A PER, Phen_SHH_A479G_Hw, Phen_CEP290_PRA_Aby, Phen_CRX_546_Aby, Phen CMAH del, Phen_HEXB_C667T_DSH, Phen_GM2A_Del_DSH, Phen GRHPR DSH, Phen_LPL_G1234A_DSH, Phen LAMAN del PER, Phen ldua del DSH, Phen_ARSB_G1558A_SIA, Phen ARSB T1427C_Sia, Phen GUSB A 1052G DSH, Phen_MYBPC_A74T_Poly, Phen_NPCl_G2864C_PER, Phen_SHH_G257C_UKl, Phen_SHH_A481T_UK2, Phen_HMBS_del842_SIA, Phen-HMBS_189TT_SIA, Phen_CYP21Bl, Phen TAS 1R2 CAT, Phen_TASlR2_G8224A_CAT, Phen_CYP27Bl_Rob, Phen ZFX, KRT7 1-Del Drex, P2RY5_CRex, WNK4_Burm_HKL and CARTl del Burm. 8. The method of any one of claims 1 to 7, wherein the genotype information in each feline population profile comprises identities of one or both alleles of each marker of the set of markers. 9. The method of any one of claims 1 to 8, wherein the genotype information in each feline population profile comprises allele frequencies for one or both alleles of each marker of the set of markers. 10. The method of any one of claims 1 to 9, wherein the database of feline population profiles comprises a plurality of feline population profiles. 11. The method of any one of claims 1 to 10, wherein the database of feline populations profiles comprises profiles for at least one feline breed. 12. The method of any one of claims 1 to 11, wherein the set of markers comprises a subset of the 148 SNP markers listed in Table 1 and wherein the method determines the contributions of one or more feline populations to the test feline genome.
251 13. The method of any one of claims 1 to 12, wherein step (a) comprises amplifying genomic DNA of the test feline using primers specific for each of the set of markers and determining the size of the amplification product. 14. The method of any one of claims 1 to 12, wherein step (a) comprises amplifying genomic DNA of the test feline using primers specific for each of the set of markers and sequencing the amplification product. 15. The method of any one of claims 1 to 14, wherein the algorithm according to step (b) comprises a genotype clustering program. 16. The method of any one of claims 1 to 15, wherein the algorithm according to step (b) comprises an assignment algorithm. 17. The method of any one of claims 1 to 16, wherein step (b) comprises discriminating between the contributions of two or more genetically related feline populations to the test feline genome by comparing the alleles in the test feline genome to a database comprising profiles of the two or more genetically related feline populations. 18. The method of claim 17, wherein the two or more genetically related feline populations are selected from the group consisting of: (i) Persian and Exotic Shorthair (SH); (ii) British SH and Scottish Fold; (iii) Australian Mist and Burmese; (iv) Singapura and Burmese; (v) Birman and Korat; and (vi) Siamese and Havana Brown. 19. The method of any one of claims 1 to 18, further comprising the step of providing a document displaying the contributions of one or more feline populations to the genome of the test feline genome. 20. The method of claim 19, wherein the document provides additional information regarding the one or more feline populations that contributed to the genome of the test feline.
252 2 1. The method of claim 20, wherein the additional information is healthrelated information. 22. The method of claim 20, wherein the document provides a certification of the contributions of one or more feline populations to the genome of the test feline. 23. The method of claim 20, wherein the document provides a representation of the one or more feline populations that contributed to the genome of the test feline. 24. A method for defining one or more feline populations, comprising: (a) determining the identity of one or both alleles for each marker of a set of markers in a test feline genome, wherein the set of markers comprises a plurality of single nucleotide polymorphisms (SNPs) listed in Table 1; and (b) applying a computer-implemented statistical model to define one or more distinct feline populations, wherein one or more distinct feline populations are characterized by a set of allele frequencies for each marker in the set of markers comprising a plurality of SNPs listed in Table One or more computer-readable media comprising: (a) a data structure stored thereon for use in distinguishing feline populations, the data structure comprising: (i) marker data, wherein the marker data identifies one or both alleles of each marker of a set of markers in one or more feline population profiles, wherein the set of markers comprises a plurality of single nucleotide polymorphisms (SNPs) listed in Table 1; and (ii) genotype information data, wherein the genotype information data provides genotype information for each marker of a set of markers in a feline population, wherein a record comprises an instantiation of the marker data and an instantiation of the genotype information data and a set of records represents a feline population profile; and (b) computer-executable instructions for controlling one or more computing devices to: (i) identify one or both alleles in a test feline genome for each marker of the set of markers; and
253 (ii) determine the contributions of one or more feline populations to the test feline genome by comparing the identified alleles in the test feline genome to the database comprising one or more feline population profiles, wherein each feline population profile comprises genotype information for the set of markers in the feline population. 26. One or more computer-readable media comprising a data structure stored thereon for use in distinguishing feline populations, the data structure comprising: (a) marker data, wherein the marker data identifies one or both alleles of each marker of a set of markers in one or more feline population profiles, wherein the set of markers comprises a plurality of single nucleotide polymorphisms (SNPs) listed in Table 1; and (b) genotype information data, wherein the genotype information data provides genotype information for each marker of a set of markers in a feline population, wherein a record comprises an instantiation of the marker data and an instantiation of the genotype information data and a set of records represents a feline population profile. 27. The computer readable media of any one of claims 25 to 26, wherein the plurality of SNPs comprises at least about 100 SNPs listed in Table The computer readable media of any one of claims 25 to 26, wherein the plurality of SNPs comprises all 148 SNPs listed in Table The computer readable media of any one of claims 25 to 28, wherein the set of markers further comprises one or more microsatellite markers. 30. The computer readable media of claim 29, wherein the set of markers further comprises one or more short tandem repeats (STRs) selected from the group consisting of FCA005, FCA008, FCA023, FCA026, FCA035, FCA043, FCA045, FCA058, FCA069, FCA075, FCA077, FCA080B, FCA088, FCA090, FCA094, FCA096, FCA097, FCA105, FCA123, FCA126, FCA132, FCA149, FCA21 1, FCA220, FCA223, FCA224, FCA229, FCA262, FCA293, FCA305, FCA310, FCA391, FCA441, FCA453, FCA628, FCA649, FCA678 and FCA The computer readable media of any one of claims 25 to 30, wherein the set of markers further comprises one or more phenotypic markers.
254 32. The computer readable media of claim 31, wherein the one or more phenotypic markers are selected from the group consisting of Phen_CMAH_G139A, Phen ASIP del, Phen_MLPH_T83del, Phen_MClR_G250A, Phen_TYRPl_C298T, Phen_TYRPl_5IVS6, Phen_TYR_del975C, Phen_TYR_G7 15T, Phen_TYR_G940A, Phen_KIT_G1035C_BI, Phen_FGF5_475, Phen_FGF5_474, phen_fgf5_406, Phen_FGF5_356, Phen_GBLl_G1457C_SIA_KOR, Phen HEXB Dellntr BUR, Phen_HEXB_del39C_KOR, Phen GBE l lns NFC, Phen_KRT7 l_g/aintro4_spx, Phen_MYBPC_G93C_MCC, Phen_MYBPC_C2460T_RAG, phen MPO ALC, Phen PLAU AG ALC, Phen FCAT ALC, Phen_PKLR_13delE6_Aby, Phen PKD 1_C 10063A PER, Phen_SHH_A479G_Hw, Phen_CEP290_PRA_Aby, Phen_CRX_546_Aby, Phen CMAH del, Phen_HEXB_C667T_DSH, Phen_GM2A_Del_DSH, Phen GRHPR DSH, Phen_LPL_G1234A_DSH, Phen LAMAN del PER, Phen ldua del DSH, Phen_ARSB_G1558A_SIA, Phen ARSB T1427C_Sia, Phen GUSB A 1052G DSH, Phen_MYBPC_A74T_Poly, Phen_NPCl_G2864C_PER, Phen_SHH_G257C_UKl, Phen_SHH_A481T_UK2, Phen_HMBS_del842_SIA, Phen-HMBS_189TT_SIA, Phen_CYP21Bl, Phen TAS 1R2 CAT, Phen_TASlR2_G8224A_CAT, Phen_CYP27Bl_Rob, Phen ZFX, KRT7 1-Del Drex, P2RY5_CRex, WNK4_Burm_HKL and CARTl del Burm. 33. A method for determining the contributions of feline populations to a feline genome, comprising performing a genotyping assay on a sample comprising genomic DNA obtained from a test feline to determine the identity of one or both alleles present in the test feline genome for each marker of a set of markers, wherein the set of markers is indicative of the contribution of feline populations to the genome of the test feline, wherein the set of markers comprises a plurality of single nucleotide polymorphisms (SNPs) listed in Table A method of assigning a feline individual to a population of origin, which comprises: (a) genotyping the feline individual to identify one or both alleles of each marker of a set of markers to thereby identify the individual's genotype, wherein the set of markers comprises a plurality of single nucleotide polymorphisms (SNPs) listed in Table 1; (b) applying a computer-implemented statistical model to assign the feline individual to one or more feline populations in a database, wherein the one or more feline
255 populations are characterized by a set of allele frequencies for each marker in the set of markers; and (c) assigning the feline individual to the one or more most likely populations identified in step (b). 35. The method of claim 34, wherein the individual is assigned to the one or more most likely feline populations if the population genotype probability for the most likely feline populations exceed the value of assignment to any other feline populations of the database. 36. The method of any one of claims 34 to 35, wherein the set of markers further comprises one or more STRs selected from the group consisting of FCA005, FCA008, FCA023, FCA026, FCA035, FCA043, FCA045, FCA058, FCA069, FCA075, FCA077, FCA080B, FCA088, FCA090, FCA094, FCA096, FCA097, FCA105, FCA123, FCA126, FCA132, FCA149, FCA21 1, FCA220, FCA223, FCA224, FCA229, FCA262, FCA293, FCA305, FCA310, FCA391, FCA441, FCA453, FCA628, FCA649, FCA678 and FCA The method of any one of claims 34 to 36, wherein the set of markers further comprises one or more of the phenotypic markers selected from the group consisting of Phen CMAH G139A, Phen ASIP del, Phen_MLPH_T83del, Phen_MClR_G250A, Phen_TYRPl_C298T, Phen_TYRPl_5IVS6, Phen_TYR_del975C, Phen_TYR_G7 15T, Phen_TYR_G940A, Phen_KIT_G1035C_BI, Phen_FGF5_475, Phen_FGF5_474, phen_fgf5_406, Phen_FGF5_356, Phen_GBLl_G1457C_SIA_KOR, Phen HEXB Dellntr BUR, Phen_HEXB_del39C_KOR, Phen GBE 1 Ins NFC, Phen_KRT7 l_g/aintro4_spx, Phen_MYBPC_G93C_MCC, Phen_MYBPC_C2460T_RAG, phen MPO ALC, Phen PLAU AG ALC, Phen FCAT ALC, Phen PKLR l 3delE6_Aby, Phen PKD 1_C 10063A PER, Phen_SHH_A479G_Hw, Phen_CEP290_PRA_Aby, Phen_CRX_546_Aby, Phen CMAH del, Phen_HEXB_C667T_DSH, Phen_GM2A_Del_DSH, Phen GRHPR DSH, Phen_LPL_G1234A_DSH, Phen LAMAN del PER, Phen ldua del DSH, Phen_ARSB_G1558A_SIA, Phen_ARSB_T1427C_Sia, Phen GUSB A l 052G DSH, Phen_MYBPC_A74T_Poly, Phen NPC 1 G2864C PER, Phen_SHH_G257C_UKl, Phen_SHH_A481T_UK2, Phen_HMBS_del842_SIA, Phen- HMBS l 89TT SIA, Phen_CYP21Bl, Phen TAS 1R2 CAT,
256 Phen_TASlR2_G8224A_CAT, Phen_CYP27Bl_Rob, Phen ZFX, KRT7 1-Del Drex, P2RY5 CRex, WNK4_Burm_HKL and CARTl del Burm. 38. The method of any one of claims 34 to 37, wherein prior to genotyping, a most likely population of origin is based on one or more morphological features of the individual. 39. The method of any one of claims 34 to 37, wherein prior to genotyping, one or more morphological features of the individual allow the exclusion of one or more of the candidate populations of origin. 40. The method of any one of claims 34 to 39, wherein marker locus genotypes for said each candidate population are in Hardy-Weinberg Equilibrium and Gametic Phase Equilibrium.
257
258
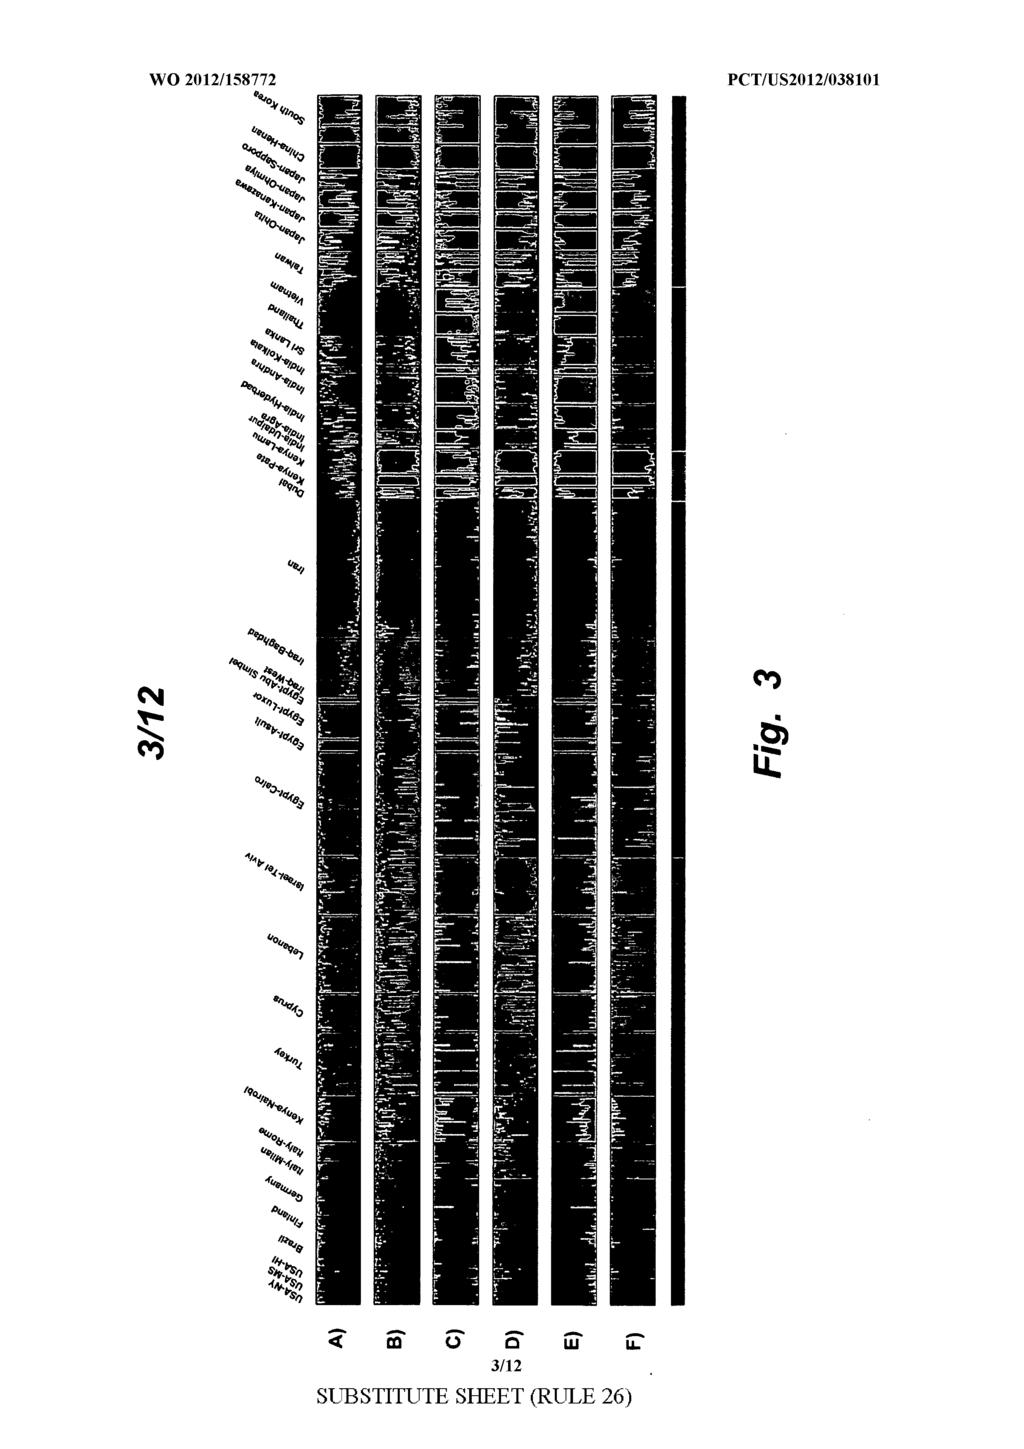
259
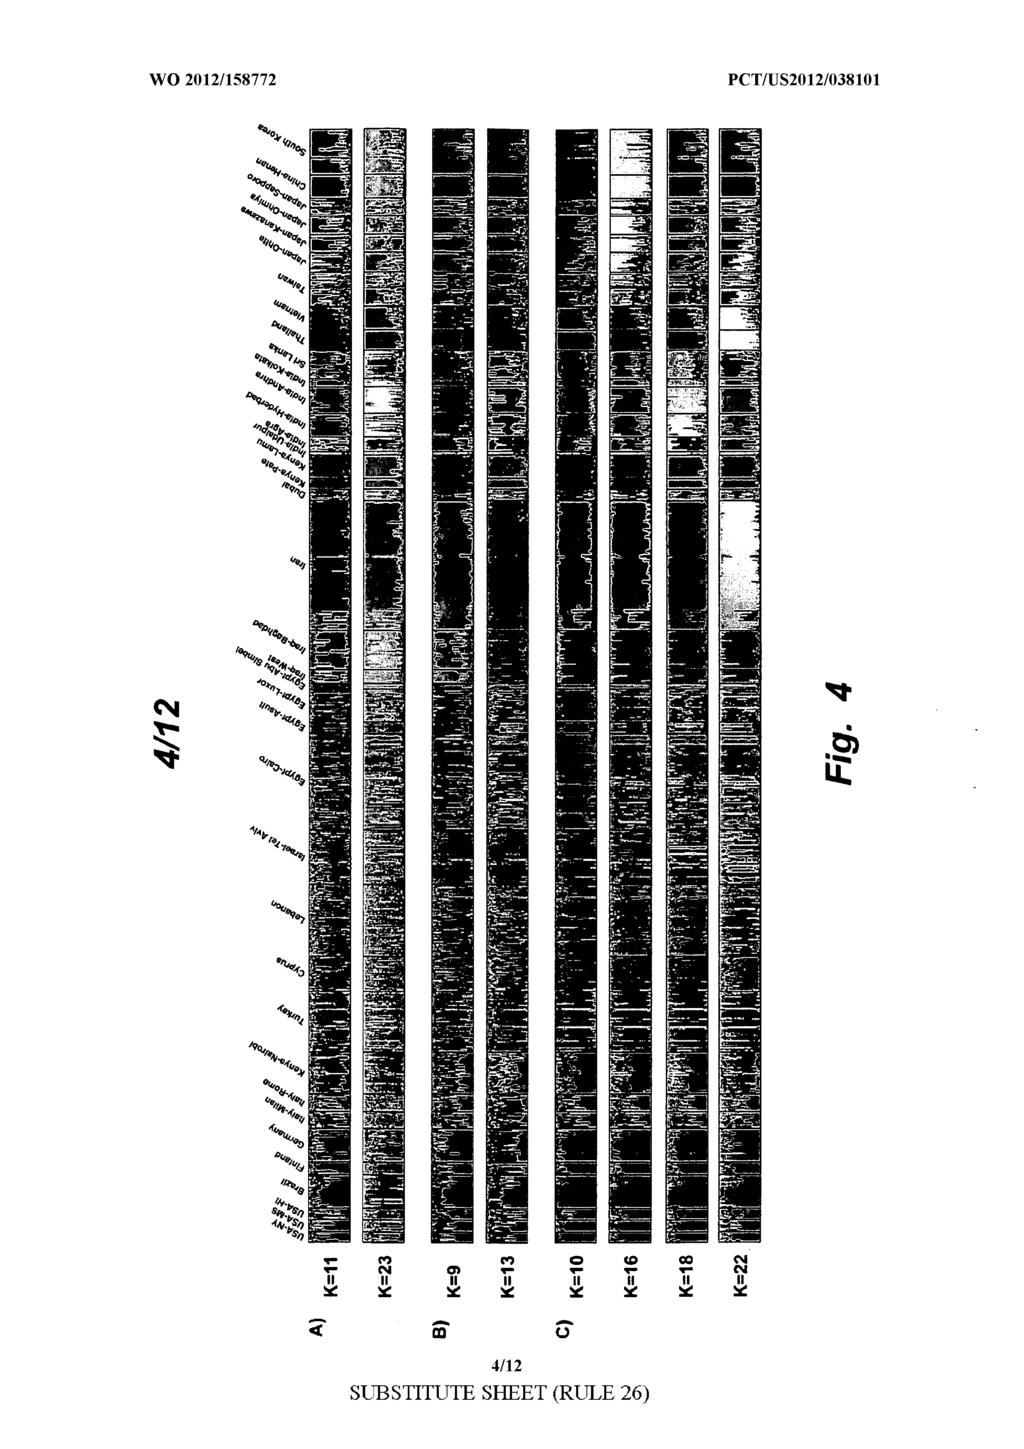
260
261
262
263
264
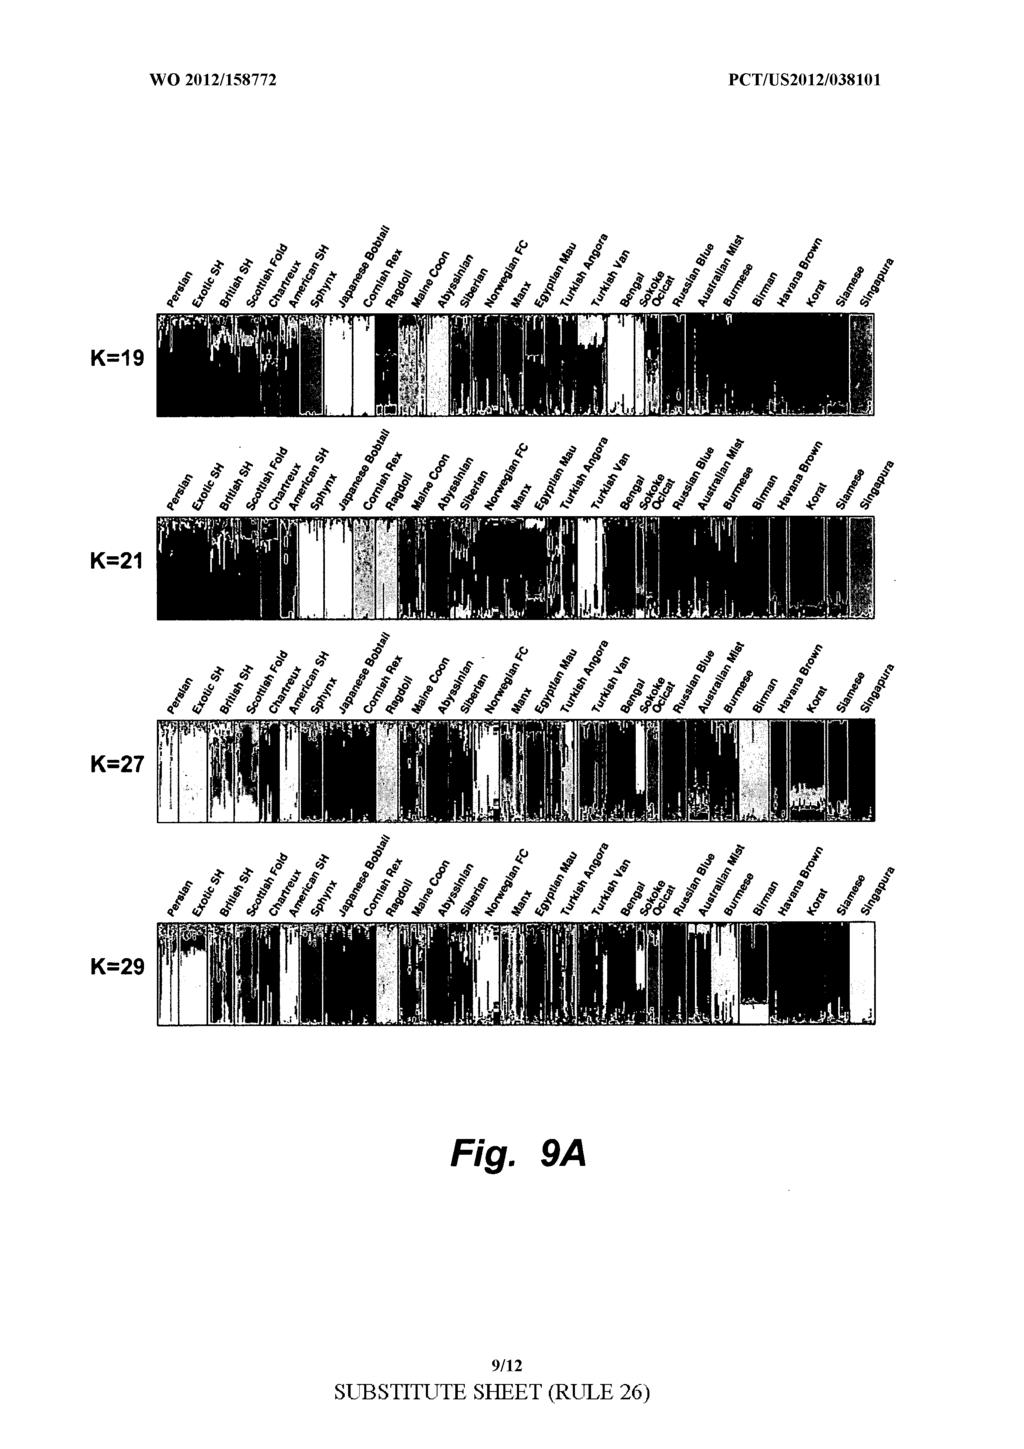
265
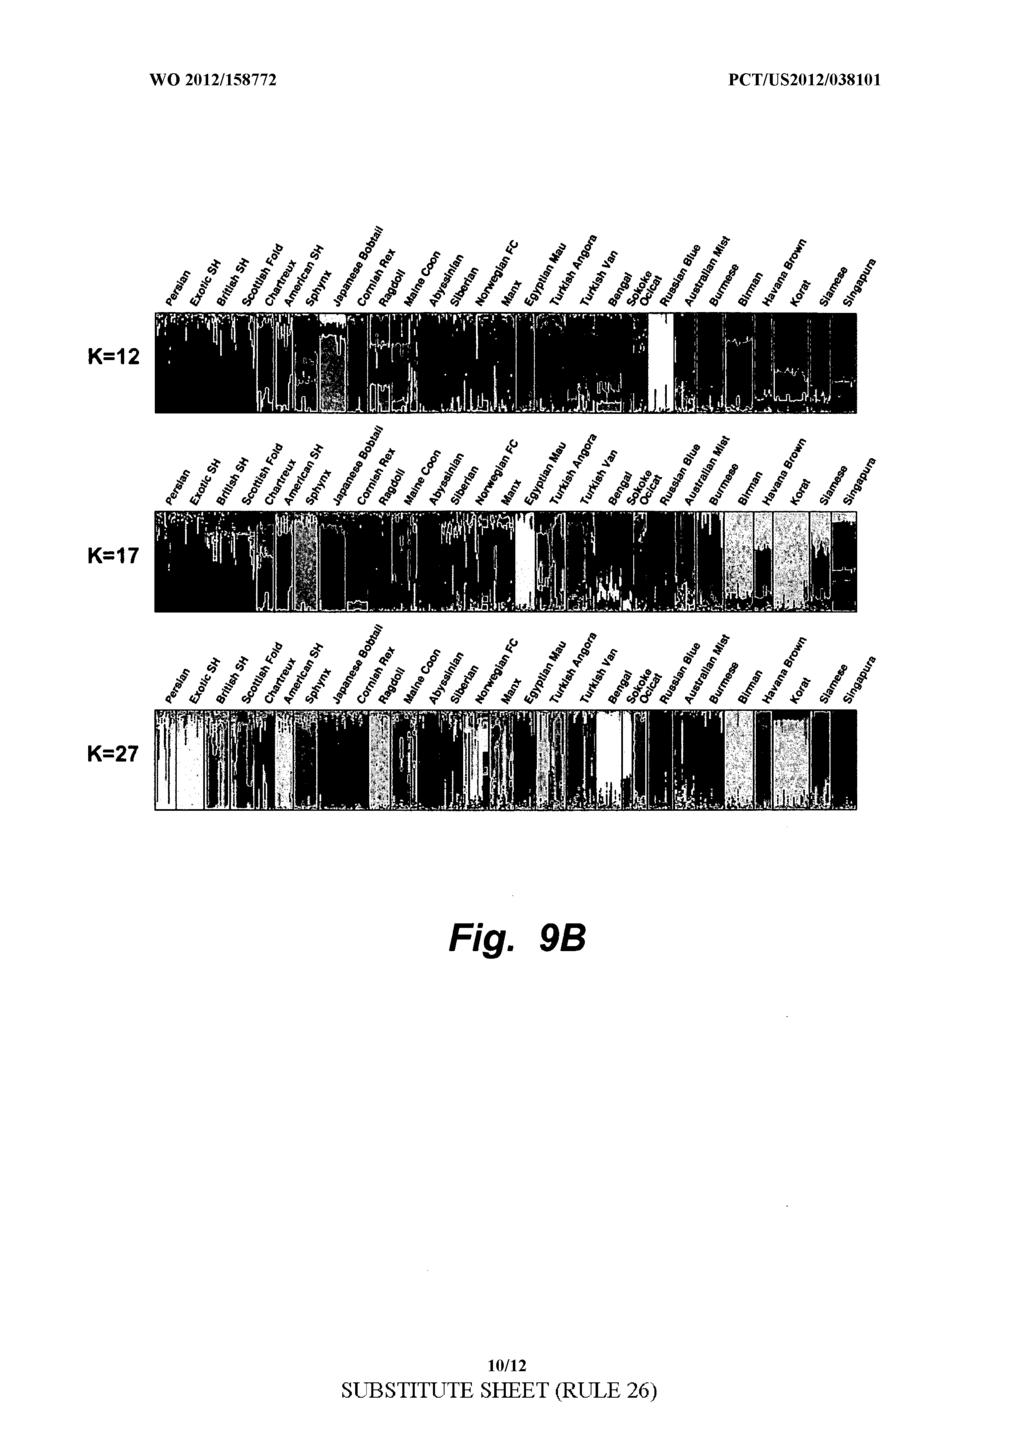
266
The International Cat Association, Inc. Scan this QR tag from your Smartphone or Tablet to find out more about TICA.
 . Scan this QR tag from your Smartphone or Tablet to find out more about TICA. Android QR Droid from Android Market ios QR Reader from Apple s App Store Blackberry Blackberry Messenger seems to be the
List of breeds, which are recognized and admitted by the WCF
 Breed Synonym Category Recognized Admitted Preliminary WCC-Organization Abyssinian all Bobtail Curl Curl Wirehair Anatoli CFA, S CFA, CFA, FIFe, SACC, S CFA, FIFe, SACC, CFA, SACC, CFA, Arabian Mau Asian
Cat Breeds & Types. I. Cat Categories. II. Breed Registries. Kolts & Kitties Combined Cat Info
 I. Cat Categories In 4 H, cats are divided into two categories: Household Pets A. Household Pets Cat Breeds & Types Kolts & Kitties Combined Cat Info Page 1 of 13 Purebreds Most cats in America are housecats
S t r a y. The Cat Sourcebook for USCMC sorensen/crane
 S t r a y The Cat Sourcebook for USCMC sorensen/crane FELINE CHARACTER CREATION House Cat Ripley: "And you, you little shit-head you're staying here." Raw Abilities: Will 5, Health 3. Natural Order is
THE TRADITIONAL CAT ASSOCIATION, INC. 1987
 THE TRADITIONAL CAT ASSOCIATION, INC. 1987 The Worlds Largest Registry of Traditional Cats, Diana L. Fineran Classic Cats and Household Pets PO Box 178 The TOP CAT site on the web Heisson, WA 98622-0178
Riverstone Schofields Memorial Hall 18 Market Street Riverstone NSW 2765
 3 Rings All Breeds and Companion Exhibits Championship Cat Show Saturday 7 th July 2018 Show is strictly limited to a maximum of 80 Exhibits CATS NSW Members will be given preference if entries are received
PCT WO 2007/ Al
 (12) INTERNATIONAL APPLICATION PUBLISHED UNDER THE PATENT COOPERATION TREATY (PCT) (19) World Intellectual Property Organization International Bureau (43) International Publication Date (10) International
AGREEMENT PROTOCOL. between the Parties
 AGREEMENT PROTOCOL between the Parties Fédération pour la gestion du Livre Officiel des Origines Félines 1 rue du Pré St Gervais 93697 PANTIN CEDEX FRANCE Association, SIRET 410 757 025 00037 hereafter
Riverstone Schofields Memorial Hall 18 Market Street Riverstone NSW 2765 Air Conditioned Venue for our Feline & Exhibitors comfort
 3 Rings All Breeds & Companion Exhibits Championship Cat Show celebrating CATS NSW 4 th Birthday Saturday 14 th October 2017 Riverstone Schofields Memorial Hall 18 Market Street Riverstone NSW 2765 Air
Riverstone Schofields Memorial Hall 18 Market Street Riverstone NSW 2765
 3 Rings All Breeds and Companion Exhibits Championship Cat Show Saturday 17 th February 2018 Show is strictly limited to a maximum of 80 Exhibits CATS NSW Members will be given preference if entries are
Limited to 250 cats so get entries in early We look forward to you all exhibiting your beautiful cats Proudly sponsored by
 South Australia Queensland Feline Association of SA Inc 2015 Annual Show South Australia s Cat Show Extravaganza 18-19 July 2015 2 Full Days and 6 Rings (St Paul s College, Gilles Plains) 2 INTERNATIONAL
Cat Round Robin Questions. 1. What do you call an intact male cat? An intact female? A baby? (A Tom, a Queen, a kitten)
") Cat Round Robin Questions General Information: 1. What do you call an intact male cat? An intact female? A baby? (A Tom, a Queen, a kitten) 2. What ages mark kitten, adult cat and senior? (Kittens: up
Cat Round Robin Questions General Information: 1. What do you call an intact male cat? An intact female? A baby? (A Tom, a Queen, a kitten) 2. What ages mark kitten, adult cat and senior? (Kittens: up
`LIST OF BREEDS TO BE CATERED FOR AT GCCF CHAMPIONSHIP SHOWS FOR THE SHOW SEASON
 `LIST OF BREEDS TO BE CATERED FOR AT GCCF CHAMPIONSHIP SHOWS FOR THE 2017-2018 SHOW SEASON This list has been updated for the above show season for guidance only and should not be reproduced in a schedule.
Cat Domestication & Breed Development
 Proceeding, 10 th World Congress on Genetics Applied to Livestock Production Cat Domestication & Breed Development L. A. Lyons Department of Veterinary Medicine & Surgery, College of Veterinary Medicine,
Summer Show. Show is strictly limited to a maximum of 80 Exhibits
 Summer Show In Conjunction with the Siamese Cats Society of NSW 3 Rings All Breeds and Companion Exhibits Championship Cat Show Plus Specialty Pure Siamese and Joyce Selby Awards Saturday 9 th February
EP A1 (19) (11) EP A1 (12) EUROPEAN PATENT APPLICATION. (43) Date of publication: Bulletin 2007/48
 (11) EP A1 (12) EUROPEAN PATENT APPLICATION. (43) Date of publication: Bulletin 2007/48") (19) (12) EUROPEAN PATENT APPLICATION (11) EP 1 860 105 A1 (43) Date of publication: 28.11.2007 Bulletin 2007/48 (51) Int Cl.: C07D 401/04 (2006.01) (21) Application number: 07010347.8 (22) Date of filing:
(19) (12) EUROPEAN PATENT APPLICATION (11) EP 1 860 105 A1 (43) Date of publication: 28.11.2007 Bulletin 2007/48 (51) Int Cl.: C07D 401/04 (2006.01) (21) Application number: 07010347.8 (22) Date of filing:
2 Rings All Breeds plus Speciality Group 2 & 3 Ring & 3 Ring Companion Exhibits Championship Cat Show Saturday 14 th April 2018
 2 Rings All Breeds plus Speciality Group 2 & 3 Ring & 3 Ring Companion Exhibits Championship Cat Show Saturday 14 th April 2018 Show is strictly limited to a maximum of 80 Exhibits CATS NSW Members will
Hosted by CATS NSW Inc 2 Rings All Breeds and Companion Exhibits Championship Cat Show featuring Group 2 Speciality Awards.
 Hosted by CATS NSW Inc 2 Rings All Breeds and Companion Exhibits Championship Cat Show featuring Group 2 Speciality Awards Saturday 10 th March 2018 Bargo Sports Club 3580 Remembrance Drive, Bargo NSW
GENETIC ANALYSIS REPORT
 GENETIC ANALYSIS REPORT OWNER S DETAILS Monika Zajac Myczkowskiego 27 Krakow 30-198 PL ANIMAL S DETAILS Registered Name: Monterini Quest*UA Pet Name: Monterini Quest Registration Number: Pending Breed:
Grand Champion REAL WORLD MOSHI MOSHI
 Grand Champion REAL WORLD MOSHI MOSHI Gene Inheritance Probabilities Based On 4 Generations of Ancestors Category: All Genes, Alleles Present Sire: CH REAL WORLD BILLY BOY OF ARROW Full Breed Desc.: Copper-Eyed
Official Journal of the European Union (2004/118/EC)
") L 36/34 EN 7.2.2004 COMMISSION DECISION of 28 January 2004 amending Decisions 95/233/EC, 96/482/EC, and 2001/751/EC relating to the importation of live poultry and hatching eggs and live ratites and hatching
L 36/34 EN 7.2.2004 COMMISSION DECISION of 28 January 2004 amending Decisions 95/233/EC, 96/482/EC, and 2001/751/EC relating to the importation of live poultry and hatching eggs and live ratites and hatching
The Taming of the Cat Stephen J. O Brien. August 7, 2017 Some Pictures and Some Stories
 The Taming of the Cat Stephen J. O Brien August 7, 2017 Some Pictures and Some Stories Beauceron Berger Allemand Borders Collies Westie Yorkshire Bouviers Bernois D.Bordeaux Whippet Epagneul Breton
MERSEYSIDE CAT CLUB. SCHEDULE of the THIRTY-SIXTH ALL BREEDS CHAMPIONSHIP SHOW OPEN TO ALL. (Under Licence and Rules)
") MERSEYSIDE CAT CLUB SCHEDULE of the THIRTY-SIXTH ALL BREEDS CHAMPIONSHIP SHOW OPEN TO ALL (Under Licence and Rules) TO BE HELD ON SATURDAY 6th JUNE 2015 at the SUTTON LEISURE CENTRE Elton Head Road, St
MERSEYSIDE CAT CLUB SCHEDULE of the THIRTY-SIXTH ALL BREEDS CHAMPIONSHIP SHOW OPEN TO ALL (Under Licence and Rules) TO BE HELD ON SATURDAY 6th JUNE 2015 at the SUTTON LEISURE CENTRE Elton Head Road, St
pattern, full albino AR Brown/red color variant MC1R Melanocortin receptor 1
 Table 1 The phenotypic traits of the domestic cat. Locus (alleles) MOI Phenotype Gene Gene Name Agouti (A +, a) 62 AR Banded fur to solid ASIP Agouti signaling protein Brown (B +, b, b l ) 63,64 AR Brown,
2 Rings All Breeds & Companion Exhibits Championship Cat Show Saturday 3 rd June 2017
 2 Rings All Breeds & Companion Exhibits Championship Cat Show Saturday 3 rd June 2017 Show is strictly limited to a maximum of 80 Exhibits CATS NSW Members will be given preference if entries are received
An Overview of Feline Diseases & Traits
 An Overview of Feline Diseases & Traits Genetic Pet Care The following details provide some general information (educational) on feline diseases symptoms and diagnosis. It is not intended to replace the
The Governing Council of the Cat Fancy of Ireland
 The Governing Council of the Cat Fancy of Ireland Schedule of the 24th SUPREME SHOW To be held at BALLINTEER COMMUNITY SCHOOL BROADFORD ROAD BALLINTEER DUBLIN 16. On Sunday 4 th May 2014. (Entries close
Beauties and the Beasts
 Show Hall Etiquette Ask the owner s permission before touching any cats. Because disease and illness can be passed on from cat to cat through human contact, the owners are protecting their cats by not
CAT BREEDS. Eva MERNIK
 CAT BREEDS Eva MERNIK American American USA Large Not very demanding, brush and comb several times a week Very independant, average temperament American Curl American Curl Long/ USA Demanding depending
You have 254 Neanderthal variants.
 1 of 5 1/3/2018 1:21 PM Joseph Roberts Neanderthal Ancestry Neanderthal Ancestry Neanderthals were ancient humans who interbred with modern humans before becoming extinct 40,000 years ago. This report
MERSEYSIDE CAT CLUB. SCHEDULE of the THIRTY-FIFTH ALL BREEDS CHAMPIONSHIP SHOW OPEN TO ALL. (Under Licence and Rules)
") MERSEYSIDE CAT CLUB SCHEDULE of the THIRTY-FIFTH ALL BREEDS CHAMPIONSHIP SHOW OPEN TO ALL (Under Licence and Rules) TO BE HELD ON SATURDAY 7th JUNE 2014 at the EPIC LEISURE CENTRE McGarva Way, Ellesmere
MERSEYSIDE CAT CLUB SCHEDULE of the THIRTY-FIFTH ALL BREEDS CHAMPIONSHIP SHOW OPEN TO ALL (Under Licence and Rules) TO BE HELD ON SATURDAY 7th JUNE 2014 at the EPIC LEISURE CENTRE McGarva Way, Ellesmere
3 Rings All Breeds & Companion
 3 Rings All Breeds & Companion Exhibits Championship Cat Show Saturday 16 th September 2017 Show is strictly limited to a maximum of 60 Exhibits CATS NSW Members will be given preference if entries are
Applications and efficiencies of the first cat 63K DNA array
 https://helda.helsinki.fi Applications and efficiencies of the first cat 63K DNA array Gandolfi, Barbara 2018-05-04 Gandolfi, B, Alhaddad, H, Abdi, M, Bach, L H, Creighton, E K, Davis, B W, Decker, J E,
The Governing Council of the Cat Fancy of Ireland
 The Governing Council of the Cat Fancy of Ireland Schedule of the annual SUPREME SHOW at BALLINTEER COMMUNITY SCHOOL BROADFORD RD BALLINTEER DUBLIN 16. On Sunday 22nd April 2018 (Entries close 23rd March
Feline infectious peritonitis (FIP) is a progressive. Prevalence of feline infectious peritonitis in specific cat breeds *
 is a progressive. Prevalence of feline infectious peritonitis in specific cat breeds *") Journal of Feline Medicine and Surgery (2006) 8, 1e5 doi:10.1016/j.jfms.2005.04.003 Prevalence of feline infectious peritonitis in specific cat breeds * Loretta D Pesteanu-Somogyi DVM 1y, Christina Radzai
Journal of Feline Medicine and Surgery (2006) 8, 1e5 doi:10.1016/j.jfms.2005.04.003 Prevalence of feline infectious peritonitis in specific cat breeds * Loretta D Pesteanu-Somogyi DVM 1y, Christina Radzai
Extent of Linkage Disequilibrium in the Domestic Cat, Felis silvestris catus, and Its Breeds
 Extent of Linkage Disequilibrium in the Domestic Cat, Felis silvestris catus, and Its Breeds Hasan Alhaddad 1, Razib Khan 1, Robert A. Grahn 1, Barbara Gandolfi 1, James C. Mullikin 2, Shelley A. Cole
Bi156 Lecture 1/13/12. Dog Genetics
 Bi156 Lecture 1/13/12 Dog Genetics The radiation of the family Canidae occurred about 100 million years ago. Dogs are most closely related to wolves, from which they diverged through domestication about
Biology 120 Lab Exam 2 Review
 Biology 120 Lab Exam 2 Review Student Learning Services and Biology 120 Peer Mentors Sunday, November 26 th, 2017 4:00 pm Arts 263 Important note: This review was written by your Biology Peer Mentors (not
SIBERIAN SUNSHINE. The new colour which came in from the cold? Eleonora Ruggiero Silvia Perego v.2017
 SIBERIAN SUNSHINE The new colour which came in from the cold? Eleonora Ruggiero Silvia Perego v.2017 First of all, please allow me to introduce myself. I'm breeding pedigree cats since 1987, at first
Breeding Icelandic Sheepdog article for ISIC 2012 Wilma Roem
 Breeding Icelandic Sheepdog article for ISIC 2012 Wilma Roem Icelandic Sheepdog breeders should have two high priority objectives: The survival of the breed and the health of the breed. In this article
WEMS CODE - as adapted for CASA, based on the original WCF JC WEMS code 2018
 WEMS CODE - as adapted for CASA, based on the original WCF JC WEMS code 2018 CHAMPIONCHIP STATUS ON WCF SHOWS For all breeds recognized by WCF For all breeds recognized by one WCC Member (International
The International Cat Association, Inc. Registration Rules. & Related Standing Rules
 The International Cat Association, Inc. Registration Rules & Related Standing Rules PREFACE to By-Laws, Registration Rules, Show Rules, Standing Rules, Uniform Color Descriptions and Standards The By-Laws
Evolution in dogs. Megan Elmore CS374 11/16/2010. (thanks to Dan Newburger for many slides' content)
") Evolution in dogs Megan Elmore CS374 11/16/2010 (thanks to Dan Newburger for many slides' content) Papers for today Vonholdt BM et al (2010). Genome-wide SNP and haplotype analyses reveal a rich history
Evolution in dogs Megan Elmore CS374 11/16/2010 (thanks to Dan Newburger for many slides' content) Papers for today Vonholdt BM et al (2010). Genome-wide SNP and haplotype analyses reveal a rich history
Cats United. Inaugural Show. 2 Ring under the Sea Championship Show. Fremantle Italian Club 65 Marine Terrace Fremantle.
 Cats United Inaugural Show 2 Ring under the Sea Championship Show Sunday 24 th February 2019 Fremantle Italian Club 65 Marine Terrace Fremantle Under the Sea Dress your cage up to win a prize Best Ragdoll
MERSEYSIDE CAT CLUB. SCHEDULE of the THIRTY-FIRST ALL BREEDS CHAMPIONSHIP SHOW OPEN TO ALL. (Under Licence and Rules) TO BE HELD ON
 TO BE HELD ON") MERSEYSIDE CAT CLUB SCHEDULE of the THIRTY-FIRST ALL BREEDS CHAMPIONSHIP SHOW OPEN TO ALL (Under Licence and Rules) TO BE HELD ON SATURDAY 5th JUNE 2010 at the EPIC LEISURE CENTRE McGarva Way, Ellesmere
MERSEYSIDE CAT CLUB SCHEDULE of the THIRTY-FIRST ALL BREEDS CHAMPIONSHIP SHOW OPEN TO ALL (Under Licence and Rules) TO BE HELD ON SATURDAY 5th JUNE 2010 at the EPIC LEISURE CENTRE McGarva Way, Ellesmere
A41 .6% HIGH Ellie 2 4 A l a s s k Embark
 OWNER S NAME: DOG S NAME: Ellie TEST DATE: May 2nd, 2017 This certifies the authenticity of Ellie s canine genetic background as determined following careful analysis of more than 200,000 genetic markers.
Welcome to the. Embark family! genetic markers. background as determined following. careful analysis of more than 200,000
 OWNER S NAME: James Johannes DOG S NAME: Avongara Kiri TEST DATE: December 22nd, 2017 This certifies the authenticity of Avongara Kiri s canine genetic background as determined following careful analysis
SCHEDULE of the CHAMPIONSHIP SHOW (Affiliated and held under GCCFI rules)
") SCHEDULE of the CHAMPIONSHIP SHOW (Affiliated and held under GCCFI rules) To be held at our *New Venue* at PRESENTATION SPORTS COMPLEX Cathedral Street Thurles Co. Tipperary on SUNDAY 11 TH FEBRUARY 2018
SCHEDULE of the CHAMPIONSHIP SHOW (Affiliated and held under GCCFI rules) To be held at our *New Venue* at PRESENTATION SPORTS COMPLEX Cathedral Street Thurles Co. Tipperary on SUNDAY 11 TH FEBRUARY 2018
WEMS-CODE. LONGHAIR BREEDS (Group 1) British Longhair
 British Longhair") WEMS-CODE LONGHAIR BREEDS (Group 1) British Longhair Bohemian Rex Deutsch Langhaar (German Longhair) Highland Fold (Scottish Fold Longhair) Highland Straight (Scottish Longhair Straight) Original Longhair
WEMS-CODE LONGHAIR BREEDS (Group 1) British Longhair Bohemian Rex Deutsch Langhaar (German Longhair) Highland Fold (Scottish Fold Longhair) Highland Straight (Scottish Longhair Straight) Original Longhair
GENETIC ANALYSIS REPORT
 GENETIC ANALYSIS REPORT OWNER S DETAILS Maria Daniels Bispberg 21 Säter 78390 SE ANIMAL S DETAILS Registered Name: Chelone Il Guardiano*IT Pet Name: Chelone Registration Number: SVEARK LO 343083 Breed:
Plus celebrity Ring judged by Alicia Coutts OAM Olympian
 INAUGURAL ALL BREEDS CHAMPIONSHIP CAT SHOW Inaugural 3 Ring All Breeds & Companion Exhibits Championship Cat Show Saturday 12 th August 2017 Harmonie German Club 49 Jerrabomberra Ave, Narrabundah ACT 2604
EU Market Situation for Eggs. Civil Dialogue Group. 17 February 2017
 EU Market Situation for Eggs Civil Dialogue Group 17 February 217 Thousand Tons F O R E C A S T 8 7 Experts EU production forecast on Eggs (Missing or incomplete data (BE-EL-LT-AT-SE) - No expert (BG-EE-LV-MT-SK)
FIFe Breeding & Registration Rules
 Fédération Internationale Féline - FIFe FIFe Breeding & Registration Rules Date of issue: 01.01.2017 FIFe 1/30 01.01.17 STATUS OF CHANGES For previous changes to the rules than those listed below, please
Entries close 19 th September 2016
 Schedule for the 63 RD SABCCI Championship Show (Held under GCCFI Rules) Held in conjunction with PET EXPO at Royal Dublin Society - R.D.S Simmonscourt Pavilion Hall 8E Simmonscourt Rd, Dublin Southside,
Feline Blood Groups & Blood Transfusion
 Feline Blood Groups & Blood Transfusion Supervisor: Dr. Neshat Compiler : Sina Taefehshokr Veterinary Medicine Faculty Islamic Azad University Tabriz Branch, Iran Blood Types (Overview) Only 1 blood groups
Basic color/pattern genetics. Heather R Roberts 3 November 2007
 Basic color/pattern genetics Heather R Roberts 3 November 2007 Today s Outline 1) Review of Mendelian Genetics 2) Review of Extensions 3) Mutation 4) Coloration and pattern Alleles Homozygous having the
International Journal of Veterinary Science
 Research Article P-ISSN: 2304-3075; E-ISSN: 2305-4360 International Journal of Veterinary Science Maternal Phylogeny of Anatolıan Cats www.ijvets.com; editor@ijvets.com Nüket Bilgen*, Mustafa Yenal Akkurt,
45 th All Breed Championship Show (Held under the GCCF Rules) Lockmeadow Market Barker Road, Maidstone, Kent ME16 8RG. Win a Bottle of Champagne
 Lockmeadow Market Barker Road, Maidstone, Kent ME16 8RG. Win a Bottle of Champagne") KENTISH CAT SOCIETY 45 th All Breed Championship Show (Held under the GCCF Rules) SATURDAY 15 TH OCTOBER 2016 Lockmeadow Market Barker Road, Maidstone, Kent ME16 8RG Sapphire Anniversary Classes Win a
KENTISH CAT SOCIETY 45 th All Breed Championship Show (Held under the GCCF Rules) SATURDAY 15 TH OCTOBER 2016 Lockmeadow Market Barker Road, Maidstone, Kent ME16 8RG Sapphire Anniversary Classes Win a
Sponsored by HAPPY CAT, Naturally Healthier SCHEDULE OF THE. (Held under License & Rules of the GCCF)
") Scotia Cat Fanciers Sponsored by HAPPY CAT, Naturally Healthier Miss S Davidson 31 St Clair Street Kirkcaldy Fife KY1 2NR Tel: 01592 593118 karakoramcat@blueyonder.co.uk SCHEDULE OF THE 9 th CHAMPIONSHIP
Scotia Cat Fanciers Sponsored by HAPPY CAT, Naturally Healthier Miss S Davidson 31 St Clair Street Kirkcaldy Fife KY1 2NR Tel: 01592 593118 karakoramcat@blueyonder.co.uk SCHEDULE OF THE 9 th CHAMPIONSHIP
WINN FELINE FOUNDATION For the Health and Well-being of All Cats
 2012 WINN FELINE FOUNDATION SYMPOSIUM TRANSCRIPT Dr. Leslie Lyons: Next Generation of Genetics Introduction Steve Dale: Hello, welcome, good afternoon. Welcome to the Winn Feline Foundation Symposium.
C2R BADAS BRUTUS GENETIC STATS TEST DETAILS. Registration: AKC HP DNA Test Report Test Date: December 13th, 2017 embk.
 GENETIC STATS Wolfiness: 0.6 % LOW Predicted adult weight: 26 lbs Genetic age: 24 human years TEST DETAILS Kit number: EM-6654949 Swab number: 31001709391499 MATERNAL LINE Through C2R Badas Brutus s mitochondrial
This information was gained from some research and a lot of personal experience. Lean and muscular bodies, large almondshaped
 The following information is designed to give you a general idea of the cat breeds on this list- please do further research on the breed you choose. Remember, each cat is an individual, and all breeds
Indigo Sapphire Bear. Newfoundland. Indigo Sapphire Bear. January. Dog's name: DR. NEALE FRETWELL. R&D Director
 Indigo Sapphire Bear Dog's name: Indigo Sapphire Bear This certifies the authenticity of Indigo Sapphire Bear's canine genetic background as determined following careful analysis of more than 300 genetic
32 ND CHAMPIONSHIP SHOW Open to all including Household Pet Section (Held under Governing Council of the Cat Fancy Rules)
") NORTH WEST CAT CLUB SCHEDULE OF THE 32 ND CHAMPIONSHIP SHOW Open to all including Household Pet Section (Held under Governing Council of the Cat Fancy Rules) To be held at LEIGH SPORTS VILLAGE LEIGH, LANCS;
NORTH WEST CAT CLUB SCHEDULE OF THE 32 ND CHAMPIONSHIP SHOW Open to all including Household Pet Section (Held under Governing Council of the Cat Fancy Rules) To be held at LEIGH SPORTS VILLAGE LEIGH, LANCS;
BioSci 110, Fall 08 Exam 2
 1. is the cell division process that results in the production of a. mitosis; 2 gametes b. meiosis; 2 gametes c. meiosis; 2 somatic (body) cells d. mitosis; 4 somatic (body) cells e. *meiosis; 4 gametes
THE TABBY CAT CLUB. (Held under Licence and Rules of the GCCF) (Including Household Pet Section) to be held at
 (Including Household Pet Section) to be held at") THE TABBY CAT CLUB 24 th CHAMPIONSHIP SHOW (Held under Licence and Rules of the GCCF) (Including Household Pet Section) to be held at Sports Connexion Leisure Club & Venue Leamington Road, Coventry, Ryton-on-Dunsmore
THE TABBY CAT CLUB 24 th CHAMPIONSHIP SHOW (Held under Licence and Rules of the GCCF) (Including Household Pet Section) to be held at Sports Connexion Leisure Club & Venue Leamington Road, Coventry, Ryton-on-Dunsmore
Cat - Module 1: Animal Characteristics
 Version 1 Crampton Consulting Group 2016 Page 1 of 11 Notices WARNING This material has been reproduced and communicated to you by, or on behalf of, Animal Industries Resource Centre and Crampton Consulting
EVOLUTIONARY GENETICS (Genome 453) Midterm Exam Name KEY
 Midterm Exam Name KEY") PLEASE: Put your name on every page and SHOW YOUR WORK. Also, lots of space is provided, but you do not have to fill it all! Note that the details of these problems are fictional, for exam purposes only.
PLEASE: Put your name on every page and SHOW YOUR WORK. Also, lots of space is provided, but you do not have to fill it all! Note that the details of these problems are fictional, for exam purposes only.
Manx Breeding, Registration policy and Standard of Points - suggested amendments Karen Kempsell - 16 th February 2013
 Manx Breeding, Registration policy and Standard of Points - suggested amendments Karen Kempsell - 16 th February 2013 Health Screening of Manx Cats Subsequent to consultation with members of the veterinary
CLADISTICS Student Packet SUMMARY Phylogeny Phylogenetic trees/cladograms
 CLADISTICS Student Packet SUMMARY PHYLOGENETIC TREES AND CLADOGRAMS ARE MODELS OF EVOLUTIONARY HISTORY THAT CAN BE TESTED Phylogeny is the history of descent of organisms from their common ancestor. Phylogenetic
Genes What are they good for? STUDENT HANDOUT. Module 4
 Genes What are they good for? Module 4 Genetics for Kids: Module 4 Genes What are they good for? Part I: Introduction Genes are sequences of DNA that contain instructions that determine the physical traits
Was the Spotted Horse an Imaginary Creature? g.org/sciencenow/2011/11/was-the-spotted-horse-an-imagina.html
 Was the Spotted Horse an Imaginary Creature? http://news.sciencema g.org/sciencenow/2011/11/was-the-spotted-horse-an-imagina.html 1 Genotypes of predomestic horses match phenotypes painted in Paleolithic
BASENJI. Welcome to the Embark family!
 OWNER S NAME: James Johannes DOG S NAME: Bengi Mobengi TEST DATE: September 19th, 2018 This certifies the authenticity of Bengi s canine genetic background as determined following careful analysis of more
Recent advances in cat genetics
 Review Recent advances in cat genetics L.A. Lyons* Address: Department of Population Health and Reproduction, School of Veterinary Medicine, University of California, Davis, One Shields Avenue, Davis,
2013 Holiday Lectures on Science Medicine in the Genomic Era
 INTRODUCTION Figure 1. Tasha. Scientists sequenced the first canine genome using DNA from a boxer named Tasha. Meet Tasha, a boxer dog (Figure 1). In 2005, scientists obtained the first complete dog genome
Studying Gene Frequencies in a Population of Domestic Cats
 Studying Gene Frequencies in a Population of Domestic Cats Linda K. Ellis Department of Biology Monmouth University Edison Hall, 400 Cedar Avenue, W. Long Branch, NJ 07764 USA lellis@monmouth.edu Description:
LOGAN METRO SPORTS CENTRE, 367 BROWNS PLAINS ROAD, BRISBANE
 LOGAN METRO SPORTS CENTRE, 367 BROWNS PLAINS ROAD, BRISBANE Open to members of registering bodies recognised by CCCA, as well as members of ANCATS where their exhibits have verifiable pedigrees Proudly
Asio otus. Report under the Article 12 of the Birds Directive Period Annex I International action plan. No No
 Period 2008-2012 European Environment Agency European Topic Centre on Biological Diversity Annex I International action plan No No Northern -eared Owl,, is a species of nocturnal bird of prey found in
SACC REGISTRATION RULES
 SACC REGISTRATION RULES RULES APPLICABLE TO APPLICATIONS TO REGISTER ONE CAT, ONE KITTEN, OR ONE LITTER OF KITTENS (SACR D1) SECTION A: CATS/KITTENS NOT PREVIOUSLY REGISTERED 1. Any person making an application
Edinburgh & East of Scotland Cat Club
 Edinburgh & East of Scotland Cat Club Schedule of the 58 th All Breed Championship Show Held under GCCF Licence and Rules At Leith Academy 20 Academy Park, Edinburgh EH6 8JQ On Saturday 18 th July 2015
Lecture 11 Wednesday, September 19, 2012
 Lecture 11 Wednesday, September 19, 2012 Phylogenetic tree (phylogeny) Darwin and classification: In the Origin, Darwin said that descent from a common ancestral species could explain why the Linnaean
EMS-CODE WCF version 11/ CASA modified 2016
 EMS-CODE WCF version 11/2015 - CASA modified 2016 Longhair Breeds (Group 1) British Longhair Bohemian Rex** Deutsch Langhaar (German Longhair) Highland Fold (Scottish Fold Longhair) Highland Straight (Scottish
Carduelis chloris. Report under the Article 12 of the Birds Directive Period Annex I International action plan. No No
 Period 2008-2012 European Environment Agency European Topic Centre on Biological Diversity Annex I International action plan No No European Greenfinch,, is a species of passerine bird in the finch family
AMOXICILLIN AND CLAVULANIC ACID TABLETS Draft proposal for The International Pharmacopoeia (February 2018)
") February 2018 Draft for comment 1 2 3 4 5 6 7 8 9 10 11 12 13 14 15 16 17 18 19 20 21 22 23 24 25 26 27 28 29 30 31 32 33 34 35 36 37 38 39 40 41 42 43 44 45 AMOXICILLIN AND CLAVULANIC ACID TABLETS Draft
February 2018 Draft for comment 1 2 3 4 5 6 7 8 9 10 11 12 13 14 15 16 17 18 19 20 21 22 23 24 25 26 27 28 29 30 31 32 33 34 35 36 37 38 39 40 41 42 43 44 45 AMOXICILLIN AND CLAVULANIC ACID TABLETS Draft
Vet Integr Sci Veterinary Integrative Sciences. Genetic diversity and inbreeding situation of Korat and Siamese cats based on microsatellite markers
 Research article Veterinary Integrative Science 2018; 16(3): XX-XX. Vet Integr Sci ISSN; 2629-9968 (online) Website; www.vet.cmu.ac.th/cmvj Genetic diversity and inbreeding situation of Korat and Siamese
Total Members: 35 Ballots Received: 28 60% of Voting: 17
 The Cat Fanciers Association, Inc. 2009 BREED COUNCIL POLL 7 BALINESE Total Members: 35 Ballots Received: 28 60% of Voting: 17 1. PROPOSED: This is a revision of the proposal put forth last year to clarify
EMS-CODE WCF version 11/ CASA modified WCF GA modified 01/2017 (Working document ) LONGHAIR BREEDS (Group 1) British Longhair
 LONGHAIR BREEDS (Group 1) British Longhair") EMS-CODE WCF version 11/2015 - CASA modified 2016 - WCF GA modified 01/2017 (Working document 20170320) LONGHAIR BREEDS (Group 1) British Longhair BLH Bohemian Rex BRX** Deutsch Langhaar (German Longhair)
EMS-CODE WCF version 11/2015 - CASA modified 2016 - WCF GA modified 01/2017 (Working document 20170320) LONGHAIR BREEDS (Group 1) British Longhair BLH Bohemian Rex BRX** Deutsch Langhaar (German Longhair)
SCHEDULE of the KENTISH CAT SOCIETY 42 nd All Breed Championship Show (Held under the GCCF Rules)
") SCHEDULE of the KENTISH CAT SOCIETY 42 nd All Breed Championship Show (Held under the GCCF Rules) SATURDAY 19 TH OCTOBER 2013 Lockmeadow Market Barker Road, Maidstone, Kent ME16 8RG SHOW MANAGERS: Helen
SCHEDULE of the KENTISH CAT SOCIETY 42 nd All Breed Championship Show (Held under the GCCF Rules) SATURDAY 19 TH OCTOBER 2013 Lockmeadow Market Barker Road, Maidstone, Kent ME16 8RG SHOW MANAGERS: Helen
Biology 120 Lab Exam 2 Review
 Biology 120 Lab Exam 2 Review Student Learning Services and Biology 120 Peer Mentors Thursday, November 22, 2018 7:00 pm Main Rooms: Arts 263, 217, 202, 212 Important note: This review was written by your
SUNSHINE COLOUR IN SIBERIAN CATS
 SUNSHINE COLOUR IN SIBERIAN CATS I propose for recognize a new colour, named sunshine, in Siberian Cats. A brief history When I started to manage the Book of Origin of my club, AFeF, I noticed genetic
THE AUSTRALIAN CAT FEDERATION (INC.) BY-LAWS - PART 2 BREEDING AND REGISTRATION RULES
 BY-LAWS - PART 2 BREEDING AND REGISTRATION RULES") THE AUSTRALIAN CAT FEDERATION (INC.) BY-LAWS - PART 2 BREEDING AND REGISTRATION RULES Australian Cat Federation (Inc.) June 1997 and Revisions to 2017 All Rights Reserved Updated November 2017 Page 2 INDEX
THE AUSTRALIAN CAT FEDERATION (INC.) BY-LAWS - PART 2 BREEDING AND REGISTRATION RULES Australian Cat Federation (Inc.) June 1997 and Revisions to 2017 All Rights Reserved Updated November 2017 Page 2 INDEX
ABN Minutes. Coordinating Cat Council of Australia Inc. Meeting held at. Ciloms Airport Lodge 398 Melrose Drive, Tullamarine.
 AFFILIATED COUNCILS: Capital Cats Inc. Cat Control Council of Tasmania Inc Cat Owners Association of Western Australia Inc Council of Federated Cat Clubs Queensland Inc Feline Association of South Australia
THE AUSTRALIAN CAT FEDERATION (INC.) BY LAWS PART 2 BREEDING AND REGISTRATION RULES
 BY LAWS PART 2 BREEDING AND REGISTRATION RULES") THE AUSTRALIAN CAT FEDERATION (INC.) BY LAWS PART 2 BREEDING AND REGISTRATION RULES Australian Cat Federation (Inc.) June 1997 and Revisions to 2018 All Rights Reserved Updated December 2018 Page 2 INDEX
THE AUSTRALIAN CAT FEDERATION (INC.) BY LAWS PART 2 BREEDING AND REGISTRATION RULES Australian Cat Federation (Inc.) June 1997 and Revisions to 2018 All Rights Reserved Updated December 2018 Page 2 INDEX
The Chocolate and Lilac Colours in the Abyssinian and Somali Breeds
 The Chocolate and Lilac Colours in the Abyssinian and Somali Breeds I wanted this article 1 to be both a presentation and a reflection on what are the chocolate and lilac colours. These colours are considered
Results for: HABIBI 30 MARCH 2017
 Results for: 30 MARCH 2017 INSIDE THIS REPORT We have successfully processed the blood sample for Habibi and summarized our findings in this report. Inside, you will find information about your dog s specific
STEPHEN N. WHITE, PH.D.,
 June 2018 The goal of the American Sheep Industry Association and the U.S. sheep industry is to eradicate scrapie from our borders. In addition, it is ASI s objective to have the United States recognized
7.013 Spring 2005 Problem Set 2
 MIT Department of Biology 7.013: Introductory Biology - Spring 2005 Instructors: Professor Hazel Sive, Professor Tyler Jacks, Dr. Claudette Gardel NAME TA 7.013 Spring 2005 Problem Set 2 FRIDAY February
1 In 1958, scientists made a breakthrough in artificial reproductive cloning by successfully cloning a
 1 In 1958, scientists made a breakthrough in artificial reproductive cloning by successfully cloning a vertebrate species. The species cloned was the African clawed frog, Xenopus laevis. Fig. 1.1, on page
SCHEDULE Of the 51 ST CHAMPIONSHIP SHOW (held under licence and rules of the G.C.C.F.)
") SCHEDULE Of the 51 ST CHAMPIONSHIP SHOW (held under licence and rules of the G.C.C.F.) (All Breeds Including Household Pets) SATURDAY 29 TH AUGUST 2015 At THORNBURY LEISURE CENTRE Alveston Hill, Thornbury,
SCHEDULE Of the 51 ST CHAMPIONSHIP SHOW (held under licence and rules of the G.C.C.F.) (All Breeds Including Household Pets) SATURDAY 29 TH AUGUST 2015 At THORNBURY LEISURE CENTRE Alveston Hill, Thornbury,
Fringilla coelebs all others
 Period 2008-2012 European Environment Agency European Topic Centre on Biological Diversity Annex I International action plan No No Eurasian Chaffinch, Fringilla coelebs, is a species of passerine bird