Distance Sampling as a Technique to Monitor Pronghorn in Kansas
|
|
|
- Primrose Holmes
- 5 years ago
- Views:
Transcription

1 Fort Hays State University FHSU Scholars Repository Master's Theses Graduate School Spring 2014 Distance Sampling as a Technique to Monitor Pronghorn in Kansas Jared H. Oyster Fort Hays State University Follow this and additional works at: Part of the Biology Commons Recommended Citation Oyster, Jared H., "Distance Sampling as a Technique to Monitor Pronghorn in Kansas" (2014). Master's Theses This Thesis is brought to you for free and open access by the Graduate School at FHSU Scholars Repository. It has been accepted for inclusion in Master's Theses by an authorized administrator of FHSU Scholars Repository.
2 DISTANCE SAMPLING AS A TECHNIQUE TO MONITOR PRONGHORN IN KANSAS being A Thesis Presented to the Graduate Faculty of the Fort Hays State University in Partial Fulfillment of the Requirements for the Degree of Master of Science by Jared H. Oyster B.S., Brigham Young University Date Approved Major Professor Approved Chair, Graduate Council
3 This thesis for The Master of Science Degree By Jared H. Oyster has been approved Chair, Supervisory Committee Supervisory Committee Supervisory Committee Supervisory Committee Chair, Department of Biological Sciences i
4 PREFACE This thesis is written in the style of the Journal of Wildlife Management to which a portion of this thesis will be submitted for publication. My research protocol was approved by the Institutional Animal Care and Use Committee (FHSU ). ii
5 ABSTRACT Accurate and precise estimates of abundance are crucial for wildlife management. Wildlife agencies spend large amounts of time and money to obtain estimated abundance. The Kansas Department of Wildlife Parks and Tourism (KDWPT) has conducted strip transect (ST) counts biannually since 1963 to estimate pronghorn (Antilocapra americana) abundance in Kansas. However, the accuracy and reliability of results are questionable. Distance sampling (DS) is a method used to estimate abundance of a biological population. All perpendicular distances of objects to the transect line are recorded; however, there is no designated strip width and no assumption that all objects are detected. I conducted DS surveys and ST surveys biannually between the summer of 2012 and the winter of 2014 in western Kansas. The objectives of the study were to: (1) compare DS results to ST results from winter and summer, (2) compare DS results from winter and summer, (3) evaluate the time and cost needed to complete both methods, and (4) evaluate the feasibility of reducing to 1 DS survey per year. Results from the DS and ST methods in the winter provided similar estimated abundance. Timing of flights had a substantial effect on cluster size, fawn:doe ratios, and buck:doe ratios. Summer DS surveys yielded larger sample sizes and more precise estimates than winter DS surveys. Cluster size, side (of the plane pronghorn were detected), distance to road, and habitat were the most influential covariates on detection probability. Detection probability was higher in cropland than in rangeland. Because DS results indicated that pronghorn avoided within 200 to 300 m of roads, I suggest that the DS transect placement be changed to 1 of 3 options: (1) transects angled to roads, (2) randomly placed north-south iii
6 oriented transects, or (3) north-south oriented transects placed 800 m from roads. I suggest that the KDWPT conduct 1 DS flight per year, in the summer, during a small temporal window. Doing so would save the KDWPT time, money, and avoid risk from unnecessary flight time, while still providing reliable population estimates. iv
7 ACKNOWLEDGMENTS I thank my advisor, Dr. Elmer J. Finck, for his guidance, support, and advice. I thank committee members Dr. Rob Channell, Dr. William Stark, and Matt Peek for their valuable insights into my thesis. A special thanks goes to Matt Peek. Matt was integral in all portions of the project: development, funding, data collection, and refinement of methods. I am grateful to the Kansas Department of Wildlife Parks and Tourism for funding and equipment contributed to the project. I also thank the Fleharty family for financial assistance from the Fleharty Fellowship. I am grateful to Rich Guenzel for providing me with valuable insight about DS and pronghorn survey methodology. I thank Dr. Gary White for his valuable comments about study design. Thanks to Mike Houts for his GIS expertise. I appreciate the work of Kansas Department of Wildlife Parks and Tourism pilot Bob Ahrens and Kansas Highway Patrol pilots Wayne Dotts and Mark Schroeder. I thank observers Kurt Meier, Wes Sowards, Clint Thornton, and Jon Heistand. I thank my family, friends, and fellow graduate students for their constant support and encouragement. I appreciate Fort Hays State University for the opportunity to pursue a graduate degree. v
8 TABLE OF CONTENTS GRADUATE COMMITTEE APPROVAL... i PREFACE... ii ABSTRACT... iii ACKNOWLEDGMENTS...v TABLE OF CONTENTS... vi LIST OF TABLES... viii LIST OF FIGURES... ix LIST OF APPENDICES... xii INTRODUCTION...1 STUDY AREA...8 METHODS...10 ST Surveys...11 DS Surveys...12 Analysis...14 Conventional DS models...14 Multiple covariate models...15 Stratification of covariates...16 RESULTS...18 DS and ST method comparison...18 Extrapolation of DS data...19 Method cost comparison...19 vi
9 TABLE OF CONTENTS CONTINUED DS season comparison...20 Multiple covariate models...21 Stratification of covariates...23 DISCUSSION...26 DS and ST method comparison...26 Method cost comparison...29 DS season comparison...29 Multiple covariate models...30 Stratification of covariates...31 Transect placement...32 Option Option Option Management implications LITERATURE CITED...36 vii
10 LIST OF TABLES Table Page 1 Comparison of population estimates from the strip transect method and distance sampling method from summer surveys in western Kansas, Comparison of population estimates from the strip transect method and distance sampling method from winter surveys in western Kansas, Results from distance sampling surveys from summer and winter in western Kansas, Results from the distance to road covariate when stratified by 0 m, 400m and 800 m transects from western Kansas, viii
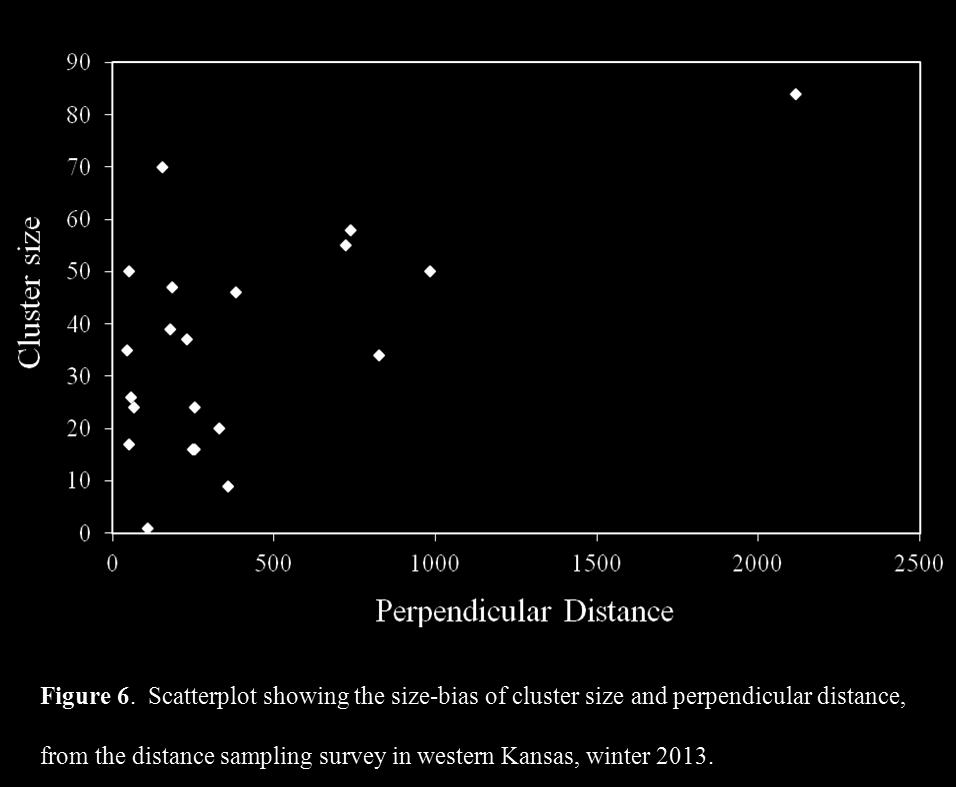
11 LIST OF FIGURES Figure Page 1 Mathematical rationale for distance sampling: (a) the expected distribution if all objects were detected; (b) the actual distribution of objects where the number of detections decline with increasing distance from the transect; and (c) the estimated portion of detected and undetected objects (Adapted from Buckland et al. 1993) Pronghorn management units in western Kansas Transects from the strip transect method in western Kansas Transects spaced 1.6 km (1 mile) apart from one another, in a north-south direction, for the strip transect method in Sherman, Wallace, and Gove county, Kansas, Distance sampling (DS) transects in western Kansas, Scatterplot showing the size-bias of cluster size and perpendicular distance, from the distance sampling survey in western Kansas, winter Detection function plot from all distance sampling surveys combined in western Kansas, Detection function plot from observers on the right side of the plane (pooled over cluster size) from the distance sampling survey in western Kansas, summer ix
12 9 Detection function plot of observers on the left side of plane (pooled over cluster size) from the distance sampling survey in western Kansas, summer Detection function plot of covariates cluster size and side (right), showing the declining detection probability of different cluster sizes from the distance sampling survey in western Kansas, summer Detection function plot of covariates cluster size and side (left), showing the declining detection probability of different cluster sizes from the distance survey in western Kansas, summer Detection function plot of covariate cluster size from the distance sampling survey in western Kansas, winter Detection function plot of the 0 m transect from the distance sampling survey in western Kansas, summer Detection function plot of the 400 m transect from the distance sampling survey in western Kansas, summer Detection function plot of the 800 m transect from the DS survey in western Kansas, summer Detection function plot of observers from the left side of the plane in rangeland habitat during the distance sampling survey in western Kansas, winter x
13 17 Detection function plot of observers from the right side of the plane in rangeland habitat during the distance sampling survey in western Kansas, winter Detection function plot of observers from the left side of the plane in cropland habitat during the distance sampling survey in western Kanas, winter Detection function plot of observers from the right side of the plane in cropland habitat during the distance sampling survey in western Kansas, winter Detection function plot of the 0 m transect from all distance sampling survey periods combined in western Kansas, Detection function plot of the 400 m transect from all distance sampling survey periods combined in western Kansas, Detection function plot of the 800 m transect from all distance sampling survey periods combined in western Kansas, Detection function plot of cropland observations from all distance sampling survey periods combined in western Kansas, Detection function plot of rangeland observations from all distance sampling survey periods combined in western Kansas, xi
14 LIST OF APPENDICES Appendix Page 1 Institutional Animal Care and Use Committee (IACUC) approval letter xii
15 INTRODUCTION Pronghorn (Antilocapra americana) are endemic to North America and were once widespread across western North America (Seton 1909). Nelson (1925) suggested that 30 to 40 million pronghorn occupied North America prior to European settlement. By the early 1920s, the estimated abundance of pronghorn had dwindled to 30,326 pronghorn (Nelson 1925). Some factors that contributed to the decline of pronghorn were: (1) conversion of land use to agriculture, (2) competition with domestic livestock, and (3) overharvesting of pronghorn (Allen 1962, McCabe et al. 2004, O Gara and Yoakum 2004). Conservation efforts have restored pronghorn to some former ranges and pronghorn numbers have increased to an estimated 1.1 million pronghorn in 2008 (O Gara and Yoakum 2004, Morton 2008). Pronghorn are an economically important species. Pronghorn hunting is highly regarded in many areas and contributes money to local and state economies (Loft 1976, Lewis et al. 1998). In 2003, the Wyoming Game and Fish Department estimated the value of a pronghorn in Wyoming to be $3,000. Hunters in North Dakota spent nearly $3,000,000 during the 1996 hunting season (Lewis et al. 1998). To restore pronghorn to former ranges in Kansas, the Kansas Department of Wildlife Parks and Tourism (KDWPT) began the Pronghorn Restoration Program in 1964 (Jensen 2001). Initially, landowners in western Kansas supported the Pronghorn Restoration Program. However, conflicts between landowners and pronghorn have become more frequent in recent years. Stakeholders have been skeptical of information about pronghorn provided by wildlife managers (Murphy and Noon 1991, Jensen 2001). 1
16 2 Additionally, demand for permits to hunt pronghorn in Kansas has steadily increased and nearly doubled over the last 20 years, from approximately 700 permits to over 1200 permits (Peek 2013). Accurate and precise estimates of abundance are crucial for pronghorn management. Many management decisions are based from population size. Obtaining estimates of population size can be expensive. For example, Montana spent $1,700,000 in 1998 to survey big-game populations (Rabe et al. 2002). Conducting appropriate surveys of big-game populations can be a challenge. Surveys require careful planning, preparation, training, proper equipment, personnel, implementation, evaluation, and refinement of methods (Martin 2009). Therefore, it is imperative that wildlife agencies use effective methods to survey wildlife populations. Throughout pronghorn range in North America, natural resource agencies have used many different methods to obtain estimated abundance of pronghorn populations, while some used multiple methods every year (Morton et. al 2008). These methods included helicopter, fixed-wing aircraft, and ground surveys. However, 10 out of the 18 natural resource agencies desired to improve survey methodology (Morton et al. 2008). The KDWPT has conducted strip transect (ST) counts biannually since 1963 via fixed-wing aircraft. STs are long narrow quadrats. The ST method has the strong assumption that surveyor(s) detect all objects within the strip width (i.e., a census of the total strip area; Buckland et al. 1993). Given the simplicity of the method, ST surveys can be a favorable method for estimating abundance. However, there are several
17 3 perceived limitations of ST surveys for estimating pronghorn abundance in Kansas. These include: 1. Accuracy and reliability of data are questionable. A potentially large proportion of pronghorn are not detected during flights (Firchow et al. 1990, Pojar et al. 1995) and are consequently not included in estimated abundance. 2. The area covered during ST surveys is small in comparison to the overall range of pronghorn in Kansas. 3. Two flights are conducted every year in the same locations to obtain both estimated abundance in winter and ratio estimates (buck:doe and fawn:doe) in the summer. Ratio estimates are obtained only in the summer because bucks, does and fawns are not easily distinguishable in the winter (O Gara and Yoakum 2004). Estimated abundance is more efficient to obtain in the winter because of larger cluster sizes (O Gara and Yoakum 2004). Flight time should be decreased if possible to reduce risk associated with flights, as well as reduce time and money spent. 4. No measures of precision or uncertainty are obtained with ST survey results (e.g., confidence intervals, coefficients of variation, standard error etc.). In the early 1930s, R.T. King recognized that during ST surveys not all ruffed grouse (Bonasa umbellus) within a designated strip width were observed. He devised a method that used an effective strip width to obtain estimated abundance. The effective strip width was the mean perpendicular distance of observed ruffed grouse from the transect line. He also recognized that the effective strip width varied with survey
18 4 conditions (R.T. King, University of Minnesota, unpublished data). Gates and Smith (1980) defined the current use of effective strip width (µ) as: the distance at which the number of undetected objects closer to the transect line than µ equals the number of detected objects at distances farther than µ. Distance sampling (DS) is a survey method that estimates density and abundance of a biological population. DS differs from ST surveys because there is no assumption that all objects are detected, except for a narrow strip near the transect line (Buckland et al. 1993). DS has no designated strip width, rather perpendicular distances from the transect line are recorded for all detected objects. It is assumed that the detection probability of objects will decline as distance from the transect line increases. The mathematical rationale for DS can be demonstrated by using data from Anderson and Pospahala (1970). Anderson and Pospahala (1970) recorded duck (Anas spp. and Aythya spp.) nests detected out to 8 feet (2.44m) in 1 foot (0.30m) distance intervals. If all nests were detected within the sample width, 8 feet (2.44m), you would assume a nearly uniform distribution of distances of nests from the transect line (Fig. 1a). However, Anderson and Pospahala (1970) demonstrated that some nests were undetected and that the number of undetected nests increased as distance from the transect line increased (Fig. 1b). The proportion of detected nests (Fig. 1c) was estimated by using a simple quadratic equation on the midpoints of each histogram class. The following equation was calculated from the data: frequency of duck nests = x 2
19 5 The calculated proportion of detected nests was and they observed a total of 534 total nests. To estimate the total number of duck nests in the survey area (including undetected nests) they divided the total observed nests (534) by the proportion of observed nests (0.888); 534/0.888 = 601 estimated nests. Given that the transects surveyed 5.5% of the refuge, the total estimate of duck nests on the refuge was: 601/0.055 = 10,927 nests. The Anderson-Pospahala method is no longer recommended because there are now superior survey methods (Buckland et al. 1993). However, it demonstrates the underlying rationale of the DS method. DS can be an effective method to estimate abundance of a population if several assumptions are met (Buckland et al. 1993): 1. Objects near the transect line are always detected (detection rate = 1). 2. Objects do not move before being detected (objects are detected at their original location). 3. Perpendicular distances of objects from the transect line are accurately measured. 4. Transects are placed randomly with respect to the distribution of objects. 5. Shape criterion; detection function should possess a shoulder (i.e., detection probability is nearly constant for some distance away from the transect line). Furthermore, a minimum sample size of 60 to 100 objects (Burnham et al. 1980; Whittaker et al. 2003) is suggested to obtain reliable estimates. However, clustered populations generally require a larger sample size (number of clusters detected), because variability in cluster size (i.e., group size) increases the uncertainty in the population
20 6 estimates. DS has several potential advantages when compared to ST surveys: 1. A potentially large proportion of pronghorn remain undetected during ST surveys. In Colorado, observers conducting ST surveys detected 55% of marked pronghorn in the winter and 63% of pronghorn in the summer (Firchow et al. 1990). DS incorporates the number of pronghorn that are detected and the estimated proportion not detected into the overall estimated abundance. 2. Using the DS method could reduce time, money, and risk associated with flying, because a ST survey is a census attempt in the area flown. 3. The area surveyed could be expanded into locations not previously flown with the ST method. 4. DS provides estimates of variance (i.e., standard error, confidence intervals, coefficient of variation) associated with population estimates. This provides a measure of confidence in population estimates that that are not available with ST surveys. 5. Analysis software, DISTANCE (DISTANCE 6.0, accessed 1 June 2012), provides increased flexibility for analyzing data. However, there are also limitations associated with DS. It requires careful planning and extensive quality control (Guenzel 1997). Those measures need to ensure that the above-mentioned assumptions are met. This might include: proper equipment,
21 7 training of personnel, correct timing of surveys, appropriate analysis, evaluation of all processes, and adjustments as needed (Guenzel 1997). Obtaining a sufficient sample size in areas with small populations, like pronghorn in Kansas (Morton et al. 2008), can also be a challenge (Guenzel 1997). An adequate sample size is needed in order to obtain reliable inferences. Additional survey effort might be needed to meet a minimum required sample size in areas with small populations. The objectives of my study were to: (1) compare the DS results to the ST results from both summer and winter; (2) compare DS and ST results from summer and winter; (3) evaluate the time and cost needed to complete both methods; and (4) evaluate the feasibility of reducing to 1 survey per year, if DS is a more effective and efficient method.
22 8 STUDY AREA The study areas (Fig. 2) were located in northwest Kansas in the pronghorn management unit 2 (Fig. 3). They were comprised of 2 main habitat types: rangeland and cropland. The center of the study area was predominately rangeland while the northern and southern portions were predominately cropland. The main crops grown in the study areas were winter wheat (Triticum aestivum), corn (Zea mays), soybeans (Glycine max) and sorghum (Sorghum spp.). Rangeland was comprised of both short-grass and mixedgrass prairies. More specifically, rangelands were comprised of northern gramabuffalograss prairie (Bouteloua-Buchloë) with western wheatgrass (Pascopyrum smithii) as a codominant species in the eastern portion, bluestem-grama prairie (Andropogon- Bouteloua), and chalkflat prairie (Andropogon-Bouteloua-Distichlis) (Küchler 1974). Compared to cropland, rangelands generally had more uneven terrain, were rockier, and contained more anthropogenic features (e.g., fence rows, water tanks, old farm equipment). The DS study area was comprised of 55% cropland and 45% rangeland. ST method area was comprised of 46% cropland and 54% rangeland. All other habitat types comprised < 1% of land area (State of Kansas GIS 2014). In my study area, 2012 was the third driest year on record with 24.4 centimeters of precipitation and was the fourth warmest year on record with a mean temperature of 12.7 C (National Weather Service 2014). In 2013, there was 42.5 centimeters of precipitation with a mean temperature of 10.7 C (National Weather Service 2014). Due to drought conditions and associated restrictions being loosened, much of Conservation Reserve Program (CRP) land was either mowed or grazed (J. H. Oyster, Fort Hays State
23 9 University, personal observation). Therefore, I included CRP with rangeland for analysis.
24 10 METHODS I conducted ST and DS surveys biannually during a 2-year period: summer 2012 through winter I conducted ST surveys on: July 2012; 4-5, 15 February 2013; July 2013; and January I conducted DS surveys on: August 2012; January 2013; July 2013; and 15-16, 22, 24 January I overlaid transects for both methods onto National Agriculture Imagery Program (NAIP) images and uploaded them into the program CyberTracker (CyberTracker Version 3.263, accessed 27 Apr 2011). I recorded all data into CyberTracker on a Trimble Juno SB GPS receiver (Trimble Navigation, Ltd., Sunnyvale, California). CyberTracker displayed an interactive image on the GPS receiver, where the real-time location of the plane was shown relative to the transect line and the surrounding landscape. This allowed the pilot to remain near the transect line at all times and allowed the recorder to plot locations of pronghorn clusters more accurately in relation to landmarks (i.e., fencerows, field boundaries, farm ponds etc.) and the real-time position of the plane. The interactive image displayed all locations of previously detected pronghorn clusters, which helped prevent double-counting. The image also displayed the prior flight path by plotting a location point every 5 seconds, in a different color than locations of pronghorn clusters. Flights were conducted in a fixed-wing aircraft, Cessna Skyhawk 172. The plane was flown at approximately 185 kilometers/hour at an above ground level between 120 to 150 m. A Cessna Stationair 206 was used to conduct ST surveys in the summer of 2012 and to finish a portion of the 2014 winter DS survey. This plane traveled at
25 11 approximately 240 kilometers/hour at the same above ground level. A team of 4 people conducted every survey. The pilot sat in the front left seat of the plane. He was primarily responsible for flight safety. He attempted to keep the plane on the transect line and scanned for pronghorn the remainder of the time. The recorder sat in the front right seat. He recorded all data, helped the pilot stay on the transect line, and scanned for pronghorn the remainder of the time. Two observers sat in the back seats and were responsible for scanning their respective side for pronghorn. For the ST and DS method in the summer, I counted the number of bucks, does, or fawns in each pronghorn cluster. Bucks, does, and fawns were not easily distinguishable in the winter (O Gara and Yoakum 2004), so I counted only a total pronghorn number for each cluster. All observers attempted to obtain a total count of pronghorn for each cluster, however; it was difficult to obtain an accurate pronghorn count when large clusters were aggregated tightly. I recorded the mean count (whole number) from all the observers if there was not a consensus count. I recorded a GPS location for each pronghorn cluster. The majority of pronghorn locations were recorded while flying over the cluster. I also recorded pronghorn locations remotely, without leaving the transect line, by plotting it on the interactive image on the GPS receiver. I did this if the pronghorn cluster was close to the plane and small enough to count accurately. ST Surveys I used ST surveys from the winter to obtain estimated abundance, but not buck:doe and fawn:doe ratios. Every winter I flew 39 transect lines (Fig. 3) directly over
26 12 section lines (spaced 1.6 km (1 mile) apart), which were usually roads, in a north-south direction. The transects totaled 2,102 kilometers and covered an area of 3,589 square kilometers. Observers searched for pronghorn in a strip width of 0.8 kilometers (0.5 miles). When an observer detected a pronghorn cluster, the pilot left the transect line, flew toward the cluster, and I recorded a total pronghorn count. ST surveys from the summer were used to estimate buck:doe and fawn:doe ratios, but not estimated abundance. ST surveys from the summer were flown only in the center region of the winter study area. I continued until a minimum of 300 total pronghorn were counted. This was done to limit flight time, while still obtaining reliable buck:doe and fawn:doe ratios. Every year, summer surveys were conducted between 15 July and 15 August to estimate fawn survival, because fawn mortality is low after the first 3 weeks of life (Gregg et al. 2001; Van Vuren et al. 2013). Buck:doe ratios obtained during this period provided estimates of the number of bucks in the population prior to hunting season. When a pronghorn cluster was detected, the pilot flew close enough so that observers could identify the number of bucks, does or fawns in the cluster. DS Surveys Each season I flew 28 transects (Fig. 4) in a north-south direction. Transects were placed approximately 4.8 kilometers (3 miles) apart. There were 3 sets of transects that I flew at different distances in relation to section lines, which were usually roads: (1) 0 m (over top of road), (2) 400 m (0.25 miles) from roads, and (3) 800 m (0.5 miles) from roads. Transects did not always remain at the designated distance to road when flying over rangelands, where roads were not always present or oriented consistent with
27 13 surrounding roads. The transects totaled 1723 kilometers each season and covered an area of 8247 square kilometers, except for the summer of Because of equipment malfunction, I discarded a western portion of the summer 2013 survey and used data from 1493 kilometers of transect and a total area of 7262 square kilometers. The equipment malfunction occurred while I was attempting to implement surveys that used angled transects that were angled to roads, oriented in a northwest to southeast direction. Consequently, all data from those transects were discarded and not used in analysis. All personnel were familiar with the main assumptions of DS. The pilot and the recorder, who could view out the front window, attempted to detect all pronghorn that were near the transect line. Back-seat observers also tried to scan near the transect line to avoid missing pronghorn near the transect line; however, it was more difficult for them to view pronghorn that passed under the plane. It was more critical that pronghorn locations were recorded accurately during DS surveys than ST surveys. When an observer detected a pronghorn cluster, he then helped the recorder locate the pronghorn cluster, to ensure that the location was plotted in the original location before pronghorn moved. Then, the recorder notified the pilot that a pronghorn cluster was detected. If needed, the pilot left the transect line so pronghorn could be counted. Eight additional variables were recorded for each pronghorn cluster: percent cloud cover, temperature, wind speed, side (of transect that the pronghorn cluster was detected), sun position, pronghorn behavior, and habitat. Although the method of collecting data for DS surveys and ST surveys was similar, the interpretation and analysis was quite different.
28 14 Analysis Conventional DS models. I calculated perpendicular distance of pronghorn cluster locations from the transect line, by using ArcGIS 9.3 and ArcGIS 10 (Environmental Systems Research Institute, Inc., Redlands, CA). I analyzed DS data in DISTANCE 6.0. All confidence intervals (CI) reported were at the 95% confidence level. Outliers (farthest observations from the transect line) provide little information about density and are difficult to model. Therefore, Buckland et al. (1993) recommend truncating 5 to 10% of the farthest observations before analysis. However, low sample sizes prevented me from applying the recommended truncation. I removed all observations beyond 950 m from the summer of 2012 (2 out of 65 observations), beyond 1500 m (1 out of 21 observations) from the winter 2013 survey, and I removed no observations during the summer 2013 or winter 2014 surveys. With each analysis, I used 1 of 3 key functions (expected distributions of observations): uniform, half-normal, or hazard-rate. The uniform distribution has no estimated parameters, whereas half-normal has 1 parameter that is estimated from distance data, and hazard-rate has 2 parameters that are estimated. A series expansion (cosine, simple polynomial, or hermite polynomial) was used, if needed, to adjust each distribution to fit the model to the distance data. A series expansion might add 1 or 2 parameters to improve model fit. The key functions + series expansions that were compared with each analysis were: (1) half-normal + cosine, (2) half-normal + hermite polynomial, (3) uniform + cosine, (4) uniform + simple polynomial, and (5) hazard-rate + cosine (Buckland et al. 1993). The key function + series expansion with the lowest
29 15 Akaike information criterion (AIC) value was selected for each set of analyses and used to estimate abundance and density. Occasionally, cluster size and distance from the transect line were correlated (i.e., size bias). If they were correlated, the larger clusters were usually easier to detect than smaller clusters farther from the transect line, i.e., positively correlated (Buckland et al. 1993). There was little evidence of a size bias during the summer of 2012, summer of 2013, or winter of Therefore, I used mean cluster size to estimate abundance and density during those seasons. There was a size bias during the winter of 2013 (Fig. 5); therefore, I used a size-biased regression (cluster size against estimated distance) to estimate expected cluster size. Final model selection considered AIC, Chi-square goodness of fit test probability, and coefficient of variation (CV) of abundance. AIC was used to select the key function + series expansion that was best-supported by the data. Chi-square goodness of fit test assesses the model fit to the distance data. However, it has limited use because of lower power, but should be considered nonetheless (Buckland et al. 1993). After the key function + series expansion was selected using AIC values, I placed the most emphasis on CV of abundance when selecting the top model. I selected the model with the lowest CV of abundance as the top model every season. Multiple covariate models. I ran multiple covariate models every season to identify the variables that had the greatest effect on detection probability. The covariates that I included in those models were: distance to road (0m, 400 m, and 800 m), percent cloud cover, sun position (favorable, unfavorable or neutral), side (right or left side of
30 16 plane), habitat (rangeland or cropland), and cluster size. I did not include wind speed and temperature as covariates because they probably did not have a significant effect on detection probability. Pronghorn behavior was also not included because the variable was separated into 4 categories, resulting in sample sizes too small to model. Analysis of multiple covariate models was similar to conventional DS models. DISTANCE selected from the same sets of key function + series expansion that were examined with conventional distance sampling models. The cluster size analysis that was used each season for conventional DS models also was used for all multiple covariate models during that season. However, cluster size was also analyzed as a covariate. I used forward step-wise selection to construct models. First, I ran each of the 6 covariates as a model by itself. I ranked these models by AIC value. The 2 covariates that had the lowest AIC value were included together in the next model. If the AIC value of the model with the 2 top covariates was not lower than the top covariate, then the top covariate was considered the top model. However, if the model with the 2 top covariates had a lower AIC value than the top covariate, then the covariate with the next lowest AIC value was added to the top model until the AIC value did not continue to lower. Stratification of Covariates. I further investigated 2 of the top covariates, by combining data from all survey periods and then analyzed the covariate by strata (e.g., habitat was stratified as rangeland and cropland). Distance to road and habitat were the covariates that I analyzed with all survey periods combined. Although side was one of the top covariates included in top models, I did not analyze it with all survey periods combined because observers changed throughout the study. Similarly, I did not analyze
31 17 cluster size with stratification because there were no set strata within the cluster size variable.
32 18 RESULTS DS and ST method comparison During the summer of 2012, I calculated a fawn:doe ratio of 14:100 and a buck:doe ratio of 51:100 with the ST method (Table 1). The mean cluster size was 3.98 pronghorn. With the DS method, I calculated a fawn:doe ratio of 23:100 and a buck:doe ratio of 37:100. The mean cluster size was 6.23 pronghorn. During the summer of 2013, I calculated a fawn:doe ratio of 42:100 and a buck:doe ratio of 24:100 with the ST method. The mean cluster size was 5.03 pronghorn. With the DS method, I calculated a fawn:doe ratio of 45:100 and a buck:doe ratio of 20:100. The mean cluster size was 5.69 pronghorn. During the winter of 2013, I counted 1,127 pronghorn with the ST method and calculated a density of 0.31 pronghorn per square kilometer (Table 2). I detected 93 pronghorn clusters, ranging from 1 to 47 pronghorn per cluster, with a mean cluster size of 12.1 pronghorn. When the results of the ST method were extrapolated to the study area of DS surveys, I obtained an estimated abundance of 2,590 pronghorn. From the DS data, I calculated an estimated abundance of 2,409 pronghorn and an estimated density of 0.29 pronghorn per square kilometer. I detected 21 pronghorn clusters, ranging from 1 to 84 pronghorn per cluster, with a mean cluster size of 36.1 pronghorn (SE = 4.5, CI = 27-46). With the size-bias regression, I obtained an expected cluster size of 28.1 pronghorn. During the winter of 2014, I counted 1,103 pronghorn with the ST method, and calculated a density of 0.31 pronghorn per square kilometer. I detected 47 pronghorn clusters, ranging from 1 to 83 pronghorn per cluster, with a mean cluster size of 23.5
33 19 pronghorn. When the results of the ST method were extrapolated to the study area of DS surveys, I obtained an estimated abundance of 2,534 pronghorn. From the DS data, I calculated an estimated abundance of 2,241 pronghorn and an estimated density of 0.27 pronghorn per square kilometer. I detected 50 pronghorn clusters, ranging from 1 to 101 pronghorn per cluster, with a mean cluster size of 23.6 pronghorn. Extrapolation of DS data. When I combined DS data from all survey periods and extrapolated the estimated abundance within the ST study area to the overall DS study area, the estimated abundance was 2,817 pronghorn. I obtained an estimated density of 0.34 pronghorn per square kilometer (SE = 0.06, CV = 0.18, CI = ) within the ST study area and an estimated density of 0.32 pronghorn per square kilometer (SE = 0.05, CV = 0.17, CI = ) outside the ST area. Method cost comparison ST surveys took approximately 12.2 hours to complete in the winter and 6.2 hours in the summer. ST surveys were completed with 2,102 transect kilometers in the winter and approximately 888 transect kilometers in the summer. The DS surveys took 12.4 hours to complete in the summer and 11.0 hours to complete during the winter. DS surveys were completed with 1,723 transect kilometers. One hour of flight time costs approximately $150 and when not flying (e.g., breaks), a pilot costs $40 per hour. The cost of flight time and 2 hour breaks between flights would be approximately $3,000 for the ST method (winter and summer) and $2,020 for 1 DS survey in the summer.
34 20 DS season comparison The DS survey in the summer of 2012 produced an estimated abundance of 1,827 pronghorn (Table 3) and an estimated density of 0.22 pronghorn per square kilometer. I detected 65 clusters, for a total of 405 detected pronghorn, ranging from 1 to 17 pronghorn per cluster and a mean cluster size of 6.2 pronghorn. The effective strip width was m. The summer 2013 DS survey produced an estimated abundance of 1,814 pronghorn and an estimated density of 0.25 pronghorn per square kilometer. I detected 67 clusters, for a total 381 detected pronghorn, ranging from 1 to 19 pronghorn per cluster and a mean cluster size of 5.6 pronghorn. The effective strip width was m. The DS survey from the winter of 2013 produced an estimated abundance of 2,409 pronghorn and an estimated density of 0.29 pronghorn per square kilometer. I detected 21 clusters, for a total of 758 detected pronghorn and a mean cluster size of 36.1 pronghorn (SE = 4.5, CI = 27-46). The estimated cluster size after the size-bias regression was 28.1 pronghorn. The effective strip width was m. The DS survey from the winter of 2014 produced an estimated abundance of 2,241 pronghorn and an estimated density of 0.27 pronghorn per square kilometer. I detected 50 clusters with a mean cluster size of 23.6 pronghorn, totaling 1,179 detected pronghorn. The effective strip width was 1,266.2 m. I combined data from all DS survey periods (Fig. 6) and obtained an estimated abundance of 2,355 pronghorn (SE = 317.6, CV = 0.13, CI = ), a density estimate of 0.29 pronghorn per square kilometer (SE = 0.04, CV = 0.13, CI =
35 ), an mean cluster size of 12.4 pronghorn (SE = 1.1, CV = 0.09, CI = ), and an effective strip width of m (SE = 32.6, CV = 0.05, CI = ). Multiple Covariate Models The top model for each survey period included a different set of covariates. Covariates in top models included: side twice, cluster size twice, distance to road once, and habitat once. Side was the top covariate during 2 survey periods. None of the other tested covariates were included in top models. The top model from the summer 2012 survey included the covariates side and cluster size, with side being the top covariate. Observers on the right side of the plane (Fig. 7) seemingly missed pronghorn up to 200 to 300 m from the transect. Observers on the left side of the plane (Fig. 8) detected pronghorn close to the transect line, but did not detect pronghorn at distances as far as observers on the right side of the plane did. Detection probability was greater for larger pronghorn clusters than for smaller clusters for observers on the right side (Fig. 9) and left side (Fig. 10) of the plane. The estimated abundance was 1,805 pronghorn (SE= 315.1, CV = 0.19, CI = ), with a density estimate of 0.22 pronghorn per square kilometer (SE = 0.04, CV = 0.19, CI = ), a mean cluster size of 6.2 pronghorn (SE = 0.5, CV = 0.07, CI = ), and an effective strip width of m (SE = 50.3, CV = 0.11, CI = ). The top model from the winter 2013 survey included the covariate cluster size. Detection probability was greater for larger pronghorn clusters than for smaller ones (Fig. 11). The estimated abundance was 2,811 pronghorn (SE = 861.2, CV = 0.30, CI = ), with a density of 0.34 pronghorn per square kilometer (SE = 0.10, CV = 0.30, CI =
36 ), an expected cluster size of 27.3 pronghorn (SE = 4.9, CV = 0.17, CI = ), and an effective strip width of m (SE = 96.4, CV = 0.22, CI = ). The top model for the summer 2013 survey included the covariate distance to road. The detection function plot of the 0 m transect indicated evidence of pronghorn avoiding areas within 200 to 300 m of roads (Fig. 12). The 400 m transect also had a detection probability lower than 1 within 150 m of the transect (Fig. 13). The detection function plot from the 800 m transect indicates a fairly uniform distribution out to 600 m from the transect (Fig. 14). The estimated abundance was 1,826 pronghorn (SE = 309.3, CV = 0.17, CI = ), with an estimated density of 0.25 pronghorn per square kilometer (SE = 0.04, CV = 0.17, CI = ), and an effective strip width of m (SE = 44.1, CV = 0.09, CI = ). The top model for the winter 2014 survey included side and habitat, with side being the top covariate. The detection function plots (Figs. 15 and 16) suggested that observers on both sides of the plane missed pronghorn near the transect line in the rangeland habitat. However, detection function plots from cropland habitat (Figs. 17 and 18) from both sides resembled a half-normal distribution. The model produced an estimated abundance of 2,259 pronghorn (SE = 569.6, CV = 0.25, CI = ), an estimated density of 0.27 pronghorn per square kilometer (SE = 0.07, CV = 0.25, CI = ), a mean cluster size of 23.2 pronghorn (SE = 4.2, CV = 0.18, CI = ), and an effective strip width of 1,237.8 m (SE = 152.5, CV = 0.12, CI = ).
37 23 Stratification of Covariates When I combined distance to road data from all 4 survey periods, the detection function plots from the 3 distance to road transects displayed different distributions, produced different population estimates (Table 4), and estimates of variance. The detection function plot of the 0 m transects (Fig. 19) indicated evidence of pronghorn avoiding areas within 200 to 300 m of roads. The 0 m transects data were best-fit to the hazard-rate key function and used 2 estimated parameters. The model produced an estimated abundance of 2,161 pronghorn, an estimated density of 0.27 pronghorn per square kilometer, a mean cluster size of 11.0 pronghorn, and an effective strip width of m. The detection function plot of the 400 m transects (Fig. 20) indicated evidence of pronghorn avoiding between 200 to 700 m from the transect line (i.e., within 200 to 300 m of the road). The detection probability increases again between 700 and 900 m from the transect line. The 400 m transects were best-fit to the half-normal key function with a cosine series adjustment, for a total of 2 estimated parameters. The model produced an estimated abundance of 4,081 pronghorn, an estimated density of 0.51 pronghorn per square kilometer, a mean cluster size of 15.3 pronghorn, and an effective strip width of m. The detection function plot of the 800 m transects indicated high detection probability at distances out to 600 m from the transect line and a decline at distances farther than 600 m (Fig. 21). The data was best-fit to a uniform distribution with a cosine series adjustment for a total of 1 estimated parameter. The model produced an estimated
38 24 abundance of 1,870 pronghorn, an estimated density of 0.23 pronghorn per square kilometer, a mean cluster size of 10.4 pronghorn, and an estimated strip width of m. When combined across all survey periods, detection probability was higher at distances farther from the transect line in cropland (Fig. 22) than it was in rangeland (Fig. 23). Cropland also yielded higher population estimates than rangeland did. I detected 142 pronghorn clusters in croplands. From the cropland observations, I calculated an estimated abundance of 1,656 pronghorn (SE = 256.9, CV = 0.16, CI = ), an estimated density of 0.21 pronghorn per square kilometer (SE = 0.03, CV = 0.16, CI = ), a mean cluster size of 13.5 pronghorn (SE = 1.4, CV = 0.10, CI = ), and an effective strip width of m (SE = 39.7, CV = 0.06, CI = ). I detected 61 pronghorn clusters in rangelands. From the rangeland observations, I calculated an estimated abundance of 744 pronghorn (SE = 188.8, CV = 0.25, CI = ), an estimated density of 0.09 pronghorn per square kilometer (SE = 0.02, CV = 0.25, CI = ), a mean cluster size of 11.1 pronghorn (SE = 1.8, CV = 0.17, CI = ), and an effective strip width of m (SE = 47.3, CV = 0.09, CI = ).
39 25 DISCUSSION DS and ST method comparison The lower cluster sizes obtained from the ST method compared to the DS method during the summer of 2012 was probably due to a difference in the timing of surveys and not the methods. The increase in mean cluster size between July 2012 (ST method) and August 2012 (DS method) might be due to fawns joining their mothers in larger nursery clusters (White et al. 2012). Cluster size also increases between July and September as males begin to actively defend harems (groups of females) in preparation for the breeding season (White et al. 2012). The percentage of clusters that were harem clusters (1 male with 1 or more female) increased from 25% to 60% between July and August and there were more buck-only clusters in July (40%) than in August (29%). All of those factors combined probably resulted in the lowered detectability of bucks and increased detectability of fawns in August compared to July. Consequently this might have caused the decline in buck:doe ratio and the increase in fawn:doe ratio. The same pattern was observed when I compared the ST method and DS method from the summer of Cluster size increased, buck:doe ratio decreased, and the fawn:doe ratio increased. However, the magnitude of change was less dramatic due to the closer timing between the 2 survey periods in the summer of A similar pattern (i.e., increasing or constant fawn: doe ratio and decreasing buck:doe ratio) of ST results was observed by firchow et al. (1990) between June estimates and August estimates. The ST survey and DS survey conducted during the winter of 2013 produced similar estimates of abundance. However, the number of clusters detected during the DS
40 26 survey was much lower, while the mean cluster size was 3 times larger. Similar to the summer method comparison, the difference in results probably was due to timing of surveys and not the methods themselves. There was a long temporal gap between the 2 methods. The larger clusters during the DS survey probably was due to a snowstorm (White et al. 2012) that preceded the DS flights, as well as colder temperatures during the DS survey ( x = 7.8 C) compared to the ST survey ( x = 4.4 C). The ST method and DS method from the winter of 2014 yielded similar mean cluster sizes and number of clusters detected. DS and ST surveys from the winter of 2014 were completed within a relatively short time frame and environmental conditions were more similar ( x = 4.1 C and x = 1.7 C, respectively), probably causing the results to be similar. The estimated abundance of the ST method might be overestimated when extrapolated to the DS area, given that the DS data suggests that pronghorn density is higher in the ST area than outside the ST area. When the estimated abundances from both methods were extrapolated from the ST study area, the estimated abundance of the DS method was higher. During ST surveys, we probably detected a higher percentage of pronghorn than Firchow et al. (1990) did (63%). Pronghorn were probably easier to detect in my study area compared to the study area of Firchow et al. (1990) in southeast Colorado for 2 potential reasons: (1) my study area is flatter and likely did not contain as many trees and shrubs, and (2) they flew at a lower above ground level of 30 to 39 meters, which might have caused them to miss more pronghorn at distances farther from the transect line.
41 27 Given the large effect that timing of surveys seemingly had on results, I suggest that future surveys be restricted to a small temporal window. Consequently, results from different years would be more comparable to one another. Regarding the timing of summer surveys, a July survey would probably provide a larger sample size and more precise estimates because of the smaller cluster sizes than are typical in August. A survey in August however, would probably yield a lower buck:doe ratio and a higher fawn:doe ratio. I suggest that DS is a superior method to ST surveys for estimating the pronghorn population in Kansas for the following reasons: 1. DS results include the estimated number of undetected pronghorn with the detected portion of pronghorn, whereas the ST method only totals the number of detected pronghorn. 2. Area covered by DS can be expanded from the ST study area while spending less survey effort (flight time) to accomplish the survey. This would provide more information about the pronghorn population as a whole. 3. Estimates of variance are obtained with population estimates from DS, while they are not with ST surveys. The KDWPT can present those results to stakeholders interested in the pronghorn population. 4. DS data can be analyzed by using multiple covariate models. The top models from these analyses help to identify potential violations of assumptions, provide information about pronghorn biology, and to realize ways in which surveys can
42 28 continue to be improved. ST surveys provide little additional information beyond estimated abundance. 5. DS allows for greater flexibility when analyzing data. For example, if there is a size bias that makes using the mean cluster size inappropriate, there are 4 options to use a size-bias regression to estimate cluster size. There are also several ways to use a bootstrap method to estimate expected cluster size. Method cost comparison Using only 1 DS flight per year, in the summer, instead of the traditional 2 ST surveys would save 6 hours of flight time. This would save the KDWPT approximately $980 (6 hours of flight time + 2 hour break between flights). This does not include the additional cost of travel and lodging that might also be incurred by the KDWPT with extra flights. DS season comparison When comparing DS surveys from winter and summer, I obtained larger sample sizes during the summer because pronghorn were dispersed into smaller clusters. Consequently, population estimates from summer surveys were more precise. Durant et al. (2011), reported that coefficient of variation (CV) impacted the ability to detect changes in estimated abundance of a population. A CV of estimated abundance < 0.2 had a much higher probability of detecting small changes in estimated abundance than a CV of estimated abundance 0.2. Both summer surveys yielded CVs of < 0.2. The 2013 winter survey did not produce a CV of < 0.2, while the 2014 winter survey did.
43 29 Higher survey effort in the center of the DS study area and lower effort in the periphery of the study area (Buckland et al. 1993) could be used to increase sample size and consequently improve precision. This type of survey would be analyzed by strata (high density and low density) and a global estimate (all strata combined) would also be calculated. Estimates of density and encounter rate (pronghorn clusters/km) were slightly higher in the center of the study area. Therefore, higher survey effort in this area could increase sample size. The winter DS surveys yielded higher population estimates than summer surveys although there was overlap in confidence intervals for all 4 DS surveys. Higher population estimates from winter DS surveys was probably due to larger cluster sizes which increased detection probabilities. Thus, we were able detect pronghorn clusters at distances farther from the transect line because they were easier to detect than small clusters. Vegetation in was either absent or shorter in the winter than in the summer, making pronghorn easier to detect. The effective strip width during the DS survey in the winter of 2014 was over twice the distance of all other surveys. This might be due to higher detection probability during winter surveys and observer experience. All other survey periods included at least 1 observer that was surveying pronghorn for the first time. All observers participating in the DS survey in the winter of 2014 had previous experience. This previous experience might have improved their abilities to detect pronghorn, especially at distances farther from the transect line. I suggest that DS surveys are more appropriate to conduct in the summer than the winter for the following reasons:
44 30 1. Smaller cluster sizes in the summer make it easier to meet the minimum suggested sample size. 2. Smaller cluster size range and larger sample sizes in the summer improved the precision of population estimates. 3. Overall estimated abundance can be obtained, while also obtaining buck:doe and fawn:doe ratios that were not obtained from winter surveys. 4. Considering the above 3 reasons, the KDPWT can reduce to 1 survey a year instead of the traditional 2 surveys per year. Multiple Covariate Models The covariates side, cluster size, distance to road, and habitat affected detection probability the most. Other covariates had little effect on detection probability, were difficult to collect accurately, or were difficult to model. There was evidence from multiple seasons, of observers missing pronghorn near the transect line. This is a violation of the most critical DS assumption (Buckland et al. 1993) and can make modeling of data difficult and influence accuracy of estimates. Observer bias could be ameliorated by standardized training of all observers. If observers lean close to the plane window instead of sitting upright in the seat, then more area below the plane becomes visible to the observer. Observers commonly scan distances farther from the plane and might miss pronghorn closer to the transect line. I suggest that an observer covariate replace the side covariate. Instead of each pronghorn detection being associated with a side of the plane, it would be associated with a specific observer. This would allow for recognition and accountability of bias associated with individual
45 31 observers instead of groups of observers. The position of each observer in the plane (pilot, recorder, back left, or back right) would be recorded before the survey begins. Cluster size was a covariate in the top model for 50% of the survey periods. This bias can be reduced in 2 ways: (1) by using a size-bias regression instead of mean cluster size to obtain estimated abundance, (2) by liberal truncation of the farthest observations. Truncation of 5 to 10% of the farthest observations is suggested. Removing the farthest observations usually reduces the effect of the largest clusters, probably increasing accuracy of estimates (Buckland et al. 1993), and (3) manually stratify and analyze by cluster size, if there is a sufficient sample size. Each stratum should have a sample size of at least 20 clusters. For example, summer data could be stratified into 3 strata (1-3 pronghorn; 4-7 pronghorn; and 8+ pronghorn) and analyzed (Buckland et al. 1993). Stratification of Covariates When data were combined from all survey periods, there was evidence that pronghorn were avoiding areas within 200 to 300 m of roads. Gavin and Komers (2006) found that pronghorn exhibit increased vigilance within 300 m of roads, suggesting that pronghorn view roads as a potential risk. This is consistent with my results that suggest pronghorn avoid roads. Pronghorn avoidance of roads affects the detection function plots, population estimates, and estimates of variance of each distance to road transect. The 0 m transect violated the assumption of a detection rate of 1 near the transect line. Pronghorn avoided between 200 to 700 m from the 400 m transects (i.e., avoided areas within 200 to 300 m of roads), resulting in a higher-than-expected detection probability (i.e., heaping) near the transect line. This distribution of observations violated
46 32 the shape criterion and no model in DISTANCE could accurately estimate density in this case (Buckland et al. 1993). Buckland et al. (1993) also stated that heaping near the transect line can result in serious overestimation of density. Consequently, the estimated abundance of the 400 m transects was approximately double that of 0m and 800m transects. To obtain reliable estimates, the detection function should have a shoulder. If detection probability drops sharply near the transect line, estimates tend to be poor (Buckland et al. 1993). Pronghorn likely avoided areas between 600 to 1000 m from 800 m transects. The 800 m transects produced a detection function with a shoulder. Consequently, the 800 m transects produced the most precise population estimates. Throughout the study, rangelands probably supported fewer pronghorn than normal because of drought conditions. Vegetation in rangelands appeared desiccated and unpalatable, while vegetation in fertilized and recently-disturbed croplands was probably more palatable and nutritious (Vitousek et al. 1989). Detecting pronghorn in rangelands also was more of a challenge because of uneven terrain, fence lines, livestock, yucca plants (Yucca glauca), and other objects that were not common in croplands. Transect placement Aside from the equipment malfunction (GPS receiver did not record location points of the flight path) mentioned previously, I discontinued surveys with angled transects for the following reasons: (1) difficulty staying on the transect line, (2) loss of observer effort from the pilot and recorder because of time spent navigating to the transect line, and (3) difficulty accurately plotting pronghorn locations. Flying at an angle to roads made it more difficult to plot pronghorn clusters in relation to the transect
47 33 line because it was difficult to use roads or property lines as a reference to the location of the transect line. KDWPT is faced with the choice of changing the transect locations every year or surveying the same transects every year. Surveys with transects in the same location every year will improve the ability of the KDWPT to compare population estimates from different years with more confidence because of increased consistency between years. However, because the majority of the study area would not be surveyed, results might consistently overestimate or underestimate population estimates. Conversely, surveying transects placed in different locations every year could produce results that better represent the true population (Buckland et al. 1993). I suggest 3 possible options for transect placement of future flights: Option 1. Fly all transects at an angle to roads. This transect placement would be the least biased regarding the distribution of pronghorn. To be effective, this would require the KDWPT to invest in equipment that would allow the pilot to easily remain on the transect line (i.e,. auto pilot). This would allow the pilot and the recorder to have more observation effort instead of focusing on staying on the transect line. However, as previously mentioned, this transect placement introduces some challenge in accurately plotting pronghorn locations perpendicular to the transect line. Option 2. Fly randomly-placed north-south transects. This transect placement would be less biased than the current transect placement. This placement probably would produce similar population estimates and estimates of variance as the current transect placement. Combining data from all transects at random distances from roads is similar
48 34 to combining the current 0 m, 400 m, and 800 m transects. This transect placement would provide the KDWPT with a representative sample of pronghorn observations in relation to their distribution to roads. This placement would meet the DS assumption of transects being placed randomly with respect to the distribution of objects. However, transects should not run parallel to physical (e.g., roads, fence lines) or biological features (e.g., ridges, rivers) because they would likely yield unrepresentative samples (Buckland et al. 1993, Guthery 1988). This option introduces the risk of violating the shape criterion assumption similar to the 0 m and 400 m transects. Violating this assumption could decrease the precision of estimates or could overestimate abundance similar to the 400 m transect (Buckland et al. 1993). Conversely, combining data from random transects might result in an appropriate detection function because bias across all transects would balance out; similar to combining the detection functions of the 0 m and 400 m transects would balance out to meet the shape criterion. This option would introduce challenges similar to those faced from surveys with angled transects, namely, difficulty staying on the transect line (because the pilot would not always fly over roads or section lines) and loss of observer effort from pilot and recorder. Option 3. Fly only 800 m transects. The 800 m transects produced an appropriate detection function and produced the most precise population estimates. This option probably would be the simplest to effectuate compared to the other options. Consistent transect placement probably would produce the most precise estimates (Buckland et al. 1993). However, this option would violate the assumption of random
49 35 placement of transects with respect to the distribution of objects. This option would also be placed parallel to roads, which would likely yield unrepresentative samples. Pronghorn avoidance occurred approximately 600 to 1000 m from the 800 m transect. The effective strip width was below 600 m for 3 out of the 4 DS surveys. Pronghorn avoidance beyond 600 m should not have a significant effect on model fit near the transect line, where it is most critical (Buckland et al. 1993). Nevertheless, the bias from roads would still be present. Management implications I suggest that the KDWPT change from the current transect placement and implement 1 of the 3 aforementioned options. All observers involved should be properly instructed on the theory, application and assumptions of DS before participating in surveys. I recommend that the KDWPT fly 1 DS flight per year, in the summer, during a small temporal window. By reducing to 1 flight per year, the KDWPT can save time, money, and diminish risk associated with unnecessary flight time.
50 36 LITERATURE CITED Allen, D. L Our wildlife legacy. Funk & Wagnalls, New York, New York, USA. Anderson, D. R., and R. S. Pospahala Correction of bias in belt transects of immotile objects. Journal of Wildlife Management 34: Buckland, S. T., D. R. Anderson, K. P. Burnham, and J. L. Laake Distance sampling: estimating abundance of biological populations. Chapman and Hall, New York, New York, USA. Burnham, K. P., D. R. Anderson, and J. L. Laake Estimation of density from line transect sampling of biological populations. Wildlife Monograph Number 72. Data Access and Support Center Kansas Land Cover Patterns, Level IV Accessed 17 September Durant, S. M., M. E. Craft, R. Hilborn, R. Bahsir, R. Hando, and J. L. Thomas Long-term trends in carnivore abundance using distance sampling in Serengeti National Park, Tanzania. Journal of Applied Ecology 48: Firchow, K. M., M. R. Vaughan, and W. R. Mytton Comparison of aerial survey techniques for pronghorns. Wildlife Society Bulletin 18: Gates, C. E., and P. W. Smith An implementation of Burnham-Anderson distribution free method of estimating wildlife densities from line transect data. Biometrics 36: Gavin, S. D., and P. E. Komers Do pronghorn (Antilocapra americana) perceive roads as a predation risk? Canadian Journal of Zoology 84:
51 37 Gregg, M. A., M. Bray, K. M. Kilbride, and M. R. Dunbar Birth synchrony and survival of pronghorn fawn. Journal of Wildlife Management 65: Guenzel, R. J Estimating pronghorn abundance using aerial line transect sampling. Wyoming Game and Fish Department, Cheyenne, Wyoming, USA. Guthery, F. S Line transect sampling of bobwhite density on rangeland: evaluation and recommendations. Wildlife Society Bulletin 16: Jensen, J Landowner attitudes toward pronghorn in western Kansas. Thesis, Emporia State University, Emporia, Kansas, USA. Küchler, A. W A new vegetation map of Kansas. Ecology 55: Lewis, T. D., J. A. Leitch, A. J. Meyer Characteristics, expenditures, and economic impact of resident and nonresident hunters and anglers in North Dakota, , season and trends. Agricultural Economics Report 389, Fargo, North Dakota, USA. Loft, E. R Economic contribution of deer, pronghorn antelope, and sage grouse hunting to northeastern California and implications to the overall value of wildlife. California Wildlife Conservation Bulletin 11, Sacramento, California, USA. Martin, C. O Mammalian survey techniques for Level II natural resource inventories on Corps of Engineers projects. EMMRP Technical Notes Collection (ERDC TN-EMRRP-SI-34), U.S. Army Engineer Research and Development Center, Vicksburg, Mississippi, USA.
52 38 McCabe, R. E., B. W. O Gara, H. M. Reeves Prairie ghost: pronghorn and human interaction in early America. University Press of Colorado, Boulder, Colorado, USA. Morton, K., P. F. Jones, and J. Taggart Province and state report on pronghorn antelope. Proceedings of the Biennial Pronghorn Antelope Workshop 23: Murphy, D. D., and B. D. Noon Coping with uncertainty in wildlife biology. Journal of Wildlife Management 55: National Weather Service Goodland, KS. Accessed 10 January Nelson, E. W Status of the pronghorned antelope, U.S. Department of Agriculture Bulletin, Washington, D.C., USA. O Gara, B. W., and J. D. Yoakum Pronghorn ecology and management. Wildlife Management Institute, Washington, D.C., USA. Peek, M Summary of pronghorn harvest activities in Kansas through Kansas Department of Wildlife, Parks, and Tourism, Emporia, Kansas, USA. Pojar, T. M., D. C. Bowden, and R. B. Gill Aerial counting experiments to estimate pronghorn density and herd structure. Journal of Wildlife Management 59: Rabe, M. J., S. S. Rosenstock, and J. C. devos, Jr Review of big-game survey methods used by the wildlife agencies of the western United States. Wildlife Society Bulletin 30:46-52.
53 39 Seton, E. T Life-histories of northern animals, an account of the mammals of Manitoba. Charles Schribner s Sons, New York, New York, USA. Van Vuren, D. H., M. P. Bray, and J. M. Heltzel Differential investment in twin offspring by female pronghorns (Antilocapra americana). Journal of Mammalogy 94: Vitousek, P. M., P. A. Matson, and K. Van Cleve Nitrogen availability and nitrification during succession: Primary, secondary, and old-field seres. Plant and Soil 115: White, P. J., C. N. Gower, T. L. Davis, J. W. Sheldon, and J. R. White Group dynamics of Yellowstone pronghorn. Journal of Mammalogy 93: Whittaker, D. G., W. A. Van Dyke, and S.T. Love Evaluation of aerial line transect for estimating pronghorn antelope abundance in low-density populations. Wildlife Society Bulletin 31:
54 Table 1. Comparison of population estimates from the strip transect method and distance sampling method from summer surveys in western Kansas, ST DS ST DS Fawn:doe ratio 14:100 23:100 42:100 45:100 Buck:doe ratio 51:100 37:100 24:100 20:100 Mean cluster size SE a LCL b UCL Clusters detected a lower confidence limit (2.5%) b upper confidence limit (97.5%)
55 Table 2. Comparison of population estimates from the strip transect method and distance sampling method from winter surveys in western Kansas, ST DS ST DS Estimated abundance 2,590 2,409 2,534 2,241 Density (/square kilometer ) Mean cluster size SE a LCL b UCL Range Clusters detected a lower confidence limit (2.5%) b upper confidence limit (97.5%)
56 42 Table 3. Results from distance sampling surveys from summer and winter in western Kansas, Summer Winter Summer Winter Estimated abundance 1,827 2,409 1,814 2,241 CV SE a LCL b UCL Density (/square kilometer) CV SE LCL UCL Mean cluster size CV SE LCL UCL Range Effective strip width (m) ,266.2 CV SE LCL UCL Clusters detected a lower confidence limit (2.5%) b upper confidence limit (97.5%)
57 43 Table 4. Results from the distance to road covariate when stratified by 0 m, 400m and 800 m transects from western Kansas, m 400 m 800 m Estimated abundance 2,161 4,081 1,870 CV SE a LCL b UCL Density (/square kilometer) CV SE LCL UCL Mean cluster size CV SE LCL UCL Effective strip width (m) CV SE LCL UCL Clusters detected a lower confidence limit (2.5%) b upper confidence limit (97.5%)
58 44 Figure 1. Mathematical rationale for distance sampling: (a) the expected distribution if all objects were detected; (b) the actual distribution of objects where the number of detections decline with increasing distance from the transect; and (c) the estimated portion of detected and undetected objects (Adapted from Buckland et al. 1993).
 surveys and strip")
59 45 Figure 2. Study areas of Distance sampling (DS) surveys and strip transect surveys (ST) in western Kansas,


60 Figure 3. Pronghorn management units in western Kansas. 46
 apart from one another, in a north-south direction, for the strip transect")
61 47 Figure 4. Transects spaced 1.6 km (1 mile) apart from one another, in a north-south direction, for the strip transect method in Sherman, Wallace, and Gove county, Kansas,
62 48 ffdfd DS transects Figure 5. Distance sampling (DS) transects in western Kansas,

63 49
64 50

65 51
66 52
67 53
68 54
69 55
70 56
71 57
72 58
73 59
74 60
75 61

76 62
Response to SERO sea turtle density analysis from 2007 aerial surveys of the eastern Gulf of Mexico: June 9, 2009
 Response to SERO sea turtle density analysis from 27 aerial surveys of the eastern Gulf of Mexico: June 9, 29 Lance P. Garrison Protected Species and Biodiversity Division Southeast Fisheries Science Center
Alberta Conservation Association 2009/10 Project Summary Report
 Alberta Conservation Association 2009/10 Project Summary Report Project Name: Habitat Selection by Pronghorn in Alberta Wildlife Program Manager: Doug Manzer Project Leader: Paul Jones Primary ACA staff
Kodiak National Wildlife Refuge 2004 Bald Eagle Nesting and Productivity Survey
 Kodiak National Wildlife Refuge 2004 Bald Eagle Nesting and Productivity Survey ANNUAL REPORT by Denny Zwiefelhofer Key Words: Bald Eagle Nesting Productivity Kodiak Island Kodiak National Wildlife Refuge
Dominance/Suppression Competitive Relationships in Loblolly Pine (Pinus taeda L.) Plantations
 Plantations") Dominance/Suppression Competitive Relationships in Loblolly Pine (Pinus taeda L.) Plantations by Michael E. Dyer Dissertation submitted to the Faculty of the Virginia Polytechnic Institute and Stand University
Dominance/Suppression Competitive Relationships in Loblolly Pine (Pinus taeda L.) Plantations by Michael E. Dyer Dissertation submitted to the Faculty of the Virginia Polytechnic Institute and Stand University
May Dear Blunt-nosed Leopard Lizard Surveyor,
 May 2004 Dear Blunt-nosed Leopard Lizard Surveyor, Attached is the revised survey methodology for the blunt-nosed leopard lizard (Gambelia sila). The protocol was developed by the San Joaquin Valley Southern
ESTIMATING NEST SUCCESS: WHEN MAYFIELD WINS DOUGLAS H. JOHNSON AND TERRY L. SHAFFER
 ESTIMATING NEST SUCCESS: WHEN MAYFIELD WINS DOUGLAS H. JOHNSON AND TERRY L. SHAFFER U.S. Fish and Wildlife Service, Northern Prairie Wildlife Research Center, Jamestown, North Dakota 58402 USA ABSTRACT.--The
Susitna-Watana Hydroelectric Project (FERC No ) Dall s Sheep Distribution and Abundance Study Plan Section Initial Study Report
 Dall s Sheep Distribution and Abundance Study Plan Section Initial Study Report") (FERC No. 14241) Dall s Sheep Distribution and Abundance Study Plan Section 10.7 Initial Study Report Prepared for Prepared by Alaska Department of Fish and Game and ABR, Inc. Environmental Research &
(FERC No. 14241) Dall s Sheep Distribution and Abundance Study Plan Section 10.7 Initial Study Report Prepared for Prepared by Alaska Department of Fish and Game and ABR, Inc. Environmental Research &
University of Canberra. This thesis is available in print format from the University of Canberra Library.
 University of Canberra This thesis is available in print format from the University of Canberra Library. If you are the author of this thesis and wish to have the whole thesis loaded here, please contact
Texas Quail Index. Result Demonstration Report 2016
 Texas Quail Index Result Demonstration Report 2016 Cooperators: Josh Kouns, County Extension Agent for Baylor County Amanda Gobeli, Extension Associate Dr. Dale Rollins, Statewide Coordinator Bill Whitley,
STAT170 Exam Preparation Workshop Semester
 Study Information STAT Exam Preparation Workshop Semester Our sample is a randomly selected group of American adults. They were measured on a number of physical characteristics (some measurements were
Texas Quail Index. Result Demonstration Report 2016
 Texas Quail Index Result Demonstration Report 2016 Cooperators: Jerry Coplen, County Extension Agent for Knox County Amanda Gobeli, Extension Associate Dr. Dale Rollins, Statewide Coordinator Circle Bar
A final programmatic report to: SAVE THE TIGER FUND. Scent Dog Monitoring of Amur Tigers-V ( ) March 1, March 1, 2006
 March 1, March 1, 2006") 1 A final programmatic report to: SAVE THE TIGER FUND Scent Dog Monitoring of Amur Tigers-V (2005-0013-017) March 1, 2005 - March 1, 2006 Linda Kerley and Galina Salkina PROJECT SUMMARY We used scent-matching
1 A final programmatic report to: SAVE THE TIGER FUND Scent Dog Monitoring of Amur Tigers-V (2005-0013-017) March 1, 2005 - March 1, 2006 Linda Kerley and Galina Salkina PROJECT SUMMARY We used scent-matching
Naturalised Goose 2000
 Naturalised Goose 2000 Title Naturalised Goose 2000 Description and Summary of Results The Canada Goose Branta canadensis was first introduced into Britain to the waterfowl collection of Charles II in
PROGRESS REPORT for COOPERATIVE BOBCAT RESEARCH PROJECT. Period Covered: 1 April 30 June Prepared by
 PROGRESS REPORT for COOPERATIVE BOBCAT RESEARCH PROJECT Period Covered: 1 April 30 June 2014 Prepared by John A. Litvaitis, Tyler Mahard, Rory Carroll, and Marian K. Litvaitis Department of Natural Resources
Adjustment Factors in NSIP 1
 Adjustment Factors in NSIP 1 David Notter and Daniel Brown Summary Multiplicative adjustment factors for effects of type of birth and rearing on weaning and postweaning lamb weights were systematically
Comparative Evaluation of Online and Paper & Pencil Forms for the Iowa Assessments ITP Research Series
 Comparative Evaluation of Online and Paper & Pencil Forms for the Iowa Assessments ITP Research Series Catherine J. Welch Stephen B. Dunbar Heather Rickels Keyu Chen ITP Research Series 2014.2 A Comparative
Wayne E. Melquist Idaho Cooperative Wildlife Research Unit University of Idaho Moscow, Idaho 83843
 THE USE OF A ROTOR-WINGED AIRCRAFT IN CONDUCTING NEST1NG SURVEYS OF OSPREYS IN NORTHERN 1DAHO by W. Dean Carrier Panhandle National Forests U.S. Forest Service P.O. Box 310 Coeur d'alene, Idaho 83814 and
Gambel s Quail Callipepla gambelii
 Photo by Amy Leist Habitat Use Profile Habitats Used in Nevada Mesquite-Acacia Mojave Lowland Riparian Springs Agriculture Key Habitat Parameters Plant Composition Mesquite, acacia, salt cedar, willow,
COOPERATIVE EXTENSION Bringing the University to You
 COOPERATIVE EXTENSION Bringing the University to You Special Publication 04-11 Analysis of Studies Used to Develop Herbaceous Height and Cover Guidelines for Sage Grouse Nesting Habitat Brad Schultz, Extension
ADVANCED TECHNIQUES FOR MODELING AVIAN NEST SURVIVAL
 Ecology, 83(12), 2002, pp. 3476 3488 2002 by the Ecological Society of America ADVANCED TECHNIQUES FOR MODELING AVIAN NEST SURVIVAL STEPHEN J. DINSMORE, 1,3 GARY C. WHITE, 1 AND FRITZ L. KNOPF 2 1 Department
RELATIONSHIPS AMONG WEIGHTS AND CALVING PERFORMANCE OF HEIFERS IN A HERD OF UNSELECTED CATTLE
 RELATIONSHIPS AMONG WEIGHTS AND CALVING PERFORMANCE OF HEIFERS IN A HERD OF UNSELECTED CATTLE T. C. NELSEN, R. E. SHORT, J. J. URICK and W. L. REYNOLDS1, USA SUMMARY Two important traits of a productive
2012 Quail Season Outlook By Doug Schoeling, Upland Game Biologist Oklahoma Department of Wildlife Conservation
 2012 Quail Season Outlook By Doug Schoeling, Upland Game Biologist Oklahoma Department of Wildlife Conservation The Oklahoma Department of Wildlife Conservation has conducted annual roadside surveys in
Principal Investigator. Project Duration. Award Amount. Staff Contact. Keywords. Project Summary. Project Description. 78 Livestock Hale/Hall
 78 Livestock Hale/Hall Principal Investigator Cindy Hale and Jeff Hall Clover Valley Farms 6534 Homestead Rd. Duluth, MN 55804 218-525-0094 cmhale@d.umn.edu St. Louis County Project Duration 2010 to 2012
Research Summary: Evaluation of Northern Bobwhite and Scaled Quail in Western Oklahoma
 P-1054 Research Summary: Evaluation of Northern Bobwhite and Scaled Quail in Western Oklahoma Oklahoma Agricultural Experiment Station Division of Agricultural Sciences and Natural Resources Oklahoma State
Wolf Recovery in Yellowstone: Park Visitor Attitudes, Expenditures, and Economic Impacts
 Wolf Recovery in Yellowstone: Park Visitor Attitudes, Expenditures, and Economic Impacts John W. Duffield, Chris J. Neher, and David A. Patterson Introduction IN 1995, THE U.S. FISH AND WILDLIFE SERVICE
GREATER SAGE-GROUSE BROOD-REARING HABITAT MANIPULATION IN MOUNTAIN BIG SAGEBRUSH, USE OF TREATMENTS, AND REPRODUCTIVE ECOLOGY ON PARKER MOUNTAIN, UTAH
 GREATER SAGE-GROUSE BROOD-REARING HABITAT MANIPULATION IN MOUNTAIN BIG SAGEBRUSH, USE OF TREATMENTS, AND REPRODUCTIVE ECOLOGY ON PARKER MOUNTAIN, UTAH Abstract We used an experimental design to treat greater
2013 AVMA Veterinary Workforce Summit. Workforce Research Plan Details
 2013 AVMA Veterinary Workforce Summit Workforce Research Plan Details If the American Veterinary Medical Association (AVMA) says the profession is experiencing a 12.5 percent excess capacity in veterinary
Result Demonstration Report
 Result Demonstration Report Texas Quail Index Texas A&M AgriLife Extension Service Garza County Cooperator: Chimney Creek Ranch; Danny Robertson, Mgr Greg Jones, County Extension Agent-Ag for Garza County
EVALUATION OF A METHOD FOR ESTIMATING THE LAYING RATE OF BROWN-HEADED COWBIRDS
 EVALUATION OF A METHOD FOR ESTIMATING THE LAYING RATE OF BROWN-HEADED COWBIRDS D. M. SCOTT AND C. DAVISON ANKNEY Department of Zoology, University of Western Ontario, London, Ontario, Canada N6A 5B7 AnSTI
Result Demonstration Report
 Result Demonstration Report 2014 Texas Quail Index Texas A&M AgriLife Extension Service Archer County Cooperator: Brad Mitchell- Mitchell and Parkey Ranches Justin B Gilliam, County Extension Agent for
Temperature Gradient in the Egg-Laying Activities of the Queen Bee
 The Ohio State University Knowledge Bank kb.osu.edu Ohio Journal of Science (Ohio Academy of Science) Ohio Journal of Science: Volume 30, Issue 6 (November, 1930) 1930-11 Temperature Gradient in the Egg-Laying
FALL 2015 BLACK-FOOTED FERRET SURVEY LOGAN COUNTY, KANSAS DAN MULHERN; U.S. FISH AND WILDLIFE SERVICE
 INTRODUCTION FALL 2015 BLACK-FOOTED FERRET SURVEY LOGAN COUNTY, KANSAS DAN MULHERN; U.S. FISH AND WILDLIFE SERVICE As part of ongoing efforts to monitor the status of reintroduced endangered black-footed
Removal of Alaskan Bald Eagles for Translocation to Other States Michael J. Jacobson U.S Fish and Wildlife Service, Juneau, AK
 Removal of Alaskan Bald Eagles for Translocation to Other States Michael J. Jacobson U.S Fish and Wildlife Service, Juneau, AK Bald Eagles (Haliaeetus leucocephalus) were first captured and relocated from
Animal Speeds Grades 7 12
 Directions: Answer the following questions using the information provided. Show your work. If additional space is needed, please attach a separate piece of paper and correctly identify the problem it correlates
Wild Turkey Annual Report September 2017
 Wild Turkey 2016-2017 Annual Report September 2017 Wild turkeys are an important game bird in Maryland, providing recreation and enjoyment for many hunters, wildlife enthusiasts and citizens. Turkey hunting
April Boll Iowa State University. Leo L. Timms Iowa State University. Recommended Citation
 AS 652 ASL R2102 2006 Use of the California Mastitis Test and an On-Farm Culture System for Strategic Identification and Treatment of Fresh Cow Subclinical Intramammary Infections and Treatment of Clinical
Using GPS to Analyze Behavior of Domestic Sheep. Prepared and presented by Bryson Webber Idaho State University, GIS Center
 Using GPS to Analyze Behavior of Domestic Sheep Prepared and presented by Bryson Webber Idaho State University, GIS Center 1 Importance of Study Predators use domestic livestock as a food source Predation
Population Study of Canada Geese of Jackson Hole
 National Park Service Research Center Annual Report Volume 4 4th Annual Report, 1980 Article 15 1-1-1980 Population Study of Canada Geese of Jackson Hole Gary Radke David Krementz Kenneth L. Diem Follow
Result Demonstration Report
 Result Demonstration Report 2014 Texas Quail Index Texas A&M AgriLife Extension Service Kent County Cooperator: Reserve Ranch Jay Kingston, County Extension Agent for Kent County Becky Ruzicka, Extension
AN EVALUATION OF THE USDA AND MURPHEY CUTABILITY PREDICTION EQUATIONS AMONG SEVERAL CATTLE BREED TYPES
 AN EVALUATION OF THE USDA AND MURPHEY CUTABILITY PREDICTION EQUATIONS AMONG SEVERAL CATTLE BREED TYPES D.S. Hale~ D.S. Buchanan~ L.E. Walters\ J.W. Oljen~ and R.R. Frahml Story in Brief The accuracy of
Applying PZP Vaccines in the Field:
 Applying PZP Vaccines in the Field: An overview of considerations, methods & tools Kali Pereira Senior Wildlife Field Manager The Humane Society of the United States May 2, 2018 Field Application Options
Bird-X Goose Chase / Bird Shield Testing Information For Use On: 1. Apples 2. Cherries 3. Grapes 4. Blueberries 5. Corn 6. Sunflowers 7.
 Bird-X Goose Chase / Bird Shield Testing Information For Use On: 1. Apples 2. Cherries 3. Grapes 4. Blueberries 5. Corn 6. Sunflowers 7. Water 8. Structures 9. Rice 10. Turf & Ornamentals 1. Apples Field
Answers to Questions about Smarter Balanced 2017 Test Results. March 27, 2018
 Answers to Questions about Smarter Balanced Test Results March 27, 2018 Smarter Balanced Assessment Consortium, 2018 Table of Contents Table of Contents...1 Background...2 Jurisdictions included in Studies...2
Nest Site Characteristics and Factors Affecting Nest Success of Greater Sage-grouse
 The Open Ornithology Journal, 2009, 2, 1-6 1 Open Access Nest Site Characteristics and Factors Affecting Nest Success of Greater Sage-grouse James L. Rebholz 1, W. Douglas Robinson 1, * and Michael D.
LONG RANGE PERFORMANCE REPORT. Study Objectives: 1. To determine annually an index of statewide turkey populations and production success in Georgia.
 State: Georgia Grant Number: 8-1 Study Number: 6 LONG RANGE PERFORMANCE REPORT Grant Title: State Funded Wildlife Survey Period Covered: July 1, 2005 - June 30, 2006 Study Title: Wild Turkey Production
Proceedings, The Applied Reproductive Strategies in Beef Cattle Workshop, September 5-6, 2002, Manhattan, Kansas
 Proceedings, The Applied Reproductive Strategies in Beef Cattle Workshop, September 5-6, 2002, Manhattan, Kansas HEIFER DEVELOPMENT AND REODUCTIVE TRACT SCORING FOR A SUCCESSFUL HEIFER OGRAM:THE SHOW-ME-SELECT
EFFECTS OF SEASON AND RESTRICTED FEEDING DURING REARING AND LAYING ON PRODUCTIVE AND REPRODUCTIVE PERFORMANCE OF KOEKOEK CHICKENS IN LESOTHO
 EFFECTS OF SEASON AND RESTRICTED FEEDING DURING REARING AND LAYING ON PRODUCTIVE AND REPRODUCTIVE PERFORMANCE OF KOEKOEK CHICKENS IN LESOTHO By SETSUMI MOTŠOENE MOLAPO MSc (Animal Science) NUL Thesis submitted
TECHNICAL BULLETIN Claude Toudic Broiler Specialist June 2006
 Evaluating uniformity in broilers factors affecting variation During a technical visit to a broiler farm the topic of uniformity is generally assessed visually and subjectively, as to do the job properly
UK HOUSE MARTIN SURVEY 2015
 UK HOUSE MARTIN SURVEY 2015 FULL INSTRUCTIONS A one-page summary of these instructions is available from www.bto.org/house-martin-resources SECTION 1: INTRODUCTION & GETTING STARTED The House Martin (Delichon
Ames, IA Ames, IA (515)
") BENEFITS OF A CONSERVATION BUFFER-BASED CONSERVATION MANAGEMENT SYSTEM FOR NORTHERN BOBWHITE AND GRASSLAND SONGBIRDS IN AN INTENSIVE PRODUCTION AGRICULTURAL LANDSCAPE IN THE LOWER MISSISSIPPI ALLUVIAL
BENEFITS OF A CONSERVATION BUFFER-BASED CONSERVATION MANAGEMENT SYSTEM FOR NORTHERN BOBWHITE AND GRASSLAND SONGBIRDS IN AN INTENSIVE PRODUCTION AGRICULTURAL LANDSCAPE IN THE LOWER MISSISSIPPI ALLUVIAL
Effects of Cage Stocking Density on Feeding Behaviors of Group-Housed Laying Hens
 AS 651 ASL R2018 2005 Effects of Cage Stocking Density on Feeding Behaviors of Group-Housed Laying Hens R. N. Cook Iowa State University Hongwei Xin Iowa State University, hxin@iastate.edu Recommended
Surveys of the Street and Private Dog Population: Kalhaar Bungalows, Gujarat India
 The Humane Society Institute for Science and Policy Animal Studies Repository 11-2017 Surveys of the Street and Private Dog Population: Kalhaar Bungalows, Gujarat India Tamara Kartal Humane Society International
Bobwhite s. Je. Best Friend. One man is on a quest to kring Lack quail northern bobwkites, whicli have all but disappeared from /Minnesota.
 Bobwhite s Je. Best Friend By Chris Niskanen One man is on a quest to kring Lack quail northern bobwkites, whicli have all but disappeared from /Minnesota. THURMAN TUCKER is driving through Houston County
THE POULTRY ENTERPRISE ON KANSAS FARMS
 THE POULTRY ENTERPRISE ON KANSAS FARMS SUMMARY The poultry enterprise in Kansas is taking rank as a major enterprise on an increasingly large number of farms, especially in the eastern two-thirds of the
Third Annual Conference on Animals and the Law
 Pace Environmental Law Review Volume 15 Issue 2 Summer 1998 Article 4 June 1998 Third Annual Conference on Animals and the Law Nina Fascione Follow this and additional works at: http://digitalcommons.pace.edu/pelr
APPENDIX F. General Survey Methods for Covered Species
 APPENDIX F General Survey Methods for Covered Species APPENDIX F General Survey Methods for Covered Species As described in Chapter 4, the Imperial Irrigation District (IID) will conduct baseline surveys
The Economic Impacts of the U.S. Pet Industry (2015)
") The Economic s of the U.S. Pet Industry (2015) Prepared for: The Pet Industry Joint Advisory Council Prepared by: Center for Regional Analysis George Mason University February 2017 1 Center for Regional
The Economic s of the U.S. Pet Industry (2015) Prepared for: The Pet Industry Joint Advisory Council Prepared by: Center for Regional Analysis George Mason University February 2017 1 Center for Regional
SCIENTIFIC REPORT. Analysis of the baseline survey on the prevalence of Salmonella in turkey flocks, in the EU,
 The EFSA Journal / EFSA Scientific Report (28) 198, 1-224 SCIENTIFIC REPORT Analysis of the baseline survey on the prevalence of Salmonella in turkey flocks, in the EU, 26-27 Part B: factors related to
Factors Influencing Egg Production
 June, 1930 Research Bulletin No. 129 Factors Influencing Egg Production II. The Influence of the Date of First Egg Upon Maturity and Production By C. W. KNOX AGRICULTURAL EXPERIMENT STATION IOWA STATE
Wheat and Wheat By-Products for Laying Hens
 South Dakota State University Open PRAIRIE: Open Public Research Access Institutional Repository and Information Exchange Bulletins South Dakota State University Agricultural Experiment Station 5-1-1934
LONG RANGE PERFORMANCE REPORT. Study Objectives: 1. To determine annually an index of statewide turkey populations and production success in Georgia.
 State: Georgia Grant Number: 08-953 Study Number: 6 LONG RANGE PERFORMANCE REPORT Grant Title: State Funded Wildlife Survey Period Covered: July 1, 2015 - June 30, 2016 Study Title: Wild Turkey Production
WASHINGTON GROUND SQUIRREL DISTRIBUTION SAMPLING BOARDMAN CONSERVATION AREA
 WASHINGTON GROUND SQUIRREL DISTRIBUTION SAMPLING BOARDMAN CONSERVATION AREA Prepared by Jeff Rosier February 2015 The Nature Conservancy 821 SE 14 th Avenue Portland, OR 97214 Table of Contents Introduction...
India s Trade Performance in Poultry Products
 International Journal of Current Microbiology and Applied Sciences ISSN: 2319-7706 Volume 6 Number 10 (2017) pp. 451-460 Journal homepage: http://www.ijcmas.com Original Research Article https://doi.org/10.20546/ijcmas.2017.610.055
TEMPORAL AND SPATIAL DISTRIBUTION OF THE BLACK-LEGGED TICK, IXODES SCAPULARIS, IN TEXAS AND ITS ASSOCIATION WITH CLIMATE VARIATION
 TEMPORAL AND SPATIAL DISTRIBUTION OF THE BLACK-LEGGED TICK, IXODES SCAPULARIS, IN TEXAS AND ITS ASSOCIATION WITH CLIMATE VARIATION An Undergraduate Research Scholars Thesis By JOSHUA SANTELISES Submitted
A SPATIAL ANALYSIS OF SEA TURTLE AND HUMAN INTERACTION IN KAHALU U BAY, HI. By Nathan D. Stewart
 A SPATIAL ANALYSIS OF SEA TURTLE AND HUMAN INTERACTION IN KAHALU U BAY, HI By Nathan D. Stewart USC/SSCI 586 Spring 2015 1. INTRODUCTION Currently, sea turtles are an endangered species. This project looks
Susitna Watana Hydroelectric Project Document ARLIS Uniform Cover Page
 Alaska Resources Library & Information Services Susitna Watana Hydroelectric Project Document ARLIS Uniform Cover Page Title: Dall's sheep distribution and abundance, Study plan Section 10.7, Study Completion
Chapter 13 First Year Student Recruitment Survey
 Chapter 13 First Year Student Recruitment Survey Table of Contents Introduction...... 3 Methodology.........4 Overall Findings from First Year Student Recruitment Survey.. 7 Respondent Profile......11
Relationship Between Eye Color and Success in Anatomy. Sam Holladay IB Math Studies Mr. Saputo 4/3/15
 Relationship Between Eye Color and Success in Anatomy Sam Holladay IB Math Studies Mr. Saputo 4/3/15 Table of Contents Section A: Introduction.. 2 Section B: Information/Measurement... 3 Section C: Mathematical
Distribution, population dynamics, and habitat analyses of Collared Lizards
 Distribution, population dynamics, and habitat analyses of Collared Lizards The proposed project focuses on the distribution and population structure of the eastern collared lizards (Crotaphytus collaris
Feasibility Study for the Restoration of Wild Northern Bobwhite in Minnesota. Minnesota Department of Natural Resources
 Feasibility Study for the Restoration of Wild Northern Bobwhite in Minnesota Minnesota Department of Natural Resources Section of Wildlife Management January 15, 2015 The purpose of this report is to comply
Mexican Gray Wolf Reintroduction
 Mexican Gray Wolf Reintroduction New Mexico Supercomputing Challenge Final Report April 2, 2014 Team Number 24 Centennial High School Team Members: Andrew Phillips Teacher: Ms. Hagaman Project Mentor:
Draft ESVAC Vision and Strategy
 1 2 3 7 April 2016 EMA/326299/2015 Veterinary Medicines Division 4 5 6 Draft Agreed by the ESVAC network 29 March 2016 Adopted by ESVAC 31 March 2016 Start of public consultation 7 April 2016 End of consultation
Alberta Conservation Association 2017/18 Project Summary Report
 Alberta Conservation Association 2017/18 Project Summary Report Project Name: Pronghorn Road Crossing Enhancement (Pronghorn Xing) Wildlife Program Manager: Doug Manzer Project Leader: Paul Jones Primary
LONG RANGE PERFORMANCE REPORT. Study Objectives: 1. To determine annually an index of statewide turkey populations and production success in Georgia.
 State: Georgia Grant Number: 08-953 Study Number: 6 LONG RANGE PERFORMANCE REPORT Grant Title: State Funded Wildlife Survey Period Covered: July 1, 2014 - June 30, 2015 Study Title: Wild Turkey Production
The Chick Hatchery Industry in Indiana
 The Chick Hatchery Industry in Indiana W. D. Thornbury and James R. Anderson, Indiana University Introduction Artificial incubation has long been practiced, even in the centuries before Christ. The Egyptians
Status and Management of Amphibians on Montana Rangelands
 Status and Management of Amphibians on Montana Rangelands Society For Range Management Meeting February 9, 2011 - Billings, Montana Bryce A. Maxell Interim Director / Senior Zoologist Montana Natural Heritage
The Vulnerable, Threatened, and Endangered Species of the Coachella Valley Preserve
 Scriven 1 Don Scriven Instructors: R. Griffith and J. Frates Natural Resources Law Enforcement 24 October 2012 The Vulnerable, Threatened, and Endangered Species of the Coachella Valley Preserve The Coachella
Breeding success of Greylag Geese on the Outer Hebrides, September 2016
 Breeding success of Greylag Geese on the Outer Hebrides, September 2016 Wildfowl & Wetlands Trust Report Author Carl Mitchell September 2016 The Wildfowl & Wetlands Trust All rights reserved. No part of
Baseline Survey for Street Dogs in Guam
 The Humane Society Institute for Science and Policy Animal Studies Repository 12-28-2014 Baseline Survey for Street Dogs in Guam John D. Boone Humane Society International Follow this and additional works
Lynx Update May 25, 2009 INTRODUCTION
 Lynx Update May 25, 2009 INTRODUCTION In an effort to establish a viable population of Canada lynx (Lynx canadensis) in Colorado, the Colorado Division of Wildlife (CDOW) initiated a reintroduction effort
Franck Berthe Head of Animal Health and Welfare Unit (AHAW)
") EFSA s information meeting: identification of welfare indicators for monitoring procedures at slaughterhouses Parma, 30/01/2013 The role of EFSA in Animal Welfare Activities of the AHAW Unit Franck Berthe
EFSA s information meeting: identification of welfare indicators for monitoring procedures at slaughterhouses Parma, 30/01/2013 The role of EFSA in Animal Welfare Activities of the AHAW Unit Franck Berthe
 3 6 7 0 5 3 5 7 8 69 4 15 6 Prudential Relocation White Paper Series 2005 The Ins and Outs of Moving With Pets The Ins and Outs of Moving With Pets The turn of the century and many current events
Title of Project: Distribution of the Collared Lizard, Crotophytus collaris, in the Arkansas River Valley and Ouachita Mountains
 Title of Project: Distribution of the Collared Lizard, Crotophytus collaris, in the Arkansas River Valley and Ouachita Mountains Project Summary: This project will seek to monitor the status of Collared
A standardized cage measurement system: A versatile tool for calculating usable cage space 1
 2012 Poultry Science Association, Inc. A standardized cage measurement system: A versatile tool for calculating usable cage space 1 A. S. Kiess,* P. Y. Hester, 1 J. A. Mench, R. C. Newberry, and J. P.
Analysis of Veterinary Workforce in Thailand National Veterinary Education sub committee Gr.1
 Analysis of Veterinary Workforce in Thailand National Veterinary Education sub committee Gr.1 Presented by Sukolrat Boonyayatra Faculty of Veterinary Medicine Chiang Mai University, Thailand Veterinarians
State of the art tools for surveying horse populations and modeling fertility control
 State of the art tools for surveying horse populations and modeling fertility control L. Stefan Ekernas, PhD LEkernas@usgs.gov November 8, 2018 Outline 1. Survey methods 2. Population models Outline 1.
Moorhead, Minnesota. Photo Credit: FEMA, Evaluating Losses Avoided Through Acquisition: Moorhead, MN
 Moorhead, Minnesota Photo Credit: FEMA, 2010. Evaluating Losses Avoided Through Acquisition: Moorhead, MN Background Moorhead is a midsize city (pop. 38,065) in Clay County, Minnesota. The largest city
Saskatchewan Sheep Opportunity
 Saskatchewan Sheep Opportunity Prepared by Saskatchewan Sheep Development Board 2213C Hanselman Court Saskatoon, Saskatchewan S7L 6A8 Telephone: (306) 933-5200 Fax: (306) 933-7182 E-mail: sheepdb@sasktel.net
Progress at a Turtle s Pace: the Lake Jackson Ecopassage Project. Matthew J. Aresco, Ph.D. Lake Jackson Ecopassage Alliance
 Progress at a Turtle s Pace: the Lake Jackson Ecopassage Project Matthew J. Aresco, Ph.D. Lake Jackson Ecopassage Alliance 90 DOR turtles on 1/3 mile of US 27, February 2000 This photo was sent
Raptor Ecology in the Thunder Basin of Northeast Wyoming
 Raptor Ecology in the Thunder Basin Northeast Wyoming 121 Kort Clayton Thunderbird Wildlife Consulting, Inc. My presentation today will hopefully provide a fairly general overview the taxonomy and natural
The Force Concept Inventory (FCI) is currently
 is currently") Common Concerns About the Force Concept Inventory Charles Henderson The Force Concept Inventory (FCI) is currently the most widely used assessment instrument of student understanding of mechanics. 1 This
Common Concerns About the Force Concept Inventory Charles Henderson The Force Concept Inventory (FCI) is currently the most widely used assessment instrument of student understanding of mechanics. 1 This
Weaver Dunes, Minnesota
 Hatchling Orientation During Dispersal from Nests Experimental analyses of an early life stage comparing orientation and dispersal patterns of hatchlings that emerge from nests close to and far from wetlands
Density, growth, and home range of the lizard Uta stansburiana stejnegeri in southern Dona Ana County, New Mexico
 Great Basin Naturalist Volume 33 Number 2 Article 8 6-30-1973 Density, growth, and home range of the lizard Uta stansburiana stejnegeri in southern Dona Ana County, New Mexico Richard D. Worthington University
Advanced Techniques for Modeling Avian Nest Survival. Stephen J. Dinsmore; Gary C. White; Fritz L. Knopf
 Advanced Techniques for Modeling Avian Nest Survival Stephen J. Dinsmore; Gary C. White; Fritz L. Knopf Ecology, Vol. 83, No. 12. (Dec., 2002), pp. 3476-3488. http://links.jstor.org/sici?sici=0012-9658%28200212%2983%3a12%3c3476%3aatfman%3e2.0.co%3b2-p
KIPP BROWN Extension Livestock Coordinator Department of Animal and Dairy Science Mississippi State University
 KIPP BROWN Extension Livestock Coordinator Department of Animal and Dairy Science Mississippi State University Improve decision-making skills Increase public speaking ability Improve evaluation skills
IMPLANT PROGRAM EFFECTS ON FEEDLOT PERFORMANCE, CARCASS TRAITS AND SENSORY RATINGS OF SERIALLY SLAUGHTERED HEIFERS
 IMPLANT PROGRAM EFFECTS ON FEEDLOT PERFORMANCE, CARCASS TRAITS AND SENSORY RATINGS OF SERIALLY SLAUGHTERED HEIFERS B. R. Schutte 1, W. T. Nichols 2, J. B. Morgan 3, L. L. Guenther 4 and H.G. Dolezal 5
REPORT OF ACTIVITIES TURTLE ECOLOGY RESEARCH REPORT Crescent Lake National Wildlife Refuge 31 May to 4 July 2017
 REPORT OF ACTIVITIES 2017 TURTLE ECOLOGY RESEARCH REPORT Crescent Lake National Wildlife Refuge 31 May to 4 July 2017 A report submitted to Refuge Biologist Marlin French 15 July 2017 John B Iverson Dept.
ABSTRACT. Ashmore Reef
 ABSTRACT The life cycle of sea turtles is complex and is not yet fully understood. For most species, it involves at least three habitats: the pelagic, the demersal foraging and the nesting habitats. This
Case 2:14-cv KJM-KJN Document 2-5 Filed 02/03/14 Page 1 of 6 EXHIBIT E
 Case 2:14-cv-00341-KJM-KJN Document 2-5 Filed 02/03/14 Page 1 of 6 EXHIBIT E Case 2:14-cv-00341-KJM-KJN Document 2-5 Filed 02/03/14 Page 2 of 6 1 EGG ECONOMICS UPDATE #338, Poultry Specialist (emeritus),
Lab 7. Evolution Lab. Name: General Introduction:
 Lab 7 Name: Evolution Lab OBJECTIVES: Help you develop an understanding of important factors that affect evolution of a species. Demonstrate important biological and environmental selection factors that