Poultry 2010 Structure of the U.S. Poultry Industry, 2010
|
|
|
- Chad James
- 5 years ago
- Views:
Transcription

1 United States Department of Agriculture Animal and Plant Health Inspection Service Poultry 2010 Structure of the U.S. Poultry Industry, 2010 Veterinary Services National Animal Health Monitoring System December 2011
2 The U.S. Department of Agriculture (USDA) prohibits discrimination in all its programs and activities on the basis of race, color, national origin, age, disability, and where applicable, sex, marital status, familial status, parental status, religion, sexual orientation, genetic information, political beliefs, reprisal, or because all or part of an individual s income is derived from any public assistance program. (Not all prohibited bases apply to all programs.) Persons with disabilities who require alternative means for communication of program information (Braille, large print, audiotape, etc.) should contact USDA s TARGET Center at (202) (voice and TDD). To file a complaint of discrimination, write to USDA Director, Office of Civil Rights, 1400 Independence Avenue, S.W., Washington, D.C , or call (800) (voice) or (202) (TDD). USDA is an equal opportunity provider and employer. Mention of companies or commercial products does not imply recommendation or endorsement by the USDA over others not mentioned. USDA neither guarantees nor warrants the standard of any product mentioned. Product names are mentioned solely to report factually on available data and to provide specific information. USDA APHIS VS, CEAH NRRC Building B, M.S. 2E Centre Avenue Fort Collins, CO (970) NAHMS@aphis.usda.gov # Cover photograph courtesy of Frank T. Jones

3 Items of Note General The Poultry 2010 study was administered to the Nation s largest broiler, turkey, table-egg layer, and breeder companies, which accounted for over 70 percent of the respective industries. Estimates generated from this study reflect the practices of these large companies only. Turkey-breeder companies were not included in the study. Broiler farms accounted for nearly two-thirds of farms (65.6 percent). Table-egg production farms accounted for less than 3 percent of farms. Turkey farms accounted for 16.7 percent of farms, and breeder farms accounted for 15.4 percent of farms. Broiler companies had a median of over 400 farms, whereas table-egg companies had a median of fewer than 10 farms. Nearly all breeder farms and three-fourths of turkey farms had fewer than 50,000 birds at maximum capacity. The majority of broiler farms had 50,000 to 99,999 birds at maximum capacity, and the majority of table-egg farms had 100,000 or more birds. USDA APHIS VS / i

4 ii / Poultry 2010
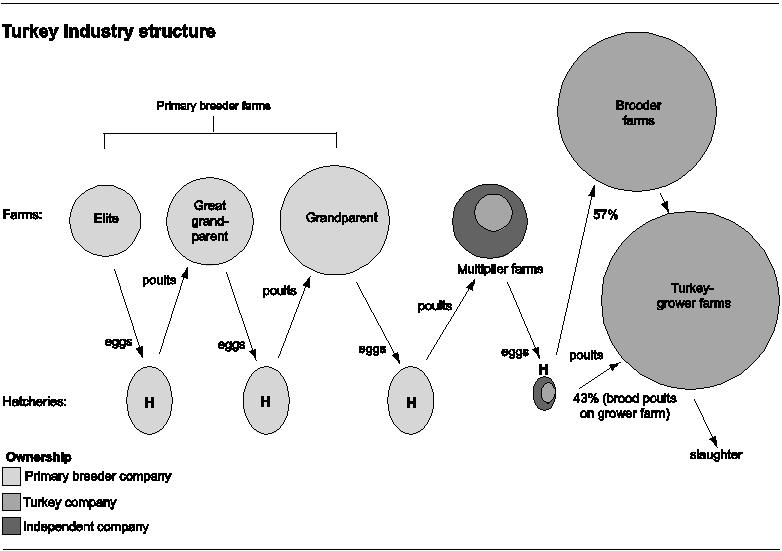
5 Breeding Poultry production begins with primary breeders, the genetic stock for the industry. Primary breeder flocks consist of elite (pedigree/foundation), great-grandparent, and grandparent birds. Grandparent flocks produce the final generation of breeding birds (multiplier/parent flocks). Eggs from multiplier flocks hatch to become production birds (broilers, market turkeys, table-egg layers) for human consumption. All broiler companies participating in the study had multiplier farms; less than 10 percent of table-egg companies had multiplier farms. About one-half of turkey companies had multiplier farms. Turkey companies that do not have multiplier farms generally receive poults or eggs from independent multiplier flocks. Table-egg companies that do not have multiplier farms will generally receive chicks or pullets from breeder companies. Hatchery ownership is consistent with companies that have multiplier flocks. All broiler companies participating in the study owned hatcheries; less than 10 percent of table-egg companies owned hatcheries. About one-half of turkey companies owned hatcheries. Nearly all hatcheries that provided chicks to broiler farms were owned by the production company; less than 3 percent of hatcheries that supplied table-egg production farms were owned by the production company. As suppliers of industry genetics, primary breeder farms commonly shipped eggs outside of their State (74.9 percent of farms) as well as outside of the United States (56.8 percent of farms). Multiplier farms mostly shipped eggs within State (95.2 percent of farms). Hatcheries belonging to broiler and turkey production companies mostly produced chicks/ poults to supply their company only. As producers of the genetics for the rest of the industry, 80.0 percent of breeder companies hatcheries supplied other companies. Hatcheries belonging to broiler and turkey production companies mostly shipped chicks/ poults to farms within the United States, whereas breeder companies hatcheries commonly shipped chicks outside the United States (54.3 percent). Ownership of multiplier flocks and hatcheries differed by production type. All broiler farms received chicks produced by company-owned multiplier flocks and hatcheries. Pullets placed on the majority of table-egg farms were produced by multiplier flocks and hatcheries owned by a primary breeder company. Birds placed on the majority of turkeyproduction farms (67.3 percent) were produced by multiplier flocks owned by an independent operator or another company. USDA APHIS VS / iii
6 Production A higher percentage of table-egg farms than broiler or turkey farms were company owned (42.2 versus 0.2 and 8.0 percent of farms, respectively). Over 8 of 10 turkey-grower farms had toms only; less than 1 percent had both hens and toms. About 4 of 10 turkey-grower farms also had brood birds on the same farm. Organic farming was most common in table-egg production; 11.2 percent of table-egg farms had at least one house designated as organic. Table-egg farms most commonly raised pullets on a separate farm belonging to the same company and located within the same State as their farm. About 9 of 10 table-egg farms collected eggs by belt only. About 8 of 10 table-egg farms primarily produced shell eggs (not for breaking). Of farms that produced shell eggs, about one-third had on-farm egg processing facilities and two-thirds sent eggs off-farm for processing. About one-half of farms with on-farm processing processed eggs for other farms. Nearly all farms with off-farm processing used flats that could go to other farms belonging to the same company. No farms shared flats with other companies. About one-fourth of farms with off-farm processing used racks/pallets that were also used by other companies. About one-half of table-egg farms molted their last completed flock. Molted flocks were kept in the laying house an average of 88.7 weeks and nonmolted flocks an average of 64.2 weeks. The most common methods of disposal of spent hens were rendering and processing (47.0 and 38.8 percent of farms, respectively). On average, broilers were marketed or slaughtered at 7.2 weeks of age, turkey hens at 14.2 weeks, and turkey toms at 19.7 weeks. All broiler slaughter facilities and three-fourths of the turkey slaughter facilities that slaughtered birds for the participating companies were owned by their respective production companies. About one-half of the company-owned turkey slaughter facilities, but none of the company-owned broiler slaughter facilities, also slaughtered birds for other companies. None of the slaughter facilities slaughtered other species of poultry or species other than poultry. iv / Poultry 2010
7 No broiler or turkey farms marketed birds via a live-bird market. The feed mill that produced feed for the farm also produced feed for other companies for over 50 percent of broiler, table-egg, and breeder farms but for only 20 percent of turkey farms. A vehicle dedicated to the company only was the most common method for bringing birds onto broiler and turkey farms. Almost one-half of table-egg farms belonged to companies in which vehicles used to bring birds onto the farm were also used on other farms not from their company. Broiler and turkey farms most commonly used vehicles dedicated to the company only to transport birds to slaughter. Over 80 percent of table-egg companies used vehicles that were also used by other companies. USDA APHIS VS / v
8 Acknowledgments The Poultry 2010 study was a cooperative effort among animal health officials, university researchers, extension personnel, and poultry producers. We want to thank industry members who helped determine the direction and objectives of this study. Recognition also goes to the personnel at the Centers for Epidemiology and Animal Health for their efforts in generating reports from Poultry 2010 data and to our reviewers for providing valuable expertise and guidance through their comments. All participants are to be commended, particularly the industry veterinarians whose voluntary efforts made this component of the Poultry 2010 study possible. Larry M. Granger Director Centers for Epidemiology and Animal Health vi / Poultry 2010
9 Suggested bibliographic citation for this report: USDA Poultry Structure of the U.S. Poultry Industry, 2010 USDA APHIS VS CEAH NAHMS. Fort Collins, CO # Contacts for further information: Questions or comments on data analysis: Dr. Lindsey Garber (970) Information on reprints or other reports: Ms. Abby Fienhold (970) Feedback Feedback, comments, and suggestions regarding Poultry 2010 study reports are welcomed. Please forward correspondence via at: or you may submit feedback via online survey at: (Click on FEEDBACK on NAHMS reports. ) USDA APHIS VS / vii
10 Table of Contents Introduction 1 Terms Used in This Report 3 Section I: Population Estimates 5 A. General Information 5 1. Farm type 5 2. Company type 6 B. Breeder Farms and Hatcheries 8 1. Breeder farms 8 2. Hatcheries 12 C. Production Farms General production farm characteristics Bird sources Table-egg production farms Marketing and slaughter 30 D. Feed and Vehicles Feed mills Vehicle use for delivering feed Vehicle use for bringing birds onto farm Vehicle use for transporting birds off farm 36 Section II: Methodology 37 A. Needs Assessment 37 B. Sampling and Estimation Phase I: Company survey Phase II: Breeder farm survey Data collection Data analysis Population inferences Response rate 39 Appendix: Study Objectives and Related Outputs 40 viii / Poultry 2010
11 Introduction Introduction The National Animal Health Monitoring System (NAHMS) is a nonregulatory program of the U.S. Department of Agriculture s (USDA) Animal and Plant Health Inspection Service. NAHMS is designed to help meet the Nation s animal-health information needs. Layers 99 was NAHMS first national study of U.S. poultry and provided baseline health and management information on the table-egg industry. Layers 99 estimated the prevalence and associated risk factors of Salmonella enterica enteritidis in U.S. layer flocks. Poultry 2004 was NAHMS second study of the U.S. poultry industry. Poultry 2004 provided information regarding bird health, bird movement, and biosecurity practices of backyard flocks, gamefowl breeder flocks, and live-poultry markets. The Small-Enterprise Chicken study was NAHMS third study of the poultry industry and focused on biosecurity and bird movement on operations with 1,000 to 19,999 chickens. Poultry 2010 is NAHMS fourth study of the U.S. poultry industry. For Poultry 2010, NAHMS conducted an extensive assessment to determine the information needs of the poultry industry, researchers, and Federal and State governments. This needs assessment resulted in three study objectives: 1. Describe the structure of commercial poultry industries, including interactions among poultry industry segments, movements, and biosecurity practices. Describe farm-level practices for chicken primary breeder and multiplier flocks. Identify critical factors for exclusion of disease (such as Mycoplasma). 2. Estimate the prevalence and investigate risk factors associated with clostridial dermatitis (cellulitis/gangrenous dermatitis) on turkey-grower farms. 3. Describe bird health, movement, and biosecurity practices of urban chicken flocks in four U.S. cities Miami, Denver, Los Angeles, and New York City. Structure of the U.S. Poultry Industry, 2010, is the third in a series of reports containing information from the Poultry 2010 study and focuses on company practices as well as the industry s structure. Information for this report was provided by poultry company veterinarians or representatives from the Nation s largest breeder, broiler, table-egg layer, and turkey companies. The selected companies represent all chicken primary breeders, 81.2 percent of broilers produced during 2009, percent of table-egg layers in production on December 31, 2009, 1 and 76.8 percent of turkeys slaughtered in in the United States. 1 February WATT PoultryUSA survey. 2 WATT PoultryUSA Turkey Profiles, February USDA APHIS VS / 1
12 Introduction The methods used and the number of respondents in the study can be found at the end of this report. Further information on NAHMS studies and reports is available at: For questions about this report or additional copies, please contact: USDA APHIS VS CEAH NRRC Building B, M.S. 2E Centre Avenue Fort Collins CO, / Poultry 2010
13 Terms Used in This Report Terms Used in This Report Breeder-hen candidate: A young female turkey intended for breeding. Company-owned farm: Operations that own and raise their own birds. Company type: Breeder company: A company that owns only breeder flocks. Production company: A company that produces broilers, turkeys, or table eggs for human consumption. Production companies may or may not also have multiplier/parent flocks. Contract farm: Operations under contract with a poultry company, whereby the poultry company owns the birds and provides feed and other services, and the operation provides housing and labor. Farm: A premises with one or more poultry houses under common management, including company-owned and contract farms. Farm type: Breeder farm: Produces eggs for hatching. Primary breeder: Breeding birds whose offspring are used as breeding birds. These include pedigree (elite/foundation), great-grandparent, and grandparent flocks. Only broiler and table-egg primary breeder farms are included. Multiplier/parent: Breeding birds whose offspring are used as production birds (broilers, market turkeys, table-egg layers). Includes broiler, tableegg and turkey multiplier farms. Production farm: Produces final product for human consumption. Broiler farm: Produces chickens for meat. Table-egg farm: Produces eggs for human consumption. Turkey-grower farm: Produces turkeys for meat. Brooder farm: Raises young turkeys that will be placed on turkey-grower farms. Pullet farm: Raises young female birds that will be placed on laying farms (either breeder farms or table-egg farms). A pullet farm does not have adult breeding hens. Flat: A tray holding eggs for storage and transport. Flock: A group of birds of the same age housed together in one house (or multiple houses on a farm) and managed as a unit. USDA APHIS VS / 3
 until they return approximately to their 18-week weight.")
14 Terms Used in This Report Hatchery: Facility where eggs are hatched. Hen: Female turkey or chicken. Molt: The period when birds are taken out of production (usually around 65 weeks of age) until they return approximately to their 18-week weight. After a rest period, they are returned to production for another laying cycle. Median: The value of the middle item after the data are sorted by size. Operation average: The average value for all operations. A single value for each operation is summed over all operations reporting divided by the number of operations reporting. For example, operation average age birds are marketed or slaughtered (see table c., p 31) is calculated by summing reported average age over all operations divided by the number of operations. Population estimates: Estimates in this report are provided with a measure of precision called the standard error. A 95-percent confidence interval can be created with bounds equal to the estimate, plus or minus two standard errors. If the only error is sampling error, the confidence intervals created in this manner will contain the true population mean 95 out of 100 times. In the example to the left, an estimate of 7.5 with a standard error of 1.0 results in limits of 5.5 to 9.5 (two times the standard error above and below the estimate). The second estimate of 3.4 shows a standard error of 0.3 and results in limits of 2.8 and 4.0. Alternatively, the 90-percent confidence interval would be created by multiplying the standard error by 1.65 instead of 2. Most estimates in this report are rounded to the nearest tenth. If rounded to 0, the standard error was reported (0.0). If there were no reports of the event, no standard error was reported ( ). Parent flock: See multiplier/parent flock. Poult: A young turkey. Pullet: A young female chicken. Rack/pallet: Holder for multiple egg flats. Rooster: Adult male chicken. 4 / Poultry 2010 Tom: Male turkey.

15 Section I: Population Estimates A. General Information Section I: Population Estimates Note: Unless otherwise specified, breeder farms include breeder farms belonging to breeder companies as well as breeder farms belonging to production companies. A. General Information 1. Farm type Nearly two-thirds of farms (65.6 percent) were broiler farms. Table-egg production farms accounted for less than 3 percent of farms. Breeder farms accounted for 15.4 percent of farms. Percentage of farms by farm type: Farm type Percent farms error Breeder 15.4 (0.3) Broiler 65.6 (0.3) Table egg 2.3 (0.0) Turkey 16.7 (0.1) Total Photograph courtesy of Frank T. Jones USDA APHIS VS / 5
16 Section I: Population Estimates A. General Information Percentage of farms by farm type Percent Breeder Broiler Table egg Turkey Farm type 2. Company type Broiler companies had a median of over 400 farms, whereas table-egg companies had a median of fewer than 10 farms. a. Median number of farms* per company, by company type: Company type Median Breeder 27 Broiler 464 Table egg 8 Turkey 141 *For breeder companies includes primary and multiplier breeder farms; for production companies includes production farms and multiplier farms (if any). 6 / Poultry 2010
 had fewer than 50,000 birds when at maximum capacity.")
17 Section I: Population Estimates A. General Information Nearly all breeder farms and three-fourths of turkey farms (98.8 and 73.4 percent, respectively) had fewer than 50,000 birds when at maximum capacity. The majority of broiler farms had 50,000 to 99,999 birds at maximum capacity, and the majority of tableegg farms had 100,000 or more birds. b. Percentage of farms by number of birds present when at maximum capacity, and by farm type: Number of birds Percent Farms Farm Type Breeder* Broiler Table egg Turkey error error error error Fewer than 50, (0.6) 11.7 (0.4) 34.3 (2.5) 73.4 (0.5) 50,000 to 99, (0.5) 56.3 (0.6) 12.0 (1.9) 23.9 (0.4) 100,000 or more 0.3 (0.3) 32.0 (0.5) 53.7 (2.7) 2.7 (0.3) Total *Limited to breeder farms belonging to breeder companies. USDA APHIS VS / 7

18 Section I: Population Estimates B. Breeder Farms and Hatcheries B. Breeder Farms and Hatcheries 1. Breeder farms All broiler companies participating in the study had multiplier farms; less than 10 percent of table-egg companies had multiplier farms. About one-half of turkey companies had multiplier farms. Turkey companies that do not have multiplier farms generally receive poults or eggs from independent multiplier flocks. Table-egg companies that do not have multiplier farms generally receive chicks or pullets from breeder companies. a. Percentage of production companies that had multiplier/parent farms (either company owned or contract), by company type: Percent Production Companies Company Type Broiler Table egg Turkey Percent error Percent error Percent error ( ) 8.7 (6.1) 58.3 (14.4) Photograph courtesy of Frank T. Jones 8 / Poultry 2010
19 Section I: Population Estimates B. Breeder Farms and Hatcheries About 9 of 10 breeder farms were multiplier/parent farms and 1 of 10 were primary breeder farms (grandparent or higher category). b. Percentage of breeder farms by breeder farm type: Breeder farm type Percent breeder farms error Primary breeder 11.0 (0.2) Multiplier/parent 89.0 (0.2) Total The majority of turkey multiplier farms were company owned while most broiler and tableegg multiplier farms were contract. Note: Turkey breeder companies were not included in the study and their farm ownership may differ from production companies flocks. c. Percentage of breeder farms by ownership and by breeder farm type: Ownership Company owned Broiler multiplier Table-egg multiplier Percent Breeder Farms Breeder Farm Type Turkey multiplier 1 error All multiplier farms Primary breeder 2 error 0.1 (0.1) 13.4 (3.8) 88.1 (3.9) 3.9 (0.4) 7.7 (1.6) Contract 99.9 (0.1) 86.6 (3.8) 11.9 (3.9) 96.1 (0.4) 92.3 (1.6) Total Multiplier flocks belonging to turkey production companies only. No turkey breeder companies participated in the study. 2 Limited to broiler and table-egg primary breeder farms. USDA APHIS VS / 9
20 Section I: Population Estimates B. Breeder Farms and Hatcheries The majority of broiler primary breeder farms (77.1 percent) had grandparent stock only, whereas over one-half of table-egg primary breeder farms (53.8 percent) contained greatgrandparent and grandparent stock. d. Percentage of broiler and table-egg primary breeder farms, by bird type: Bird type Pedigree (Elite/ Foundation) only Elite and other breeders Great grandparent only Great grandparent and grandparent Percent Primary Breeder Farms Broiler Table egg All farms Error error error 5.4 (1.4) 0.0 ( ) 5.2 (1.3) 0.0 ( ) 7.7 (7.7) 0.4 (0.4) 14.4 (2.1) 0.0 ( ) 13.6 (2.0) 3.1 (1.1) 53.8 (14.3) 5.5 (1.3) Grandparent only 77.1 (2.5) 38.5 (14.0) 75.3 (2.5) Other 0.0 ( ) 0.0 ( ) 0.0 ( ) Total A low percentage of multiplier farms raised pullets or breeder-hen candidates on farm. e. Percentage of breeder farms that raised pullets/breeder-hen candidates on farm: Broiler multiplier Table-egg multiplier Percent Breeder Farms Breeder Farm Type Turkey multiplier All multiplier farms Primary breeder* 0.0 ( ) 1.5 (1.5) 5.7 (2.5) 0.3 (0.1) 15.1 (2.1) *Limited to broiler and table-egg primary breeder farms. 10 / Poultry 2010
21 Section I: Population Estimates B. Breeder Farms and Hatcheries About one-half of primary breeder farms received any birds from outside their State but within the United States during the previous 12 months. Less than 1 percent of breeder farms received birds from outside the United States. f. Percentage of breeder farms that received any birds during the previous 12 months, by source of birds: Source Broiler multiplier Table-egg multiplier Percent Breeder Farms Breeder Farm Type Turkey multiplier All multiplier farms Primary breeder 1 error Within State 87.1 (0.9) 71.6 (5.3) 61.2 (5.8) 85.5 (0.9) 84.5 (2.0) Outside State but within the United States 14.3 (1.0) 28.4 (5.3) 38.8 (5.8) 15.9 (1.0) 52.0 (2.5) Outside the United States 0.0 ( ) 0.0 ( ) (3.0) 0.5 (0.2) (0.4) 1 Limited to broiler and table-egg primary breeder farms. 2 Canada. 3 Europe. As suppliers of the industry genetics, primary breeder farms commonly shipped eggs outside of their State as well as outside of the United States. Multiplier farms mostly shipped eggs within their State. g. Percentage of breeder farms that shipped any eggs during the previous 12 months, by shipping destination: Destination Broiler multiplier Table-egg multiplier Percent Breeder Farms Breeder Farm Type Turkey multiplier All multiplier farms Primary breeder 1 error Within State 95.6 (0.6) 88.1 (2.3) 92.5 (3.2) 95.2 (0.6) 76.8 (2.2) Outside State but within the 10.6 (0.9) 55.2 (6.1) 44.8 (6.1) 13.7 (0.9) 74.9 (2.1) United States Outside the United States (0.2) (3.0) (4.3) 2.2 (0.3) (2.0) 1 Limited to broiler and table-egg primary breeder farms. 2 Mexico. 3 Canada and Mexico. 4 Canada, Mexico, and Central/South America. 5 Worldwide. USDA APHIS VS / 11
22 Section I: Population Estimates B. Breeder Farms and Hatcheries Turkeys are bred using artificial insemination. Over one-half of turkey multiplier farms had hens only, and about one-fourth had both hens and toms. h. Percentage of turkey multiplier farms by gender of breeding birds: Gender of breeding birds Percent turkey multiplier farms* error Hens only 56.1 (4.2) Toms only 18.3 (4.2) Both hens and toms 25.6 (1.7) Total *As a percentage of breeder farms with hens only, toms only, and both hens and toms. 2. Hatcheries All broiler companies and less than 10 percent of table-egg companies owned hatcheries. About one-half of turkey companies owned hatcheries. Hatchery ownership is consistent with companies having multiplier flocks (see table a., p 8). a. Percentage of production companies that owned hatcheries, by company type: Percent Production Companies Company Type Broiler Table egg Turkey Percent error Percent error Percent error ( ) 8.7 (6.1) 58.3 (14.4) 12 / Poultry 2010
23 Section I: Population Estimates B. Breeder Farms and Hatcheries Nearly all hatcheries that provided chicks to broiler farms during the previous 12 months (92.2 percent) were owned by the production company, compared with less than 3 percent of hatcheries that supplied chicks to table-egg production farms. b. Of hatcheries that supplied chicks/poults to production farms during the previous 12 months, percentage owned by the production company, by company type: Percent Hatcheries Company Type Broiler Table egg Turkey Percent error Percent error Percent error 92.2 (2.8) 2.9 (1.0) 21.0 (4.2) Of hatcheries that supplied chicks/poults to the production farms during the previous 12 months, percentage owned by the production company, by company type Percent Broiler 2.9 Table egg Turkey Company type USDA APHIS VS / 13
24 Section I: Population Estimates B. Breeder Farms and Hatcheries About 9 of 10 hatcheries belonging to turkey production companies hatched eggs for other companies during the previous 12 months, compared with about 1 of 10 hatcheries belonging to broiler or breeder companies. c. Percentage of company-owned hatcheries that hatched eggs from other companies or independent producers during the previous 12 months, by hatchery ownership: Breeder company Broiler company Percent Hatcheries Hatchery Ownership Table-egg company Turkey company All hatcheries 2.9 (2.9) 7.6 (4.3) * 90.9 (8.5) 16.1 (3.3) *Too few respondents to estimate. About three-fourths of hatcheries received eggs from outside the hatchery s State, and 10 percent received eggs from outside the United States. About three-fourths of turkey hatcheries received eggs from outside the United States. d. Percentage of company-owned hatcheries that received any eggs from the following sources during the previous 12 months, by hatchery ownership: Source Breeder company Broiler company Percent Hatcheries Hatchery Ownership Table-egg company Turkey company All hatcheries Within State 90.0 (5.4) 92.0 (4.0) * ( ) 91.7 (2.9) Outside State but within the United States Outside the United States 93.3 (4.7) 70.6 (11.0) * 63.6 (14.2) 76.7 (5.9) (4.6) 0.0 * (15.0) 10.0 (1.5) *Too few respondents to estimate. 1 Europe and Canada. 2 Canada. 14 / Poultry 2010
25 Section I: Population Estimates B. Breeder Farms and Hatcheries The majority of hatcheries belonging to broiler and turkey production companies produced chicks/poults to supply their company only. Breeder company hatcheries produce the genetics for the rest of the industry; 80.0 percent of breeder companies hatcheries supplied chicks to other companies. e. Percentage of company-owned hatcheries that supplied chicks/poults during the previous 12 months to the following farms, by hatchery ownership: Farm Owned by or contracting with this company only Belonging to other companies or independent producers only Owned by or contracting with this company and other companies Breeder company Broiler company Percent Hatcheries Hatchery Ownership Table-egg company Turkey company All hatcheries 20.0 (7.1) 92.0 (3.5) * 63.6 (12.2) 68.9 (3.0) 54.3 (7.3) 2.7 (1.9) * 0.0 ( ) 16.8 (2.4) 25.7 (7.2) 5.3 (3.1) * 36.4 (12.2) 14.3 (2.9) Total *Too few respondents to estimate. USDA APHIS VS / 15
26 Section I: Population Estimates B. Breeder Farms and Hatcheries Hatcheries belonging to broiler and turkey production companies mostly shipped chicks/ poults to farms within the United States, whereas about one-half of breeder companies hatcheries (54.3 percent) shipped chicks outside the United States. f. Percentage of company-owned hatcheries that shipped any chicks/poults to the following destinations during the previous 12 months, by hatchery ownership: Destination Breeder company Broiler company Percent Hatcheries Hatchery Ownership Table-egg company Turkey company All hatcheries Within State 94.3 (4.0) 85.6 (4.4) * ( ) 88.5 (2.8) Outside State but within the United States Outside the United States 82.9 (6.5) 28.1 (5.5) * 72.7 (8.6) 51.1 (3.8) (7.7) 0.0 ( ) * (12.2) 19.2 (2.5) *Too few respondents to estimate. 1 Worldwide. 2 Canada, Mexico, Central/South America. 16 / Poultry 2010

27 Section I: Population Estimates B. Breeder Farms and Hatcheries USDA APHIS VS / 17

28 Section I: Population Estimates C. Production Farms C. Production Farms 1. General production farm characteristics A higher percentage of table-egg farms than broiler or turkey farms were company owned (42.2, 0.2 and 8.0 percent, respectively). a. Percentage of production farms by ownership and by farm type: Ownership Percent Farms Farm Type Broiler Table egg Turkey error error error Company owned 0.2 (0.1) 42.2 (2.7) 8.0 (0.4) Contract 99.8 (0.1) 57.8 (2.7) 83.5 (0.4) Co-ops 0.0 ( ) 0.0 ( ) 8.5 (0.0) Total / Poultry 2010
29 Section I: Population Estimates C. Production Farms Over 8 of 10 turkey-grower farms had toms only, and less than 1 percent had both hens and toms. b. Percentage of turkey-grower farms by gender makeup: Gender makeup Percent farms error Hens only 16.4 (0.6) Toms only 82.8 (0.6) Hens and toms 0.8 (0.2) Total About 4 of 10 turkey-grower farms brood birds on the same farm. c. Percentage of turkey-grower farms by source of birds: Source Percent farms error Brood birds on the same farm 43.4 (1.0) Receive birds from a brooder farm 56.8 (1.0) Organic farming was most common in table-egg production; 11.2 percent of table-egg farms had at least one house designated as organic. d. Percentage of production farms that had at least one house designated as organic (certified, USDA National Organic Program), by production farm type: Percent Farms Production Farm Type Broiler Table egg Turkey Percent error Percent error Percent error 0.0 ( ) 11.2 (1.9) 0.1 (0.1) USDA APHIS VS / 19
30 Section I: Population Estimates C. Production Farms 2. Bird sources Ownership of multiplier flocks differed by production farm type. All broiler farms received chicks produced by company-owned multiplier flocks during the previous 12 months, but a low percentage (12.0 percent) also received some from a primary breeder company. Pullets placed on the majority of table-egg farms (76.9 percent) were produced by multiplier flocks owned by a primary breeder company. The majority of turkey-production farms (67.3 percent) placed birds that were produced by multiplier flocks owned by an independent operator or another company. a. Percentage of production farms by ownership of the multiplier (parent) flock that supplied the chicks/poults/pullets placed on the farm during the previous 12 months, and by production farm type: Multiplier flock ownership Primary breeder company Percent Farms Production Farm Type Broiler Table egg Turkey error error error 12.0 (0.3) 76.9 (1.4) 0.0 ( ) This company ( ) 16.4 (1.2) 50.2 (0.3) Independent operation or another company 0.1 (0.0) 13.3 (0.7) 67.3 (0.5) 20 / Poultry 2010

31 Section I: Population Estimates C. Production Farms USDA APHIS VS / 21
32 Section I: Population Estimates C. Production Farms For over 9 of 10 broiler production farms, the multiplier farms that supplied their chicks during the previous 12 months were located in the same State. About one-half of turkey farms received poults supplied by out-of-state multiplier farms. b. Percentage of production farms by location of multiplier farm that supplied chicks/poults during the previous 12 months, and by production farm type: Percent Farms Production Farm Type Broiler Turkey Multiplier farm location Percent error Percent error Within State 93.5 (0.3) 59.1 (0.7) Outside State but within the United States 21.9 (0.5) 49.8 (0.8) Outside the United States 0.0 ( ) 0.7* (0.2) *Canada. Hatchery ownership was similar to multiplier flock ownership. All broiler farms received chicks produced by company-owned hatcheries during the previous 12 months. The majority of table-egg farms (76.9 percent) received pullets that originated from hatcheries owned by a primary breeder company (76.9 percent). c. Percentage of production farms by ownership of the hatchery that supplied the chicks/ poults/pullets placed on the farm during the previous 12 months, and by production farm type: Hatchery ownership Primary breeder company Percent Farms Production Farm Type Broiler Table egg* Turkey Error error Error 12.2 (0.3) 76.9 (1.4) 0.0 ( ) This company ( ) 15.0 (1.3) 50.2 (0.3) Independent operation or another company 0.0 ( ) 14.9 (0.8) 60.4 (0.5) *Hatcheries from which pullets originated. 22 / Poultry 2010
33 Section I: Population Estimates C. Production Farms The majority of table-egg production farms (86.6 percent) raised pullets on a separate farm belonging to the same company. d. Percentage of table-egg production farms by source of pullets: Pullet source Percent farms error Egg production farm 7.2 (1.4) Separate farm, same company 86.6 (1.4) Separate farm, different company 13.1 (1.1) The majority of table-egg production farms (77.0 percent) received pullets from pullet farms located within the same State as their farms during the previous 12 months. e. Percentage of table-egg production farms by location of pullet farm that supplied pullets to the farm during the previous 12 months: Pullet farm location Percent farms error Within the farm s State 77.0 (2.2) Outside the farm s State but within the United States 36.9 (2.3) Outside the United States 0.0 ( ) 3. Table-egg production farms Most table-egg production farms cage-reared their layers. a. Percentage of table-egg production farms by caging method: Caging method Percent farms error All caged 62.0 (2.4) All cage-free 34.0 (2.4) Mixed (some caged and some cage-free) Total (1.2) USDA APHIS VS / 23
34 Section I: Population Estimates C. Production Farms Most table-egg production farms (60.7 percent) housed birds of different ages in different houses; less than 1 percent of farms housed birds of different ages in the same house. b. Percentage of table-egg production farms by age grouping and by caging method: Age grouping Different aged birds in same house Different aged birds in different houses Whole farm one age Percent Farms Caging Method All caged All cage-free Mixed All farms error error error error 1.5 (1.0) 0.0 ( ) * 0.9 (0.6) 67.8 (3.3) 43.1 (4.8) * 60.7 (2.7) 30.7 (3.3) 56.9 (4.8) * 38.4 (2.7) Total *Too few respondents to estimate. About 9 of 10 table-egg production farms (87.5 percent) collected eggs by belt only. c. Percentage of table-egg production farms by egg-gathering method and by caging method: Egg-gathering method Percent Farms Caging Method All caged All cage-free Mixed All farms error error error error Belt only 89.4 (0.9) 82.5 (3.1) * 87.5 (1.3) Hand only 10.0 (0.7) 8.0 (2.3) * 8.9 (0.9) Belt and hand 0.6 (0.6) 9.5 (2.6) * 3.6 (1.0) Total *Too few respondents to estimate. 24 / Poultry 2010
35 Section I: Population Estimates C. Production Farms About 8 of 10 table-egg production farms primarily produced shell eggs (not for breaking). d. Percentage of table-egg production farms by primary type of eggs produced: Type of eggs Percent farms error Eggs for breaking 17.6 (1.3) Shell eggs (whole eggs for packing, not for breaking) 82.4 (1.3) Total Of farms that produced shell eggs, 35.4 percent had on-farm processing facilities. e. Percentage of shell-egg production farms with on-farm processing facilities: Percent farms error 35.4 (2.9) About one-half of the farms with on-farm processing processed eggs for other farms. f. Of shell-egg production farms with on-farm processing, percentage of farms that also processed eggs for other farms (including other farms from this company and/or farms from other companies): Percent farms error 45.3 (5.1) USDA APHIS VS / 25
36 Section I: Population Estimates C. Production Farms About 9 of 10 farms with on-farm processing (87.8 percent) primarily used a vehicle dedicated to their company only to remove processed eggs during the previous 12 months. g. Of shell-egg production farms with on-farm processing, percentage of farms by vehicle used most often to remove processed eggs during the previous 12 months: Vehicle Percent farms error Dedicated to a single farm 0.0 ( ) Dedicated to this company only 87.8 (3.2) Also used on other companies farms or independent farms Did not know, vehicle owned by an independent company Total (1.3) 8.2 (3.0) Two-thirds of shell-egg production farms sent eggs off farm for processing. h. Percentage of shell-egg production farms that sent eggs off farm for processing (including farms that sent eggs to a company-owned processing plant): Percent farms error 68.0 (2.9) Nearly all farms with off-farm processing most often used a vehicle dedicated to the company only to remove unprocessed eggs during the previous 12 months. i. For shell-egg production farms with off-farm processing, percentage of farms by vehicle used most often to remove unprocessed eggs during the previous 12 months: Vehicle Percent farms error Dedicated to a single farm 0.0 ( ) Dedicated to this company only 97.4 (1.4) Also used on other companies farms or independent farms Did not know, vehicle owned by an independent company Total ( ) 2.6 (1.4) 26 / Poultry 2010
37 Section I: Population Estimates C. Production Farms Nearly all farms with off-farm processing used flats that could go to other farms belonging to the same company. No farms shared flats with other companies. j. For shell-egg production farms with off-farm processing, percentage of farms by method usually used to handle flats: Method Percent farms error Flats disposable 0.0 ( ) Flats returned to the same farm Flats may go to other farms, this company only Flats may go to other farms, other companies 0.8 (0.7) 99.2 (0.7) 0.0 ( ) No flats 0.0 ( ) Total All farms usually cleaned and disinfected flats before returning them to the farm. k. For shell-egg production farms with off-farm processing, percentage of farms in which flats were usually cleaned and disinfected before being returned to the farm: Percent farms error ( ) USDA APHIS VS / 27
38 Section I: Population Estimates C. Production Farms About one-fourth of farms with off-farm processing (27.4 percent) used racks/pallets that were also used by other companies. l. For shell-egg production farms with off-farm processing, percentage of farms by method usually used to handle racks/pallets: Method Percent farms error Racks/pallets returned to the same farm Racks/pallets may go to other farms, this company only Racks/pallets may go to other farms, other companies 0.0 ( ) 72.6 (1.8) 27.4 (1.8) No racks/pallets 0.0 ( ) Total About 6 of 10 farms with off-farm processing (58.5 percent) usually cleaned and disinfected racks and pallets before returning to the farm. m. For shell-egg production farms with off-farm processing, percentage of farms in which racks/pallets were usually cleaned and disinfected before being returned to the farm: Percent farms error 58.5 (2.2) About one-half of table-egg production farms molted their last completed flock. n. Percentage of table-egg production farms that molted their last completed flock: Percent farms error 54.6 (2.2) 28 / Poultry 2010
39 Section I: Population Estimates C. Production Farms Molted flocks were kept in the laying house an average of 88.7 weeks. Nonmolted flocks were kept in the laying house an average of 64.2 weeks. o. Operation average length of time (weeks) from placing birds in the laying house until removal, by flock type: Flock type Operation average time* (weeks) error Molted flocks 88.7 (0.0) Nonmolted flocks 64.2 (0.0) *A single response from each company was weighted by the number of farms belonging to the company. The most common methods for disposing of spent hens were rendering (47.0 percent of farms) and processing (38.8 percent of farms). The most common other method was composting. p. Percentage of table-egg production farms by primary method used to dispose of spent hens: Method Percent farms error Processing 38.8 (2.3) Rendering 47.0 (2.3) Live-bird market 8.7 (0.5) Other 5.5 (0.9) Total USDA APHIS VS / 29
40 Section I: Population Estimates C. Production Farms Percentage of table-egg production farms by primary method used to dispose of spent hens Percent Processing Rendering Live-bird market Other Method 4. Marketing and slaughter All broiler slaughter facilities and three-fourths of the turkey slaughter facilities were owned by their respective production companies. a. For all slaughter facilities that slaughtered birds for the production company, percentage of slaughter facilities that were owned by the company, by company type: Percent Facilities Company Type Broiler Turkey Percent error Percent error ( ) 77.3 (9.7) 30 / Poultry 2010
41 Section I: Population Estimates C. Production Farms About one-half of the company-owned turkey slaughter facilities but none of the companyowned broiler slaughter facilities also slaughtered birds for other companies. None of the slaughter facilities slaughtered other species of poultry or species other than poultry. b. Percentage of company-owned slaughter facilities that also slaughter the following animals, by company type: Percent Facilities Company Type Broiler Turkey Also slaughtered... Percent error Percent error Birds for other companies 0.0 ( ) 47.1 (14.7) Other species of poultry 0.0 ( ) 0.0 ( ) Other species besides poultry 0.0 ( ) 0.0 ( ) On average, broilers were marketed or slaughtered at 7.2 weeks of age, turkey hens at 14.2 weeks of age, and turkey toms at 19.7 weeks of age. c. Operation average age (weeks) birds were marketed or slaughtered, by bird type: Operation Average Age* (weeks) Bird Type Broilers Turkey hens Turkey toms Average error Average error Average error 7.2 (0.0) 14.2 (0.1) 19.7 (0.0) *A single response from each company was weighted by the number of farms with the bird type belonging to the company. USDA APHIS VS / 31
42 Section I: Population Estimates C. Production Farms No broiler or turkey farms marketed birds via a live-bird market. d. Percentage of production farms that marketed any birds via a live-bird market, by farm type: Percent Farms Farm Type Broiler Turkey Percent error Percent error 0.0 ( ) 0.0 ( ) Broilers and turkeys were most commonly shipped to a slaughter facility located within the same State as the farm. e. Percentage of production farms that shipped birds to a slaughter facility during the previous 12 months, by location of slaughter facility and by farm type: Slaughter facility location Broiler Percent Farms Farm Type Turkey Percent error Percent error Within the farm s State 91.2 (0.4) 88.2 (0.6) Outside the farm s State but within the United States 18.6 (0.5) 14.3 (0.6) Outside the United States 0.0 ( ) 0.0 ( ) 32 / Poultry 2010

43 Section I: Population Estimates D. Feed and Vehicles D. Feed and Vehicles Note: Estimates for this section were generated by applying company practices to all farms within the company. Therefore, figures are used in this section rather than precise numeric estimates. 1. Feed mills The feed mill that produced feed for the farm also produced feed for other companies for over one-half of broiler, table-egg, and breeder farms but for only one of five turkey farms. USDA APHIS VS / 33

44 Section I: Population Estimates D. Feed and Vehicles 2. Vehicle use for delivering feed Few farms used feed trucks that delivered feed to more than one species of poultry during the previous 12 months. Over one-half of table-egg farms belonged to companies in which feed trucks delivered feed to other companies. 34 / Poultry 2010

45 Section I: Population Estimates D. Feed and Vehicles 3. Vehicle use for bringing birds onto farm A vehicle dedicated to the company only was the most common method used to bring birds onto the farm during the previous 12 months; however, almost one-half of table-egg farms belonged to companies that used vehicles on other farms not from their company. USDA APHIS VS / 35

46 Section I: Population Estimates D. Feed and Vehicles 4. Vehicle use for transporting birds off farm Broiler and turkey farms most commonly used vehicles dedicated to the company only to transport birds to slaughter during the previous 12 months. Table-egg companies mostly used vehicles that were also used by other companies. 36 / Poultry 2010
47 Section II: Methodology Section II: Methodology A. Needs Assessment NAHMS develops study objectives by exploring existing literature and contacting industry members and other stakeholders about their informational needs and priorities during a needs assessment phase. For Poultry 2010, the following activities were conducted: A focus group consisting of industry, State, Federal, and university representatives met at the World Poultry Exposition in Atlanta, GA, in January A needs assessment questionnaire was distributed to poultry veterinarians via the presidents of the egg layer, broiler, turkey, and primary breeder veterinary groups. This questionnaire was also distributed to State and Federal veterinarians, and laboratory and research personnel. Discussions were held with each of the poultry veterinary groups at the American Association of Avian Pathologists meeting in New Orleans, LA, in July 2008, and in Seattle, WA, in July Additional discussions occurred at the United States Animal Health Association Transmissible Diseases of Poultry Committee. B. Sampling and Estimation 1. Phase I: Company survey Phase I of the Poultry 2010 study focused on the industry structure and company practices. The selection unit for Phase I was the poultry company. A total of 6 breeder companies, 14 broiler companies, 23 table-egg layer companies, and 15 turkey companies were selected to participate in Phase I. Turkey breeder companies were not included. Companies that had both broilers and turkeys were considered to be two separate companies. Additionally, subparts of some large turkey companies were considered to be separate companies. Large turkey co-ops were considered to be companies. 2. Phase II: Breeder farm survey Companies that participated in Phase I, and that had any layer (egg type) or broiler (meat type) breeder farms, were eligible to participate in Phase II (Breeder Farm survey). Turkey breeder farms were not included in Phase II. The Poultry 2010 Breeder Farm survey included farms located in the Central and East regions of the United States. States in these regions account for 98 percent of egg-type breeder flocks, 97 percent of egg-type breeder birds, and over 99 percent of meat-type breeder flocks and birds participating in the National Poultry Improvement Plan. USDA APHIS VS / 37
48 Section II: Methodology 3. Data collection Data collection was conducted from May 27 through October 16, Company veterinarians or representatives completed one company questionnaire per company. Companies that had breeder farms selected a sample of farms for Phase II (Breeder Farm survey), and completed one questionnaire per farm. Some veterinarians elected to complete farm-level questionnaires for all of their breeder farms, while others selected a sample of farms. Breeder companies, broiler companies, and layer companies had a choice of completing the company and farm-level questionnaires either on-line or via hard copy. Turkey company questionnaires were only available via hard copy. The on-line data collection Web site was developed and managed by a private Web site development company. Hard-copy questionnaires were mailed to the NAHMS office and entered into a SAS data file. 4. Data analysis On-line data (both company and farm level) were forwarded to NAHMS as commadelimited files. These files were converted to SAS data sets and merged with the SAS data sets that had been entered by NAHMS staff, resulting in one company-level SAS data set and one farm-level SAS data set. Validation checks were performed on these data sets after they were combined. Point estimates were generated using SUDAAN software, which accounts for complex study design. 5. Population inferences a. Phase I: Company survey Inferences cover the population of the selected poultry companies. The selected companies represent all chicken primary breeders, 81.2 percent of broilers produced during 2009, percent of table-egg layers in production on December 31, 2009, 1 and 76.8 percent of turkeys slaughtered in in the United States. All respondent data were statistically weighted to reflect the population from which they were selected. Because companies were selected with certainty, the initial selection weight was equal to one for all selected companies. This selection weight was adjusted for nonresponse within industry segment and size strata. 1 February WATT PoultryUSA survey. 2 WATT PoultryUSA Turkey Profiles, February / Poultry 2010
Overview of the U. S. Turkey Industry
 Washington, D.C. Overview of the U. S. Turkey Industry Released November 9, 2007, by the National Agricultural Statistics Service (NASS),, U.S. Department of Agriculture. For information on call Toby Paterson
Chickens and Eggs. May Egg Production Down 5 Percent
 Chickens and Eggs ISSN: 9489064 Released June 22, 205, by the National Agricultural Statistics Service (NASS), Agricultural Statistics Board, United States Department of Agriculture (USDA). May Egg Production
Chickens and Eggs. January Egg Production Up 9 Percent
 Chickens and Eggs ISSN: 9489064 Released February 28, 207, by the National Agricultural Statistics Service (NASS), Agricultural Statistics Board, United States Department of Agriculture (USDA). January
Chickens and Eggs. November Egg Production Up Slightly
 Chickens and Eggs ISSN: 9489064 Released December 22, 207, by the National Agricultural Statistics Service (NASS), Agricultural Statistics Board, United States Department of Agriculture (USDA). November
Chickens and Eggs. December Egg Production Down 8 Percent
 Chickens and Eggs ISSN: 9489064 Released January 22, 206, by the National Agricultural Statistics Service (NASS), Agricultural Statistics Board, United States Department of Agriculture (USDA). December
Chickens and Eggs. June Egg Production Down Slightly
 Chickens and Eggs ISSN: 19489064 Released July 23, 2012, by the National Agricultural Statistics Service (NASS), Agricultural Statistics Board, United States Department of Agriculture (USDA). June Egg
Chickens and Eggs. August Egg Production Up 3 Percent
 Chickens and Eggs ISSN: 9489064 Released September 2, 208, by the National Agricultural Statistics Service (NASS), Agricultural Statistics Board, United States Department of Agriculture (USDA). August
Chickens and Eggs. Special Note
 Chickens and Eggs ISSN: 9489064 Released January 23, 208, by the National Agricultural Statistics Service (NASS), Agricultural Statistics Board, United States Department of Agriculture (USDA). Special
Chickens and Eggs. November Egg Production Up 3 Percent
 Chickens and Eggs ISSN: 9489064 Released December 2, 208, by the National Agricultural Statistics Service (NASS), Agricultural Statistics Board, United States Department of Agriculture (USDA). November
Poultry - Production and Value 2017 Summary
 United States Department of Agriculture National Agricultural Statistics Service Poultry - Production and Value 207 Summary ISSN: 949-573 April 208 Contents Summary... 5 Broiler Production and Value States
Chickens and Eggs. Special Note
 Chickens and Eggs ISSN: 9489064 Released February 27, 208, by the National Agricultural Statistics Service (NASS), Agricultural Statistics Board, United States Department of Agriculture (USDA). Special
Chickens and Eggs. February Egg Production Up Slightly
 Chickens and Eggs ISSN: 9489064 Released March 23, 208, by the National Agricultural Statistics Service (NASS), Agricultural Statistics Board, United States Department of Agriculture (USDA). February Egg
Farmer Skill & Knowledge Checklist: Poultry Meat Production
 Bulletin #1202 Farmer Skill & Knowledge Checklist: Poultry Meat Production Developed by Extension Professor Richard Brzozowski, University of Maine Reviewed by Extension Poultry Specialist Michael Darre,
Breed Selection for a Small-Scale Egg-Production Enterprise
 ASC-231 University of Kentucky College of Agriculture, Food and Environment Cooperative Extension Service Breed Selection for a Small-Scale Egg-Production Enterprise Jacquie Jacob and Tony Pescatore, Animal
Salmonella National Poultry Improvement Plan Washington State Regulations
 Salmonella National Poultry Improvement Plan Washington State Regulations Lyndon Badcoe BVSc,, MVS, DVSc, Avian Health Veterinarian and Epidemiologist Outline Describe Pathogenesis of Salmonellosis in
An EGG ECONOMICS UPDATE. Donald Bell, Poultry Specialist (emeritus) University of California, Riverside, CA 92521
 University of California, Riverside, CA 92521") Number 261 April 5, 2004 An EGG ECONOMICS UPDATE Donald Bell, Poultry Specialist (emeritus) University of California, Riverside, CA 92521 A RECAP OF EGG INDUSTRY STATISTICS - 2003 Poultry statistics are
Number 261 April 5, 2004 An EGG ECONOMICS UPDATE Donald Bell, Poultry Specialist (emeritus) University of California, Riverside, CA 92521 A RECAP OF EGG INDUSTRY STATISTICS - 2003 Poultry statistics are
Total Sheep and Lamb Inventory Down 5 Percent
 Washington, D.C. Sheep and Goats Released January 31, 2003, by the National Agricultural Statistics Service (NASS),, U.S. Department of Agriculture. For information on "" call Scott Hollis at 202-720-4751,
Brucellosis in Cervidae:
 r USDA UnltedStates -: Department of Agriculture Animal and Plant Health Inspection Service APHIS 91-45-16 Brucellosis in Cervidae: Uniform Methods and Rules, Effective September 30, 2003 The U.S. Department
Sheep and Goats Death Loss
 Washington, D.C. and Goats Death Loss Released May 6, 5, by the National Agricultural Statistics Service (NASS),, U.S. Department of Agriculture. For information on and Goats Death Loss call Scott Hollis
4-H Poultry: Unit 1. The Egg Flock For an egg-producing flock, select one of these birds: production-type Rhode Island Red Leghorn hybrids sex-link
 4-H Poultry: Unit 1 A small flock of chickens does not require much space or money, and if you manage your flock well, you can earn some money. You might start with a small flock of 25 50 chickens, or
United States Classes, Standards, and Grades for Rabbits AMS et seq.
 United States Department of Agriculture Marketing and Regulatory Programs Agricultural Marketing Service Poultry Programs United States Classes, Standards, and Grades for Rabbits AMS 70.300 et seq. Effective
POULTRY PRODUCTION TECHNICIAN: BROILER HATCHING EGG
 POULTRY PRODUCTION TECHNICIAN: BROILER HATCHING EGG COURSE OTH9930: POULTRY OPERATIONS AND CARE 33 Prerequisite: AGR3000: Agriculture Safety (Note: Students are required to complete the prerequisite course
Unit A: Introduction to Poultry Science. Lesson 1: Exploring the Poultry Industry
 Unit A: Introduction to Poultry Science Lesson 1: Exploring the Poultry Industry 1 Terms Broilers Chick Cockerels Drake Duckling Gander Goose Gosling Hen Layers Poult Poultry Pullet Producers Pullets Roosters
Don Bell s Table Egg Layer Flock Projections and Economic Commentary
 August 30, 2005 No. 53 Don Bell s Table Egg Layer Flock Projections and Economic Commentary - 2005 (This report was written by Don Bell, University of California Poultry Specialist, emeritus, under the
Sheep and Goats. January 1 Sheep and Lambs Inventory Down Slightly
 Sheep and Goats ISSN: 949-6 Released January 3, 208, by the National Agricultural Statistics Service (NASS), Agricultural Statistics Board, United States Department of Agriculture (USDA). January Sheep
Name: Unit: Address: Street or Route: City: State: Zip: Birth Date: Social Security #: Month/Day/Year. Years in 4-H: Years in Project:
 Poultry YEARLY PLAN and RECORD BOOK *18 U.S.C.707 Name: Unit: Address: Street or Route: City: State: Zip: Birth Date: Social Security #: Month/Day/Year Years in 4-H: Years in Project: Date Project Began:
MAIL ORDER HATCHERIES: OPERATIONAL AND DISTRIBUTION LOGISTICS, SALMONELLA INTERVENTION ACTIVITIES AIMED AT PREVENTION OF HUMAN SALMONELLOSIS
 MAIL ORDER HATCHERIES: OPERATIONAL AND DISTRIBUTION LOGISTICS, SALMONELLA INTERVENTION ACTIVITIES AIMED AT PREVENTION OF HUMAN SALMONELLOSIS DR. BRETT A HOPKINS MS, DVM, PH.D., DACPV BRETT.HOPKINS@YAHOO.COM
Unit D: Egg Production. Lesson 4: Producing Layers
 Unit D: Egg Production Lesson 4: Producing Layers 1 1 Terms broodiness caged layer production floor production layers 2 2 3 I. Layers are chickens that are used to produce large quantities of eggs. A.
FFA Poultry Career Development Event 2004 Poultry Judging District Contests
 FFA Poultry Career Development Event 2004 Poultry Judging District Contests 1. In a market broiler house, heaters should be turned on to preheat the house hours before the chicks arrival. A. 5-10 hours
RESPONSIBLE ANTIMICROBIAL USE
 RESPONSIBLE ANTIMICROBIAL USE IN THE CANADIAN CHICKEN AND TURKEY SECTORS VERSION 2.0 brought to you by: ANIMAL NUTRITION ASSOCIATION OF CANADA CANADIAN HATCHERY FEDERATION CANADIAN HATCHING EGG PRODUCERS
A Guide to Commercial Poultry Production in Florida 1
 A Guide to Commercial Poultry Production in Florida 1 Carrol Douglas 2 FACTORS IN PLANNING A POULTRY OPERATION Independent or Contract Production (1) Independent egg producers have the total responsibility
Poultry Project Record Book
 Poultry Project Record Book Name: Address: 4-H Club: 4-H Leader: 4-H Age (as of 1/1): Years in 4-H Poultry Project: MSU is an affirmative-action, equal-opportunity employer. Michigan State University Extension
Regional Seminar for OIE National Focal Points for Animal Production Food Safety. Belgrade, Serbia, October
 Regional Seminar for OIE National Focal Points for Animal Production Food Safety Belgrade, Serbia, 15-17 October Salmonellosis in poultry : preventing General overview Principles of the control and eradication
FFA Poultry Career Development Event 2004 NEO Aggie Day. 1. With regard to egg storage, which of the following statements is FALSE?
 FFA Poultry Career Development Event 2004 NEO Aggie Day 1. With regard to egg storage, which of the following statements is FALSE? A. The longer the egg storage time, the higher the egg storage temperature
Recommended Resources: The following resources may be useful in teaching
 Unit D: Egg Production Lesson 1: Producing Layers Student Learning Objectives: Instruction in this lesson should result in students achieving the following objectives: 1. Discuss the materials and equipment
9/27/2007 March/April 2007 US Egg Statistics 1
 9/27/2007 March/April 2007 US Egg Statistics 1 8/30/07 UEPMEMO# 65 Don Bell s Table Egg Layer Flock Projections and Economic Commentary - 2007 (This report was written by Don Bell, University of California
SCHOOL PROJECT GUIDELINES
 SCHOOL PROJECT GUIDELINES The ACMF Hatching Careers School Project is available for schools as an educational resource and to promote career opportunities in the chicken meat industry to primary and secondary
Unit C: Field Records. Lesson 3: Poultry Production and Record Keeping
 Unit C: Field Records Lesson 3: Poultry Production and Record Keeping Student Learning Objectives: Instruction in this lesson should result in students achieving the following objectives: 1. Understand
Custom Software Solution
 Custom Software Solution KHADIJA TECHNOLOGY Web Designing & Development is our passion. Using the latest and up to date web development and design technologies, we deliver the best to you. We provide web
HAND BOOK OF POULTRY FARMING AND FEED FORMULATIONS
 HAND BOOK OF POULTRY FARMING AND FEED FORMULATIONS WHY POULTY FARMING? GENERAL ANATOMY OF POULTRY Feathers of fowl The Skin Skeletal System of Fowl Muscular System The respiratory system of fowl The digestive
COURSES Overview
 KWAZULU NATAL POULTRY INSTITUTE NPC Poultry Management Training Centre COURSES 2015 Overview These informative courses are all held at the KwaZulu-Natal Poultry Institute, Bisley, Pietermaritzburg. They
Fair time is just around the corner. Here are some reminders as you prepare for the 2018 Iowa State Fair.
 July, 2018 Dear State Fair 4- H Meat Goat Exhibitor: Fair time is just around the corner. Here are some reminders as you prepare for the 2018 Iowa State Fair. BE SURE TO READ YOUR 2018 STATE FAIR 4- H
UNITED STATES DEPARTMENT OF AGRICULTURE FOOD SAFETY AND INSPECTION SERVICE WASHINGTON, DC
 UNITED STATES DEPARTMENT OF AGRICULTURE FOOD SAFETY AND INSPECTION SERVICE WASHINGTON, DC FSIS NOTICE 76-07 11/16/07 IMPORTATION OF CANADIAN CATTLE, BISON, SHEEP, AND GOATS INTO THE UNITED STATES I. PURPOSE
Feeding the Commercial Egg-Type Replacement Pullet 1
 PS48 Feeding the Commercial Egg-Type Replacement Pullet 1 Richard D. Miles and Jacqueline P. Jacob 2 TODAY'S PULLET Advances in genetic selection make today's pullets quite different from those of only
4-H Laying Flock. Signature _ Date. _ Signature Date. Signature Date. Submit Project Books to County Agent
 4-H Laying Flock Project Book By signing I am stating that I have completed as much of the work in this project book myself as possible to the best of my the information included in it is Signature _ Date
Purpose and focus of the module: Poultry Definition Domestication Classification. Basic Anatomy & Physiology
 Module: Poultry Production Code: AP21 Purpose and focus of the module: It aims at providing students with adequate knowledge and skills in poultry husbandry techniques and farm management. Skill Objectives
Key facts for maximum broiler performance. Changing broiler requires a change of approach
 Key facts for maximum broiler performance Changing broiler requires a change of approach Good chick quality = UNIFORMITY everywhere in the supply chain Performance 1. Professional breeder house / management
Official Journal of the European Union. (Acts whose publication is obligatory)
") 12.12.2003 L 325/1 I (Acts whose publication is obligatory) REGULATION (EC) No 2160/2003 OF THE EUROPEAN PARLIAMT AND OF THE COUNCIL of 17 November 2003 on the control of salmonella and other specified
12.12.2003 L 325/1 I (Acts whose publication is obligatory) REGULATION (EC) No 2160/2003 OF THE EUROPEAN PARLIAMT AND OF THE COUNCIL of 17 November 2003 on the control of salmonella and other specified
Walid Alali Assistant Professor, Food Safety Epidemiology
 Poultry Production and Food Safety: An International Perspective Walid Alali Assistant Professor, Food Safety Epidemiology Overview Salmonellosis in humans Salmonella surveillance in poultry slaughter
The U.S. Poultry Industry -Production and Values
 UNIVERSITY OF CALIFORNIA NUMBER 278 JUNE 22, 2006 An EGG ECONOMICS UPDATE By Donald Bell, Poultry Specialist (emeritus) Cooperative Extension - Highlander Hall-C University of California, Riverside, CA
Food & Allied. Poultry Industry. Industry Profile Industry Structure Industry Performance Regulatory Structure Key Challenges
 Food & Allied Poultry Industry Industry Profile Industry Structure Industry Performance Regulatory Structure Key Challenges February 2018 Poultry Industry Industry Process Flow Edible Oil Maize Oilseed
Raising Pastured Poultry in Texas. Kevin Ellis NCAT Poultry Specialist
 Raising Pastured Poultry in Texas Kevin Ellis NCAT Poultry Specialist NCAT Poultry Specialist San Antonio, TX About Me Raising Poultry for 17 years IOIA Accredited Organic Livestock Inspector B.S. Poultry
EN SANCO/745/2008r6 EN EN
 SANCO/745/2008r6 COMMISSION OF THE EUROPEAN COMMUNITIES Brussels, C(2008) Commission staff working document GUIDANCE DOCUMT On the minimum requirements for Salmonella control programmes to be recognised
SHW 3003 Poultry Production
 SHW 3003 Poultry Production MALAYSIA - PER CAPITA CONSUMPTION 35.34 Kilograms of chicken meat 299 table eggs DAILY OUTPUT of the POULTRY INDUSTRY 1.2 Million chickens (10 % Exported) 20 Million table eggs
H and FFA Poultry Show Rules
 May 16, 2013 Dear 4-H/FFA Poultry Member: Project books will be due on Saturday, July 15 by 2:00pm at the 4-H Building. You will need to complete a 4-H Backyard Poultry Care Members Guide, an Activity
FFA Poultry Career Development Event 2000 Poultry Judging Contest Arkansas State FFA Judging Contest
 FFA Poultry Career Development Event 2000 Poultry Judging Contest Arkansas State FFA Judging Contest Contestant Name: Contestant ID: 1. The per capita egg consumption is: A. 100 eggs per year B. 234 eggs
CONTROL OF GOODSAND SERVICES ORDER (CONSTRUCTION AND OPERATION OF POULTRY PEDIGREE, GRANDPARENT AND BREEDING AND PULLET RAISING FARMS), ) {l)
, ) {l)") CONTROL OF GOODSAND SERVICES ORDER (CONSTRUCTION AND OPERATION OF POULTRY PEDIGREE, GRANDPARENT AND BREEDING AND PULLET RAISING FARMS), 5741-1981) {l) By virtue of the power invsted in me under SS 5, 15,
CONTROL OF GOODSAND SERVICES ORDER (CONSTRUCTION AND OPERATION OF POULTRY PEDIGREE, GRANDPARENT AND BREEDING AND PULLET RAISING FARMS), 5741-1981) {l) By virtue of the power invsted in me under SS 5, 15,
Production Basics How Do I Raise Poultry for Eggs?
 Production Basics How Do I Raise Poultry for Eggs? C H U C K S C H U S T E R U N I V E R S I T Y O F M A R Y L A N D E X T E N S I O N C E N T R A L M A R Y L A N D C F S @ U M D. E D U J E S S I E F L
PDRC Turns 50. Contents
 The Poultry Informed Professional is published with support from The Primary Breeders Veterinary Association by the Department of Population Health of The University of Georgia College of Veterinary Medicine.
Case Study: SAP Implementation in Poultry (Hatcheries) Industry
 Industry") Case Study: SAP Implementation in Poultry (Hatcheries) Industry Applies to: Live Stock industries that deal with the poultry breeding and feed manufacturing processes. Poultry segment is involved in the
Case Study: SAP Implementation in Poultry (Hatcheries) Industry Applies to: Live Stock industries that deal with the poultry breeding and feed manufacturing processes. Poultry segment is involved in the
POULTRY MANAGEMENT IN EAST AFRICA (GUIDELINES FOR REARING CHICKEN)
") ĖĿĖWA Knowledge to develop Africa! Producer: Dr. Sarah Maina Editing: Dr. M. Mwangi. Contact: info@elewa.org Website: www.elewa.org ELEWA Publications. Farming Resources. 2008. POULTRY MANAGEMENT IN EAST
ĖĿĖWA Knowledge to develop Africa! Producer: Dr. Sarah Maina Editing: Dr. M. Mwangi. Contact: info@elewa.org Website: www.elewa.org ELEWA Publications. Farming Resources. 2008. POULTRY MANAGEMENT IN EAST
AGRICULTURAL ALTERNATIVES
 AGRICULTURAL ALTERNATIVES agalternatives.aers.psu.edu Pheasant Production Pheasants, originally from Asia, are very popular game birds in the United States. They are gallinaceous birds, relatives of grouse,
28 th MAY 2018 WEST AFRICA TRAINING PROGRAM FOCUSES ON BUILDING POULTRY CAPACITY
 WEEKLY POULTRY NEWS 28 th MAY 2018 THE POULTRY ASSOCIATION OF ZAMBIA INTERNATIONAL NEWS WEST AFRICA TRAINING PROGRAM FOCUSES ON BUILDING POULTRY CAPACITY WASHINGTON, D.C., U.S. The U.S. Grains Council
POULTRY PROGRAM SERVICES
 POULTRY PROGRAM SERVICES Animal Health Director: Michael Cahill State Veterinarian: Dr. Lorraine O Connor 617-626-1795 Poultry Program Coordinator: Ed Hageman 617-626-1796 Inspectors: Alex MacDonald, Megan
Impact of Northern Fowl Mite on Broiler Breeder Flocks in North Carolina 1
 Impact of Northern Fowl Mite on Broiler Breeder Flocks in North Carolina 1 J.J. ARENDS, S. H. ROBERTSON, and C. S. PAYNE Department of Entomology, North Carolina State University, Raleigh, North Carolina
Official Journal of the European Union L 280/5
 24.10.2007 Official Journal of the European Union L 280/5 COMMISSION REGULATION (EC) No 1237/2007 of 23 October 2007 amending Regulation (EC) No 2160/2003 of the European Parliament and of the Council
Reasons: Why consider allowing backyard chickens in the urban and suburban areas of Saanich?
 Reasons: Why consider allowing backyard chickens in the urban and suburban areas of Saanich? Saanich is considering changes to the Animals Bylaw to allow chickens (hens, not roosters) to be kept on lots
This document is meant purely as a documentation tool and the institutions do not assume any liability for its contents
 2003R2160 EN 27.10.2007 003.001 1 This document is meant purely as a documentation tool and the institutions do not assume any liability for its contents B REGULATION (EC) No 2160/2003 OF THE EUROPEAN
The Report referred to in Article 9 of Directive 2003/ 99/ EC
 FINLAND The Report referred to in Article 9 of Directive 2003/ 99/ EC TRENDS AND SOURCES OF ZOONOSES AND ZOONOTIC AGENTS IN HUMANS, FOODSTUFFS, ANIMALS AND FEEDINGSTUFFS IN 2007 including information on
The Danish National Salmonella Control Programme for the Production of Table Eggs and Broilers. Short summary
 The Danish National Salmonella Control Programme for the Production of Table Eggs and Broilers Mie Nielsen Blom, Danish Meat Association Formateret: Skrifttype: Ikke Fed, Kursiv Short summary Status on
Fair time is just around the corner. Here are some reminders as you prepare for the 2018 Iowa State Fair.
 July, 2018 Dear 4- H Sheep Exhibitor: Fair time is just around the corner. Here are some reminders as you prepare for the 2018 Iowa State Fair. BE SURE TO READ YOUR 2018 STATE FAIR 4- H PREMIUM BOOK ONLINE
2018 Poultry Entry Form
 2018 Poultry Entry Form Department 10 Section A8B (4-H) Department 11 Section B8 (Youth) Mail to: Geoffrey Saver 2684 St. Rt 168 Hookstown, PA 15050 Attn: Poultry Exhibit POSTMARK DATE (office only) RECEIVED
CALIFORNIA EGG LAWS & REGULATIONS: BACKGROUND INFORMATION
 CALIFORNIA EGG LAWS & REGULATIONS: BACKGROUND INFORMATION On November 4, 2008, California voters passed Proposition 2, which changes the way many hens in egg production are housed today. California passed
H POULTRY PROJECT
 Douglas County 4-H POULTRY PROJECT Rules & Guidelines Project Objective: To give youth an opportunity to learn by doing through participating in feeding, caring, and managing their poultry project. IMPORTANT
Egg and Pullet Producer Registration Order*
 THE FARM PRODUCTS MARKETING ACT (C.C.S.M. c. F47) Egg and Pullet Producer Registration Order* Regulation 290/2014 Registered December 24, 2014 TABLE OF CONTENTS Section PART 1 REGISTRATION OF EGG PRODUCERS
Leg and Foot Disorders in Domestic Fowl
 Leg and Foot Disorders in Domestic Fowl Phillip J. Clauer, Poultry Extension Specialist, Animal and Poultry Sciences Leg and foot problems in domestic fowl can be a serious welfare problem, with consequences
Responsible Antimicrobial Use
 Responsible Antimicrobial Use and the Canadian Chicken Sector brought to you by: Animal Nutrition Association of Canada Canadian Hatchery Federation Canadian Hatching Egg Producers Canadian Poultry and
Golden Lay Farms Ltd, Golden Lay Farms KZN (Pty) Ltd, Golden Lay Foods (Pty) Ltd. Reasons
 Ltd, Golden Lay Foods (Pty) Ltd. Reasons") COMPETITION TRIBUNAL REPUBLIC OF SOUTH AFRICA Case no.: 60/LM/Aug04 In the large merger between: Pioneer Foods (Pty) Ltd and Golden Lay Farms Ltd, Golden Lay Farms KZN (Pty) Ltd, Golden Lay Foods (Pty)
COMPETITION TRIBUNAL REPUBLIC OF SOUTH AFRICA Case no.: 60/LM/Aug04 In the large merger between: Pioneer Foods (Pty) Ltd and Golden Lay Farms Ltd, Golden Lay Farms KZN (Pty) Ltd, Golden Lay Foods (Pty)
MAKING THE BREED DECISION
 Publication of Cobb-Vantress, Inc. ONE - 2003 MAKING THE BREED DECISION BY JERRY MOYE,VICE PRESIDENT,COBB-VANTRESS There are few decisions facing members of our industry as important as the selection of
Section 6. Embryonic Development and Hatchery Management Notes
 Section 6 Embryonic Development and Hatchery Management Notes Slide 2 A well run hatchery is critical for any integrated poultry company whether it be a primary breeder company or a commercial meat company.
Poultry Skillathon 2017
 Age Divisions: Junior (8-11) Intermediate (12-14) Senior (15-18) Exhibitors will participate in age-based Skillathons. This study guide includes all topics an exhibitor might be tested on. Youth will only
Recommended Resources: The following resources may be useful in teaching
 Unit C: Poultry Management Lesson 2: Feeding, Management and Equipment for Poultry Student Learning Objectives: Instruction in this lesson should result in students achieving the following objectives:
THE ECONOMIC IMPACT OF THE OSTRICH INDUSTRY IN INDIANA. Dept. of Agricultural Economics. Purdue University
 THE ECONOMIC IMPACT OF THE OSTRICH INDUSTRY IN INDIANA by David Broomhall Staff Paper #96-22 September 9, 1996 Dept. of Agricultural Economics Purdue University Purdue University is committed to the policy
/o'r- Brooding and Rearing
 4-H Club Poultry Record Book /o'r- Brooding and Rearing "To Make The Best Retter" Name of Club Member ----------------..---------- ---- - Address.. - Age Year Project ------------------------- - County
PROJECT FOR KEEPING LAYER Salient Features :- (i) The project report envisages reared each year.
 The project report envisages reared each year.") PROJECT FOR KEEPING 30000 LAYER Salient Features :- (i) The project report envisages reared each year. (ii) (iii) (iv) (v) (vi) 30000 commercial layer to be One brooding batch of 7500 chicks will be reared
PROJECT FOR KEEPING 30000 LAYER Salient Features :- (i) The project report envisages reared each year. (ii) (iii) (iv) (v) (vi) 30000 commercial layer to be One brooding batch of 7500 chicks will be reared
MANAGING AVIARY SYSTEMS TO ACHIEVE OPTIMAL RESULTS. TOPICS:
 MANAGING AVIARY SYSTEMS TO ACHIEVE OPTIMAL RESULTS. TOPICS: Housing system System design Minimiza2on of stress Ligh2ng Ven2la2on Feed run 2mes Feed placement Watering Water placement Perch Scratch material
ALDI US. Animal Welfare. Buying Policy Date: 05/
 ALDI US Animal Welfare Buying Policy Date: 05/2018 www.aldi.us Animal Welfare Policy Statement As a leading grocery retailer, ALDI US is committed to the well-being of the animals in our supply chain.
2015 Iowa State Poultry Judging CDE Written Exam Version A 1. What is the name of the portion of the digestive system that secretes hydrochloric acid
 1. What is the name of the portion of the digestive system that secretes hydrochloric acid and the enzyme pepsin? a. Rumen b. Gizzard c. Proventriculus d. Crop 2. In egg laying operations, production goals
Case 2:14-cv KJM-KJN Document 2-5 Filed 02/03/14 Page 1 of 6 EXHIBIT E
 Case 2:14-cv-00341-KJM-KJN Document 2-5 Filed 02/03/14 Page 1 of 6 EXHIBIT E Case 2:14-cv-00341-KJM-KJN Document 2-5 Filed 02/03/14 Page 2 of 6 1 EGG ECONOMICS UPDATE #338, Poultry Specialist (emeritus),
Raising Replacement Pullets for Small-scale Egg-production Enterprises
 ASC-232 University of Kentucky College of Agriculture, Food and Environment Cooperative Extension Service Raising Replacement Pullets for Small-scale Egg-production Enterprises Jacquie Jacob and Tony Pescatore,
2018 MN FFA Poultry CDE Exam
 2018 MN FFA Poultry CDE Exam Do not write on the exam. Mark the most correct answer on the exam section of your scantron. 1. The production goals of the table egg industry are to produce how many eggs
Appendix II (Concerning the Article 21): Biosecurity Standards 3. Chickens, ducks, quail, pheasant, ostriches, guinea fowl and turkeys
: Biosecurity Standards 3. Chickens, ducks, quail, pheasant, ostriches, guinea fowl and turkeys") Appendix II (Concerning the Article 21): Biosecurity Standards 3. Chickens, ducks, quail, pheasant, ostriches, guinea fowl and turkeys I. Gaining the latest information regarding livestock epidemic control
Appendix II (Concerning the Article 21): Biosecurity Standards 3. Chickens, ducks, quail, pheasant, ostriches, guinea fowl and turkeys I. Gaining the latest information regarding livestock epidemic control
AviagenBrief. Best Practice Management in the Absence of Antibiotics at the Hatchery. October Aviagen Veterinary Team.
 AviagenBrief October 2017 Best Practice Management in the Absence of Antibiotics at the Hatchery Aviagen Veterinary Team Introduction In light of increased antibiotic resistance, and as consumer pressure
ARS CSREES ERS NASS Policies and Procedures
 United States Department of Agriculture Research, Education, and Economics ARS CSREES ERS NASS Policies and Procedures Title: Humane Animal Care and Use Number: 635.1 Date: 8/29/90 Originating Office:
What do I need for Fair?
 Poultry Calendar January - February 2018 Thinking of taking a poultry project? Now is the time to start thinking about which one. One thing to remember, is this an animal you want to sell for market or
Industry Vision and Mission for Quality..3. Background and Executive Summary. 4-5
 Version 3.0 1 2 Industry Vision and Mission for Quality..3 Background and Executive Summary. 4-5 Industry Standards for Broiler Chick Quality: 1. Laying and Handling of Eggs 6 2. Incubation and Hatching
PIMA COUNTY 4-H/FFA DEPARTMENT M POULTRY
 PIMA COUNTY 4-H/FFA DEPARTMENT M POULTRY PROJECT COORDINATOR Jill Palmenberg 3905 N. Bear Canyon Rd. Tucson, AZ 85749 Cell: 520-241-5944 (text/call) E-mail: pimacountypoultry@gmail.com SUPERINTENDENT Irish
1 of 22 PA Dept. of Agriculture
 2019 PENNSYLVANIA DEPARTMENT OF AGRICULTURE ANIMAL HEALTH REQUIREMENTS AND RECOMMENDATIONS FOR ANIMALS FOR EXHIBITION, INCLUDING COMMERCIAL EXHIBITION This document provides the Pennsylvania Department
Judy Tholen JRS Country Acres Lake Mills, WI. January 17, 2013
 Judy Tholen JRS Country Acres Lake Mills, WI January 17, 2013 Brown Eggs Everything you want to know about the production of our cage free brown eggs. History Current Operations Obstacles Future 2004 Hobby
Poultry Skillathon Study Guide Turkey Edition
 Poultry Skillathon Study Guide Turkey Edition This study guide describes the stations that will be included in the Skillathons. Be sure to bring your Completed Project Record Books, as well as the Insert